Project
GSE49485: Hypoxia transcriptome sequencing of rat brain.
Navigation
Downloads
Results for Zbtb16
Z-value: 0.53
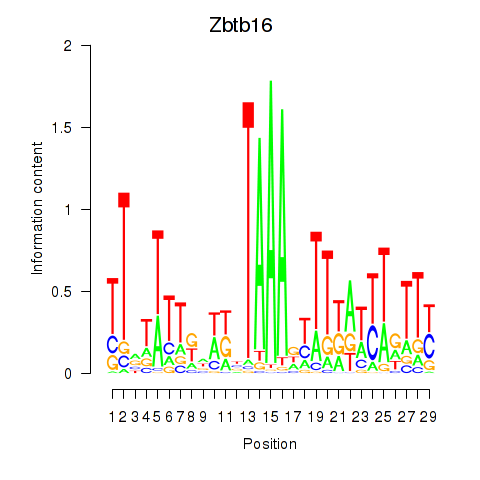
Motif logo
Transcription factors associated with Zbtb16
| Gene Symbol | Gene ID | Gene Info |
|---|---|---|
|
Zbtb16
|
ENSRNOG00000029980 | zinc finger and BTB domain containing 16 |
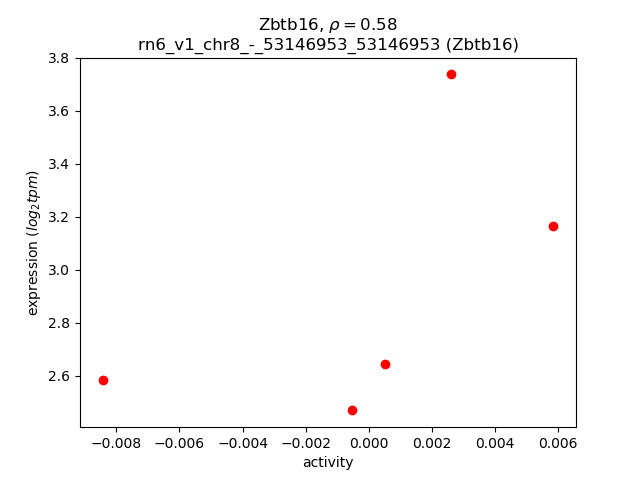
Activity-expression correlation:
| Gene | Promoter | Pearson corr. coef. | P-value | Plot |
|---|---|---|---|---|
| Zbtb16 | rn6_v1_chr8_-_53146953_53146953 | 0.58 | 3.1e-01 | Click! |
Activity profile of Zbtb16 motif
Sorted Z-values of Zbtb16 motif
| Promoter | Log-likelihood | Transcript | Gene | Gene Info |
|---|---|---|---|---|
| chr20_+_5456235 | 0.28 |
ENSRNOT00000092555
|
Pfdn6
|
prefoldin subunit 6 |
| chr2_+_266141581 | 0.27 |
ENSRNOT00000078187
ENSRNOT00000051951 |
Rpe65
|
RPE65, retinoid isomerohydrolase |
| chr12_+_22641104 | 0.26 |
ENSRNOT00000001916
|
Serpine1
|
serpin family E member 1 |
| chr8_+_116776494 | 0.26 |
ENSRNOT00000050702
|
Cdhr4
|
cadherin-related family member 4 |
| chr2_-_257474733 | 0.22 |
ENSRNOT00000016967
ENSRNOT00000066780 |
Nexn
|
nexilin (F actin binding protein) |
| chr3_-_10153554 | 0.17 |
ENSRNOT00000093246
|
Exosc2
|
exosome component 2 |
| chr17_+_43633675 | 0.17 |
ENSRNOT00000072119
|
LOC102549173
|
histone H3.2-like |
| chr1_-_89258935 | 0.16 |
ENSRNOT00000003180
|
LOC100361079
|
ribosomal protein L36-like |
| chrX_+_131617798 | 0.14 |
ENSRNOT00000074384
|
Prr32
|
proline rich 32 |
| chr7_+_29029263 | 0.12 |
ENSRNOT00000007088
|
Sycp3
|
synaptonemal complex protein 3 |
| chr3_-_8315910 | 0.12 |
ENSRNOT00000074482
|
LOC102546892
|
proline-rich protein HaeIII subfamily 1-like |
| chr10_+_88490798 | 0.11 |
ENSRNOT00000023872
|
Cnp
|
2',3'-cyclic nucleotide 3' phosphodiesterase |
| chr1_+_87224677 | 0.11 |
ENSRNOT00000028070
|
Ppp1r14a
|
protein phosphatase 1, regulatory (inhibitor) subunit 14A |
| chr11_+_64472072 | 0.11 |
ENSRNOT00000042756
|
RGD1563835
|
similar to ribosomal protein L27 |
| chr18_-_5314511 | 0.11 |
ENSRNOT00000022637
ENSRNOT00000079682 |
Zfp521
|
zinc finger protein 521 |
| chr8_+_70884491 | 0.11 |
ENSRNOT00000072939
|
Ubap1l
|
ubiquitin associated protein 1-like |
| chr3_+_21983841 | 0.11 |
ENSRNOT00000043621
|
RGD1561137
|
similar to 40S ribosomal protein S16 |
| chr8_-_23292682 | 0.10 |
ENSRNOT00000082252
|
LOC103690166
|
zinc finger protein OZF-like |
| chr8_+_117906014 | 0.10 |
ENSRNOT00000056180
|
Spink8
|
serine peptidase inhibitor, Kazal type 8 |
| chr1_-_167005839 | 0.09 |
ENSRNOT00000027261
|
Lrrc51
|
leucine rich repeat containing 51 |
| chr20_-_3440769 | 0.09 |
ENSRNOT00000084981
|
Ier3
|
immediate early response 3 |
| chr18_+_17550350 | 0.09 |
ENSRNOT00000078870
|
RGD1562608
|
similar to KIAA1328 protein |
| chr7_+_139685573 | 0.09 |
ENSRNOT00000088376
|
Pfkm
|
phosphofructokinase, muscle |
| chr10_-_97750679 | 0.08 |
ENSRNOT00000078059
|
Slc16a6
|
solute carrier family 16, member 6 |
| chr19_-_55389256 | 0.08 |
ENSRNOT00000064180
|
Aprt
|
adenine phosphoribosyl transferase |
| chr2_-_56151531 | 0.08 |
ENSRNOT00000040847
ENSRNOT00000080677 |
Osmr
|
oncostatin M receptor |
| chr14_-_82347679 | 0.08 |
ENSRNOT00000032972
|
Tacc3
|
transforming, acidic coiled-coil containing protein 3 |
| chr7_+_12535527 | 0.08 |
ENSRNOT00000093135
|
Polr2e
|
RNA polymerase II subunit E |
| chr1_+_101502987 | 0.08 |
ENSRNOT00000085005
|
Tulp2
|
tubby-like protein 2 |
| chr3_-_46726946 | 0.08 |
ENSRNOT00000011030
ENSRNOT00000086576 |
Itgb6
|
integrin subunit beta 6 |
| chr11_-_72109964 | 0.07 |
ENSRNOT00000058917
|
AABR07034445.1
|
|
| chr9_-_65951516 | 0.07 |
ENSRNOT00000038132
|
Mpp4
|
membrane palmitoylated protein 4 |
| chr16_+_71242470 | 0.07 |
ENSRNOT00000030489
|
Letm2
|
leucine zipper and EF-hand containing transmembrane protein 2 |
| chr3_-_111080705 | 0.07 |
ENSRNOT00000079339
|
Rhov
|
ras homolog family member V |
| chr2_+_225645568 | 0.07 |
ENSRNOT00000017878
|
Abca4
|
ATP binding cassette subfamily A member 4 |
| chrX_+_121612952 | 0.07 |
ENSRNOT00000022122
|
AABR07041179.1
|
|
| chr9_-_88534710 | 0.07 |
ENSRNOT00000020880
|
Tm4sf20
|
transmembrane 4 L six family member 20 |
| chr1_+_90729274 | 0.06 |
ENSRNOT00000047207
|
RGD1560088
|
similar to NADH:ubiquinone oxidoreductase B15 subunit |
| chr13_+_89597138 | 0.06 |
ENSRNOT00000004662
|
Apoa2
|
apolipoprotein A2 |
| chr1_-_91588609 | 0.06 |
ENSRNOT00000050931
|
Snrpg
|
small nuclear ribonucleoprotein polypeptide G |
| chr8_+_19888667 | 0.06 |
ENSRNOT00000078593
|
Zfp317
|
zinc finger protein 317 |
| chr18_+_24717336 | 0.06 |
ENSRNOT00000090923
|
Lims2
|
LIM zinc finger domain containing 2 |
| chr18_+_76317134 | 0.06 |
ENSRNOT00000074465
|
Mrps21l
|
mitochondrial ribosomal protein S21-like |
| chr5_+_28485619 | 0.06 |
ENSRNOT00000093341
ENSRNOT00000093129 |
LOC100912373
|
uncharacterized LOC100912373 |
| chr9_-_5329305 | 0.06 |
ENSRNOT00000078055
|
Slc5a7
|
solute carrier family 5 member 7 |
| chr1_+_81365138 | 0.05 |
ENSRNOT00000026793
|
Cadm4
|
cell adhesion molecule 4 |
| chr10_+_40208223 | 0.05 |
ENSRNOT00000000772
|
Hint1
|
histidine triad nucleotide binding protein 1 |
| chr14_+_104452917 | 0.05 |
ENSRNOT00000050489
|
LOC682793
|
similar to 60S ribosomal protein L38 |
| chrX_-_139329975 | 0.05 |
ENSRNOT00000086405
|
LOC103694517
|
high mobility group protein B4-like |
| chr10_+_15484795 | 0.05 |
ENSRNOT00000079826
|
Tmem8a
|
transmembrane protein 8A |
| chr14_-_88886198 | 0.05 |
ENSRNOT00000012661
|
Tns3
|
tensin 3 |
| chr3_+_112346627 | 0.05 |
ENSRNOT00000074392
|
Snap23
|
synaptosomal-associated protein 23 |
| chr7_+_34402738 | 0.05 |
ENSRNOT00000030985
|
Ccdc38
|
coiled-coil domain containing 38 |
| chr1_-_16203838 | 0.05 |
ENSRNOT00000018556
ENSRNOT00000078586 |
Pde7b
|
phosphodiesterase 7B |
| chr3_-_147490666 | 0.05 |
ENSRNOT00000046690
|
LOC108351482
|
40S ribosomal protein S29 |
| chr2_+_251805392 | 0.05 |
ENSRNOT00000019911
|
Bcl10
|
B-cell CLL/lymphoma 10 |
| chr18_-_72649915 | 0.05 |
ENSRNOT00000072205
|
AABR07032582.1
|
|
| chr13_+_79269973 | 0.05 |
ENSRNOT00000003969
|
Tnfsf4
|
tumor necrosis factor superfamily member 4 |
| chr7_+_78188912 | 0.05 |
ENSRNOT00000043079
|
Rims2
|
regulating synaptic membrane exocytosis 2 |
| chrX_+_74497262 | 0.05 |
ENSRNOT00000003899
|
Zcchc13
|
zinc finger CCHC-type containing 13 |
| chr2_+_23289374 | 0.05 |
ENSRNOT00000090666
ENSRNOT00000032783 |
Dmgdh
|
dimethylglycine dehydrogenase |
| chr8_+_106317124 | 0.05 |
ENSRNOT00000018411
|
Nmnat3
|
nicotinamide nucleotide adenylyltransferase 3 |
| chr18_-_29629087 | 0.05 |
ENSRNOT00000039291
|
Hars
|
histidyl-tRNA synthetase |
| chr11_+_33863500 | 0.05 |
ENSRNOT00000072384
|
LOC102556347
|
carbonyl reductase [NADPH] 1-like |
| chr2_-_33920837 | 0.04 |
ENSRNOT00000075196
|
Erbin
|
erbb2 interacting protein |
| chr1_-_114371897 | 0.04 |
ENSRNOT00000018028
|
Nipa2
|
non imprinted in Prader-Willi/Angelman syndrome 2 |
| chr6_+_95826546 | 0.04 |
ENSRNOT00000043587
|
AABR07064810.1
|
|
| chr20_-_3372070 | 0.04 |
ENSRNOT00000080770
|
Dhx16
|
DEAH-box helicase 16 |
| chr20_-_8183552 | 0.04 |
ENSRNOT00000074908
|
AABR07044495.1
|
|
| chr6_-_42312915 | 0.04 |
ENSRNOT00000033550
ENSRNOT00000081004 |
LOC690276
|
hypothetical protein LOC690276 |
| chr20_-_5455632 | 0.04 |
ENSRNOT00000000552
|
Wdr46
|
WD repeat domain 46 |
| chr7_+_126641952 | 0.04 |
ENSRNOT00000078928
|
Ppara
|
peroxisome proliferator activated receptor alpha |
| chr18_-_85980833 | 0.04 |
ENSRNOT00000058179
|
Socs6
|
suppressor of cytokine signaling 6 |
| chr12_-_47919400 | 0.04 |
ENSRNOT00000073774
|
Mvk
|
mevalonate kinase |
| chr9_-_88749664 | 0.04 |
ENSRNOT00000074236
|
LOC100361143
|
ribosomal protein L30-like |
| chr8_-_23482939 | 0.04 |
ENSRNOT00000065367
|
Rp9
|
retinitis pigmentosa 9 |
| chr20_-_1878126 | 0.04 |
ENSRNOT00000000995
|
Ubd
|
ubiquitin D |
| chr9_-_88748866 | 0.04 |
ENSRNOT00000071906
|
Rpl30l1
|
ribosomal protein L30-like 1 |
| chr5_-_60871705 | 0.04 |
ENSRNOT00000016582
|
Exosc3
|
exosome component 3 |
| chr19_-_22626653 | 0.04 |
ENSRNOT00000078348
|
Gpt2
|
glutamic--pyruvic transaminase 2 |
| chr5_+_172273459 | 0.04 |
ENSRNOT00000017957
|
Mmel1
|
membrane metallo-endopeptidase-like 1 |
| chr12_-_6879154 | 0.04 |
ENSRNOT00000001207
|
Alox5ap
|
arachidonate 5-lipoxygenase activating protein |
| chr13_-_45127815 | 0.04 |
ENSRNOT00000005127
|
Dars
|
aspartyl-tRNA synthetase |
| chr17_-_6892497 | 0.04 |
ENSRNOT00000026407
|
Idnk
|
Idnk, gluconokinase |
| chr9_-_15646846 | 0.04 |
ENSRNOT00000087971
|
Mrps10
|
mitochondrial ribosomal protein S10 |
| chr10_-_109979712 | 0.04 |
ENSRNOT00000086042
|
Dus1l
|
dihydrouridine synthase 1-like |
| chr1_+_229416489 | 0.04 |
ENSRNOT00000028617
|
Olr336
|
olfactory receptor 336 |
| chr2_+_236625357 | 0.04 |
ENSRNOT00000081248
|
Papss1
|
3'-phosphoadenosine 5'-phosphosulfate synthase 1 |
| chr20_-_54269525 | 0.04 |
ENSRNOT00000037559
|
Grik2
|
glutamate ionotropic receptor kainate type subunit 2 |
| chr12_-_47653638 | 0.03 |
ENSRNOT00000001577
|
Tchp
|
trichoplein, keratin filament binding |
| chr7_-_74938663 | 0.03 |
ENSRNOT00000014333
|
Fbxo43
|
F-box protein 43 |
| chr20_-_5020150 | 0.03 |
ENSRNOT00000001146
|
Sapcd1
|
suppressor APC domain containing 1 |
| chr18_+_28370085 | 0.03 |
ENSRNOT00000083993
|
Matr3
|
matrin 3 |
| chr10_-_11035484 | 0.03 |
ENSRNOT00000077164
|
Hmox2
|
heme oxygenase 2 |
| chr3_-_15376767 | 0.03 |
ENSRNOT00000044885
|
Ndufa8
|
NADH:ubiquinone oxidoreductase subunit A8 |
| chr1_+_257724842 | 0.03 |
ENSRNOT00000075515
|
AABR07006774.1
|
|
| chr7_+_120263054 | 0.03 |
ENSRNOT00000078383
|
Gcat
|
glycine C-acetyltransferase |
| chr9_+_17920677 | 0.03 |
ENSRNOT00000045763
|
Spats1
|
spermatogenesis associated, serine-rich 1 |
| chr1_-_90057923 | 0.03 |
ENSRNOT00000028674
|
Pdcd2l
|
programmed cell death 2-like |
| chr16_+_21275311 | 0.03 |
ENSRNOT00000027980
|
LOC100911483
|
NADH dehydrogenase [ubiquinone] 1 alpha subcomplex subunit 13-like |
| chr17_+_13519130 | 0.03 |
ENSRNOT00000076794
|
Sema4d
|
semaphorin 4D |
| chr5_+_154868534 | 0.03 |
ENSRNOT00000091442
|
Luzp1
|
leucine zipper protein 1 |
| chr17_-_53102342 | 0.03 |
ENSRNOT00000073834
|
Psma2
|
proteasome subunit alpha 2 |
| chr2_+_104020955 | 0.03 |
ENSRNOT00000045586
|
Mtfr1
|
mitochondrial fission regulator 1 |
| chr13_-_100450209 | 0.03 |
ENSRNOT00000090712
|
Lbr
|
lamin B receptor |
| chr3_-_4341771 | 0.03 |
ENSRNOT00000034694
|
LOC684988
|
similar to ribosomal protein S13 |
| chr1_+_78546012 | 0.03 |
ENSRNOT00000058172
|
Gng5
|
G protein subunit gamma 5 |
| chr10_+_66099531 | 0.03 |
ENSRNOT00000056192
|
Lyrm9
|
LYR motif containing 9 |
| chr1_-_70235091 | 0.03 |
ENSRNOT00000075745
|
Apeg3
|
antisense paternally expressed gene 3 |
| chr2_+_153830586 | 0.03 |
ENSRNOT00000042576
|
Mme
|
membrane metallo-endopeptidase |
| chrX_+_40286592 | 0.03 |
ENSRNOT00000087898
|
Mbtps2
|
membrane-bound transcription factor peptidase, site 2 |
| chr2_-_154418629 | 0.03 |
ENSRNOT00000076274
ENSRNOT00000076165 |
Plch1
|
phospholipase C, eta 1 |
| chr5_-_28349927 | 0.03 |
ENSRNOT00000008725
|
Otud6b
|
OTU domain containing 6B |
| chr2_-_90568486 | 0.03 |
ENSRNOT00000059380
|
LOC100910852
|
uncharacterized LOC100910852 |
| chr12_-_42492526 | 0.03 |
ENSRNOT00000084018
|
Tbx3
|
T-box 3 |
| chr10_+_83104622 | 0.03 |
ENSRNOT00000072972
|
AABR07030375.2
|
|
| chrX_+_23081125 | 0.03 |
ENSRNOT00000071639
|
AABR07037520.1
|
|
| chr3_-_72071895 | 0.03 |
ENSRNOT00000082857
|
Selenoh
|
selenoprotein H |
| chr7_+_116671948 | 0.03 |
ENSRNOT00000077773
ENSRNOT00000029711 |
Gli4
|
GLI family zinc finger 4 |
| chr17_-_48810991 | 0.03 |
ENSRNOT00000067636
|
Vps41
|
VPS41 HOPS complex subunit |
| chr10_-_70788309 | 0.03 |
ENSRNOT00000029184
|
Ccl9
|
chemokine (C-C motif) ligand 9 |
| chr3_-_64766472 | 0.03 |
ENSRNOT00000037684
|
Cwc22
|
CWC22 spliceosome associated protein homolog |
| chr1_+_228684136 | 0.03 |
ENSRNOT00000028608
|
Olr337
|
olfactory receptor 337 |
| chr9_-_15646381 | 0.03 |
ENSRNOT00000040204
|
Mrps10
|
mitochondrial ribosomal protein S10 |
| chr4_-_168382837 | 0.03 |
ENSRNOT00000029510
|
Mansc1
|
MANSC domain containing 1 |
| chr20_+_31234493 | 0.03 |
ENSRNOT00000000675
|
Npffr1
|
neuropeptide FF receptor 1 |
| chr6_-_146195819 | 0.03 |
ENSRNOT00000007625
|
Sp4
|
Sp4 transcription factor |
| chr8_+_69070994 | 0.03 |
ENSRNOT00000087622
|
Lctl
|
lactase-like |
| chr14_-_42520020 | 0.03 |
ENSRNOT00000065550
|
Slc30a9
|
solute carrier family 30 member 9 |
| chr17_-_90522091 | 0.03 |
ENSRNOT00000077767
|
Lyst
|
lysosomal trafficking regulator |
| chrX_+_28486869 | 0.03 |
ENSRNOT00000005620
|
Tlr7
|
toll-like receptor 7 |
| chr4_+_172119331 | 0.03 |
ENSRNOT00000010579
|
Mgst1
|
microsomal glutathione S-transferase 1 |
| chr13_+_78979321 | 0.03 |
ENSRNOT00000003857
|
Ankrd45
|
ankyrin repeat domain 45 |
| chr2_+_211450484 | 0.03 |
ENSRNOT00000051701
|
Clcc1
|
chloride channel CLIC-like 1 |
| chr11_+_7422272 | 0.02 |
ENSRNOT00000075964
|
Gbe1
|
1,4-alpha-glucan branching enzyme 1 |
| chr9_+_27034022 | 0.02 |
ENSRNOT00000029696
|
Paqr8
|
progestin and adipoQ receptor family member 8 |
| chr17_+_45247776 | 0.02 |
ENSRNOT00000081063
ENSRNOT00000080655 |
Zkscan3
|
zinc finger with KRAB and SCAN domains 3 |
| chr2_+_30347000 | 0.02 |
ENSRNOT00000024291
|
Serf1
|
small EDRK-rich factor 1 |
| chr16_+_69022792 | 0.02 |
ENSRNOT00000035985
|
Got1l1
|
glutamic-oxaloacetic transaminase 1-like 1 |
| chr16_-_41234095 | 0.02 |
ENSRNOT00000000120
|
Aga
|
aspartylglucosaminidase |
| chr2_-_54777729 | 0.02 |
ENSRNOT00000082548
|
C7
|
complement C7 |
| chr1_+_88582641 | 0.02 |
ENSRNOT00000028187
|
Zfp382
|
zinc finger protein 382 |
| chr7_+_121361415 | 0.02 |
ENSRNOT00000067904
|
Tab1
|
TGF-beta activated kinase 1/MAP3K7 binding protein 1 |
| chr9_-_79530821 | 0.02 |
ENSRNOT00000085619
|
Mreg
|
melanoregulin |
| chr12_-_13462038 | 0.02 |
ENSRNOT00000043110
|
LOC100360439
|
ribosomal protein L36-like |
| chr8_+_117576788 | 0.02 |
ENSRNOT00000027584
|
Ip6k2
|
inositol hexakisphosphate kinase 2 |
| chr3_+_147772165 | 0.02 |
ENSRNOT00000008713
|
Tbc1d20
|
TBC1 domain family, member 20 |
| chr5_+_135354700 | 0.02 |
ENSRNOT00000021850
|
Ipp
|
intracisternal A particle-promoted polypeptide |
| chr16_+_74534130 | 0.02 |
ENSRNOT00000050637
|
Slc25a15
|
solute carrier family 25 member 15 |
| chr8_+_127789048 | 0.02 |
ENSRNOT00000052275
|
Dlec1
|
deleted in lung and esophageal cancer 1 |
| chr9_-_16848503 | 0.02 |
ENSRNOT00000024815
|
Dnph1
|
2'-deoxynucleoside 5'-phosphate N-hydrolase 1 |
| chr2_-_18565842 | 0.02 |
ENSRNOT00000067456
ENSRNOT00000063821 ENSRNOT00000045532 |
Vcan
|
versican |
| chr7_+_71065197 | 0.02 |
ENSRNOT00000051075
|
Rdh16
|
retinol dehydrogenase 16 (all-trans) |
| chr15_+_28287024 | 0.02 |
ENSRNOT00000064907
|
Mettl17
|
methyltransferase like 17 |
| chr11_-_60547201 | 0.02 |
ENSRNOT00000093151
|
Btla
|
B and T lymphocyte associated |
| chr3_-_172566010 | 0.02 |
ENSRNOT00000071913
|
Atp5e
|
ATP synthase, H+ transporting, mitochondrial F1 complex, epsilon subunit |
| chr20_+_5455974 | 0.02 |
ENSRNOT00000000553
ENSRNOT00000092676 |
Pfdn6
|
prefoldin subunit 6 |
| chr10_-_105628091 | 0.02 |
ENSRNOT00000016067
|
Cygb
|
cytoglobin |
| chr7_-_116955148 | 0.02 |
ENSRNOT00000087328
|
Pycrl
|
pyrroline-5-carboxylate reductase-like |
| chr5_+_144281614 | 0.02 |
ENSRNOT00000014383
|
Trappc3
|
trafficking protein particle complex 3 |
| chr12_-_11808977 | 0.02 |
ENSRNOT00000071795
|
AABR07035375.1
|
|
| chr8_-_13906355 | 0.02 |
ENSRNOT00000029634
|
Cep295
|
centrosomal protein 295 |
| chr2_-_23289266 | 0.02 |
ENSRNOT00000061708
|
Bhmt2
|
betaine-homocysteine S-methyltransferase 2 |
| chr3_-_82757204 | 0.02 |
ENSRNOT00000012214
|
Accs
|
1-aminocyclopropane-1-carboxylate synthase homolog |
| chr1_-_78110786 | 0.02 |
ENSRNOT00000089718
|
Dhx34
|
DExH-box helicase 34 |
| chr20_+_1944801 | 0.02 |
ENSRNOT00000075060
|
Olr1750
|
olfactory receptor 1750 |
| chr18_-_76714374 | 0.02 |
ENSRNOT00000080478
ENSRNOT00000090319 |
Rbfa
|
ribosome binding factor A |
| chr4_-_165522418 | 0.02 |
ENSRNOT00000064420
|
Magohb
|
mago homolog B, exon junction complex core component |
| chr15_-_65507968 | 0.02 |
ENSRNOT00000046240
|
Calm2
|
calmodulin 2 |
| chr5_-_12199283 | 0.02 |
ENSRNOT00000007769
|
Pcmtd1
|
protein-L-isoaspartate (D-aspartate) O-methyltransferase domain containing 1 |
| chr3_+_156886454 | 0.02 |
ENSRNOT00000022403
|
Lpin3
|
lipin 3 |
| chr3_-_112614503 | 0.02 |
ENSRNOT00000071591
|
LOC100911313
|
regulator of microtubule dynamics protein 3-like |
| chr8_+_85503224 | 0.02 |
ENSRNOT00000012348
|
Gsta4
|
glutathione S-transferase alpha 4 |
| chr2_-_235161263 | 0.02 |
ENSRNOT00000080235
|
LOC103691699
|
uncharacterized LOC103691699 |
| chr20_-_34684418 | 0.02 |
ENSRNOT00000087220
|
Cep85l
|
centrosomal protein 85-like |
| chr3_+_123209608 | 0.02 |
ENSRNOT00000028838
|
Itpa
|
inosine triphosphatase |
| chr18_+_30831365 | 0.02 |
ENSRNOT00000067185
|
Pcdhga4
|
protocadherin gamma subfamily A, 4 |
| chr12_-_40686249 | 0.02 |
ENSRNOT00000042264
|
LOC100909911
|
40S ribosomal protein S20-like |
| chr17_-_15478343 | 0.02 |
ENSRNOT00000078029
|
Omd
|
osteomodulin |
| chr4_+_145559206 | 0.02 |
ENSRNOT00000013600
|
Brk1
|
BRICK1, SCAR/WAVE actin-nucleating complex subunit |
| chr15_-_27726646 | 0.02 |
ENSRNOT00000082139
|
Ccnb1ip1
|
cyclin B1 interacting protein 1 |
| chrX_-_105417323 | 0.02 |
ENSRNOT00000015494
|
Gla
|
galactosidase, alpha |
| chr10_+_16259728 | 0.02 |
ENSRNOT00000028115
|
Bod1
|
biorientation of chromosomes in cell division 1 |
| chr1_+_225068009 | 0.02 |
ENSRNOT00000026651
|
Ubxn1
|
UBX domain protein 1 |
| chr6_+_122254841 | 0.01 |
ENSRNOT00000005055
|
Gpr65
|
G-protein coupled receptor 65 |
| chr3_-_37854561 | 0.01 |
ENSRNOT00000076095
|
Neb
|
nebulin |
| chr2_-_116374584 | 0.01 |
ENSRNOT00000058919
|
Lrriq4
|
leucine-rich repeats and IQ motif containing 4 |
| chr1_+_68436917 | 0.01 |
ENSRNOT00000088586
|
LOC108348118
|
leucyl-cystinyl aminopeptidase |
| chr13_-_51373399 | 0.01 |
ENSRNOT00000060656
|
Mgat4e
|
MGAT4 family, member E |
| chr5_-_14367898 | 0.01 |
ENSRNOT00000065402
|
Atp6v1h
|
ATPase H+ transporting V1 subunit H |
| chr1_+_11963836 | 0.01 |
ENSRNOT00000074325
|
AABR07000398.1
|
|
| chr4_-_164015365 | 0.01 |
ENSRNOT00000078121
|
Ly49si2
|
immunoreceptor Ly49si2 |
| chr14_+_1355004 | 0.01 |
ENSRNOT00000043131
|
AABR07014114.1
|
|
| chr10_-_94652658 | 0.01 |
ENSRNOT00000017371
|
Ern1
|
endoplasmic reticulum to nucleus signaling 1 |
| chr14_-_85951891 | 0.01 |
ENSRNOT00000016207
ENSRNOT00000080848 |
Mrps24
|
mitochondrial ribosomal protein S24 |
| chr9_+_51302151 | 0.01 |
ENSRNOT00000085908
|
Gulp1
|
GULP, engulfment adaptor PTB domain containing 1 |
| chr8_-_119326938 | 0.01 |
ENSRNOT00000044467
|
Ccrl2
|
C-C motif chemokine receptor like 2 |
| chr20_+_27212724 | 0.01 |
ENSRNOT00000032600
|
Hnrnph3
|
heterogeneous nuclear ribonucleoprotein H3 |
| chr17_-_35126393 | 0.01 |
ENSRNOT00000080609
|
LOC103694079
|
vacuolar ATPase assembly integral membrane protein Vma21-like |
| chr9_-_70449796 | 0.01 |
ENSRNOT00000086391
|
Mdh1b
|
malate dehydrogenase 1B |
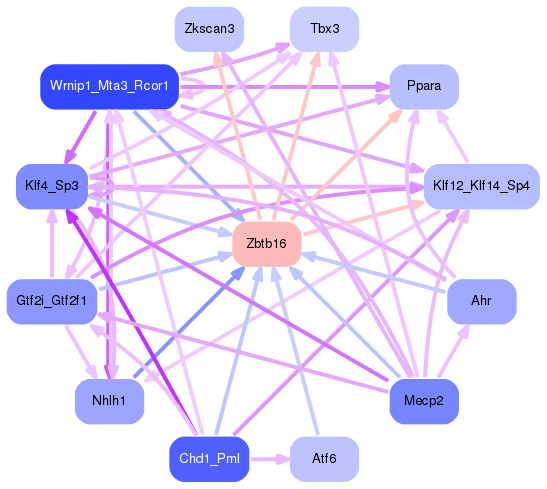
Network of associatons between targets according to the STRING database.

First level regulatory network of Zbtb16
Gene Ontology Analysis
Gene overrepresentation in biological process category:
| Log-likelihood per target | Total log-likelihood | Term | Description |
|---|---|---|---|
| 0.1 | 0.3 | GO:0007468 | regulation of rhodopsin gene expression(GO:0007468) |
| 0.1 | 0.3 | GO:2000097 | regulation of smooth muscle cell-matrix adhesion(GO:2000097) |
| 0.1 | 0.2 | GO:0071038 | nuclear mRNA surveillance of mRNA 3'-end processing(GO:0071031) nuclear polyadenylation-dependent tRNA catabolic process(GO:0071038) nuclear retention of pre-mRNA with aberrant 3'-ends at the site of transcription(GO:0071049) |
| 0.0 | 0.1 | GO:0007066 | female meiosis sister chromatid cohesion(GO:0007066) |
| 0.0 | 0.1 | GO:0044209 | AMP salvage(GO:0044209) |
| 0.0 | 0.1 | GO:0006649 | phospholipid transfer to membrane(GO:0006649) |
| 0.0 | 0.1 | GO:0061622 | glycolytic process through glucose-1-phosphate(GO:0061622) |
| 0.0 | 0.1 | GO:0046340 | negative regulation of very-low-density lipoprotein particle remodeling(GO:0010903) diacylglycerol catabolic process(GO:0046340) |
| 0.0 | 0.1 | GO:0038165 | oncostatin-M-mediated signaling pathway(GO:0038165) |
| 0.0 | 0.2 | GO:0048739 | cardiac muscle fiber development(GO:0048739) |
| 0.0 | 0.0 | GO:2000567 | defense response to nematode(GO:0002215) memory T cell activation(GO:0035709) positive regulation of memory T cell differentiation(GO:0043382) regulation of memory T cell activation(GO:2000567) positive regulation of memory T cell activation(GO:2000568) |
| 0.0 | 0.3 | GO:0051131 | chaperone-mediated protein complex assembly(GO:0051131) |
| 0.0 | 0.0 | GO:0006579 | amino-acid betaine catabolic process(GO:0006579) |
| 0.0 | 0.0 | GO:0019355 | nicotinamide nucleotide biosynthetic process from aspartate(GO:0019355) 'de novo' NAD biosynthetic process from aspartate(GO:0034628) |
| 0.0 | 0.1 | GO:0038044 | transforming growth factor-beta secretion(GO:0038044) |
| 0.0 | 0.0 | GO:0070433 | negative regulation of nucleotide-binding oligomerization domain containing signaling pathway(GO:0070425) negative regulation of nucleotide-binding oligomerization domain containing 2 signaling pathway(GO:0070433) |
| 0.0 | 0.0 | GO:0019287 | isopentenyl diphosphate biosynthetic process, mevalonate pathway(GO:0019287) |
| 0.0 | 0.1 | GO:0097500 | receptor localization to nonmotile primary cilium(GO:0097500) |
| 0.0 | 0.0 | GO:0002540 | leukotriene production involved in inflammatory response(GO:0002540) |
| 0.0 | 0.0 | GO:0006788 | heme oxidation(GO:0006788) |
| 0.0 | 0.1 | GO:0008292 | acetylcholine biosynthetic process(GO:0008292) acetate ester biosynthetic process(GO:1900620) |
| 0.0 | 0.0 | GO:0006567 | threonine catabolic process(GO:0006567) |
| 0.0 | 0.1 | GO:0045416 | positive regulation of interleukin-8 biosynthetic process(GO:0045416) |
| 0.0 | 0.0 | GO:1900220 | semaphorin-plexin signaling pathway involved in bone trabecula morphogenesis(GO:1900220) |
| 0.0 | 0.0 | GO:0072369 | regulation of lipid transport by positive regulation of transcription from RNA polymerase II promoter(GO:0072369) |
| 0.0 | 0.0 | GO:0036500 | ATF6-mediated unfolded protein response(GO:0036500) |
Gene overrepresentation in cellular component category:
| Log-likelihood per target | Total log-likelihood | Term | Description |
|---|---|---|---|
| 0.0 | 0.1 | GO:0000802 | transverse filament(GO:0000802) |
| 0.0 | 0.3 | GO:0016272 | prefoldin complex(GO:0016272) |
| 0.0 | 0.1 | GO:0005945 | 6-phosphofructokinase complex(GO:0005945) |
| 0.0 | 0.3 | GO:0042583 | chromaffin granule(GO:0042583) |
| 0.0 | 0.2 | GO:0000176 | nuclear exosome (RNase complex)(GO:0000176) |
| 0.0 | 0.1 | GO:0035749 | myelin sheath adaxonal region(GO:0035749) |
| 0.0 | 0.1 | GO:0000813 | ESCRT I complex(GO:0000813) |
| 0.0 | 0.1 | GO:0034366 | spherical high-density lipoprotein particle(GO:0034366) |
| 0.0 | 0.0 | GO:0031680 | G-protein beta/gamma-subunit complex(GO:0031680) |
| 0.0 | 0.1 | GO:0046696 | lipopolysaccharide receptor complex(GO:0046696) |
Gene overrepresentation in molecular function category:
| Log-likelihood per target | Total log-likelihood | Term | Description |
|---|---|---|---|
| 0.0 | 0.3 | GO:1901611 | phosphatidylglycerol binding(GO:1901611) cardiolipin binding(GO:1901612) |
| 0.0 | 0.1 | GO:0002060 | purine nucleobase binding(GO:0002060) |
| 0.0 | 0.1 | GO:0004924 | oncostatin-M receptor activity(GO:0004924) |
| 0.0 | 0.1 | GO:0003872 | 6-phosphofructokinase activity(GO:0003872) |
| 0.0 | 0.1 | GO:0070653 | high-density lipoprotein particle receptor binding(GO:0070653) |
| 0.0 | 0.0 | GO:0004515 | nicotinamide-nucleotide adenylyltransferase activity(GO:0000309) nicotinate-nucleotide adenylyltransferase activity(GO:0004515) |
| 0.0 | 0.1 | GO:0090555 | phosphatidylethanolamine-translocating ATPase activity(GO:0090555) |
| 0.0 | 0.0 | GO:0047635 | L-alanine:2-oxoglutarate aminotransferase activity(GO:0004021) alanine-oxo-acid transaminase activity(GO:0047635) |
| 0.0 | 0.0 | GO:0004051 | arachidonate 5-lipoxygenase activity(GO:0004051) leukotriene-C4 synthase activity(GO:0004464) |
| 0.0 | 0.0 | GO:0004781 | adenylylsulfate kinase activity(GO:0004020) sulfate adenylyltransferase activity(GO:0004779) sulfate adenylyltransferase (ATP) activity(GO:0004781) |
| 0.0 | 0.0 | GO:0004392 | heme oxygenase (decyclizing) activity(GO:0004392) |
| 0.0 | 0.1 | GO:0015220 | choline transmembrane transporter activity(GO:0015220) |
| 0.0 | 0.0 | GO:0016453 | C-acetyltransferase activity(GO:0016453) |
| 0.0 | 0.0 | GO:0050429 | calcium-dependent phospholipase C activity(GO:0050429) |
Gene overrepresentation in curated gene sets: canonical pathways category:
| Log-likelihood per target | Total log-likelihood | Term | Description |
|---|---|---|---|
| 0.0 | 0.3 | PID RHODOPSIN PATHWAY | Visual signal transduction: Rods |
Gene overrepresentation in curated gene sets: REACTOME pathways category:
| Log-likelihood per target | Total log-likelihood | Term | Description |
|---|---|---|---|
| 0.0 | 0.2 | REACTOME MRNA DECAY BY 3 TO 5 EXORIBONUCLEASE | Genes involved in mRNA Decay by 3' to 5' Exoribonuclease |
| 0.0 | 0.3 | REACTOME PREFOLDIN MEDIATED TRANSFER OF SUBSTRATE TO CCT TRIC | Genes involved in Prefoldin mediated transfer of substrate to CCT/TriC |