Project
GSE49485: Hypoxia transcriptome sequencing of rat brain.
Navigation
Downloads
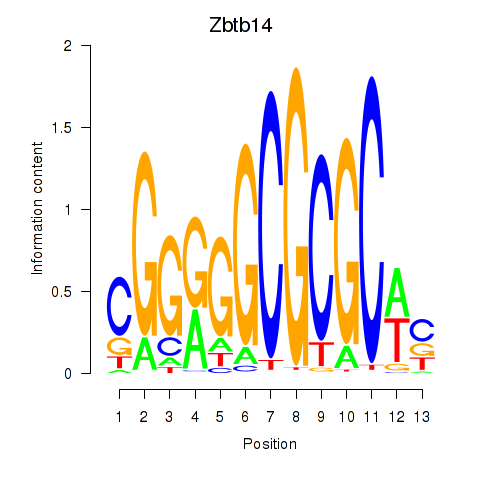
Results for Zbtb14
Z-value: 0.61
Motif logo
Transcription factors associated with Zbtb14
| Gene Symbol | Gene ID | Gene Info |
|---|
Activity-expression correlation:
| Gene | Promoter | Pearson corr. coef. | P-value | Plot |
|---|---|---|---|---|
| Zfp161 | rn6_v1_chr9_+_117737611_117737611 | 0.87 | 5.3e-02 | Click! |
Activity profile of Zbtb14 motif
Sorted Z-values of Zbtb14 motif
| Promoter | Log-likelihood | Transcript | Gene | Gene Info |
|---|---|---|---|---|
| chr9_+_70133969 | 0.43 |
ENSRNOT00000040525
|
Adam23
|
ADAM metallopeptidase domain 23 |
| chr1_+_266953139 | 0.40 |
ENSRNOT00000054696
|
Neurl1
|
neuralized E3 ubiquitin protein ligase 1 |
| chr7_+_70364813 | 0.40 |
ENSRNOT00000084012
ENSRNOT00000031230 |
Agap2
|
ArfGAP with GTPase domain, ankyrin repeat and PH domain 2 |
| chr3_+_6211789 | 0.36 |
ENSRNOT00000012892
|
Rxra
|
retinoid X receptor alpha |
| chr14_+_87312203 | 0.35 |
ENSRNOT00000088032
|
Adcy1
|
adenylate cyclase 1 |
| chr5_-_172623899 | 0.34 |
ENSRNOT00000080591
|
Ski
|
SKI proto-oncogene |
| chr10_-_88754829 | 0.34 |
ENSRNOT00000026354
|
Stat5b
|
signal transducer and activator of transcription 5B |
| chr2_-_140618405 | 0.32 |
ENSRNOT00000017736
|
Setd7
|
SET domain containing (lysine methyltransferase) 7 |
| chr8_-_6203515 | 0.29 |
ENSRNOT00000087278
ENSRNOT00000031189 ENSRNOT00000008074 ENSRNOT00000085285 ENSRNOT00000007866 |
Yap1
|
yes-associated protein 1 |
| chr10_-_85517683 | 0.29 |
ENSRNOT00000016070
|
Srcin1
|
SRC kinase signaling inhibitor 1 |
| chr10_-_74679858 | 0.28 |
ENSRNOT00000003859
|
Ppm1e
|
protein phosphatase, Mg2+/Mn2+ dependent, 1E |
| chr18_+_30954609 | 0.27 |
ENSRNOT00000086893
|
Pcdhgc3
|
protocadherin gamma subfamily C, 3 |
| chr1_-_220644636 | 0.26 |
ENSRNOT00000027632
|
Pacs1
|
phosphofurin acidic cluster sorting protein 1 |
| chr2_-_115891097 | 0.25 |
ENSRNOT00000013191
|
Skil
|
SKI-like proto-oncogene |
| chr12_-_51341663 | 0.24 |
ENSRNOT00000066892
ENSRNOT00000052202 |
Pitpnb
|
phosphatidylinositol transfer protein, beta |
| chr8_+_119566509 | 0.24 |
ENSRNOT00000028633
|
Trank1
|
tetratricopeptide repeat and ankyrin repeat containing 1 |
| chr8_+_116154736 | 0.24 |
ENSRNOT00000021218
|
Cacna2d2
|
calcium voltage-gated channel auxiliary subunit alpha2delta 2 |
| chr17_-_23923792 | 0.23 |
ENSRNOT00000018739
|
Gfod1
|
glucose-fructose oxidoreductase domain containing 1 |
| chr10_+_71278650 | 0.23 |
ENSRNOT00000092020
|
Synrg
|
synergin, gamma |
| chr10_-_85684138 | 0.23 |
ENSRNOT00000017989
|
Pip4k2b
|
phosphatidylinositol-5-phosphate 4-kinase type 2 beta |
| chr1_+_173607101 | 0.22 |
ENSRNOT00000074636
|
Tub
|
tubby bipartite transcription factor |
| chr3_-_176958880 | 0.22 |
ENSRNOT00000078661
|
Zbtb46
|
zinc finger and BTB domain containing 46 |
| chr4_-_145147397 | 0.22 |
ENSRNOT00000010347
|
Lhfpl4
|
lipoma HMGIC fusion partner-like 4 |
| chr4_-_115157263 | 0.21 |
ENSRNOT00000015296
|
Tet3
|
tet methylcytosine dioxygenase 3 |
| chr8_-_47393503 | 0.21 |
ENSRNOT00000059868
|
Arhgef12
|
Rho guanine nucleotide exchange factor 12 |
| chr4_-_123713319 | 0.21 |
ENSRNOT00000012875
ENSRNOT00000086982 |
Slc6a6
|
solute carrier family 6 member 6 |
| chr4_-_177331874 | 0.21 |
ENSRNOT00000065387
ENSRNOT00000091099 |
C2cd5
|
C2 calcium-dependent domain containing 5 |
| chr10_-_82399484 | 0.21 |
ENSRNOT00000082972
ENSRNOT00000055582 |
Xylt2
|
xylosyltransferase 2 |
| chrX_+_71199491 | 0.21 |
ENSRNOT00000076168
ENSRNOT00000005077 ENSRNOT00000005102 |
Nlgn3
|
neuroligin 3 |
| chr6_+_144156175 | 0.21 |
ENSRNOT00000006582
|
Esyt2
|
extended synaptotagmin 2 |
| chr3_-_109044420 | 0.20 |
ENSRNOT00000007687
|
Rasgrp1
|
RAS guanyl releasing protein 1 |
| chr10_+_103737162 | 0.20 |
ENSRNOT00000055037
|
Tmem104
|
transmembrane protein 104 |
| chr4_-_100303047 | 0.20 |
ENSRNOT00000018170
ENSRNOT00000084782 |
Mat2a
|
methionine adenosyltransferase 2A |
| chr6_-_28464118 | 0.20 |
ENSRNOT00000068214
|
Efr3b
|
EFR3 homolog B |
| chr7_+_130532435 | 0.19 |
ENSRNOT00000092672
ENSRNOT00000092535 |
Shank3
|
SH3 and multiple ankyrin repeat domains 3 |
| chr14_-_78902063 | 0.19 |
ENSRNOT00000088469
|
Ppp2r2c
|
protein phosphatase 2, regulatory subunit B, gamma |
| chr2_-_252691886 | 0.19 |
ENSRNOT00000068739
|
Prkacb
|
protein kinase cAMP-activated catalytic subunit beta |
| chr16_-_81945127 | 0.19 |
ENSRNOT00000023352
|
Mcf2l
|
MCF.2 cell line derived transforming sequence-like |
| chr3_+_177013604 | 0.19 |
ENSRNOT00000020581
|
Dnajc5
|
DnaJ heat shock protein family (Hsp40) member C5 |
| chr3_-_164095878 | 0.18 |
ENSRNOT00000079414
|
B4galt5
|
beta-1,4-galactosyltransferase 5 |
| chr17_-_55709740 | 0.18 |
ENSRNOT00000033359
|
RGD1562037
|
similar to OTTHUMP00000046255 |
| chr5_-_60559533 | 0.18 |
ENSRNOT00000092899
|
Zbtb5
|
zinc finger and BTB domain containing 5 |
| chr7_-_70552897 | 0.18 |
ENSRNOT00000080594
|
Kif5a
|
kinesin family member 5A |
| chr7_-_93826665 | 0.18 |
ENSRNOT00000011344
|
Tnfrsf11b
|
TNF receptor superfamily member 11B |
| chr18_-_63357194 | 0.18 |
ENSRNOT00000089408
ENSRNOT00000066103 |
Spire1
|
spire-type actin nucleation factor 1 |
| chr20_-_30749940 | 0.17 |
ENSRNOT00000065127
|
Sgpl1
|
sphingosine-1-phosphate lyase 1 |
| chr3_+_8192575 | 0.17 |
ENSRNOT00000060977
|
Rapgef1
|
Rap guanine nucleotide exchange factor 1 |
| chr4_+_120671489 | 0.17 |
ENSRNOT00000029125
|
Mgll
|
monoglyceride lipase |
| chr12_+_21721837 | 0.17 |
ENSRNOT00000073353
|
Mepce
|
methylphosphate capping enzyme |
| chr2_+_205783252 | 0.17 |
ENSRNOT00000025633
ENSRNOT00000025600 |
Trim33
|
tripartite motif-containing 33 |
| chr10_+_14547172 | 0.17 |
ENSRNOT00000092043
|
Unkl
|
unkempt family like zinc finger |
| chr3_+_71114100 | 0.17 |
ENSRNOT00000088549
ENSRNOT00000006961 |
Itgav
|
integrin subunit alpha V |
| chr8_-_61079526 | 0.17 |
ENSRNOT00000068658
|
Peak1
|
pseudopodium-enriched atypical kinase 1 |
| chr2_+_195996521 | 0.16 |
ENSRNOT00000082849
|
Pogz
|
pogo transposable element with ZNF domain |
| chr9_+_82393672 | 0.16 |
ENSRNOT00000032419
|
Ankzf1
|
ankyrin repeat and zinc finger domain containing 1 |
| chr8_+_117486083 | 0.16 |
ENSRNOT00000027552
ENSRNOT00000088705 |
Prkar2a
|
protein kinase cAMP-dependent type 2 regulatory subunit alpha |
| chr15_-_45927804 | 0.16 |
ENSRNOT00000086271
|
Ints6
|
integrator complex subunit 6 |
| chr9_+_20765296 | 0.16 |
ENSRNOT00000016291
|
Cd2ap
|
CD2-associated protein |
| chr9_+_53906073 | 0.16 |
ENSRNOT00000017813
|
Nab1
|
Ngfi-A binding protein 1 |
| chr6_-_122545899 | 0.16 |
ENSRNOT00000005175
|
Kcnk10
|
potassium two pore domain channel subfamily K member 10 |
| chr10_-_64642292 | 0.16 |
ENSRNOT00000084670
|
Abr
|
active BCR-related |
| chr1_-_124038966 | 0.16 |
ENSRNOT00000082487
|
Chrna7
|
cholinergic receptor nicotinic alpha 7 subunit |
| chr8_+_111600532 | 0.15 |
ENSRNOT00000081952
|
Rab6b
|
RAB6B, member RAS oncogene family |
| chr3_+_134413170 | 0.15 |
ENSRNOT00000074338
|
AABR07054000.1
|
|
| chr4_-_182844291 | 0.15 |
ENSRNOT00000064320
|
Tmtc1
|
transmembrane and tetratricopeptide repeat containing 1 |
| chr6_-_122897997 | 0.15 |
ENSRNOT00000057601
|
Eml5
|
echinoderm microtubule associated protein like 5 |
| chr10_+_74436208 | 0.15 |
ENSRNOT00000090921
ENSRNOT00000091163 |
Trim37
|
tripartite motif-containing 37 |
| chr9_-_119818310 | 0.14 |
ENSRNOT00000019359
|
Smchd1
|
structural maintenance of chromosomes flexible hinge domain containing 1 |
| chr8_-_62248013 | 0.14 |
ENSRNOT00000080012
ENSRNOT00000089602 |
Scamp5
|
secretory carrier membrane protein 5 |
| chr1_+_221673590 | 0.14 |
ENSRNOT00000038016
|
Cdc42bpg
|
CDC42 binding protein kinase gamma |
| chr8_+_36625733 | 0.14 |
ENSRNOT00000016248
|
Cdon
|
cell adhesion associated, oncogene regulated |
| chr4_+_2505909 | 0.14 |
ENSRNOT00000092756
|
Ube3c
|
ubiquitin protein ligase E3C |
| chr7_+_25919867 | 0.14 |
ENSRNOT00000009625
ENSRNOT00000090153 |
Ric8b
|
RIC8 guanine nucleotide exchange factor B |
| chr14_+_83510278 | 0.14 |
ENSRNOT00000081161
|
Patz1
|
POZ (BTB) and AT hook containing zinc finger 1 |
| chr7_-_47586137 | 0.14 |
ENSRNOT00000006086
|
Tmtc2
|
transmembrane and tetratricopeptide repeat containing 2 |
| chr3_+_149935731 | 0.14 |
ENSRNOT00000021907
|
Cbfa2t2
|
CBFA2/RUNX1 translocation partner 2 |
| chr8_+_62482140 | 0.14 |
ENSRNOT00000026492
|
Edc3
|
enhancer of mRNA decapping 3 |
| chr11_-_65759581 | 0.14 |
ENSRNOT00000034334
|
Lrrc58
|
leucine rich repeat containing 58 |
| chr14_-_85088523 | 0.14 |
ENSRNOT00000010690
|
Nf2
|
neurofibromin 2 |
| chr4_+_49941304 | 0.14 |
ENSRNOT00000008719
|
Ptprz1
|
protein tyrosine phosphatase, receptor type Z1 |
| chr3_-_153893847 | 0.14 |
ENSRNOT00000085938
|
LOC100911769
|
band 4.1-like protein 1-like |
| chr9_-_41337498 | 0.13 |
ENSRNOT00000039480
|
Fam168b
|
family with sequence similarity 168, member B |
| chr17_-_54070231 | 0.13 |
ENSRNOT00000085150
|
B3galnt2
|
beta-1,3-N-acetylgalactosaminyltransferase 2 |
| chr3_+_175408629 | 0.13 |
ENSRNOT00000081344
|
Lsm14b
|
LSM family member 14B |
| chr19_-_37245217 | 0.13 |
ENSRNOT00000020927
|
MGC116202
|
hypothetical protein LOC688735 |
| chr3_-_38277440 | 0.13 |
ENSRNOT00000037857
|
Stam2
|
signal transducing adaptor molecule 2 |
| chr20_-_19825150 | 0.13 |
ENSRNOT00000032159
|
Ccdc6
|
coiled-coil domain containing 6 |
| chr5_+_74649765 | 0.13 |
ENSRNOT00000075952
|
Palm2
|
paralemmin 2 |
| chr5_-_60559329 | 0.13 |
ENSRNOT00000017046
|
Zbtb5
|
zinc finger and BTB domain containing 5 |
| chr9_-_28973246 | 0.13 |
ENSRNOT00000091865
ENSRNOT00000015453 |
Rims1
|
regulating synaptic membrane exocytosis 1 |
| chr14_+_81819799 | 0.13 |
ENSRNOT00000076840
|
Mxd4
|
Max dimerization protein 4 |
| chr5_-_73552798 | 0.13 |
ENSRNOT00000022836
|
Ikbkap
|
inhibitor of kappa light polypeptide gene enhancer in B-cells, kinase complex-associated protein |
| chr15_-_93667116 | 0.13 |
ENSRNOT00000093184
|
Fbxl3
|
F-box and leucine-rich repeat protein 3 |
| chr9_-_28972835 | 0.13 |
ENSRNOT00000086967
ENSRNOT00000079684 |
Rims1
|
regulating synaptic membrane exocytosis 1 |
| chr15_+_108908607 | 0.13 |
ENSRNOT00000089455
|
Zic2
|
Zic family member 2 |
| chr7_-_126465723 | 0.13 |
ENSRNOT00000021196
|
Wnt7b
|
wingless-type MMTV integration site family, member 7B |
| chr1_-_164977633 | 0.13 |
ENSRNOT00000029629
|
Rnf169
|
ring finger protein 169 |
| chr19_+_37179814 | 0.13 |
ENSRNOT00000085891
ENSRNOT00000020003 |
RGD621098
|
similar to RIKEN cDNA D230025D16Rik |
| chr20_+_4572100 | 0.13 |
ENSRNOT00000000476
|
Zbtb12
|
zinc finger and BTB domain containing 12 |
| chr1_+_233382708 | 0.12 |
ENSRNOT00000019174
|
Gnaq
|
G protein subunit alpha q |
| chr20_+_13940877 | 0.12 |
ENSRNOT00000093587
|
Cabin1
|
calcineurin binding protein 1 |
| chr1_+_5366379 | 0.12 |
ENSRNOT00000019918
|
Fbxo30
|
F-box protein 30 |
| chr4_-_180887050 | 0.12 |
ENSRNOT00000065730
|
Ints13
|
integrator complex subunit 13 |
| chr16_-_6404957 | 0.12 |
ENSRNOT00000048459
|
Cacna1d
|
calcium voltage-gated channel subunit alpha1 D |
| chr1_-_128341240 | 0.12 |
ENSRNOT00000070864
ENSRNOT00000072915 |
Mef2a
|
myocyte enhancer factor 2a |
| chr3_-_123376455 | 0.12 |
ENSRNOT00000028842
|
RGD1565616
|
RGD1565616 |
| chr3_+_55094637 | 0.12 |
ENSRNOT00000058763
|
Cers6
|
ceramide synthase 6 |
| chr7_-_63728988 | 0.12 |
ENSRNOT00000009645
|
Xpot
|
exportin for tRNA |
| chr1_+_15620653 | 0.12 |
ENSRNOT00000017401
|
Map7
|
microtubule-associated protein 7 |
| chr7_-_118396728 | 0.12 |
ENSRNOT00000066431
|
Rbfox2
|
RNA binding protein, fox-1 homolog 2 |
| chr4_-_99305812 | 0.12 |
ENSRNOT00000038912
|
Rmnd5a
|
required for meiotic nuclear division 5 homolog A |
| chr5_-_144556889 | 0.12 |
ENSRNOT00000035373
|
Ago4
|
argonaute 4, RISC catalytic component |
| chr5_+_114940053 | 0.12 |
ENSRNOT00000012396
|
Hook1
|
hook microtubule-tethering protein 1 |
| chr18_-_57245666 | 0.12 |
ENSRNOT00000080365
|
Ablim3
|
actin binding LIM protein family, member 3 |
| chr8_+_16287804 | 0.12 |
ENSRNOT00000024691
|
Vkorc1l1
|
vitamin K epoxide reductase complex, subunit 1-like 1 |
| chr16_+_59564419 | 0.12 |
ENSRNOT00000083434
|
Lonrf1
|
LON peptidase N-terminal domain and ring finger 1 |
| chr14_+_17064353 | 0.11 |
ENSRNOT00000003052
|
Scarb2
|
scavenger receptor class B, member 2 |
| chr2_+_30664639 | 0.11 |
ENSRNOT00000076372
ENSRNOT00000076294 ENSRNOT00000076434 ENSRNOT00000076484 |
Taf9
|
TATA-box binding protein associated factor 9 |
| chr13_-_70783515 | 0.11 |
ENSRNOT00000003605
|
Lamc1
|
laminin subunit gamma 1 |
| chr3_+_159305345 | 0.11 |
ENSRNOT00000008427
|
Srsf6
|
serine and arginine rich splicing factor 6 |
| chr5_-_154965027 | 0.11 |
ENSRNOT00000080881
ENSRNOT00000055992 |
Kdm1a
|
lysine demethylase 1A |
| chr8_-_96266342 | 0.11 |
ENSRNOT00000078891
|
Syncrip
|
synaptotagmin binding, cytoplasmic RNA interacting protein |
| chr10_+_45659143 | 0.11 |
ENSRNOT00000058327
|
Wnt9a
|
wingless-type MMTV integration site family, member 9A |
| chr3_-_80003032 | 0.11 |
ENSRNOT00000017360
|
Madd
|
MAP-kinase activating death domain |
| chr10_-_61744976 | 0.11 |
ENSRNOT00000079926
ENSRNOT00000092314 ENSRNOT00000034298 |
Sgsm2
|
small G protein signaling modulator 2 |
| chr16_-_49003246 | 0.11 |
ENSRNOT00000089501
|
Acsl1
|
acyl-CoA synthetase long-chain family member 1 |
| chr1_+_167374182 | 0.11 |
ENSRNOT00000092882
|
Stim1
|
stromal interaction molecule 1 |
| chr10_+_74436534 | 0.11 |
ENSRNOT00000008298
|
Trim37
|
tripartite motif-containing 37 |
| chr9_+_38297322 | 0.11 |
ENSRNOT00000078157
ENSRNOT00000088824 |
Bend6
|
BEN domain containing 6 |
| chr14_+_19866408 | 0.11 |
ENSRNOT00000060465
|
Adamts3
|
ADAM metallopeptidase with thrombospondin type 1, motif 3 |
| chr4_-_65962539 | 0.11 |
ENSRNOT00000040391
|
RGD1306271
|
similar to KIAA1549 protein |
| chr10_-_63952726 | 0.11 |
ENSRNOT00000090461
|
Doc2b
|
double C2 domain beta |
| chrX_-_54303729 | 0.11 |
ENSRNOT00000087919
ENSRNOT00000064340 ENSRNOT00000051249 ENSRNOT00000087547 |
Gk
|
glycerol kinase |
| chr11_+_86903122 | 0.11 |
ENSRNOT00000048063
|
Zdhhc8
|
zinc finger, DHHC-type containing 8 |
| chr13_+_51384562 | 0.10 |
ENSRNOT00000077928
|
Kdm5b
|
lysine demethylase 5B |
| chr10_-_13619935 | 0.10 |
ENSRNOT00000064392
|
Ccnf
|
cyclin F |
| chr15_+_51756978 | 0.10 |
ENSRNOT00000024067
|
Egr3
|
early growth response 3 |
| chr9_+_10216205 | 0.10 |
ENSRNOT00000084312
ENSRNOT00000073025 |
Rfx2
|
regulatory factor X2 |
| chr1_+_82174451 | 0.10 |
ENSRNOT00000027783
|
Tmem145
|
transmembrane protein 145 |
| chr2_+_56426367 | 0.10 |
ENSRNOT00000016036
|
Lifr
|
leukemia inhibitory factor receptor alpha |
| chr2_-_24923128 | 0.10 |
ENSRNOT00000044087
|
Pde8b
|
phosphodiesterase 8B |
| chr19_-_52206310 | 0.10 |
ENSRNOT00000087886
|
Mbtps1
|
membrane-bound transcription factor peptidase, site 1 |
| chr1_+_263186235 | 0.10 |
ENSRNOT00000021876
|
Cnnm1
|
cyclin and CBS domain divalent metal cation transport mediator 1 |
| chr1_+_261337594 | 0.10 |
ENSRNOT00000019874
|
Pi4k2a
|
phosphatidylinositol 4-kinase type 2 alpha |
| chr1_-_220067123 | 0.10 |
ENSRNOT00000071020
ENSRNOT00000072373 |
Rbm14
|
RNA binding motif protein 14 |
| chr20_+_4993560 | 0.10 |
ENSRNOT00000081628
ENSRNOT00000087861 ENSRNOT00000001160 |
Vars
|
valyl-tRNA synthetase |
| chr13_+_103396314 | 0.10 |
ENSRNOT00000049499
|
Slc30a10
|
solute carrier family 30, member 10 |
| chr1_-_124039196 | 0.10 |
ENSRNOT00000051883
|
Chrna7
|
cholinergic receptor nicotinic alpha 7 subunit |
| chr4_+_174605476 | 0.10 |
ENSRNOT00000042291
|
Plekha5
|
pleckstrin homology domain containing A5 |
| chr7_+_12144162 | 0.10 |
ENSRNOT00000077122
|
Tcf3
|
transcription factor 3 |
| chr2_+_8732932 | 0.10 |
ENSRNOT00000072849
|
Arrdc3
|
arrestin domain containing 3 |
| chr8_+_122003916 | 0.10 |
ENSRNOT00000091980
|
Clasp2
|
cytoplasmic linker associated protein 2 |
| chr8_-_116965396 | 0.10 |
ENSRNOT00000042528
|
Bsn
|
bassoon (presynaptic cytomatrix protein) |
| chr5_+_169213115 | 0.10 |
ENSRNOT00000013535
|
Nol9
|
nucleolar protein 9 |
| chr17_+_13670520 | 0.10 |
ENSRNOT00000019442
|
Shc3
|
SHC adaptor protein 3 |
| chr3_+_58632476 | 0.10 |
ENSRNOT00000010630
|
Rapgef4
|
Rap guanine nucleotide exchange factor 4 |
| chr18_-_65768781 | 0.10 |
ENSRNOT00000016189
|
Poli
|
DNA polymerase iota |
| chr5_-_62683964 | 0.10 |
ENSRNOT00000060005
|
Anks6
|
ankyrin repeat and sterile alpha motif domain containing 6 |
| chr1_-_265573117 | 0.10 |
ENSRNOT00000044195
ENSRNOT00000055915 |
LOC100911951
|
Kv channel-interacting protein 2-like |
| chr7_-_12673659 | 0.10 |
ENSRNOT00000091650
ENSRNOT00000041277 ENSRNOT00000044865 |
Ptbp1
|
polypyrimidine tract binding protein 1 |
| chr10_-_48129377 | 0.09 |
ENSRNOT00000003792
|
Ulk2
|
unc-51 like autophagy activating kinase 2 |
| chr5_+_28850950 | 0.09 |
ENSRNOT00000009759
|
Tmem64
|
transmembrane protein 64 |
| chr2_-_84608712 | 0.09 |
ENSRNOT00000028561
|
March6
|
membrane associated ring-CH-type finger 6 |
| chr10_-_105368242 | 0.09 |
ENSRNOT00000075293
ENSRNOT00000072230 |
Rnf157
|
ring finger protein 157 |
| chr11_-_24641820 | 0.09 |
ENSRNOT00000044081
ENSRNOT00000048854 |
App
|
amyloid beta precursor protein |
| chrX_-_114232939 | 0.09 |
ENSRNOT00000042639
|
Ammecr1
|
Alport syndrome, mental retardation, midface hypoplasia and elliptocytosis chromosomal region gene 1 |
| chr7_-_11003785 | 0.09 |
ENSRNOT00000061279
|
Tle2
|
transducin-like enhancer of split 2 |
| chr8_-_48564722 | 0.09 |
ENSRNOT00000067902
|
Cbl
|
Cbl proto-oncogene |
| chr18_+_24397369 | 0.09 |
ENSRNOT00000022761
|
Sap130
|
Sin3A associated protein 130 |
| chr1_-_204817080 | 0.09 |
ENSRNOT00000077956
|
Fam53b
|
family with sequence similarity 53, member B |
| chr5_-_28737719 | 0.09 |
ENSRNOT00000009718
|
Necab1
|
N-terminal EF-hand calcium binding protein 1 |
| chrX_+_39711201 | 0.09 |
ENSRNOT00000080512
ENSRNOT00000009802 |
Cnksr2
|
connector enhancer of kinase suppressor of Ras 2 |
| chr20_-_34929965 | 0.09 |
ENSRNOT00000004499
|
Mcm9
|
minichromosome maintenance 9 homologous recombination repair factor |
| chr10_-_18443934 | 0.09 |
ENSRNOT00000059895
ENSRNOT00000080021 |
Ranbp17
|
RAN binding protein 17 |
| chr10_+_73279119 | 0.09 |
ENSRNOT00000004698
|
Tbx2
|
T-box 2 |
| chr2_-_33841499 | 0.09 |
ENSRNOT00000040533
|
Srek1
|
splicing regulatory glutamic acid and lysine rich protein 1 |
| chr10_+_67325347 | 0.09 |
ENSRNOT00000079002
ENSRNOT00000085914 |
Suz12
|
suppressor of zeste 12 homolog (Drosophila) |
| chr10_-_47857326 | 0.09 |
ENSRNOT00000085703
ENSRNOT00000091963 |
Epn2
|
epsin 2 |
| chr8_-_64572850 | 0.08 |
ENSRNOT00000015415
|
Senp8
|
SUMO/sentrin peptidase family member, NEDD8 specific |
| chr17_-_90756048 | 0.08 |
ENSRNOT00000085669
|
Ero1b
|
endoplasmic reticulum oxidoreductase 1 beta |
| chr10_-_86890257 | 0.08 |
ENSRNOT00000084275
|
Gjd3
|
gap junction protein, delta 3 |
| chrX_-_156379189 | 0.08 |
ENSRNOT00000083148
|
Plxna3
|
plexin A3 |
| chr6_+_110624856 | 0.08 |
ENSRNOT00000014017
|
Vash1
|
vasohibin 1 |
| chr7_+_126939925 | 0.08 |
ENSRNOT00000022746
|
Gramd4
|
GRAM domain containing 4 |
| chr5_+_135735825 | 0.08 |
ENSRNOT00000068267
|
Zswim5
|
zinc finger, SWIM-type containing 5 |
| chr1_+_88581206 | 0.08 |
ENSRNOT00000087931
|
Zfp382
|
zinc finger protein 382 |
| chr18_+_1970914 | 0.08 |
ENSRNOT00000018025
|
Mib1
|
mindbomb E3 ubiquitin protein ligase 1 |
| chr3_+_177351518 | 0.08 |
ENSRNOT00000023989
|
Pcmtd2
|
protein-L-isoaspartate (D-aspartate) O-methyltransferase domain containing 2 |
| chr9_-_61134963 | 0.08 |
ENSRNOT00000017967
|
Pgap1
|
post-GPI attachment to proteins 1 |
| chr1_-_156296161 | 0.08 |
ENSRNOT00000025653
|
Crebzf
|
CREB/ATF bZIP transcription factor |
| chr7_+_73588163 | 0.08 |
ENSRNOT00000015707
|
Kcns2
|
potassium voltage-gated channel, modifier subfamily S, member 2 |
| chr10_+_43744882 | 0.08 |
ENSRNOT00000078662
|
Zfp692
|
zinc finger protein 692 |
| chr13_+_69797880 | 0.08 |
ENSRNOT00000030109
|
Colgalt2
|
collagen beta(1-O)galactosyltransferase 2 |
| chr13_-_109629482 | 0.08 |
ENSRNOT00000072452
|
Flvcr1
|
feline leukemia virus subgroup C cellular receptor 1 |
| chr4_+_13405136 | 0.08 |
ENSRNOT00000091004
|
Gnai1
|
G protein subunit alpha i1 |
| chr1_+_266952561 | 0.08 |
ENSRNOT00000076452
|
Neurl1
|
neuralized E3 ubiquitin protein ligase 1 |
| chr12_-_24537313 | 0.08 |
ENSRNOT00000001975
|
Baz1b
|
bromodomain adjacent to zinc finger domain, 1B |
| chr1_-_101046208 | 0.08 |
ENSRNOT00000091711
|
Prr12
|
proline rich 12 |
| chr3_-_176791960 | 0.08 |
ENSRNOT00000018237
|
Gmeb2
|
glucocorticoid modulatory element binding protein 2 |
| chr1_+_100297152 | 0.08 |
ENSRNOT00000026100
|
Shank1
|
SH3 and multiple ankyrin repeat domains 1 |
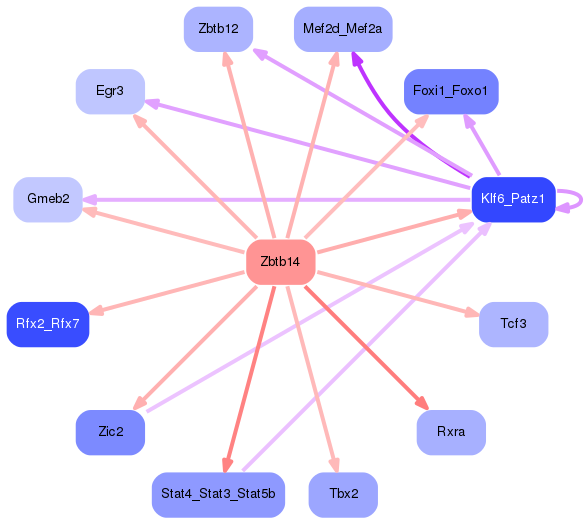
Network of associatons between targets according to the STRING database.

First level regulatory network of Zbtb14
Gene Ontology Analysis
Gene overrepresentation in biological process category:
| Log-likelihood per target | Total log-likelihood | Term | Description |
|---|---|---|---|
| 0.1 | 0.3 | GO:0031632 | positive regulation of synaptic vesicle fusion to presynaptic membrane(GO:0031632) |
| 0.1 | 0.3 | GO:0001982 | baroreceptor response to decreased systemic arterial blood pressure(GO:0001982) |
| 0.1 | 0.3 | GO:0046544 | development of secondary male sexual characteristics(GO:0046544) |
| 0.1 | 0.2 | GO:0044725 | chromatin reprogramming in the zygote(GO:0044725) |
| 0.1 | 0.3 | GO:0010626 | negative regulation of Schwann cell proliferation(GO:0010626) |
| 0.1 | 0.3 | GO:0036353 | histone H2A-K119 monoubiquitination(GO:0036353) |
| 0.1 | 0.2 | GO:2000124 | regulation of endocannabinoid signaling pathway(GO:2000124) |
| 0.1 | 0.2 | GO:0098971 | anterograde dendritic transport of neurotransmitter receptor complex(GO:0098971) |
| 0.1 | 0.2 | GO:0042489 | negative regulation of odontogenesis of dentin-containing tooth(GO:0042489) |
| 0.1 | 0.2 | GO:0070649 | formin-nucleated actin cable assembly(GO:0070649) |
| 0.1 | 0.3 | GO:0097338 | response to clozapine(GO:0097338) |
| 0.1 | 0.2 | GO:2001199 | negative regulation of dendritic cell differentiation(GO:2001199) |
| 0.1 | 0.2 | GO:0043314 | negative regulation of neutrophil degranulation(GO:0043314) |
| 0.1 | 0.2 | GO:0030210 | heparin biosynthetic process(GO:0030210) |
| 0.0 | 0.4 | GO:2000969 | positive regulation of alpha-amino-3-hydroxy-5-methyl-4-isoxazole propionate selective glutamate receptor activity(GO:2000969) |
| 0.0 | 0.1 | GO:0060821 | inactivation of X chromosome by DNA methylation(GO:0060821) |
| 0.0 | 0.3 | GO:0060528 | secretory columnal luminar epithelial cell differentiation involved in prostate glandular acinus development(GO:0060528) |
| 0.0 | 0.1 | GO:1900147 | Schwann cell migration(GO:0036135) regulation of Schwann cell migration(GO:1900147) |
| 0.0 | 0.2 | GO:0090625 | mRNA cleavage involved in gene silencing by siRNA(GO:0090625) |
| 0.0 | 0.1 | GO:0000294 | nuclear-transcribed mRNA catabolic process, endonucleolytic cleavage-dependent decay(GO:0000294) |
| 0.0 | 0.1 | GO:0072054 | renal outer medulla development(GO:0072054) |
| 0.0 | 0.5 | GO:0033601 | positive regulation of mammary gland epithelial cell proliferation(GO:0033601) |
| 0.0 | 0.2 | GO:0045715 | negative regulation of low-density lipoprotein particle receptor biosynthetic process(GO:0045715) |
| 0.0 | 0.1 | GO:0055005 | ventricular cardiac myofibril assembly(GO:0055005) |
| 0.0 | 0.1 | GO:0071431 | tRNA export from nucleus(GO:0006409) tRNA-containing ribonucleoprotein complex export from nucleus(GO:0071431) |
| 0.0 | 0.2 | GO:0032911 | negative regulation of transforming growth factor beta1 production(GO:0032911) |
| 0.0 | 0.2 | GO:0006556 | S-adenosylmethionine biosynthetic process(GO:0006556) |
| 0.0 | 0.1 | GO:0050893 | sensory processing(GO:0050893) |
| 0.0 | 0.1 | GO:0010725 | regulation of primitive erythrocyte differentiation(GO:0010725) |
| 0.0 | 0.2 | GO:0097500 | receptor localization to nonmotile primary cilium(GO:0097500) |
| 0.0 | 0.1 | GO:0036395 | pancreatic amylase secretion(GO:0036395) regulation of pancreatic amylase secretion(GO:1902276) |
| 0.0 | 0.4 | GO:0018026 | peptidyl-lysine monomethylation(GO:0018026) |
| 0.0 | 0.3 | GO:0072307 | metanephric nephron tubule epithelial cell differentiation(GO:0072257) regulation of metanephric nephron tubule epithelial cell differentiation(GO:0072307) |
| 0.0 | 0.1 | GO:0034499 | late endosome to Golgi transport(GO:0034499) |
| 0.0 | 0.1 | GO:1900748 | positive regulation of vascular endothelial growth factor signaling pathway(GO:1900748) |
| 0.0 | 0.1 | GO:0032900 | negative regulation of neurotrophin production(GO:0032900) |
| 0.0 | 0.1 | GO:0001543 | ovarian follicle rupture(GO:0001543) |
| 0.0 | 0.1 | GO:0048861 | leukemia inhibitory factor signaling pathway(GO:0048861) |
| 0.0 | 0.1 | GO:0045575 | basophil activation(GO:0045575) |
| 0.0 | 0.1 | GO:0006438 | valyl-tRNA aminoacylation(GO:0006438) |
| 0.0 | 0.1 | GO:0071579 | regulation of zinc ion transport(GO:0071579) |
| 0.0 | 0.2 | GO:0030070 | insulin processing(GO:0030070) |
| 0.0 | 0.2 | GO:0071630 | nucleus-associated proteasomal ubiquitin-dependent protein catabolic process(GO:0071630) |
| 0.0 | 0.1 | GO:1904457 | positive regulation of neuronal action potential(GO:1904457) |
| 0.0 | 0.5 | GO:0007288 | sperm axoneme assembly(GO:0007288) |
| 0.0 | 0.2 | GO:0090367 | negative regulation of mRNA modification(GO:0090367) |
| 0.0 | 0.1 | GO:0006083 | acetate metabolic process(GO:0006083) |
| 0.0 | 0.1 | GO:0000448 | cleavage in ITS2 between 5.8S rRNA and LSU-rRNA of tricistronic rRNA transcript (SSU-rRNA, 5.8S rRNA, LSU-rRNA)(GO:0000448) |
| 0.0 | 0.2 | GO:0038028 | insulin receptor signaling pathway via phosphatidylinositol 3-kinase(GO:0038028) |
| 0.0 | 0.2 | GO:0060024 | rhythmic synaptic transmission(GO:0060024) |
| 0.0 | 0.1 | GO:1901220 | regulation of cardiac chamber morphogenesis(GO:1901219) negative regulation of cardiac chamber morphogenesis(GO:1901220) |
| 0.0 | 0.2 | GO:0032252 | secretory granule localization(GO:0032252) |
| 0.0 | 0.2 | GO:0046606 | negative regulation of centrosome duplication(GO:0010826) negative regulation of centrosome cycle(GO:0046606) |
| 0.0 | 0.1 | GO:0035408 | histone H3-T6 phosphorylation(GO:0035408) |
| 0.0 | 0.2 | GO:0040031 | snRNA modification(GO:0040031) |
| 0.0 | 0.1 | GO:0071879 | positive regulation of adrenergic receptor signaling pathway(GO:0071879) |
| 0.0 | 0.1 | GO:0051088 | PMA-inducible membrane protein ectodomain proteolysis(GO:0051088) |
| 0.0 | 0.1 | GO:1902953 | positive regulation of ER to Golgi vesicle-mediated transport(GO:1902953) |
| 0.0 | 0.1 | GO:0014826 | vein smooth muscle contraction(GO:0014826) |
| 0.0 | 0.1 | GO:0090370 | negative regulation of cholesterol efflux(GO:0090370) |
| 0.0 | 0.1 | GO:0015692 | nickel cation transport(GO:0015675) vanadium ion transport(GO:0015676) lead ion transport(GO:0015692) nickel cation transmembrane transport(GO:0035444) |
| 0.0 | 0.0 | GO:0072162 | embryonic skeletal limb joint morphogenesis(GO:0036023) metanephric mesenchymal cell differentiation(GO:0072162) |
| 0.0 | 0.1 | GO:0086053 | AV node cell to bundle of His cell communication by electrical coupling(GO:0086053) |
| 0.0 | 0.1 | GO:0019563 | glycerol catabolic process(GO:0019563) |
| 0.0 | 0.1 | GO:1901491 | negative regulation of lymphangiogenesis(GO:1901491) |
| 0.0 | 0.1 | GO:0060178 | regulation of exocyst localization(GO:0060178) |
| 0.0 | 0.1 | GO:0014816 | skeletal muscle satellite cell differentiation(GO:0014816) embryonic retina morphogenesis in camera-type eye(GO:0060059) |
| 0.0 | 0.1 | GO:0035106 | operant conditioning(GO:0035106) |
| 0.0 | 0.1 | GO:0010724 | regulation of definitive erythrocyte differentiation(GO:0010724) |
| 0.0 | 0.0 | GO:1900453 | negative regulation of long term synaptic depression(GO:1900453) |
| 0.0 | 0.1 | GO:0031087 | deadenylation-independent decapping of nuclear-transcribed mRNA(GO:0031087) |
| 0.0 | 0.2 | GO:2000786 | positive regulation of autophagosome assembly(GO:2000786) |
| 0.0 | 0.2 | GO:0045634 | regulation of melanocyte differentiation(GO:0045634) |
| 0.0 | 0.3 | GO:0000042 | protein targeting to Golgi(GO:0000042) |
| 0.0 | 0.1 | GO:0048669 | collateral sprouting in absence of injury(GO:0048669) |
| 0.0 | 0.1 | GO:0021817 | nucleokinesis involved in cell motility in cerebral cortex radial glia guided migration(GO:0021817) nuclear migration along microtubule(GO:0030473) nuclear matrix anchoring at nuclear membrane(GO:0090292) |
| 0.0 | 0.1 | GO:1902211 | regulation of prolactin signaling pathway(GO:1902211) |
| 0.0 | 0.1 | GO:0098928 | presynaptic signal transduction(GO:0098928) presynapse to nucleus signaling pathway(GO:0099526) |
| 0.0 | 0.1 | GO:0071494 | cellular response to UV-C(GO:0071494) |
| 0.0 | 0.1 | GO:1904694 | negative regulation of vascular smooth muscle contraction(GO:1904694) |
| 0.0 | 0.1 | GO:0070086 | ubiquitin-dependent endocytosis(GO:0070086) |
| 0.0 | 0.1 | GO:2000297 | negative regulation of synapse maturation(GO:2000297) |
| 0.0 | 0.1 | GO:0021564 | vagus nerve development(GO:0021564) |
| 0.0 | 0.0 | GO:0061349 | cardiac right atrium morphogenesis(GO:0003213) planar cell polarity pathway involved in outflow tract morphogenesis(GO:0061347) planar cell polarity pathway involved in ventricular septum morphogenesis(GO:0061348) planar cell polarity pathway involved in cardiac right atrium morphogenesis(GO:0061349) planar cell polarity pathway involved in cardiac muscle tissue morphogenesis(GO:0061350) planar cell polarity pathway involved in pericardium morphogenesis(GO:0061354) |
| 0.0 | 0.1 | GO:0072275 | metanephric glomerulus morphogenesis(GO:0072275) metanephric glomerulus vasculature morphogenesis(GO:0072276) metanephric glomerular capillary formation(GO:0072277) |
| 0.0 | 0.1 | GO:1900224 | positive regulation of nodal signaling pathway involved in determination of lateral mesoderm left/right asymmetry(GO:1900224) |
| 0.0 | 0.5 | GO:0061099 | negative regulation of protein tyrosine kinase activity(GO:0061099) |
| 0.0 | 0.1 | GO:0000492 | box C/D snoRNP assembly(GO:0000492) |
| 0.0 | 0.2 | GO:1902231 | positive regulation of intrinsic apoptotic signaling pathway in response to DNA damage(GO:1902231) |
| 0.0 | 0.1 | GO:1900623 | regulation of monocyte aggregation(GO:1900623) positive regulation of monocyte aggregation(GO:1900625) |
| 0.0 | 0.1 | GO:2000675 | negative regulation of type B pancreatic cell apoptotic process(GO:2000675) |
| 0.0 | 0.0 | GO:0016598 | protein arginylation(GO:0016598) |
| 0.0 | 0.2 | GO:0070166 | enamel mineralization(GO:0070166) |
| 0.0 | 0.1 | GO:0014010 | Schwann cell proliferation(GO:0014010) |
| 0.0 | 0.1 | GO:0070650 | actin filament bundle distribution(GO:0070650) |
| 0.0 | 0.2 | GO:0032486 | Rap protein signal transduction(GO:0032486) |
| 0.0 | 0.1 | GO:0032485 | Ral protein signal transduction(GO:0032484) regulation of Ral protein signal transduction(GO:0032485) |
| 0.0 | 0.1 | GO:0016926 | protein desumoylation(GO:0016926) |
| 0.0 | 0.1 | GO:0002326 | B cell lineage commitment(GO:0002326) |
| 0.0 | 0.1 | GO:0021636 | trigeminal nerve morphogenesis(GO:0021636) trigeminal nerve structural organization(GO:0021637) semaphorin-plexin signaling pathway involved in axon guidance(GO:1902287) |
| 0.0 | 0.2 | GO:0035970 | peptidyl-threonine dephosphorylation(GO:0035970) |
| 0.0 | 0.1 | GO:0072102 | glomerulus morphogenesis(GO:0072102) |
| 0.0 | 0.1 | GO:0075522 | IRES-dependent viral translational initiation(GO:0075522) |
| 0.0 | 0.2 | GO:0045586 | regulation of gamma-delta T cell differentiation(GO:0045586) regulation of gamma-delta T cell activation(GO:0046643) |
| 0.0 | 0.2 | GO:0051382 | kinetochore assembly(GO:0051382) |
| 0.0 | 0.1 | GO:0033211 | adiponectin-activated signaling pathway(GO:0033211) |
| 0.0 | 0.1 | GO:0016095 | polyprenol catabolic process(GO:0016095) |
| 0.0 | 0.0 | GO:0044339 | canonical Wnt signaling pathway involved in osteoblast differentiation(GO:0044339) |
| 0.0 | 0.0 | GO:0097298 | regulation of nucleus size(GO:0097298) |
| 0.0 | 0.1 | GO:0086046 | membrane depolarization during SA node cell action potential(GO:0086046) |
| 0.0 | 0.0 | GO:1990164 | histone H2A phosphorylation(GO:1990164) |
| 0.0 | 0.1 | GO:0000379 | tRNA-type intron splice site recognition and cleavage(GO:0000379) |
| 0.0 | 0.1 | GO:0002098 | tRNA wobble uridine modification(GO:0002098) |
| 0.0 | 0.1 | GO:0051661 | maintenance of centrosome location(GO:0051661) |
| 0.0 | 0.1 | GO:0010745 | negative regulation of macrophage derived foam cell differentiation(GO:0010745) |
| 0.0 | 0.0 | GO:2001274 | negative regulation of glucose import in response to insulin stimulus(GO:2001274) |
| 0.0 | 0.0 | GO:0060355 | positive regulation of cell adhesion molecule production(GO:0060355) |
| 0.0 | 0.1 | GO:0010032 | meiotic chromosome condensation(GO:0010032) |
| 0.0 | 0.2 | GO:0033327 | Leydig cell differentiation(GO:0033327) |
| 0.0 | 0.1 | GO:2000574 | regulation of microtubule motor activity(GO:2000574) |
| 0.0 | 0.0 | GO:0009082 | branched-chain amino acid biosynthetic process(GO:0009082) leucine biosynthetic process(GO:0009098) valine biosynthetic process(GO:0009099) |
| 0.0 | 0.1 | GO:0033625 | positive regulation of integrin activation(GO:0033625) |
| 0.0 | 0.1 | GO:1903690 | negative regulation of wound healing, spreading of epidermal cells(GO:1903690) |
| 0.0 | 0.0 | GO:0070375 | ERK5 cascade(GO:0070375) |
| 0.0 | 0.2 | GO:0006622 | protein targeting to lysosome(GO:0006622) |
| 0.0 | 0.1 | GO:0015791 | polyol transport(GO:0015791) |
Gene overrepresentation in cellular component category:
| Log-likelihood per target | Total log-likelihood | Term | Description |
|---|---|---|---|
| 0.1 | 0.3 | GO:0071148 | TEAD-1-YAP complex(GO:0071148) |
| 0.1 | 0.2 | GO:0048269 | methionine adenosyltransferase complex(GO:0048269) |
| 0.1 | 0.2 | GO:0034686 | integrin alphav-beta8 complex(GO:0034686) |
| 0.0 | 0.4 | GO:0098831 | presynaptic active zone cytoplasmic component(GO:0098831) |
| 0.0 | 0.4 | GO:0005952 | cAMP-dependent protein kinase complex(GO:0005952) |
| 0.0 | 0.1 | GO:0035838 | growing cell tip(GO:0035838) |
| 0.0 | 0.1 | GO:0044316 | cone cell pedicle(GO:0044316) |
| 0.0 | 0.1 | GO:0034657 | GID complex(GO:0034657) |
| 0.0 | 0.1 | GO:0005606 | laminin-1 complex(GO:0005606) laminin-10 complex(GO:0043259) |
| 0.0 | 0.1 | GO:1990812 | growth cone filopodium(GO:1990812) |
| 0.0 | 0.1 | GO:0072534 | perineuronal net(GO:0072534) |
| 0.0 | 0.2 | GO:0000125 | PCAF complex(GO:0000125) |
| 0.0 | 0.1 | GO:0044530 | supraspliceosomal complex(GO:0044530) |
| 0.0 | 0.2 | GO:0035068 | micro-ribonucleoprotein complex(GO:0035068) |
| 0.0 | 0.2 | GO:0070937 | CRD-mediated mRNA stability complex(GO:0070937) |
| 0.0 | 0.2 | GO:0001940 | male pronucleus(GO:0001940) |
| 0.0 | 0.1 | GO:0070695 | FHF complex(GO:0070695) |
| 0.0 | 0.1 | GO:0032937 | SREBP-SCAP-Insig complex(GO:0032937) |
| 0.0 | 0.1 | GO:0070826 | paraferritin complex(GO:0070826) |
| 0.0 | 0.2 | GO:0030130 | clathrin coat of trans-Golgi network vesicle(GO:0030130) |
| 0.0 | 0.1 | GO:0097427 | microtubule bundle(GO:0097427) |
| 0.0 | 0.1 | GO:0098837 | postsynaptic recycling endosome(GO:0098837) |
| 0.0 | 0.6 | GO:0097440 | apical dendrite(GO:0097440) |
| 0.0 | 0.3 | GO:0032279 | asymmetric synapse(GO:0032279) |
| 0.0 | 0.4 | GO:0008074 | guanylate cyclase complex, soluble(GO:0008074) |
| 0.0 | 0.2 | GO:0043202 | lysosomal lumen(GO:0043202) |
| 0.0 | 0.1 | GO:0001405 | presequence translocase-associated import motor(GO:0001405) |
| 0.0 | 0.0 | GO:0002945 | cyclin K-CDK13 complex(GO:0002945) |
| 0.0 | 0.1 | GO:0001739 | sex chromatin(GO:0001739) |
| 0.0 | 0.2 | GO:0044232 | organelle membrane contact site(GO:0044232) |
| 0.0 | 0.2 | GO:0098799 | outer mitochondrial membrane protein complex(GO:0098799) |
| 0.0 | 0.1 | GO:0032983 | kainate selective glutamate receptor complex(GO:0032983) |
| 0.0 | 0.1 | GO:0042555 | MCM complex(GO:0042555) |
| 0.0 | 0.1 | GO:0035102 | PRC1 complex(GO:0035102) |
| 0.0 | 0.2 | GO:0043196 | varicosity(GO:0043196) |
| 0.0 | 0.1 | GO:0000214 | tRNA-intron endonuclease complex(GO:0000214) |
| 0.0 | 0.0 | GO:0033557 | Slx1-Slx4 complex(GO:0033557) |
| 0.0 | 0.1 | GO:0030128 | clathrin coat of endocytic vesicle(GO:0030128) |
| 0.0 | 0.3 | GO:0030137 | COPI-coated vesicle(GO:0030137) |
| 0.0 | 0.1 | GO:0034751 | aryl hydrocarbon receptor complex(GO:0034751) |
| 0.0 | 0.1 | GO:1990454 | L-type voltage-gated calcium channel complex(GO:1990454) |
Gene overrepresentation in molecular function category:
| Log-likelihood per target | Total log-likelihood | Term | Description |
|---|---|---|---|
| 0.1 | 0.5 | GO:0070644 | vitamin D response element binding(GO:0070644) |
| 0.1 | 0.2 | GO:0016309 | 1-phosphatidylinositol-5-phosphate 4-kinase activity(GO:0016309) |
| 0.1 | 0.2 | GO:0030977 | taurine binding(GO:0030977) |
| 0.1 | 0.2 | GO:0030158 | protein xylosyltransferase activity(GO:0030158) |
| 0.1 | 0.2 | GO:0004478 | methionine adenosyltransferase activity(GO:0004478) |
| 0.1 | 0.4 | GO:0008294 | calcium- and calmodulin-responsive adenylate cyclase activity(GO:0008294) |
| 0.1 | 0.2 | GO:0070579 | methylcytosine dioxygenase activity(GO:0070579) |
| 0.0 | 0.1 | GO:1902379 | chemoattractant activity involved in axon guidance(GO:1902379) |
| 0.0 | 0.2 | GO:0004691 | cAMP-dependent protein kinase activity(GO:0004691) |
| 0.0 | 0.2 | GO:0003987 | acetate-CoA ligase activity(GO:0003987) |
| 0.0 | 0.1 | GO:0008607 | phosphorylase kinase regulator activity(GO:0008607) |
| 0.0 | 0.3 | GO:0035033 | histone deacetylase regulator activity(GO:0035033) |
| 0.0 | 0.4 | GO:0017034 | Rap guanyl-nucleotide exchange factor activity(GO:0017034) |
| 0.0 | 0.1 | GO:0031826 | type 2A serotonin receptor binding(GO:0031826) |
| 0.0 | 0.2 | GO:0008526 | phosphatidylinositol transporter activity(GO:0008526) |
| 0.0 | 0.3 | GO:0030160 | GKAP/Homer scaffold activity(GO:0030160) |
| 0.0 | 0.1 | GO:0031821 | G-protein coupled serotonin receptor binding(GO:0031821) |
| 0.0 | 0.1 | GO:0060002 | plus-end directed microfilament motor activity(GO:0060002) |
| 0.0 | 0.1 | GO:0004924 | oncostatin-M receptor activity(GO:0004924) |
| 0.0 | 0.1 | GO:0035651 | AP-3 adaptor complex binding(GO:0035651) |
| 0.0 | 0.1 | GO:0004832 | valine-tRNA ligase activity(GO:0004832) |
| 0.0 | 0.2 | GO:0019960 | C-X3-C chemokine binding(GO:0019960) neuregulin binding(GO:0038132) |
| 0.0 | 0.1 | GO:0001069 | regulatory region RNA binding(GO:0001069) |
| 0.0 | 0.2 | GO:0034648 | histone demethylase activity (H3-dimethyl-K4 specific)(GO:0034648) |
| 0.0 | 0.2 | GO:0008603 | cAMP-dependent protein kinase regulator activity(GO:0008603) |
| 0.0 | 0.1 | GO:0004719 | protein-L-isoaspartate (D-aspartate) O-methyltransferase activity(GO:0004719) |
| 0.0 | 0.1 | GO:0035403 | calcium-dependent protein kinase C activity(GO:0004698) histone kinase activity (H3-T6 specific)(GO:0035403) |
| 0.0 | 0.1 | GO:0051731 | polynucleotide 5'-hydroxyl-kinase activity(GO:0051731) |
| 0.0 | 0.1 | GO:0051425 | PTB domain binding(GO:0051425) |
| 0.0 | 0.2 | GO:0008429 | phosphatidylethanolamine binding(GO:0008429) |
| 0.0 | 0.1 | GO:0015086 | cadmium ion transmembrane transporter activity(GO:0015086) lead ion transmembrane transporter activity(GO:0015094) nickel cation transmembrane transporter activity(GO:0015099) vanadium ion transmembrane transporter activity(GO:0015100) ferrous iron uptake transmembrane transporter activity(GO:0015639) chromium ion transmembrane transporter activity(GO:0070835) |
| 0.0 | 0.1 | GO:0003976 | UDP-N-acetylglucosamine-lysosomal-enzyme N-acetylglucosaminephosphotransferase activity(GO:0003976) |
| 0.0 | 0.1 | GO:0050265 | RNA uridylyltransferase activity(GO:0050265) |
| 0.0 | 0.1 | GO:0086075 | gap junction channel activity involved in cardiac conduction electrical coupling(GO:0086075) gap junction channel activity involved in AV node cell-bundle of His cell electrical coupling(GO:0086077) |
| 0.0 | 0.1 | GO:0086059 | voltage-gated calcium channel activity involved SA node cell action potential(GO:0086059) |
| 0.0 | 0.2 | GO:0047372 | acylglycerol lipase activity(GO:0047372) |
| 0.0 | 0.1 | GO:0045503 | dynein light chain binding(GO:0045503) |
| 0.0 | 0.4 | GO:0035259 | glucocorticoid receptor binding(GO:0035259) |
| 0.0 | 0.1 | GO:0005017 | platelet-derived growth factor-activated receptor activity(GO:0005017) |
| 0.0 | 0.1 | GO:0004874 | aryl hydrocarbon receptor activity(GO:0004874) |
| 0.0 | 0.1 | GO:0008499 | UDP-galactose:beta-N-acetylglucosamine beta-1,3-galactosyltransferase activity(GO:0008499) |
| 0.0 | 0.3 | GO:0022848 | acetylcholine-gated cation channel activity(GO:0022848) |
| 0.0 | 0.1 | GO:0004445 | inositol-polyphosphate 5-phosphatase activity(GO:0004445) |
| 0.0 | 0.2 | GO:0042043 | neurexin family protein binding(GO:0042043) |
| 0.0 | 0.2 | GO:0005172 | vascular endothelial growth factor receptor binding(GO:0005172) |
| 0.0 | 0.1 | GO:0004971 | AMPA glutamate receptor activity(GO:0004971) |
| 0.0 | 0.1 | GO:0035612 | AP-2 adaptor complex binding(GO:0035612) |
| 0.0 | 0.1 | GO:0032795 | heterotrimeric G-protein binding(GO:0032795) |
| 0.0 | 0.1 | GO:0004962 | endothelin receptor activity(GO:0004962) |
| 0.0 | 0.1 | GO:0047751 | 3-oxo-5-alpha-steroid 4-dehydrogenase activity(GO:0003865) cholestenone 5-alpha-reductase activity(GO:0047751) |
| 0.0 | 0.2 | GO:0035198 | miRNA binding(GO:0035198) |
| 0.0 | 0.1 | GO:0043208 | glycosphingolipid binding(GO:0043208) |
| 0.0 | 0.2 | GO:0016832 | aldehyde-lyase activity(GO:0016832) |
| 0.0 | 0.5 | GO:0045182 | translation regulator activity(GO:0045182) |
| 0.0 | 0.0 | GO:0047057 | oxidoreductase activity, acting on the CH-OH group of donors, disulfide as acceptor(GO:0016900) vitamin-K-epoxide reductase (warfarin-sensitive) activity(GO:0047057) |
| 0.0 | 0.1 | GO:0030346 | protein phosphatase 2B binding(GO:0030346) |
| 0.0 | 0.2 | GO:0008574 | ATP-dependent microtubule motor activity, plus-end-directed(GO:0008574) |
| 0.0 | 0.1 | GO:0005049 | nuclear export signal receptor activity(GO:0005049) |
| 0.0 | 0.2 | GO:0017154 | semaphorin receptor activity(GO:0017154) |
| 0.0 | 0.0 | GO:0052656 | branched-chain-amino-acid transaminase activity(GO:0004084) L-leucine transaminase activity(GO:0052654) L-valine transaminase activity(GO:0052655) L-isoleucine transaminase activity(GO:0052656) |
| 0.0 | 0.1 | GO:0000213 | tRNA-intron endonuclease activity(GO:0000213) |
Gene overrepresentation in curated gene sets: canonical pathways category:
| Log-likelihood per target | Total log-likelihood | Term | Description |
|---|---|---|---|
| 0.0 | 0.4 | PID LPA4 PATHWAY | LPA4-mediated signaling events |
| 0.0 | 0.1 | ST PAC1 RECEPTOR PATHWAY | PAC1 Receptor Pathway |
| 0.0 | 0.1 | SA CASPASE CASCADE | Apoptosis is mediated by caspases, cysteine proteases arranged in a proteolytic cascade. |
| 0.0 | 0.4 | PID PDGFRA PATHWAY | PDGFR-alpha signaling pathway |
| 0.0 | 0.4 | PID IL3 PATHWAY | IL3-mediated signaling events |
| 0.0 | 0.5 | PID NETRIN PATHWAY | Netrin-mediated signaling events |
| 0.0 | 0.5 | PID RETINOIC ACID PATHWAY | Retinoic acid receptors-mediated signaling |
| 0.0 | 0.1 | PID EPHA2 FWD PATHWAY | EPHA2 forward signaling |
| 0.0 | 0.3 | PID S1P META PATHWAY | Sphingosine 1-phosphate (S1P) pathway |
| 0.0 | 0.4 | PID ERBB4 PATHWAY | ErbB4 signaling events |
Gene overrepresentation in curated gene sets: REACTOME pathways category:
| Log-likelihood per target | Total log-likelihood | Term | Description |
|---|---|---|---|
| 0.0 | 0.3 | REACTOME NEF MEDIATED DOWNREGULATION OF MHC CLASS I COMPLEX CELL SURFACE EXPRESSION | Genes involved in Nef mediated downregulation of MHC class I complex cell surface expression |
| 0.0 | 0.7 | REACTOME PKA MEDIATED PHOSPHORYLATION OF CREB | Genes involved in PKA-mediated phosphorylation of CREB |
| 0.0 | 0.7 | REACTOME DOWNREGULATION OF SMAD2 3 SMAD4 TRANSCRIPTIONAL ACTIVITY | Genes involved in Downregulation of SMAD2/3:SMAD4 transcriptional activity |
| 0.0 | 0.3 | REACTOME IL 7 SIGNALING | Genes involved in Interleukin-7 signaling |
| 0.0 | 0.6 | REACTOME YAP1 AND WWTR1 TAZ STIMULATED GENE EXPRESSION | Genes involved in YAP1- and WWTR1 (TAZ)-stimulated gene expression |
| 0.0 | 0.3 | REACTOME HIGHLY CALCIUM PERMEABLE POSTSYNAPTIC NICOTINIC ACETYLCHOLINE RECEPTORS | Genes involved in Highly calcium permeable postsynaptic nicotinic acetylcholine receptors |
| 0.0 | 0.2 | REACTOME PECAM1 INTERACTIONS | Genes involved in PECAM1 interactions |
| 0.0 | 0.3 | REACTOME RAP1 SIGNALLING | Genes involved in Rap1 signalling |
| 0.0 | 0.2 | REACTOME REGULATION OF INSULIN SECRETION BY ACETYLCHOLINE | Genes involved in Regulation of Insulin Secretion by Acetylcholine |
| 0.0 | 0.2 | REACTOME HORMONE SENSITIVE LIPASE HSL MEDIATED TRIACYLGLYCEROL HYDROLYSIS | Genes involved in Hormone-sensitive lipase (HSL)-mediated triacylglycerol hydrolysis |
| 0.0 | 0.3 | REACTOME REGULATION OF SIGNALING BY CBL | Genes involved in Regulation of signaling by CBL |
| 0.0 | 0.4 | REACTOME GABA SYNTHESIS RELEASE REUPTAKE AND DEGRADATION | Genes involved in GABA synthesis, release, reuptake and degradation |
| 0.0 | 0.1 | REACTOME RECEPTOR LIGAND BINDING INITIATES THE SECOND PROTEOLYTIC CLEAVAGE OF NOTCH RECEPTOR | Genes involved in Receptor-ligand binding initiates the second proteolytic cleavage of Notch receptor |
| 0.0 | 0.0 | REACTOME INFLUENZA VIRAL RNA TRANSCRIPTION AND REPLICATION | Genes involved in Influenza Viral RNA Transcription and Replication |
| 0.0 | 0.4 | REACTOME SYNTHESIS OF PIPS AT THE PLASMA MEMBRANE | Genes involved in Synthesis of PIPs at the plasma membrane |
| 0.0 | 0.2 | REACTOME NA CL DEPENDENT NEUROTRANSMITTER TRANSPORTERS | Genes involved in Na+/Cl- dependent neurotransmitter transporters |
| 0.0 | 0.1 | REACTOME ADENYLATE CYCLASE INHIBITORY PATHWAY | Genes involved in Adenylate cyclase inhibitory pathway |
| 0.0 | 0.2 | REACTOME TANDEM PORE DOMAIN POTASSIUM CHANNELS | Genes involved in Tandem pore domain potassium channels |
| 0.0 | 0.2 | REACTOME PI METABOLISM | Genes involved in PI Metabolism |
| 0.0 | 0.2 | REACTOME N GLYCAN ANTENNAE ELONGATION | Genes involved in N-Glycan antennae elongation |
| 0.0 | 0.4 | REACTOME MYOGENESIS | Genes involved in Myogenesis |