Project
GSE49485: Hypoxia transcriptome sequencing of rat brain.
Navigation
Downloads
Results for Yy1_Yy2
Z-value: 2.04
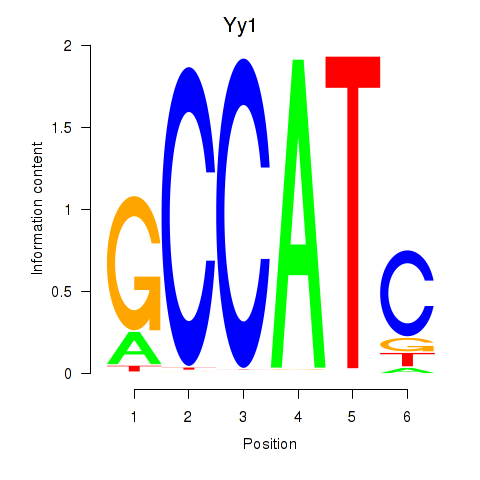
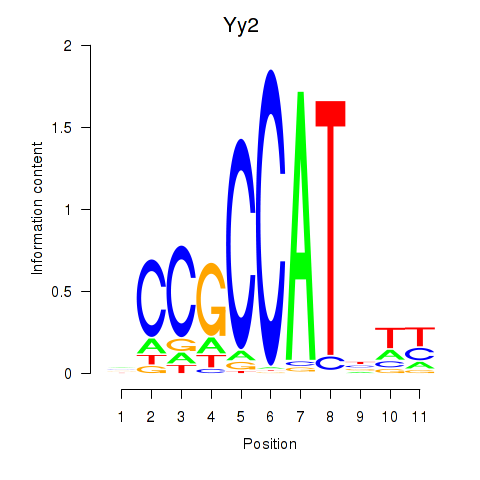
Motif logo
Transcription factors associated with Yy1_Yy2
| Gene Symbol | Gene ID | Gene Info |
|---|---|---|
|
Yy1
|
ENSRNOG00000004339 | YY1 transcription factor |
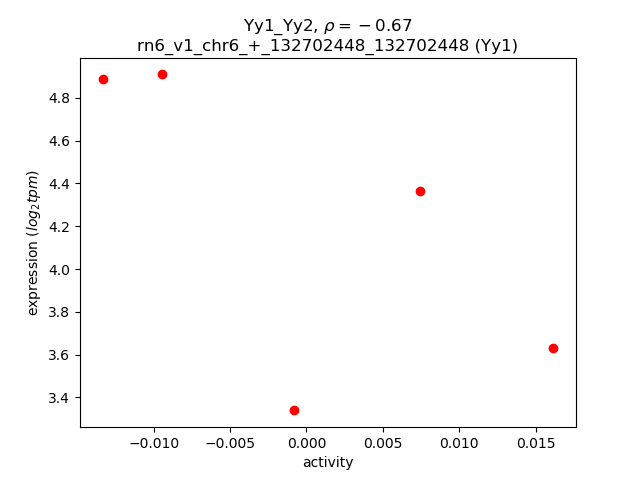
Activity-expression correlation:
| Gene | Promoter | Pearson corr. coef. | P-value | Plot |
|---|---|---|---|---|
| Yy1 | rn6_v1_chr6_+_132702448_132702448 | -0.67 | 2.2e-01 | Click! |
Activity profile of Yy1_Yy2 motif
Sorted Z-values of Yy1_Yy2 motif
| Promoter | Log-likelihood | Transcript | Gene | Gene Info |
|---|---|---|---|---|
| chr3_+_123106694 | 2.03 |
ENSRNOT00000028829
|
Oxt
|
oxytocin/neurophysin 1 prepropeptide |
| chr1_-_166939541 | 1.52 |
ENSRNOT00000079675
|
Folr1
|
folate receptor 1 |
| chr10_-_88670430 | 1.47 |
ENSRNOT00000025547
|
Hcrt
|
hypocretin neuropeptide precursor |
| chr10_-_70871066 | 1.34 |
ENSRNOT00000015139
|
Ccl3
|
C-C motif chemokine ligand 3 |
| chr14_+_43694183 | 1.29 |
ENSRNOT00000046342
|
RGD1563570
|
similar to ribosomal protein S23 |
| chr3_-_123119460 | 1.17 |
ENSRNOT00000028833
|
Avp
|
arginine vasopressin |
| chr10_-_13168217 | 1.10 |
ENSRNOT00000087768
|
Elob
|
elongin B |
| chr18_-_15540177 | 1.06 |
ENSRNOT00000022113
|
Ttr
|
transthyretin |
| chr5_+_64789456 | 1.02 |
ENSRNOT00000009584
|
Zfp189
|
zinc finger protein 189 |
| chr1_+_168964202 | 0.98 |
ENSRNOT00000089102
|
LOC103694855
|
hemoglobin subunit beta-2-like |
| chr2_-_189573280 | 0.92 |
ENSRNOT00000022897
|
Rps27
|
ribosomal protein S27 |
| chr7_-_28711761 | 0.88 |
ENSRNOT00000006249
|
Parpbp
|
PARP1 binding protein |
| chr8_+_48438259 | 0.83 |
ENSRNOT00000059813
|
Mfrp
|
membrane frizzled-related protein |
| chr6_+_51662224 | 0.80 |
ENSRNOT00000060006
|
Ccdc71l
|
coiled-coil domain containing 71-like |
| chr10_-_15600858 | 0.80 |
ENSRNOT00000035459
|
Hbq1b
|
hemoglobin, theta 1B |
| chr1_+_199720038 | 0.80 |
ENSRNOT00000027297
|
Ahsp
|
alpha hemoglobin stabilizing protein |
| chr10_+_63884338 | 0.76 |
ENSRNOT00000007100
|
Ywhae
|
tyrosine 3-monooxygenase/tryptophan 5-monooxygenase activation protein, epsilon |
| chr1_-_168972725 | 0.76 |
ENSRNOT00000090422
|
Hbb
|
hemoglobin subunit beta |
| chr5_+_57657909 | 0.76 |
ENSRNOT00000073017
|
LOC683961
|
similar to ribosomal protein S13 |
| chr12_+_22641104 | 0.75 |
ENSRNOT00000001916
|
Serpine1
|
serpin family E member 1 |
| chr5_-_17061361 | 0.75 |
ENSRNOT00000089318
|
Penk
|
proenkephalin |
| chr2_-_256154584 | 0.73 |
ENSRNOT00000072487
|
AABR07013776.1
|
|
| chr4_+_56744561 | 0.72 |
ENSRNOT00000009737
|
Atp6v1f
|
ATPase H+ transporting V1 subunit F |
| chr10_+_13836128 | 0.71 |
ENSRNOT00000012720
|
Pgp
|
phosphoglycolate phosphatase |
| chr10_-_97582188 | 0.71 |
ENSRNOT00000005076
|
Rgs9
|
regulator of G-protein signaling 9 |
| chr3_+_164424515 | 0.70 |
ENSRNOT00000083876
|
Cebpb
|
CCAAT/enhancer binding protein beta |
| chr1_-_91588609 | 0.69 |
ENSRNOT00000050931
|
Snrpg
|
small nuclear ribonucleoprotein polypeptide G |
| chr5_-_134927235 | 0.69 |
ENSRNOT00000016751
|
Uqcrh
|
ubiquinol-cytochrome c reductase hinge protein |
| chr5_-_64789318 | 0.68 |
ENSRNOT00000078957
|
Mrpl50
|
mitochondrial ribosomal protein L50 |
| chr11_-_68989988 | 0.67 |
ENSRNOT00000003013
|
Hacd2
|
3-hydroxyacyl-CoA dehydratase 2 |
| chr1_-_72621519 | 0.67 |
ENSRNOT00000058943
|
Rpl28
|
ribosomal protein L28 |
| chr9_-_101388833 | 0.67 |
ENSRNOT00000071817
|
Chchd2
|
coiled-coil-helix-coiled-coil-helix domain containing 2 |
| chr19_-_11302938 | 0.64 |
ENSRNOT00000038212
|
AC128848.1
|
|
| chr1_-_89258935 | 0.63 |
ENSRNOT00000003180
|
LOC100361079
|
ribosomal protein L36-like |
| chr3_+_138174054 | 0.63 |
ENSRNOT00000007946
|
Banf2
|
barrier to autointegration factor 2 |
| chr17_-_389967 | 0.62 |
ENSRNOT00000023865
|
Fbp2
|
fructose-bisphosphatase 2 |
| chr11_-_24294179 | 0.62 |
ENSRNOT00000002116
|
Atp5j
|
ATP synthase, H+ transporting, mitochondrial Fo complex, subunit F6 |
| chr11_+_70967439 | 0.62 |
ENSRNOT00000032518
|
Iqcg
|
IQ motif containing G |
| chr11_+_82415995 | 0.62 |
ENSRNOT00000051772
|
AABR07034641.1
|
|
| chr17_+_76002275 | 0.61 |
ENSRNOT00000092665
ENSRNOT00000086701 |
Echdc3
|
enoyl CoA hydratase domain containing 3 |
| chr1_+_168945449 | 0.61 |
ENSRNOT00000087661
ENSRNOT00000019913 |
LOC103694855
|
hemoglobin subunit beta-2-like |
| chr1_+_168957460 | 0.61 |
ENSRNOT00000090745
|
LOC103694857
|
hemoglobin subunit beta-2 |
| chr8_+_52829085 | 0.59 |
ENSRNOT00000007754
|
RGD1563941
|
similar to hypothetical protein FLJ20010 |
| chr11_+_89008008 | 0.59 |
ENSRNOT00000074586
|
Cebpd
|
CCAAT/enhancer binding protein delta |
| chr12_+_943006 | 0.59 |
ENSRNOT00000001449
|
Kl
|
Klotho |
| chr9_-_43127887 | 0.59 |
ENSRNOT00000021685
|
Ankrd39
|
ankyrin repeat domain 39 |
| chr19_+_14346197 | 0.59 |
ENSRNOT00000043480
|
Gm18025
|
predicted gene, 18025 |
| chr17_-_43807540 | 0.58 |
ENSRNOT00000074763
|
LOC684762
|
similar to CG31613-PA |
| chr12_+_47024442 | 0.57 |
ENSRNOT00000001545
|
Cox6a1
|
cytochrome c oxidase subunit 6A1 |
| chr5_+_164923302 | 0.57 |
ENSRNOT00000042285
|
LOC108349682
|
60S ribosomal protein L35a |
| chr11_+_84094520 | 0.56 |
ENSRNOT00000046642
|
Rps15al2
|
ribosomal protein S15A-like 2 |
| chr4_+_33638709 | 0.56 |
ENSRNOT00000009888
ENSRNOT00000034719 ENSRNOT00000052333 |
Tac1
|
tachykinin, precursor 1 |
| chr7_+_128500011 | 0.56 |
ENSRNOT00000074625
|
Fam19a5
|
family with sequence similarity 19 member A5, C-C motif chemokine like |
| chr17_-_9441526 | 0.56 |
ENSRNOT00000000146
|
Txndc15
|
thioredoxin domain containing 15 |
| chr19_+_37229120 | 0.55 |
ENSRNOT00000076335
|
Hsf4
|
heat shock transcription factor 4 |
| chr6_-_76270457 | 0.55 |
ENSRNOT00000009894
|
Nfkbia
|
NFKB inhibitor alpha |
| chr18_+_59830363 | 0.54 |
ENSRNOT00000082650
ENSRNOT00000078378 |
Onecut2
|
one cut domain, family member 2 |
| chr8_+_55037750 | 0.53 |
ENSRNOT00000013188
|
Timm8b
|
translocase of inner mitochondrial membrane 8 homolog B |
| chr5_-_147817852 | 0.52 |
ENSRNOT00000071940
|
Dcdc2b
|
doublecortin domain containing 2B |
| chrX_-_32153794 | 0.52 |
ENSRNOT00000005348
|
Tmem27
|
transmembrane protein 27 |
| chr15_+_34584320 | 0.52 |
ENSRNOT00000048255
|
AABR07017917.1
|
|
| chr3_-_175479034 | 0.52 |
ENSRNOT00000086761
|
Hrh3
|
histamine receptor H3 |
| chr1_-_24191908 | 0.51 |
ENSRNOT00000061157
|
Sgk1
|
serum/glucocorticoid regulated kinase 1 |
| chr2_+_29598344 | 0.51 |
ENSRNOT00000088580
ENSRNOT00000023286 |
Mrps27
|
mitochondrial ribosomal protein S27 |
| chr10_-_84976170 | 0.51 |
ENSRNOT00000013542
|
Lrrc46
|
leucine rich repeat containing 46 |
| chr1_-_7801438 | 0.51 |
ENSRNOT00000022273
|
AABR07000276.1
|
|
| chr11_+_33845463 | 0.51 |
ENSRNOT00000041838
|
Cbr1
|
carbonyl reductase 1 |
| chr4_-_66624912 | 0.50 |
ENSRNOT00000064891
|
Hipk2
|
homeodomain interacting protein kinase 2 |
| chr16_-_6675746 | 0.50 |
ENSRNOT00000025858
|
Prkcd
|
protein kinase C, delta |
| chrX_-_106607352 | 0.50 |
ENSRNOT00000082858
|
AABR07040624.1
|
|
| chr6_-_104290579 | 0.50 |
ENSRNOT00000066014
|
Erh
|
enhancer of rudimentary homolog (Drosophila) |
| chr10_+_91217079 | 0.50 |
ENSRNOT00000004218
|
Hexim2
|
hexamethylene bis-acetamide inducible 2 |
| chr10_-_44746549 | 0.50 |
ENSRNOT00000003841
|
Fam183b
|
family with sequence similarity 183, member B |
| chr20_-_14282873 | 0.50 |
ENSRNOT00000001759
|
Adora2a
|
adenosine A2a receptor |
| chr14_+_34389991 | 0.49 |
ENSRNOT00000002953
|
Pdcl2
|
phosducin-like 2 |
| chr1_-_145931583 | 0.49 |
ENSRNOT00000016433
|
Cfap161
|
cilia and flagella associated protein 161 |
| chr2_-_96032722 | 0.49 |
ENSRNOT00000015746
|
LOC100360846
|
proteasome subunit beta type 6-like |
| chr4_+_157230769 | 0.49 |
ENSRNOT00000091464
ENSRNOT00000017472 |
Phb2
|
prohibitin 2 |
| chr5_-_126782726 | 0.49 |
ENSRNOT00000048784
|
Tceanc2
|
transcription elongation factor A N-terminal and central domain containing 2 |
| chr17_+_44763598 | 0.49 |
ENSRNOT00000079880
|
Hist1h3b
|
histone cluster 1, H3b |
| chr16_-_8564379 | 0.49 |
ENSRNOT00000060975
|
LOC680885
|
hypothetical protein LOC680885 |
| chr10_-_56267213 | 0.48 |
ENSRNOT00000017201
|
Mpdu1
|
mannose-P-dolichol utilization defect 1 |
| chr3_-_10153554 | 0.48 |
ENSRNOT00000093246
|
Exosc2
|
exosome component 2 |
| chr8_-_61917125 | 0.48 |
ENSRNOT00000085049
|
RGD1305464
|
similar to human chromosome 15 open reading frame 39 |
| chr17_-_43815183 | 0.48 |
ENSRNOT00000073188
|
Hist1h2ail1
|
histone cluster 1, H2ai-like1 |
| chr8_+_48437918 | 0.48 |
ENSRNOT00000085578
|
Mfrp
|
membrane frizzled-related protein |
| chr7_+_11724962 | 0.48 |
ENSRNOT00000026551
|
Lsm7
|
LSM7 homolog, U6 small nuclear RNA and mRNA degradation associated |
| chr1_-_187766670 | 0.48 |
ENSRNOT00000092513
ENSRNOT00000092282 |
Rps15a
|
ribosomal protein S15a |
| chr7_+_120580743 | 0.47 |
ENSRNOT00000017181
|
Maff
|
MAF bZIP transcription factor F |
| chr12_-_7186873 | 0.47 |
ENSRNOT00000050438
|
LOC103690996
|
uncharacterized LOC103690996 |
| chrX_+_106487870 | 0.47 |
ENSRNOT00000075521
|
Arxes2
|
adipocyte-related X-chromosome expressed sequence 2 |
| chr1_-_89369960 | 0.47 |
ENSRNOT00000028545
|
Hamp
|
hepcidin antimicrobial peptide |
| chr7_-_18683440 | 0.47 |
ENSRNOT00000068323
|
Rps28
|
ribosomal protein S28 |
| chr6_+_111476768 | 0.47 |
ENSRNOT00000016479
|
Slirp
|
SRA stem-loop interacting RNA binding protein |
| chr20_-_46305157 | 0.47 |
ENSRNOT00000000340
|
Ccdc162
|
coiled-coil domain containing 162 |
| chr7_-_12918173 | 0.46 |
ENSRNOT00000011010
|
Tpgs1
|
tubulin polyglutamylase complex subunit 1 |
| chr12_+_13090367 | 0.45 |
ENSRNOT00000001417
|
Rac1
|
ras-related C3 botulinum toxin substrate 1 |
| chr1_+_78659435 | 0.45 |
ENSRNOT00000071271
|
Ceacam9
|
carcinoembryonic antigen-related cell adhesion molecule 9 |
| chrX_-_156999650 | 0.45 |
ENSRNOT00000083557
|
Ssr4
|
signal sequence receptor subunit 4 |
| chr4_+_182745448 | 0.44 |
ENSRNOT00000043543
|
Rps4y2
|
ribosomal protein S4, Y-linked 2 |
| chr6_+_28663602 | 0.44 |
ENSRNOT00000005402
|
Ptrhd1
|
peptidyl-tRNA hydrolase domain containing 1 |
| chr17_+_44794130 | 0.44 |
ENSRNOT00000077571
|
Hist1h2ac
|
histone cluster 1, H2ac |
| chr10_-_45923829 | 0.44 |
ENSRNOT00000035285
|
Olr1462
|
olfactory receptor 1462 |
| chr9_-_94250809 | 0.44 |
ENSRNOT00000026387
|
Ecel1
|
endothelin converting enzyme-like 1 |
| chr3_-_9738752 | 0.43 |
ENSRNOT00000045993
|
Ptges
|
prostaglandin E synthase |
| chr17_+_78793336 | 0.43 |
ENSRNOT00000057898
|
Mt1
|
metallothionein 1 |
| chr15_-_33263659 | 0.43 |
ENSRNOT00000018005
|
Psmb5
|
proteasome subunit beta 5 |
| chr12_+_19303387 | 0.43 |
ENSRNOT00000001820
|
Cops6
|
COP9 signalosome subunit 6 |
| chr18_+_63130542 | 0.43 |
ENSRNOT00000024947
|
Tubb6
|
tubulin, beta 6 class V |
| chr14_+_22706901 | 0.43 |
ENSRNOT00000088798
|
Ppial4d
|
peptidylprolyl isomerase A (cyclophilin A)-like 4D |
| chr3_-_82856171 | 0.43 |
ENSRNOT00000088555
|
RGD1564664
|
similar to LOC387763 protein |
| chr13_+_83681322 | 0.43 |
ENSRNOT00000004206
|
Mpc2
|
mitochondrial pyruvate carrier 2 |
| chr19_+_37282018 | 0.43 |
ENSRNOT00000021723
|
Tmem208
|
transmembrane protein 208 |
| chr20_+_9743269 | 0.43 |
ENSRNOT00000001533
ENSRNOT00000083505 |
Abcg1
|
ATP binding cassette subfamily G member 1 |
| chr12_+_47698947 | 0.43 |
ENSRNOT00000001586
|
Trpv4
|
transient receptor potential cation channel, subfamily V, member 4 |
| chr14_-_33031282 | 0.43 |
ENSRNOT00000043244
|
LOC103693375
|
60S ribosomal protein L39 |
| chr3_-_8852192 | 0.43 |
ENSRNOT00000022786
|
Dolk
|
dolichol kinase |
| chr1_-_164441167 | 0.43 |
ENSRNOT00000023935
|
Rps3
|
ribosomal protein S3 |
| chr2_+_187415262 | 0.42 |
ENSRNOT00000056923
|
Gpatch4
|
G patch domain containing 4 |
| chr20_+_3677474 | 0.42 |
ENSRNOT00000047663
|
Mt1m
|
metallothionein 1M |
| chr7_-_140770647 | 0.42 |
ENSRNOT00000081784
|
C1ql4
|
complement C1q like 4 |
| chr8_-_23014499 | 0.42 |
ENSRNOT00000017820
|
Ccdc151
|
coiled-coil domain containing 151 |
| chr12_-_48316722 | 0.41 |
ENSRNOT00000086231
|
Usp30
|
ubiquitin specific peptidase 30 |
| chr1_-_218657925 | 0.41 |
ENSRNOT00000020425
|
Gal
|
galanin and GMAP prepropeptide |
| chr1_-_179010257 | 0.41 |
ENSRNOT00000017199
|
Rras2
|
related RAS viral (r-ras) oncogene homolog 2 |
| chr10_+_16542882 | 0.41 |
ENSRNOT00000028146
|
Stc2
|
stanniocalcin 2 |
| chr4_+_40004654 | 0.41 |
ENSRNOT00000046350
|
LOC100911252
|
peptidyl-prolyl cis-trans isomerase A-like |
| chr18_+_79406381 | 0.41 |
ENSRNOT00000022303
ENSRNOT00000058295 ENSRNOT00000058296 ENSRNOT00000022280 |
Mbp
|
myelin basic protein |
| chr1_+_89408935 | 0.40 |
ENSRNOT00000075068
|
LOC100909893
|
protein FAM187B-like |
| chr19_-_25955371 | 0.40 |
ENSRNOT00000004042
ENSRNOT00000084123 |
Rad23a
|
RAD23 homolog A, nucleotide excision repair protein |
| chr10_+_55626741 | 0.40 |
ENSRNOT00000008492
|
Aurkb
|
aurora kinase B |
| chr20_+_5351605 | 0.40 |
ENSRNOT00000089306
ENSRNOT00000041590 ENSRNOT00000081240 ENSRNOT00000082538 |
RT1-A1
|
RT1 class Ia, locus A1 |
| chr7_-_121302740 | 0.40 |
ENSRNOT00000067032
|
Rpl3
|
ribosomal protein L3 |
| chr14_-_37763712 | 0.40 |
ENSRNOT00000030610
|
Zar1
|
zygote arrest 1 |
| chr12_-_19159901 | 0.40 |
ENSRNOT00000045401
|
Rpl31l4
|
ribosomal protein L31-like 4 |
| chr1_-_255573377 | 0.39 |
ENSRNOT00000027780
|
Ubbp4
|
ubiquitin B pseudogene 4 |
| chr19_+_49016891 | 0.39 |
ENSRNOT00000016713
|
Dynlrb2
|
dynein light chain roadblock-type 2 |
| chr17_-_53102342 | 0.39 |
ENSRNOT00000073834
|
Psma2
|
proteasome subunit alpha 2 |
| chr7_-_58149061 | 0.39 |
ENSRNOT00000005157
|
Tph2
|
tryptophan hydroxylase 2 |
| chr6_-_92643847 | 0.39 |
ENSRNOT00000009183
|
Pygl
|
glycogen phosphorylase L |
| chr9_-_10441834 | 0.39 |
ENSRNOT00000043704
|
Rpl36
|
ribosomal protein L36 |
| chr20_-_10844178 | 0.39 |
ENSRNOT00000079207
|
Hsf2bp
|
heat shock transcription factor 2 binding protein |
| chr19_-_57333433 | 0.39 |
ENSRNOT00000024917
|
Agt
|
angiotensinogen |
| chr4_+_168752133 | 0.39 |
ENSRNOT00000010289
|
Apold1
|
apolipoprotein L domain containing 1 |
| chr1_+_85380088 | 0.39 |
ENSRNOT00000090129
|
Zfp36
|
zinc finger protein 36 |
| chr5_+_76182121 | 0.39 |
ENSRNOT00000020707
|
Gng10
|
G protein subunit gamma 10 |
| chr12_+_19714324 | 0.38 |
ENSRNOT00000072303
|
RGD1559588
|
similar to cell surface receptor FDFACT |
| chr10_-_44147035 | 0.38 |
ENSRNOT00000041113
|
Olr1424
|
olfactory receptor 1424 |
| chr20_-_12938891 | 0.38 |
ENSRNOT00000017141
|
RGD1564149
|
similar to Protein C21orf58 |
| chr8_-_115167486 | 0.38 |
ENSRNOT00000033018
|
Gpr62
|
G protein-coupled receptor 62 |
| chr16_+_70834957 | 0.38 |
ENSRNOT00000019594
|
Fnta
|
farnesyltransferase, CAAX box, alpha |
| chr6_+_95826546 | 0.38 |
ENSRNOT00000043587
|
AABR07064810.1
|
|
| chr7_-_18577325 | 0.38 |
ENSRNOT00000084308
ENSRNOT00000090849 |
March2
|
membrane associated ring-CH-type finger 2 |
| chr5_+_138354324 | 0.38 |
ENSRNOT00000066742
|
Gm17728
|
predicted gene, 17728 |
| chr10_-_103972668 | 0.38 |
ENSRNOT00000004836
|
Atp5h
|
ATP synthase, H+ transporting, mitochondrial Fo complex, subunit d |
| chr18_-_29504975 | 0.38 |
ENSRNOT00000063841
ENSRNOT00000024313 |
Apbb3
|
amyloid beta precursor protein binding family B member 3 |
| chr7_+_18683553 | 0.38 |
ENSRNOT00000009425
|
Ndufa7
|
NADH:ubiquinone oxidoreductase subunit A7 |
| chr3_-_8315910 | 0.37 |
ENSRNOT00000074482
|
LOC102546892
|
proline-rich protein HaeIII subfamily 1-like |
| chr5_+_171242897 | 0.37 |
ENSRNOT00000032859
|
RGD1304567
|
similar to RIKEN cDNA A430005L14 |
| chr3_+_119805941 | 0.37 |
ENSRNOT00000018584
|
Adra2b
|
adrenoceptor alpha 2B |
| chr1_-_12952906 | 0.37 |
ENSRNOT00000078193
|
LOC100360362
|
hypothetical protein LOC100360362 |
| chr5_-_61410812 | 0.37 |
ENSRNOT00000015270
|
Igfbpl1
|
insulin-like growth factor binding protein-like 1 |
| chr20_+_2004052 | 0.37 |
ENSRNOT00000001008
|
Mog
|
myelin oligodendrocyte glycoprotein |
| chr10_-_15603649 | 0.37 |
ENSRNOT00000051483
|
Hba-a2
|
hemoglobin alpha, adult chain 2 |
| chr10_+_89635675 | 0.37 |
ENSRNOT00000028179
|
RGD1561590
|
similar to SAP18 |
| chr14_-_93042182 | 0.37 |
ENSRNOT00000005432
|
LOC100361025
|
protein arginine methyltransferase 1-like |
| chr10_+_104155805 | 0.37 |
ENSRNOT00000005089
|
Mrps7
|
mitochondrial ribosomal protein S7 |
| chr8_+_48571323 | 0.37 |
ENSRNOT00000059776
|
Ccdc153
|
coiled-coil domain containing 153 |
| chr13_+_36532758 | 0.36 |
ENSRNOT00000083007
|
En1
|
engrailed 1 |
| chr2_+_140708397 | 0.36 |
ENSRNOT00000088846
|
Mgst2
|
microsomal glutathione S-transferase 2 |
| chrX_-_124516705 | 0.36 |
ENSRNOT00000061493
|
LOC108348144
|
NADH dehydrogenase [ubiquinone] 1 alpha subcomplex subunit 1 |
| chrX_+_77885586 | 0.36 |
ENSRNOT00000034329
|
RGD1560821
|
similar to small nuclear ribonucleoparticle-associated protein |
| chr5_-_154438361 | 0.36 |
ENSRNOT00000085003
|
AC141344.2
|
|
| chr15_+_33069382 | 0.36 |
ENSRNOT00000060193
|
Mrpl52
|
mitochondrial ribosomal protein L52 |
| chr19_+_25946979 | 0.36 |
ENSRNOT00000004027
|
Gadd45gip1
|
GADD45G interacting protein 1 |
| chr10_+_85257876 | 0.36 |
ENSRNOT00000014752
|
Mrpl45
|
mitochondrial ribosomal protein L45 |
| chr19_+_39357791 | 0.36 |
ENSRNOT00000086435
ENSRNOT00000015006 |
Cyb5b
|
cytochrome b5 type B |
| chr11_+_77815181 | 0.36 |
ENSRNOT00000002640
|
Cldn1
|
claudin 1 |
| chr9_-_101107535 | 0.36 |
ENSRNOT00000080892
ENSRNOT00000071424 |
LOC100911516
|
coiled-coil-helix-coiled-coil-helix domain-containing protein 2, mitochondrial-like |
| chr20_+_1889652 | 0.36 |
ENSRNOT00000068508
ENSRNOT00000000996 |
Olr1746
|
olfactory receptor 1746 |
| chr14_+_24129592 | 0.36 |
ENSRNOT00000040647
|
LOC689899
|
similar to 60S ribosomal protein L23a |
| chrX_-_123806736 | 0.35 |
ENSRNOT00000092639
ENSRNOT00000081761 |
Ndufa1
|
NADH:ubiquinone oxidoreductase subunit A1 |
| chrX_-_32355296 | 0.35 |
ENSRNOT00000081652
ENSRNOT00000065075 |
Ap1s2
|
adaptor-related protein complex 1, sigma 2 subunit |
| chr9_-_10897240 | 0.35 |
ENSRNOT00000074502
|
Tnfaip8l1
|
TNF alpha induced protein 8 like 1 |
| chr5_-_59152599 | 0.35 |
ENSRNOT00000021387
|
Hint2
|
histidine triad nucleotide binding protein 2 |
| chr4_+_67378188 | 0.35 |
ENSRNOT00000030892
|
Ndufb2
|
NADH:ubiquinone oxidoreductase subunit B2 |
| chr18_-_6587080 | 0.35 |
ENSRNOT00000040815
|
LOC103694404
|
60S ribosomal protein L39 |
| chr10_-_96015499 | 0.35 |
ENSRNOT00000004383
|
Cacng4
|
calcium voltage-gated channel auxiliary subunit gamma 4 |
| chr1_+_211205903 | 0.35 |
ENSRNOT00000023139
|
Ppp2r2d
|
protein phosphatase 2, regulatory subunit B, delta |
| chr1_-_81846804 | 0.35 |
ENSRNOT00000027435
|
Rabac1
|
Rab acceptor 1 |
| chr20_+_46044892 | 0.35 |
ENSRNOT00000057187
|
Ak9
|
adenylate kinase 9 |
| chr4_-_181486090 | 0.34 |
ENSRNOT00000075453
|
AABR07062535.1
|
|
| chr2_+_198390166 | 0.34 |
ENSRNOT00000081042
|
Hist2h3c2
|
histone cluster 2, H3c2 |
| chrX_+_123806918 | 0.34 |
ENSRNOT00000082045
|
LOC108348079
|
RING finger protein 113A-like |
| chrX_+_20520034 | 0.34 |
ENSRNOT00000093170
|
FAM120C
|
family with sequence similarity 120C |
| chr8_+_67753279 | 0.34 |
ENSRNOT00000009716
|
Calml4
|
calmodulin-like 4 |
| chr12_-_48627297 | 0.34 |
ENSRNOT00000000890
|
Iscu
|
iron-sulfur cluster assembly enzyme |
| chr1_-_219369587 | 0.34 |
ENSRNOT00000000599
|
Aip
|
aryl-hydrocarbon receptor-interacting protein |
| chr2_+_205160405 | 0.33 |
ENSRNOT00000035605
|
Tspan2
|
tetraspanin 2 |
| chr7_-_130350570 | 0.33 |
ENSRNOT00000055805
|
Odf3b
|
outer dense fiber of sperm tails 3B |
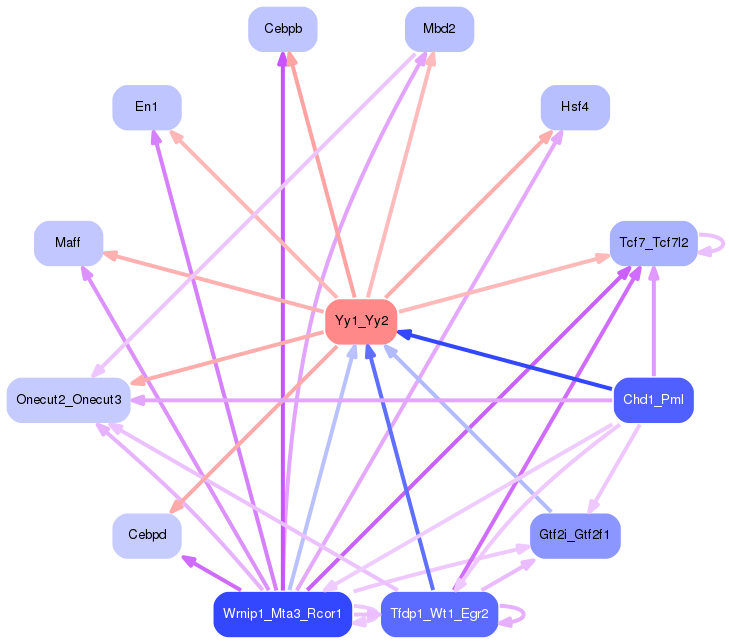
Network of associatons between targets according to the STRING database.

First level regulatory network of Yy1_Yy2
Gene Ontology Analysis
Gene overrepresentation in biological process category:
| Log-likelihood per target | Total log-likelihood | Term | Description |
|---|---|---|---|
| 0.8 | 3.1 | GO:0002125 | maternal aggressive behavior(GO:0002125) |
| 0.6 | 1.7 | GO:0060974 | cell migration involved in heart formation(GO:0060974) |
| 0.4 | 3.9 | GO:0015671 | oxygen transport(GO:0015671) |
| 0.4 | 1.1 | GO:0051867 | general adaptation syndrome, behavioral process(GO:0051867) |
| 0.3 | 0.9 | GO:1901662 | phylloquinone metabolic process(GO:0042374) phylloquinone catabolic process(GO:0042376) quinone catabolic process(GO:1901662) |
| 0.3 | 1.4 | GO:0051970 | negative regulation of transmission of nerve impulse(GO:0051970) |
| 0.2 | 0.7 | GO:2000097 | regulation of smooth muscle cell-matrix adhesion(GO:2000097) |
| 0.2 | 0.7 | GO:0003330 | regulation of extracellular matrix constituent secretion(GO:0003330) positive regulation of extracellular matrix constituent secretion(GO:0003331) |
| 0.2 | 0.7 | GO:0002432 | granuloma formation(GO:0002432) |
| 0.2 | 0.7 | GO:1902309 | negative regulation of peptidyl-serine dephosphorylation(GO:1902309) |
| 0.2 | 1.2 | GO:2000851 | positive regulation of glucocorticoid secretion(GO:2000851) |
| 0.2 | 1.3 | GO:2000503 | positive regulation of natural killer cell chemotaxis(GO:2000503) |
| 0.2 | 0.6 | GO:0060697 | positive regulation of phospholipid catabolic process(GO:0060697) |
| 0.2 | 0.7 | GO:0006114 | glycerol biosynthetic process(GO:0006114) |
| 0.2 | 0.7 | GO:0009972 | cytidine catabolic process(GO:0006216) cytidine deamination(GO:0009972) cytidine metabolic process(GO:0046087) |
| 0.2 | 0.7 | GO:0043988 | histone H3-S28 phosphorylation(GO:0043988) |
| 0.2 | 0.5 | GO:0006121 | mitochondrial electron transport, succinate to ubiquinone(GO:0006121) |
| 0.2 | 0.5 | GO:0061146 | Peyer's patch morphogenesis(GO:0061146) |
| 0.2 | 0.7 | GO:1903413 | cellular response to bile acid(GO:1903413) |
| 0.2 | 0.5 | GO:0009182 | purine deoxyribonucleoside diphosphate metabolic process(GO:0009182) dGDP metabolic process(GO:0046066) |
| 0.2 | 0.8 | GO:0031536 | positive regulation of exit from mitosis(GO:0031536) |
| 0.2 | 0.5 | GO:0061732 | mitochondrial acetyl-CoA biosynthetic process from pyruvate(GO:0061732) |
| 0.2 | 0.5 | GO:0071038 | nuclear mRNA surveillance of mRNA 3'-end processing(GO:0071031) nuclear polyadenylation-dependent tRNA catabolic process(GO:0071038) nuclear retention of pre-mRNA with aberrant 3'-ends at the site of transcription(GO:0071049) |
| 0.2 | 0.6 | GO:0046351 | disaccharide biosynthetic process(GO:0046351) |
| 0.2 | 0.6 | GO:0002654 | positive regulation of tolerance induction dependent upon immune response(GO:0002654) |
| 0.2 | 0.5 | GO:2000338 | chemokine (C-X-C motif) ligand 1 production(GO:0072566) regulation of chemokine (C-X-C motif) ligand 1 production(GO:2000338) |
| 0.1 | 0.4 | GO:0018343 | protein farnesylation(GO:0018343) |
| 0.1 | 0.4 | GO:1901227 | negative regulation of transcription from RNA polymerase II promoter involved in heart development(GO:1901227) |
| 0.1 | 0.6 | GO:0014057 | positive regulation of acetylcholine secretion, neurotransmission(GO:0014057) |
| 0.1 | 0.4 | GO:1904569 | regulation of selenocysteine incorporation(GO:1904569) |
| 0.1 | 0.4 | GO:0034436 | glycoprotein transport(GO:0034436) |
| 0.1 | 0.4 | GO:1902544 | regulation of DNA N-glycosylase activity(GO:1902544) |
| 0.1 | 0.4 | GO:1900158 | regulation of chondrocyte development(GO:0061181) negative regulation of bone mineralization involved in bone maturation(GO:1900158) |
| 0.1 | 0.6 | GO:0046391 | 5-phosphoribose 1-diphosphate biosynthetic process(GO:0006015) 5-phosphoribose 1-diphosphate metabolic process(GO:0046391) |
| 0.1 | 0.4 | GO:0046222 | toxin catabolic process(GO:0009407) mycotoxin metabolic process(GO:0043385) mycotoxin catabolic process(GO:0043387) aflatoxin metabolic process(GO:0046222) aflatoxin catabolic process(GO:0046223) secondary metabolite catabolic process(GO:0090487) organic heteropentacyclic compound metabolic process(GO:1901376) organic heteropentacyclic compound catabolic process(GO:1901377) |
| 0.1 | 0.4 | GO:1904207 | regulation of chemokine (C-C motif) ligand 2 secretion(GO:1904207) positive regulation of chemokine (C-C motif) ligand 2 secretion(GO:1904209) positive regulation of metalloendopeptidase activity(GO:1904685) |
| 0.1 | 1.1 | GO:0034551 | respiratory chain complex III assembly(GO:0017062) mitochondrial respiratory chain complex III assembly(GO:0034551) |
| 0.1 | 1.2 | GO:0070327 | thyroid hormone transport(GO:0070327) |
| 0.1 | 0.7 | GO:0046687 | response to chromate(GO:0046687) |
| 0.1 | 0.4 | GO:1903348 | positive regulation of bicellular tight junction assembly(GO:1903348) |
| 0.1 | 0.4 | GO:0050828 | regulation of liquid surface tension(GO:0050828) |
| 0.1 | 0.4 | GO:0045085 | negative regulation of interleukin-2 biosynthetic process(GO:0045085) |
| 0.1 | 0.5 | GO:0042776 | mitochondrial ATP synthesis coupled proton transport(GO:0042776) |
| 0.1 | 0.5 | GO:0014724 | regulation of twitch skeletal muscle contraction(GO:0014724) |
| 0.1 | 0.6 | GO:0032707 | negative regulation of interleukin-23 production(GO:0032707) |
| 0.1 | 0.4 | GO:0034475 | U4 snRNA 3'-end processing(GO:0034475) polyadenylation-dependent snoRNA 3'-end processing(GO:0071051) |
| 0.1 | 0.5 | GO:0051344 | negative regulation of cyclic-nucleotide phosphodiesterase activity(GO:0051344) |
| 0.1 | 0.4 | GO:1902445 | regulation of mitochondrial membrane permeability involved in programmed necrotic cell death(GO:1902445) |
| 0.1 | 0.4 | GO:0044209 | AMP salvage(GO:0044209) |
| 0.1 | 0.2 | GO:0071298 | cellular response to L-ascorbic acid(GO:0071298) |
| 0.1 | 0.5 | GO:0006616 | SRP-dependent cotranslational protein targeting to membrane, translocation(GO:0006616) |
| 0.1 | 0.4 | GO:1990091 | sodium-dependent self proteolysis(GO:1990091) |
| 0.1 | 0.5 | GO:0000957 | mitochondrial RNA catabolic process(GO:0000957) regulation of mitochondrial RNA catabolic process(GO:0000960) |
| 0.1 | 0.3 | GO:0070948 | regulation of neutrophil mediated cytotoxicity(GO:0070948) regulation of neutrophil mediated killing of symbiont cell(GO:0070949) |
| 0.1 | 0.1 | GO:0061740 | protein targeting to lysosome involved in chaperone-mediated autophagy(GO:0061740) |
| 0.1 | 0.3 | GO:1903769 | negative regulation of cell proliferation in bone marrow(GO:1903769) |
| 0.1 | 0.3 | GO:0035606 | peptidyl-cysteine S-trans-nitrosylation(GO:0035606) |
| 0.1 | 0.8 | GO:0097428 | protein maturation by iron-sulfur cluster transfer(GO:0097428) |
| 0.1 | 0.3 | GO:0048619 | embryonic hindgut morphogenesis(GO:0048619) |
| 0.1 | 0.3 | GO:0060671 | epithelial cell differentiation involved in embryonic placenta development(GO:0060671) epithelial cell morphogenesis involved in placental branching(GO:0060672) |
| 0.1 | 0.2 | GO:0035697 | CD8-positive, alpha-beta T cell extravasation(GO:0035697) |
| 0.1 | 0.1 | GO:1902024 | histidine transport(GO:0015817) L-histidine transmembrane transport(GO:0089709) L-histidine transport(GO:1902024) |
| 0.1 | 0.4 | GO:1902626 | assembly of large subunit precursor of preribosome(GO:1902626) |
| 0.1 | 0.4 | GO:0035927 | RNA import into mitochondrion(GO:0035927) |
| 0.1 | 0.3 | GO:0014916 | regulation of lung blood pressure(GO:0014916) |
| 0.1 | 0.8 | GO:0014063 | negative regulation of serotonin secretion(GO:0014063) |
| 0.1 | 0.5 | GO:0061743 | motor learning(GO:0061743) |
| 0.1 | 0.4 | GO:0090204 | protein localization to nuclear pore(GO:0090204) |
| 0.1 | 0.3 | GO:0035565 | regulation of pronephros size(GO:0035565) |
| 0.1 | 0.3 | GO:0000053 | argininosuccinate metabolic process(GO:0000053) |
| 0.1 | 0.1 | GO:2000501 | natural killer cell chemotaxis(GO:0035747) regulation of natural killer cell chemotaxis(GO:2000501) |
| 0.1 | 0.4 | GO:0002023 | reduction of food intake in response to dietary excess(GO:0002023) |
| 0.1 | 2.9 | GO:0000028 | ribosomal small subunit assembly(GO:0000028) |
| 0.1 | 0.6 | GO:1901162 | serotonin biosynthetic process(GO:0042427) primary amino compound biosynthetic process(GO:1901162) |
| 0.1 | 0.3 | GO:0032380 | regulation of intracellular lipid transport(GO:0032377) regulation of intracellular sterol transport(GO:0032380) regulation of intracellular cholesterol transport(GO:0032383) |
| 0.1 | 0.5 | GO:0034486 | vacuolar transmembrane transport(GO:0034486) chaperone-mediated protein transport involved in chaperone-mediated autophagy(GO:0061741) |
| 0.1 | 0.2 | GO:0048294 | negative regulation of isotype switching to IgE isotypes(GO:0048294) |
| 0.1 | 0.4 | GO:0071883 | receptor transactivation(GO:0035624) epidermal growth factor-activated receptor transactivation by G-protein coupled receptor signaling pathway(GO:0035625) activation of MAPK activity by adrenergic receptor signaling pathway(GO:0071883) |
| 0.1 | 0.9 | GO:0006123 | mitochondrial electron transport, cytochrome c to oxygen(GO:0006123) |
| 0.1 | 0.4 | GO:0044313 | protein K6-linked deubiquitination(GO:0044313) |
| 0.1 | 0.3 | GO:0002397 | MHC class I protein complex assembly(GO:0002397) |
| 0.1 | 0.3 | GO:0090283 | regulation of protein glycosylation in Golgi(GO:0090283) |
| 0.1 | 0.4 | GO:0033277 | abortive mitotic cell cycle(GO:0033277) |
| 0.1 | 0.1 | GO:0014738 | regulation of muscle hyperplasia(GO:0014738) muscle hyperplasia(GO:0014900) |
| 0.1 | 0.3 | GO:0002254 | kinin cascade(GO:0002254) plasma kallikrein-kinin cascade(GO:0002353) |
| 0.1 | 0.3 | GO:0006663 | platelet activating factor biosynthetic process(GO:0006663) |
| 0.1 | 0.3 | GO:0042536 | negative regulation of tumor necrosis factor biosynthetic process(GO:0042536) |
| 0.1 | 0.3 | GO:0001788 | antibody-dependent cellular cytotoxicity(GO:0001788) |
| 0.1 | 0.3 | GO:0035964 | COPI-coated vesicle budding(GO:0035964) |
| 0.1 | 0.2 | GO:1903860 | negative regulation of dendrite extension(GO:1903860) |
| 0.1 | 0.8 | GO:0006122 | mitochondrial electron transport, ubiquinol to cytochrome c(GO:0006122) |
| 0.1 | 0.2 | GO:0071461 | cellular response to redox state(GO:0071461) |
| 0.1 | 0.2 | GO:0090191 | negative regulation of branching involved in ureteric bud morphogenesis(GO:0090191) |
| 0.1 | 0.2 | GO:1901163 | regulation of trophoblast cell migration(GO:1901163) |
| 0.1 | 0.3 | GO:0006538 | glutamate catabolic process(GO:0006538) |
| 0.1 | 0.3 | GO:0035511 | oxidative DNA demethylation(GO:0035511) |
| 0.1 | 0.6 | GO:0007253 | cytoplasmic sequestering of NF-kappaB(GO:0007253) |
| 0.1 | 0.4 | GO:0016259 | selenocysteine metabolic process(GO:0016259) |
| 0.1 | 0.2 | GO:0070368 | positive regulation of hepatocyte differentiation(GO:0070368) |
| 0.1 | 0.5 | GO:0060235 | lens induction in camera-type eye(GO:0060235) |
| 0.1 | 0.5 | GO:0006102 | isocitrate metabolic process(GO:0006102) |
| 0.1 | 2.1 | GO:0015986 | energy coupled proton transport, down electrochemical gradient(GO:0015985) ATP synthesis coupled proton transport(GO:0015986) |
| 0.1 | 0.2 | GO:1901165 | positive regulation of trophoblast cell migration(GO:1901165) |
| 0.1 | 0.2 | GO:0033861 | negative regulation of NAD(P)H oxidase activity(GO:0033861) |
| 0.1 | 0.9 | GO:0006465 | signal peptide processing(GO:0006465) |
| 0.1 | 1.0 | GO:0033617 | mitochondrial respiratory chain complex IV assembly(GO:0033617) |
| 0.1 | 0.2 | GO:0001998 | angiotensin mediated vasoconstriction involved in regulation of systemic arterial blood pressure(GO:0001998) |
| 0.1 | 0.2 | GO:0006788 | heme oxidation(GO:0006788) |
| 0.1 | 0.2 | GO:0071847 | TNFSF11-mediated signaling pathway(GO:0071847) |
| 0.1 | 0.2 | GO:1902996 | regulation of neuronal signal transduction(GO:1902847) positive regulation of tau-protein kinase activity(GO:1902949) neurofibrillary tangle assembly(GO:1902988) regulation of neurofibrillary tangle assembly(GO:1902996) positive regulation of neurofibrillary tangle assembly(GO:1902998) |
| 0.1 | 0.2 | GO:0033123 | positive regulation of purine nucleotide catabolic process(GO:0033123) |
| 0.1 | 0.5 | GO:1904923 | regulation of mitophagy in response to mitochondrial depolarization(GO:1904923) |
| 0.1 | 0.1 | GO:0014718 | positive regulation of satellite cell activation involved in skeletal muscle regeneration(GO:0014718) |
| 0.1 | 0.2 | GO:0071350 | interleukin-15-mediated signaling pathway(GO:0035723) cellular response to interleukin-15(GO:0071350) |
| 0.1 | 0.5 | GO:0097577 | intracellular sequestering of iron ion(GO:0006880) sequestering of iron ion(GO:0097577) |
| 0.1 | 0.4 | GO:1902255 | positive regulation of intrinsic apoptotic signaling pathway by p53 class mediator(GO:1902255) |
| 0.1 | 0.2 | GO:0007468 | regulation of rhodopsin gene expression(GO:0007468) |
| 0.1 | 0.4 | GO:0043144 | snoRNA processing(GO:0043144) |
| 0.1 | 0.2 | GO:0007493 | endodermal cell fate determination(GO:0007493) |
| 0.1 | 0.4 | GO:0045039 | protein import into mitochondrial inner membrane(GO:0045039) |
| 0.1 | 0.2 | GO:0018201 | peptidyl-glycine modification(GO:0018201) |
| 0.1 | 0.2 | GO:1902167 | positive regulation of intrinsic apoptotic signaling pathway in response to DNA damage by p53 class mediator(GO:1902167) |
| 0.1 | 0.2 | GO:0019230 | proprioception(GO:0019230) |
| 0.1 | 0.8 | GO:0000338 | protein deneddylation(GO:0000338) |
| 0.1 | 0.4 | GO:0030222 | eosinophil differentiation(GO:0030222) |
| 0.1 | 0.2 | GO:0007181 | transforming growth factor beta receptor complex assembly(GO:0007181) |
| 0.1 | 0.6 | GO:0035542 | regulation of SNARE complex assembly(GO:0035542) |
| 0.1 | 0.1 | GO:0046086 | adenosine biosynthetic process(GO:0046086) |
| 0.1 | 0.1 | GO:1904585 | response to putrescine(GO:1904585) cellular response to putrescine(GO:1904586) |
| 0.1 | 0.4 | GO:0051231 | spindle elongation(GO:0051231) |
| 0.1 | 0.3 | GO:0035502 | metanephric part of ureteric bud development(GO:0035502) |
| 0.1 | 0.2 | GO:0072144 | glomerular mesangial cell development(GO:0072144) |
| 0.1 | 0.2 | GO:0036112 | medium-chain fatty-acyl-CoA metabolic process(GO:0036112) fatty-acyl-CoA catabolic process(GO:0036115) |
| 0.1 | 0.3 | GO:1904401 | cellular response to Thyroid stimulating hormone(GO:1904401) |
| 0.1 | 0.2 | GO:0060392 | negative regulation of SMAD protein import into nucleus(GO:0060392) |
| 0.1 | 0.3 | GO:1902416 | positive regulation of mRNA binding(GO:1902416) |
| 0.1 | 1.1 | GO:0001731 | formation of translation preinitiation complex(GO:0001731) |
| 0.1 | 0.2 | GO:0046947 | hydroxylysine metabolic process(GO:0046946) hydroxylysine biosynthetic process(GO:0046947) |
| 0.1 | 0.2 | GO:1901252 | regulation of intracellular transport of viral material(GO:1901252) |
| 0.1 | 0.1 | GO:0070966 | nuclear-transcribed mRNA catabolic process, no-go decay(GO:0070966) |
| 0.1 | 0.1 | GO:0002143 | tRNA wobble position uridine thiolation(GO:0002143) |
| 0.1 | 0.1 | GO:0032499 | detection of peptidoglycan(GO:0032499) |
| 0.1 | 0.2 | GO:0006651 | diacylglycerol biosynthetic process(GO:0006651) |
| 0.1 | 1.7 | GO:0006335 | DNA replication-dependent nucleosome assembly(GO:0006335) DNA replication-dependent nucleosome organization(GO:0034723) |
| 0.1 | 0.5 | GO:0090080 | positive regulation of MAPKKK cascade by fibroblast growth factor receptor signaling pathway(GO:0090080) |
| 0.1 | 0.6 | GO:0090151 | establishment of protein localization to mitochondrial membrane(GO:0090151) |
| 0.1 | 0.3 | GO:0090131 | mesenchyme migration(GO:0090131) |
| 0.1 | 0.1 | GO:2000157 | regulation of protein K48-linked deubiquitination(GO:1903093) negative regulation of protein K48-linked deubiquitination(GO:1903094) negative regulation of ubiquitin-specific protease activity(GO:2000157) |
| 0.1 | 0.2 | GO:1902071 | regulation of hypoxia-inducible factor-1alpha signaling pathway(GO:1902071) |
| 0.1 | 0.2 | GO:0023041 | neuronal signal transduction(GO:0023041) |
| 0.1 | 0.2 | GO:0006408 | snRNA export from nucleus(GO:0006408) |
| 0.1 | 0.1 | GO:0009441 | glycolate metabolic process(GO:0009441) |
| 0.1 | 0.1 | GO:0043179 | rhythmic excitation(GO:0043179) |
| 0.1 | 0.2 | GO:1900060 | negative regulation of ceramide biosynthetic process(GO:1900060) |
| 0.1 | 0.3 | GO:0061030 | epithelial cell differentiation involved in mammary gland alveolus development(GO:0061030) |
| 0.1 | 0.3 | GO:1900620 | acetylcholine biosynthetic process(GO:0008292) acetate ester biosynthetic process(GO:1900620) |
| 0.1 | 0.2 | GO:0006933 | negative regulation of cell adhesion involved in substrate-bound cell migration(GO:0006933) |
| 0.1 | 0.3 | GO:1903333 | regulation of protein refolding(GO:0061083) negative regulation of protein refolding(GO:0061084) negative regulation of protein folding(GO:1903333) |
| 0.1 | 0.4 | GO:0019919 | peptidyl-arginine methylation, to asymmetrical-dimethyl arginine(GO:0019919) |
| 0.1 | 0.1 | GO:1904975 | response to bleomycin(GO:1904975) |
| 0.1 | 5.3 | GO:0050911 | detection of chemical stimulus involved in sensory perception of smell(GO:0050911) |
| 0.1 | 0.2 | GO:0021678 | third ventricle development(GO:0021678) |
| 0.1 | 0.2 | GO:2000313 | fibroblast growth factor receptor signaling pathway involved in neural plate anterior/posterior pattern formation(GO:0060825) regulation of fibroblast growth factor receptor signaling pathway involved in neural plate anterior/posterior pattern formation(GO:2000313) |
| 0.1 | 0.1 | GO:0097034 | mitochondrial respiratory chain complex IV biogenesis(GO:0097034) |
| 0.1 | 0.1 | GO:0039019 | pronephric nephron development(GO:0039019) |
| 0.1 | 0.1 | GO:0071874 | cellular response to norepinephrine stimulus(GO:0071874) |
| 0.1 | 0.2 | GO:0006713 | glucocorticoid catabolic process(GO:0006713) |
| 0.1 | 0.1 | GO:1904059 | regulation of locomotor rhythm(GO:1904059) |
| 0.1 | 0.1 | GO:0070370 | cellular heat acclimation(GO:0070370) |
| 0.1 | 0.2 | GO:1902308 | regulation of peptidyl-serine dephosphorylation(GO:1902308) |
| 0.1 | 0.2 | GO:0032057 | negative regulation of translational initiation in response to stress(GO:0032057) response to manganese-induced endoplasmic reticulum stress(GO:1990737) |
| 0.1 | 0.2 | GO:0019348 | dolichol metabolic process(GO:0019348) |
| 0.1 | 0.1 | GO:0006532 | aspartate biosynthetic process(GO:0006532) |
| 0.1 | 0.2 | GO:0042412 | taurine biosynthetic process(GO:0042412) |
| 0.1 | 0.2 | GO:0015879 | carnitine transport(GO:0015879) |
| 0.1 | 0.2 | GO:2001206 | positive regulation of osteoclast development(GO:2001206) |
| 0.1 | 0.2 | GO:0031989 | bombesin receptor signaling pathway(GO:0031989) |
| 0.1 | 0.2 | GO:0019287 | isopentenyl diphosphate biosynthetic process, mevalonate pathway(GO:0019287) |
| 0.1 | 0.4 | GO:0042420 | dopamine catabolic process(GO:0042420) |
| 0.1 | 0.1 | GO:1905168 | positive regulation of double-strand break repair via homologous recombination(GO:1905168) |
| 0.1 | 0.2 | GO:0006480 | N-terminal protein amino acid methylation(GO:0006480) |
| 0.1 | 0.2 | GO:0015793 | glycerol transport(GO:0015793) |
| 0.1 | 0.1 | GO:0003129 | heart induction(GO:0003129) BMP signaling pathway involved in heart induction(GO:0003130) endodermal-mesodermal cell signaling(GO:0003133) endodermal-mesodermal cell signaling involved in heart induction(GO:0003134) |
| 0.1 | 0.1 | GO:2000628 | regulation of miRNA metabolic process(GO:2000628) |
| 0.1 | 0.1 | GO:1990523 | bone regeneration(GO:1990523) |
| 0.1 | 0.2 | GO:0045105 | intermediate filament polymerization or depolymerization(GO:0045105) |
| 0.1 | 0.1 | GO:1903377 | negative regulation of oxidative stress-induced neuron intrinsic apoptotic signaling pathway(GO:1903377) |
| 0.1 | 0.3 | GO:0060574 | intestinal epithelial cell maturation(GO:0060574) |
| 0.1 | 0.1 | GO:2000978 | negative regulation of forebrain neuron differentiation(GO:2000978) |
| 0.1 | 0.1 | GO:0032286 | central nervous system myelin maintenance(GO:0032286) |
| 0.1 | 0.6 | GO:0006488 | dolichol-linked oligosaccharide biosynthetic process(GO:0006488) |
| 0.1 | 0.2 | GO:0090074 | negative regulation of protein homodimerization activity(GO:0090074) |
| 0.1 | 0.7 | GO:0048711 | positive regulation of astrocyte differentiation(GO:0048711) |
| 0.1 | 0.3 | GO:0072513 | positive regulation of secondary heart field cardioblast proliferation(GO:0072513) |
| 0.1 | 0.3 | GO:0002036 | regulation of L-glutamate transport(GO:0002036) |
| 0.1 | 0.3 | GO:0007042 | lysosomal lumen acidification(GO:0007042) |
| 0.1 | 0.2 | GO:0042560 | folic acid-containing compound catabolic process(GO:0009397) pteridine-containing compound catabolic process(GO:0042560) |
| 0.1 | 0.2 | GO:0000429 | carbon catabolite regulation of transcription from RNA polymerase II promoter(GO:0000429) carbon catabolite activation of transcription from RNA polymerase II promoter(GO:0000436) |
| 0.1 | 0.2 | GO:0009106 | lipoate metabolic process(GO:0009106) |
| 0.1 | 0.1 | GO:0042668 | auditory receptor cell fate determination(GO:0042668) |
| 0.1 | 0.8 | GO:0043248 | proteasome assembly(GO:0043248) |
| 0.1 | 1.3 | GO:0000027 | ribosomal large subunit assembly(GO:0000027) |
| 0.1 | 0.2 | GO:0048239 | negative regulation of DNA recombination at telomere(GO:0048239) regulation of DNA recombination at telomere(GO:0072695) |
| 0.1 | 0.8 | GO:0030497 | fatty acid elongation(GO:0030497) |
| 0.1 | 0.2 | GO:0090234 | regulation of kinetochore assembly(GO:0090234) |
| 0.1 | 0.2 | GO:0044375 | regulation of peroxisome size(GO:0044375) |
| 0.1 | 0.2 | GO:0007386 | compartment pattern specification(GO:0007386) |
| 0.1 | 0.2 | GO:0045903 | positive regulation of translational fidelity(GO:0045903) |
| 0.1 | 0.1 | GO:0071663 | granzyme B production(GO:0071613) regulation of granzyme B production(GO:0071661) positive regulation of granzyme B production(GO:0071663) |
| 0.1 | 0.4 | GO:0006621 | protein retention in ER lumen(GO:0006621) |
| 0.1 | 0.2 | GO:0002424 | T cell mediated immune response to tumor cell(GO:0002424) regulation of T cell mediated immune response to tumor cell(GO:0002840) |
| 0.0 | 0.1 | GO:1903903 | regulation of establishment of T cell polarity(GO:1903903) |
| 0.0 | 0.4 | GO:0048935 | peripheral nervous system neuron differentiation(GO:0048934) peripheral nervous system neuron development(GO:0048935) |
| 0.0 | 0.1 | GO:0050883 | musculoskeletal movement, spinal reflex action(GO:0050883) |
| 0.0 | 0.2 | GO:0071694 | protein localization to extracellular region(GO:0071692) maintenance of protein location in extracellular region(GO:0071694) |
| 0.0 | 0.2 | GO:0032365 | intracellular lipid transport(GO:0032365) |
| 0.0 | 0.5 | GO:2000042 | negative regulation of double-strand break repair via homologous recombination(GO:2000042) |
| 0.0 | 0.3 | GO:0010898 | positive regulation of triglyceride catabolic process(GO:0010898) |
| 0.0 | 0.0 | GO:0033629 | negative regulation of cell adhesion mediated by integrin(GO:0033629) |
| 0.0 | 0.2 | GO:0030382 | sperm mitochondrion organization(GO:0030382) |
| 0.0 | 0.3 | GO:0019509 | L-methionine biosynthetic process from methylthioadenosine(GO:0019509) |
| 0.0 | 0.4 | GO:0061621 | NADH regeneration(GO:0006735) canonical glycolysis(GO:0061621) glucose catabolic process to pyruvate(GO:0061718) |
| 0.0 | 0.1 | GO:0034241 | positive regulation of macrophage fusion(GO:0034241) |
| 0.0 | 0.2 | GO:0075525 | viral translational termination-reinitiation(GO:0075525) |
| 0.0 | 0.1 | GO:1900039 | positive regulation of cellular response to hypoxia(GO:1900039) |
| 0.0 | 0.2 | GO:0090666 | scaRNA localization to Cajal body(GO:0090666) |
| 0.0 | 0.2 | GO:0035694 | mitochondrial protein catabolic process(GO:0035694) |
| 0.0 | 0.3 | GO:0098887 | neurotransmitter receptor transport, endosome to postsynaptic membrane(GO:0098887) |
| 0.0 | 0.5 | GO:1903862 | positive regulation of oxidative phosphorylation(GO:1903862) |
| 0.0 | 0.1 | GO:0006670 | sphingosine metabolic process(GO:0006670) |
| 0.0 | 0.0 | GO:0099639 | neurotransmitter receptor transport, endosome to plasma membrane(GO:0099639) |
| 0.0 | 0.2 | GO:0051005 | negative regulation of lipoprotein lipase activity(GO:0051005) |
| 0.0 | 0.3 | GO:0006598 | polyamine catabolic process(GO:0006598) |
| 0.0 | 0.1 | GO:2000342 | negative regulation of chemokine (C-X-C motif) ligand 2 production(GO:2000342) |
| 0.0 | 0.4 | GO:0007021 | tubulin complex assembly(GO:0007021) |
| 0.0 | 0.1 | GO:1904350 | protein catabolic process in the vacuole(GO:0007039) regulation of protein catabolic process in the vacuole(GO:1904350) |
| 0.0 | 0.1 | GO:0071163 | DNA replication preinitiation complex assembly(GO:0071163) |
| 0.0 | 0.1 | GO:0034227 | tRNA thio-modification(GO:0034227) |
| 0.0 | 0.4 | GO:0051665 | membrane raft localization(GO:0051665) |
| 0.0 | 0.1 | GO:0070900 | mitochondrial tRNA modification(GO:0070900) mitochondrial RNA modification(GO:1900864) |
| 0.0 | 0.1 | GO:0018094 | protein polyglycylation(GO:0018094) |
| 0.0 | 0.3 | GO:0071569 | protein ufmylation(GO:0071569) |
| 0.0 | 0.1 | GO:0002434 | immune complex clearance(GO:0002434) |
| 0.0 | 0.4 | GO:0043402 | glucocorticoid mediated signaling pathway(GO:0043402) |
| 0.0 | 0.1 | GO:2000909 | regulation of cholesterol import(GO:0060620) regulation of sterol import(GO:2000909) |
| 0.0 | 0.5 | GO:0002361 | CD4-positive, CD25-positive, alpha-beta regulatory T cell differentiation(GO:0002361) |
| 0.0 | 0.5 | GO:0034975 | protein folding in endoplasmic reticulum(GO:0034975) |
| 0.0 | 0.0 | GO:0002652 | regulation of tolerance induction dependent upon immune response(GO:0002652) |
| 0.0 | 0.2 | GO:0009804 | coumarin metabolic process(GO:0009804) |
| 0.0 | 0.3 | GO:0071638 | negative regulation of monocyte chemotactic protein-1 production(GO:0071638) |
| 0.0 | 0.2 | GO:0007341 | penetration of zona pellucida(GO:0007341) |
| 0.0 | 0.1 | GO:0006710 | androgen catabolic process(GO:0006710) |
| 0.0 | 0.2 | GO:0090403 | oxidative stress-induced premature senescence(GO:0090403) |
| 0.0 | 0.3 | GO:0030579 | ubiquitin-dependent SMAD protein catabolic process(GO:0030579) |
| 0.0 | 0.3 | GO:1901374 | acetate ester transport(GO:1901374) |
| 0.0 | 0.2 | GO:0019236 | response to pheromone(GO:0019236) |
| 0.0 | 0.5 | GO:0001778 | plasma membrane repair(GO:0001778) |
| 0.0 | 0.7 | GO:0032981 | NADH dehydrogenase complex assembly(GO:0010257) mitochondrial respiratory chain complex I assembly(GO:0032981) mitochondrial respiratory chain complex I biogenesis(GO:0097031) |
| 0.0 | 0.2 | GO:0071543 | diadenosine polyphosphate catabolic process(GO:0015961) diphosphoinositol polyphosphate metabolic process(GO:0071543) diadenosine pentaphosphate metabolic process(GO:1901906) diadenosine pentaphosphate catabolic process(GO:1901907) diadenosine hexaphosphate metabolic process(GO:1901908) diadenosine hexaphosphate catabolic process(GO:1901909) adenosine 5'-(hexahydrogen pentaphosphate) metabolic process(GO:1901910) adenosine 5'-(hexahydrogen pentaphosphate) catabolic process(GO:1901911) |
| 0.0 | 0.3 | GO:0031584 | activation of phospholipase D activity(GO:0031584) |
| 0.0 | 0.7 | GO:0002227 | innate immune response in mucosa(GO:0002227) |
| 0.0 | 0.6 | GO:0007288 | sperm axoneme assembly(GO:0007288) |
| 0.0 | 0.2 | GO:1900019 | regulation of protein kinase C activity(GO:1900019) positive regulation of protein kinase C activity(GO:1900020) |
| 0.0 | 0.2 | GO:0048143 | astrocyte activation(GO:0048143) |
| 0.0 | 0.0 | GO:0002930 | trabecular meshwork development(GO:0002930) |
| 0.0 | 0.1 | GO:0034769 | basement membrane disassembly(GO:0034769) |
| 0.0 | 0.7 | GO:0006120 | mitochondrial electron transport, NADH to ubiquinone(GO:0006120) |
| 0.0 | 0.1 | GO:1902202 | regulation of hepatocyte growth factor receptor signaling pathway(GO:1902202) |
| 0.0 | 0.3 | GO:0009438 | methylglyoxal metabolic process(GO:0009438) |
| 0.0 | 0.2 | GO:0019563 | glycerol catabolic process(GO:0019563) |
| 0.0 | 0.1 | GO:2000048 | negative regulation of cell-cell adhesion mediated by cadherin(GO:2000048) |
| 0.0 | 0.1 | GO:1903265 | positive regulation of tumor necrosis factor-mediated signaling pathway(GO:1903265) |
| 0.0 | 0.2 | GO:0002032 | desensitization of G-protein coupled receptor protein signaling pathway by arrestin(GO:0002032) |
| 0.0 | 0.2 | GO:0090116 | C-5 methylation of cytosine(GO:0090116) |
| 0.0 | 0.1 | GO:1903208 | neuron death in response to hydrogen peroxide(GO:0036476) regulation of hydrogen peroxide-induced neuron death(GO:1903207) negative regulation of hydrogen peroxide-induced neuron death(GO:1903208) |
| 0.0 | 0.1 | GO:0009189 | dUDP biosynthetic process(GO:0006227) dTTP biosynthetic process(GO:0006235) pyrimidine nucleoside diphosphate biosynthetic process(GO:0009139) deoxyribonucleoside diphosphate metabolic process(GO:0009186) deoxyribonucleoside diphosphate biosynthetic process(GO:0009189) pyrimidine deoxyribonucleoside diphosphate metabolic process(GO:0009196) pyrimidine deoxyribonucleoside diphosphate biosynthetic process(GO:0009197) pyrimidine deoxyribonucleoside triphosphate biosynthetic process(GO:0009212) dUDP metabolic process(GO:0046077) |
| 0.0 | 0.4 | GO:0009134 | nucleoside diphosphate catabolic process(GO:0009134) |
| 0.0 | 0.2 | GO:0016103 | diterpenoid catabolic process(GO:0016103) retinoic acid catabolic process(GO:0034653) |
| 0.0 | 0.2 | GO:0006420 | arginyl-tRNA aminoacylation(GO:0006420) |
| 0.0 | 0.1 | GO:0045578 | negative regulation of B cell differentiation(GO:0045578) |
| 0.0 | 0.1 | GO:1903576 | response to L-arginine(GO:1903576) |
| 0.0 | 0.0 | GO:0035696 | monocyte extravasation(GO:0035696) |
| 0.0 | 0.1 | GO:0006421 | asparaginyl-tRNA aminoacylation(GO:0006421) |
| 0.0 | 0.2 | GO:0000056 | ribosomal small subunit export from nucleus(GO:0000056) |
| 0.0 | 0.1 | GO:0070934 | CRD-mediated mRNA stabilization(GO:0070934) |
| 0.0 | 0.1 | GO:0090172 | microtubule cytoskeleton organization involved in homologous chromosome segregation(GO:0090172) |
| 0.0 | 0.2 | GO:0006564 | L-serine biosynthetic process(GO:0006564) |
| 0.0 | 0.3 | GO:0006729 | tetrahydrobiopterin biosynthetic process(GO:0006729) |
| 0.0 | 0.0 | GO:0019520 | aldonic acid metabolic process(GO:0019520) D-gluconate metabolic process(GO:0019521) |
| 0.0 | 0.1 | GO:0070814 | hydrogen sulfide biosynthetic process(GO:0070814) |
| 0.0 | 0.2 | GO:0035519 | protein K29-linked ubiquitination(GO:0035519) |
| 0.0 | 0.0 | GO:0042322 | negative regulation of circadian sleep/wake cycle, REM sleep(GO:0042322) |
| 0.0 | 0.2 | GO:0006868 | glutamine transport(GO:0006868) |
| 0.0 | 0.2 | GO:0010936 | negative regulation of macrophage cytokine production(GO:0010936) |
| 0.0 | 0.2 | GO:0006703 | estrogen biosynthetic process(GO:0006703) |
| 0.0 | 0.2 | GO:2000574 | regulation of microtubule motor activity(GO:2000574) |
| 0.0 | 0.1 | GO:1903659 | regulation of complement-dependent cytotoxicity(GO:1903659) |
| 0.0 | 0.1 | GO:1990402 | embryonic liver development(GO:1990402) |
| 0.0 | 0.4 | GO:0042747 | circadian sleep/wake cycle, REM sleep(GO:0042747) |
| 0.0 | 0.0 | GO:0046469 | platelet activating factor metabolic process(GO:0046469) |
| 0.0 | 0.0 | GO:0071454 | cellular response to anoxia(GO:0071454) |
| 0.0 | 0.1 | GO:0023021 | termination of signal transduction(GO:0023021) |
| 0.0 | 0.1 | GO:0002540 | leukotriene production involved in inflammatory response(GO:0002540) |
| 0.0 | 0.1 | GO:0099638 | endosome to plasma membrane protein transport(GO:0099638) |
| 0.0 | 0.7 | GO:0036158 | outer dynein arm assembly(GO:0036158) |
| 0.0 | 0.1 | GO:0021759 | globus pallidus development(GO:0021759) |
| 0.0 | 0.1 | GO:2000705 | dense core granule biogenesis(GO:0061110) regulation of dense core granule biogenesis(GO:2000705) |
| 0.0 | 0.2 | GO:1904970 | brush border assembly(GO:1904970) |
| 0.0 | 0.2 | GO:1900194 | negative regulation of oocyte maturation(GO:1900194) |
| 0.0 | 0.1 | GO:1902172 | keratinocyte apoptotic process(GO:0097283) regulation of keratinocyte apoptotic process(GO:1902172) |
| 0.0 | 0.1 | GO:0071348 | cellular response to interleukin-11(GO:0071348) |
| 0.0 | 0.7 | GO:0050482 | arachidonic acid secretion(GO:0050482) arachidonate transport(GO:1903963) |
| 0.0 | 1.2 | GO:0000387 | spliceosomal snRNP assembly(GO:0000387) |
| 0.0 | 0.2 | GO:0006432 | phenylalanyl-tRNA aminoacylation(GO:0006432) |
| 0.0 | 0.2 | GO:0070295 | renal water absorption(GO:0070295) |
| 0.0 | 0.3 | GO:1900262 | regulation of DNA-directed DNA polymerase activity(GO:1900262) positive regulation of DNA-directed DNA polymerase activity(GO:1900264) |
| 0.0 | 0.1 | GO:0015670 | carbon dioxide transport(GO:0015670) |
| 0.0 | 0.1 | GO:0033128 | negative regulation of histone phosphorylation(GO:0033128) |
| 0.0 | 0.2 | GO:0060315 | negative regulation of ryanodine-sensitive calcium-release channel activity(GO:0060315) |
| 0.0 | 0.1 | GO:0016557 | peroxisome membrane biogenesis(GO:0016557) |
| 0.0 | 0.3 | GO:0042775 | mitochondrial ATP synthesis coupled electron transport(GO:0042775) |
| 0.0 | 0.3 | GO:0006659 | phosphatidylserine biosynthetic process(GO:0006659) |
| 0.0 | 0.1 | GO:0006104 | succinyl-CoA metabolic process(GO:0006104) |
| 0.0 | 0.1 | GO:1902569 | regulation of activation of JAK2 kinase activity(GO:0010534) activation of JAK2 kinase activity(GO:0042977) negative regulation of activation of JAK2 kinase activity(GO:1902569) |
| 0.0 | 0.0 | GO:0090209 | negative regulation of triglyceride metabolic process(GO:0090209) |
| 0.0 | 0.0 | GO:0070543 | response to linoleic acid(GO:0070543) |
| 0.0 | 0.1 | GO:1902966 | regulation of protein localization to early endosome(GO:1902965) positive regulation of protein localization to early endosome(GO:1902966) |
| 0.0 | 0.2 | GO:0048102 | autophagic cell death(GO:0048102) |
| 0.0 | 0.1 | GO:2000255 | negative regulation of male germ cell proliferation(GO:2000255) |
| 0.0 | 0.1 | GO:0035425 | autocrine signaling(GO:0035425) |
| 0.0 | 0.2 | GO:0038110 | interleukin-2-mediated signaling pathway(GO:0038110) |
| 0.0 | 0.1 | GO:0006369 | termination of RNA polymerase II transcription(GO:0006369) |
| 0.0 | 0.0 | GO:0010609 | mRNA localization resulting in posttranscriptional regulation of gene expression(GO:0010609) |
| 0.0 | 0.1 | GO:0044725 | chromatin reprogramming in the zygote(GO:0044725) |
| 0.0 | 0.1 | GO:0072086 | specification of loop of Henle identity(GO:0072086) pattern specification involved in metanephros development(GO:0072268) |
| 0.0 | 0.1 | GO:1902269 | positive regulation of polyamine transmembrane transport(GO:1902269) |
| 0.0 | 0.1 | GO:0061622 | glycolytic process through glucose-1-phosphate(GO:0061622) |
| 0.0 | 0.4 | GO:0035563 | positive regulation of chromatin binding(GO:0035563) |
| 0.0 | 0.2 | GO:0061709 | reticulophagy(GO:0061709) |
| 0.0 | 0.5 | GO:1901663 | ubiquinone biosynthetic process(GO:0006744) quinone biosynthetic process(GO:1901663) |
| 0.0 | 0.2 | GO:0045048 | protein insertion into ER membrane(GO:0045048) |
| 0.0 | 0.1 | GO:0038158 | granulocyte colony-stimulating factor signaling pathway(GO:0038158) |
| 0.0 | 0.2 | GO:0002759 | regulation of antimicrobial humoral response(GO:0002759) |
| 0.0 | 0.2 | GO:0046116 | queuosine biosynthetic process(GO:0008616) queuosine metabolic process(GO:0046116) |
| 0.0 | 0.1 | GO:1903015 | regulation of exo-alpha-sialidase activity(GO:1903015) |
| 0.0 | 0.2 | GO:0036016 | response to interleukin-3(GO:0036015) cellular response to interleukin-3(GO:0036016) |
| 0.0 | 0.1 | GO:1900195 | positive regulation of oocyte maturation(GO:1900195) positive regulation of proteasomal ubiquitin-dependent protein catabolic process involved in cellular response to hypoxia(GO:2000777) |
| 0.0 | 0.1 | GO:1990167 | protein K27-linked deubiquitination(GO:1990167) |
| 0.0 | 0.2 | GO:0071673 | positive regulation of smooth muscle cell chemotaxis(GO:0071673) |
| 0.0 | 1.4 | GO:0032543 | mitochondrial translation(GO:0032543) |
| 0.0 | 0.1 | GO:0043328 | protein targeting to vacuole involved in ubiquitin-dependent protein catabolic process via the multivesicular body sorting pathway(GO:0043328) |
| 0.0 | 0.0 | GO:0050968 | detection of chemical stimulus involved in sensory perception of pain(GO:0050968) |
| 0.0 | 0.1 | GO:1902162 | regulation of DNA damage response, signal transduction by p53 class mediator resulting in transcription of p21 class mediator(GO:1902162) |
| 0.0 | 0.1 | GO:0032077 | positive regulation of deoxyribonuclease activity(GO:0032077) |
| 0.0 | 0.4 | GO:0009083 | branched-chain amino acid catabolic process(GO:0009083) |
| 0.0 | 0.1 | GO:1901367 | response to L-cysteine(GO:1901367) |
| 0.0 | 0.1 | GO:0060005 | vestibular reflex(GO:0060005) |
| 0.0 | 0.0 | GO:2000341 | chemokine (C-X-C motif) ligand 2 production(GO:0072567) regulation of chemokine (C-X-C motif) ligand 2 production(GO:2000341) |
| 0.0 | 0.4 | GO:0043252 | sodium-independent organic anion transport(GO:0043252) |
| 0.0 | 0.2 | GO:0043320 | natural killer cell degranulation(GO:0043320) |
| 0.0 | 0.1 | GO:0060478 | acrosomal vesicle exocytosis(GO:0060478) |
| 0.0 | 0.3 | GO:0086043 | bundle of His cell to Purkinje myocyte signaling(GO:0086028) bundle of His cell action potential(GO:0086043) |
| 0.0 | 0.2 | GO:0034244 | negative regulation of transcription elongation from RNA polymerase II promoter(GO:0034244) |
| 0.0 | 0.1 | GO:0002018 | renin-angiotensin regulation of aldosterone production(GO:0002018) |
| 0.0 | 0.2 | GO:0006113 | fermentation(GO:0006113) glucose catabolic process to lactate(GO:0019659) glycolytic fermentation(GO:0019660) glucose catabolic process to lactate via pyruvate(GO:0019661) |
| 0.0 | 0.3 | GO:0005513 | detection of calcium ion(GO:0005513) |
| 0.0 | 0.2 | GO:0015866 | ADP transport(GO:0015866) |
| 0.0 | 0.0 | GO:0045630 | positive regulation of T-helper 2 cell differentiation(GO:0045630) |
| 0.0 | 0.1 | GO:1900619 | acetylcholine metabolic process(GO:0008291) acetate ester metabolic process(GO:1900619) |
| 0.0 | 0.5 | GO:1901741 | positive regulation of myoblast fusion(GO:1901741) |
| 0.0 | 0.0 | GO:1903796 | negative regulation of inorganic anion transmembrane transport(GO:1903796) |
| 0.0 | 0.2 | GO:0051694 | pointed-end actin filament capping(GO:0051694) |
| 0.0 | 0.3 | GO:0034393 | positive regulation of smooth muscle cell apoptotic process(GO:0034393) |
| 0.0 | 0.1 | GO:0016129 | phytosteroid metabolic process(GO:0016128) phytosteroid biosynthetic process(GO:0016129) |
| 0.0 | 0.8 | GO:0030970 | retrograde protein transport, ER to cytosol(GO:0030970) |
| 0.0 | 0.3 | GO:0001556 | oocyte maturation(GO:0001556) |
| 0.0 | 0.1 | GO:0001831 | trophectodermal cellular morphogenesis(GO:0001831) |
| 0.0 | 0.1 | GO:0003223 | ventricular compact myocardium morphogenesis(GO:0003223) semicircular canal morphogenesis(GO:0048752) |
| 0.0 | 1.2 | GO:0000413 | protein peptidyl-prolyl isomerization(GO:0000413) |
| 0.0 | 0.2 | GO:0071712 | ER-associated misfolded protein catabolic process(GO:0071712) |
| 0.0 | 0.1 | GO:0021778 | oligodendrocyte cell fate specification(GO:0021778) oligodendrocyte cell fate commitment(GO:0021779) glial cell fate specification(GO:0021780) |
| 0.0 | 0.3 | GO:0034501 | protein localization to kinetochore(GO:0034501) |
| 0.0 | 1.0 | GO:0042462 | eye photoreceptor cell development(GO:0042462) |
| 0.0 | 0.1 | GO:0016598 | protein arginylation(GO:0016598) |
| 0.0 | 0.1 | GO:2000074 | regulation of type B pancreatic cell development(GO:2000074) |
| 0.0 | 0.1 | GO:0002084 | protein depalmitoylation(GO:0002084) |
| 0.0 | 0.1 | GO:1904959 | regulation of cytochrome-c oxidase activity(GO:1904959) |
| 0.0 | 0.0 | GO:0060061 | Spemann organizer formation(GO:0060061) |
| 0.0 | 0.2 | GO:2000002 | negative regulation of DNA damage checkpoint(GO:2000002) |
| 0.0 | 0.1 | GO:0072717 | cellular response to actinomycin D(GO:0072717) |
| 0.0 | 0.1 | GO:0018298 | protein-chromophore linkage(GO:0018298) |
| 0.0 | 0.3 | GO:0052697 | xenobiotic glucuronidation(GO:0052697) |
| 0.0 | 0.2 | GO:0007343 | egg activation(GO:0007343) |
| 0.0 | 0.0 | GO:0072138 | mesenchymal cell proliferation involved in ureteric bud development(GO:0072138) |
| 0.0 | 0.8 | GO:0031146 | SCF-dependent proteasomal ubiquitin-dependent protein catabolic process(GO:0031146) |
| 0.0 | 0.1 | GO:0048251 | elastic fiber assembly(GO:0048251) |
| 0.0 | 1.2 | GO:0042273 | ribosomal large subunit biogenesis(GO:0042273) |
| 0.0 | 0.3 | GO:0046520 | sphingoid biosynthetic process(GO:0046520) |
| 0.0 | 0.1 | GO:0016476 | regulation of embryonic cell shape(GO:0016476) |
| 0.0 | 0.1 | GO:0030167 | proteoglycan catabolic process(GO:0030167) heparan sulfate proteoglycan catabolic process(GO:0030200) |
| 0.0 | 0.1 | GO:0003065 | positive regulation of heart rate by epinephrine(GO:0003065) |
| 0.0 | 0.2 | GO:0046784 | viral mRNA export from host cell nucleus(GO:0046784) |
| 0.0 | 0.2 | GO:0010992 | ubiquitin homeostasis(GO:0010992) |
| 0.0 | 0.1 | GO:0000054 | ribosomal subunit export from nucleus(GO:0000054) ribosome localization(GO:0033750) establishment of ribosome localization(GO:0033753) |
| 0.0 | 0.0 | GO:0001928 | regulation of exocyst assembly(GO:0001928) |
| 0.0 | 0.4 | GO:0044241 | lipid digestion(GO:0044241) |
| 0.0 | 0.2 | GO:0061303 | cornea development in camera-type eye(GO:0061303) |
| 0.0 | 0.1 | GO:0010940 | positive regulation of necrotic cell death(GO:0010940) |
| 0.0 | 0.1 | GO:0000480 | endonucleolytic cleavage in 5'-ETS of tricistronic rRNA transcript (SSU-rRNA, 5.8S rRNA, LSU-rRNA)(GO:0000480) |
| 0.0 | 0.1 | GO:0045348 | positive regulation of MHC class II biosynthetic process(GO:0045348) |
| 0.0 | 0.2 | GO:0061737 | leukotriene signaling pathway(GO:0061737) |
| 0.0 | 0.1 | GO:0060480 | lung goblet cell differentiation(GO:0060480) |
| 0.0 | 0.2 | GO:1903608 | protein localization to cytoplasmic stress granule(GO:1903608) |
| 0.0 | 0.1 | GO:2001245 | regulation of phosphatidylcholine biosynthetic process(GO:2001245) |
| 0.0 | 0.1 | GO:0046951 | ketone body biosynthetic process(GO:0046951) |
| 0.0 | 0.1 | GO:1900004 | regulation of serine-type endopeptidase activity(GO:1900003) negative regulation of serine-type endopeptidase activity(GO:1900004) regulation of serine-type peptidase activity(GO:1902571) negative regulation of serine-type peptidase activity(GO:1902572) |
| 0.0 | 0.1 | GO:1902630 | regulation of membrane hyperpolarization(GO:1902630) |
| 0.0 | 0.2 | GO:0072711 | cellular response to hydroxyurea(GO:0072711) |
| 0.0 | 0.1 | GO:0046865 | isoprenoid transport(GO:0046864) terpenoid transport(GO:0046865) |
| 0.0 | 0.1 | GO:2000814 | positive regulation of barbed-end actin filament capping(GO:2000814) |
| 0.0 | 0.3 | GO:0007171 | activation of transmembrane receptor protein tyrosine kinase activity(GO:0007171) |
| 0.0 | 0.1 | GO:0043605 | cellular amide catabolic process(GO:0043605) |
| 0.0 | 0.4 | GO:1903206 | negative regulation of hydrogen peroxide-induced cell death(GO:1903206) |
| 0.0 | 0.3 | GO:0006968 | cellular defense response(GO:0006968) |
| 0.0 | 0.3 | GO:0010040 | response to iron(II) ion(GO:0010040) |
| 0.0 | 0.1 | GO:0060638 | mesenchymal-epithelial cell signaling(GO:0060638) |
| 0.0 | 0.1 | GO:0014744 | positive regulation of muscle adaptation(GO:0014744) |
| 0.0 | 0.2 | GO:0045591 | positive regulation of regulatory T cell differentiation(GO:0045591) |
| 0.0 | 0.1 | GO:0071314 | cellular response to cocaine(GO:0071314) |
| 0.0 | 0.1 | GO:0042501 | serine phosphorylation of STAT protein(GO:0042501) |
| 0.0 | 0.1 | GO:0002949 | tRNA threonylcarbamoyladenosine modification(GO:0002949) |
| 0.0 | 0.1 | GO:1902109 | negative regulation of mitochondrial membrane permeability(GO:0035795) negative regulation of mitochondrial membrane permeability involved in apoptotic process(GO:1902109) |
| 0.0 | 0.0 | GO:1903937 | response to acrylamide(GO:1903937) |
| 0.0 | 0.3 | GO:0016338 | calcium-independent cell-cell adhesion via plasma membrane cell-adhesion molecules(GO:0016338) |
| 0.0 | 0.2 | GO:0007603 | phototransduction, visible light(GO:0007603) rhodopsin mediated signaling pathway(GO:0016056) |
| 0.0 | 0.3 | GO:0045835 | negative regulation of meiotic nuclear division(GO:0045835) |
| 0.0 | 0.1 | GO:0016255 | attachment of GPI anchor to protein(GO:0016255) |
| 0.0 | 0.6 | GO:0006221 | pyrimidine nucleotide biosynthetic process(GO:0006221) |
| 0.0 | 0.2 | GO:0070389 | chaperone cofactor-dependent protein refolding(GO:0070389) |
| 0.0 | 0.1 | GO:1902527 | positive regulation of protein monoubiquitination(GO:1902527) |
| 0.0 | 0.1 | GO:1904263 | positive regulation of TORC1 signaling(GO:1904263) |
| 0.0 | 0.1 | GO:2001274 | negative regulation of glucose import in response to insulin stimulus(GO:2001274) |
| 0.0 | 0.0 | GO:0006478 | peptidyl-tyrosine sulfation(GO:0006478) |
| 0.0 | 0.1 | GO:0006776 | vitamin A metabolic process(GO:0006776) |
| 0.0 | 0.1 | GO:0021590 | cerebellum maturation(GO:0021590) cerebellar cortex maturation(GO:0021699) |
| 0.0 | 0.2 | GO:0044598 | polyketide metabolic process(GO:0030638) daunorubicin metabolic process(GO:0044597) doxorubicin metabolic process(GO:0044598) |
| 0.0 | 0.0 | GO:1904124 | regulation of macrophage colony-stimulating factor signaling pathway(GO:1902226) regulation of response to macrophage colony-stimulating factor(GO:1903969) regulation of cellular response to macrophage colony-stimulating factor stimulus(GO:1903972) microglial cell migration(GO:1904124) regulation of microglial cell migration(GO:1904139) |
| 0.0 | 0.0 | GO:0097070 | ductus arteriosus closure(GO:0097070) |
| 0.0 | 0.0 | GO:0035627 | ceramide transport(GO:0035627) |
| 0.0 | 0.1 | GO:1902166 | negative regulation of intrinsic apoptotic signaling pathway in response to DNA damage by p53 class mediator(GO:1902166) |
| 0.0 | 0.1 | GO:0032049 | cardiolipin biosynthetic process(GO:0032049) |
| 0.0 | 0.1 | GO:0048478 | replication fork protection(GO:0048478) |
| 0.0 | 0.1 | GO:0030309 | poly-N-acetyllactosamine metabolic process(GO:0030309) poly-N-acetyllactosamine biosynthetic process(GO:0030311) |
| 0.0 | 0.2 | GO:0043117 | positive regulation of vascular permeability(GO:0043117) |
| 0.0 | 0.0 | GO:0006344 | maintenance of chromatin silencing(GO:0006344) |
| 0.0 | 0.0 | GO:2000546 | positive regulation of cell chemotaxis to fibroblast growth factor(GO:1904849) positive regulation of endothelial cell chemotaxis to fibroblast growth factor(GO:2000546) |
| 0.0 | 0.2 | GO:1900029 | positive regulation of ruffle assembly(GO:1900029) |
| 0.0 | 0.1 | GO:0052047 | interaction with other organism via secreted substance involved in symbiotic interaction(GO:0052047) |
| 0.0 | 0.1 | GO:0090494 | catecholamine uptake(GO:0090493) dopamine uptake(GO:0090494) |
| 0.0 | 0.3 | GO:1990126 | retrograde transport, endosome to plasma membrane(GO:1990126) |
| 0.0 | 0.3 | GO:0031163 | iron-sulfur cluster assembly(GO:0016226) metallo-sulfur cluster assembly(GO:0031163) |
| 0.0 | 0.2 | GO:0005981 | regulation of glycogen catabolic process(GO:0005981) |
| 0.0 | 0.8 | GO:0006890 | retrograde vesicle-mediated transport, Golgi to ER(GO:0006890) |
| 0.0 | 0.0 | GO:0002729 | positive regulation of natural killer cell cytokine production(GO:0002729) |
| 0.0 | 0.2 | GO:0007135 | meiosis II(GO:0007135) |
| 0.0 | 0.1 | GO:0098535 | de novo centriole assembly(GO:0098535) |
| 0.0 | 0.1 | GO:0097089 | methyl-branched fatty acid metabolic process(GO:0097089) |
| 0.0 | 0.2 | GO:0035745 | T-helper 2 cell cytokine production(GO:0035745) |
| 0.0 | 0.5 | GO:0046697 | decidualization(GO:0046697) |
| 0.0 | 0.1 | GO:0008215 | spermine metabolic process(GO:0008215) |
| 0.0 | 0.2 | GO:0070417 | cellular response to cold(GO:0070417) |
| 0.0 | 0.1 | GO:0030043 | actin filament fragmentation(GO:0030043) |
| 0.0 | 0.1 | GO:1902369 | negative regulation of RNA catabolic process(GO:1902369) negative regulation of mRNA catabolic process(GO:1902373) |
| 0.0 | 0.0 | GO:0072553 | terminal button organization(GO:0072553) |
| 0.0 | 0.0 | GO:0014908 | myotube differentiation involved in skeletal muscle regeneration(GO:0014908) |
| 0.0 | 0.1 | GO:0051586 | positive regulation of synaptic transmission, dopaminergic(GO:0032226) positive regulation of neurotransmitter uptake(GO:0051582) positive regulation of dopamine uptake involved in synaptic transmission(GO:0051586) positive regulation of catecholamine uptake involved in synaptic transmission(GO:0051944) |
| 0.0 | 0.0 | GO:0006714 | sesquiterpenoid metabolic process(GO:0006714) |
| 0.0 | 0.1 | GO:1903575 | cornified envelope assembly(GO:1903575) |
| 0.0 | 0.2 | GO:0032099 | negative regulation of appetite(GO:0032099) |
| 0.0 | 0.1 | GO:0010193 | response to ozone(GO:0010193) |
| 0.0 | 0.2 | GO:0032230 | positive regulation of synaptic transmission, GABAergic(GO:0032230) |
| 0.0 | 0.1 | GO:0021769 | orbitofrontal cortex development(GO:0021769) |
| 0.0 | 0.3 | GO:1901642 | nucleoside transmembrane transport(GO:1901642) |
| 0.0 | 0.2 | GO:0009650 | UV protection(GO:0009650) |
| 0.0 | 0.2 | GO:0070995 | NADPH oxidation(GO:0070995) |
| 0.0 | 0.0 | GO:0072429 | response to intra-S DNA damage checkpoint signaling(GO:0072429) |
| 0.0 | 0.1 | GO:1900108 | negative regulation of nodal signaling pathway(GO:1900108) |
| 0.0 | 0.1 | GO:0009298 | GDP-mannose biosynthetic process(GO:0009298) |
| 0.0 | 0.1 | GO:0009758 | carbohydrate utilization(GO:0009758) |
| 0.0 | 0.1 | GO:0070945 | neutrophil mediated killing of gram-negative bacterium(GO:0070945) |
| 0.0 | 0.2 | GO:0010739 | positive regulation of protein kinase A signaling(GO:0010739) |
| 0.0 | 0.1 | GO:0015871 | choline transport(GO:0015871) |
| 0.0 | 0.2 | GO:0007220 | Notch receptor processing(GO:0007220) |
| 0.0 | 11.3 | GO:0006412 | translation(GO:0006412) |
| 0.0 | 0.2 | GO:0021930 | cell proliferation in external granule layer(GO:0021924) cerebellar granule cell precursor proliferation(GO:0021930) |
| 0.0 | 0.1 | GO:2000196 | positive regulation of female gonad development(GO:2000196) |
| 0.0 | 0.2 | GO:0072378 | blood coagulation, fibrin clot formation(GO:0072378) |
| 0.0 | 0.2 | GO:0034310 | ethanol catabolic process(GO:0006068) primary alcohol catabolic process(GO:0034310) |
| 0.0 | 0.0 | GO:0021524 | visceral motor neuron differentiation(GO:0021524) |
| 0.0 | 0.1 | GO:0035990 | tendon cell differentiation(GO:0035990) tendon formation(GO:0035992) |
| 0.0 | 0.1 | GO:0045341 | MHC class I biosynthetic process(GO:0045341) regulation of MHC class I biosynthetic process(GO:0045343) positive regulation of MHC class I biosynthetic process(GO:0045345) |
| 0.0 | 0.2 | GO:0030502 | negative regulation of bone mineralization(GO:0030502) |
| 0.0 | 0.1 | GO:1902177 | positive regulation of oxidative stress-induced intrinsic apoptotic signaling pathway(GO:1902177) |
| 0.0 | 0.0 | GO:0009240 | isopentenyl diphosphate biosynthetic process(GO:0009240) isopentenyl diphosphate metabolic process(GO:0046490) |
| 0.0 | 0.0 | GO:0007161 | calcium-independent cell-matrix adhesion(GO:0007161) |
| 0.0 | 0.1 | GO:0015884 | folic acid transport(GO:0015884) |
| 0.0 | 0.0 | GO:1900151 | regulation of nuclear-transcribed mRNA catabolic process, deadenylation-dependent decay(GO:1900151) positive regulation of nuclear-transcribed mRNA catabolic process, deadenylation-dependent decay(GO:1900153) |
| 0.0 | 0.2 | GO:0051151 | negative regulation of smooth muscle cell differentiation(GO:0051151) |
| 0.0 | 0.1 | GO:0052651 | monoacylglycerol metabolic process(GO:0046462) monoacylglycerol catabolic process(GO:0052651) |
| 0.0 | 0.0 | GO:1904616 | regulation of actin filament binding(GO:1904529) regulation of actin binding(GO:1904616) |
| 0.0 | 0.1 | GO:2000825 | positive regulation of androgen receptor activity(GO:2000825) |
| 0.0 | 0.1 | GO:1901091 | regulation of protein tetramerization(GO:1901090) negative regulation of protein tetramerization(GO:1901091) regulation of protein homotetramerization(GO:1901093) negative regulation of protein homotetramerization(GO:1901094) |
| 0.0 | 0.1 | GO:0032275 | luteinizing hormone secretion(GO:0032275) |
| 0.0 | 0.1 | GO:0018206 | peptidyl-methionine modification(GO:0018206) |
| 0.0 | 0.1 | GO:0046325 | negative regulation of glucose import(GO:0046325) |
| 0.0 | 0.5 | GO:0006693 | prostanoid metabolic process(GO:0006692) prostaglandin metabolic process(GO:0006693) |
| 0.0 | 0.0 | GO:0032792 | negative regulation of CREB transcription factor activity(GO:0032792) |
| 0.0 | 0.3 | GO:0001696 | gastric acid secretion(GO:0001696) |
| 0.0 | 0.0 | GO:0033210 | leptin-mediated signaling pathway(GO:0033210) |
| 0.0 | 0.0 | GO:0032978 | protein insertion into membrane from inner side(GO:0032978) |
| 0.0 | 0.0 | GO:0046952 | ketone body catabolic process(GO:0046952) |
| 0.0 | 0.0 | GO:0070168 | negative regulation of biomineral tissue development(GO:0070168) |
| 0.0 | 0.1 | GO:0042118 | endothelial cell activation(GO:0042118) |
| 0.0 | 0.1 | GO:0070459 | prolactin secretion(GO:0070459) |
| 0.0 | 0.0 | GO:0052422 | modulation of catalytic activity in other organism involved in symbiotic interaction(GO:0052203) modulation by host of symbiont catalytic activity(GO:0052422) |
| 0.0 | 0.1 | GO:0032020 | ISG15-protein conjugation(GO:0032020) |
| 0.0 | 0.1 | GO:0008295 | spermidine biosynthetic process(GO:0008295) |
| 0.0 | 0.0 | GO:2000845 | positive regulation of testosterone secretion(GO:2000845) |
| 0.0 | 0.1 | GO:0023016 | signal transduction by trans-phosphorylation(GO:0023016) |
| 0.0 | 0.0 | GO:1904954 | Wnt signaling pathway involved in midbrain dopaminergic neuron differentiation(GO:1904953) canonical Wnt signaling pathway involved in midbrain dopaminergic neuron differentiation(GO:1904954) |
| 0.0 | 0.1 | GO:0071318 | cellular response to ATP(GO:0071318) |
| 0.0 | 0.4 | GO:0007095 | mitotic G2 DNA damage checkpoint(GO:0007095) G2 DNA damage checkpoint(GO:0031572) |
| 0.0 | 0.1 | GO:0042196 | chlorinated hydrocarbon metabolic process(GO:0042196) halogenated hydrocarbon metabolic process(GO:0042197) |
| 0.0 | 0.1 | GO:0006901 | vesicle coating(GO:0006901) |
| 0.0 | 0.1 | GO:0001582 | detection of chemical stimulus involved in sensory perception of sweet taste(GO:0001582) |
| 0.0 | 0.1 | GO:0006004 | fucose metabolic process(GO:0006004) |
| 0.0 | 0.1 | GO:0032218 | riboflavin transport(GO:0032218) |
| 0.0 | 0.2 | GO:0055059 | asymmetric neuroblast division(GO:0055059) |
| 0.0 | 0.1 | GO:0000183 | chromatin silencing at rDNA(GO:0000183) |
| 0.0 | 0.0 | GO:0009751 | response to salicylic acid(GO:0009751) |
| 0.0 | 0.1 | GO:0038203 | TORC2 signaling(GO:0038203) |
| 0.0 | 0.2 | GO:0043249 | erythrocyte maturation(GO:0043249) |
| 0.0 | 0.2 | GO:0009744 | response to sucrose(GO:0009744) response to disaccharide(GO:0034285) |
| 0.0 | 0.1 | GO:0070634 | transepithelial ammonium transport(GO:0070634) |
| 0.0 | 0.1 | GO:0019254 | carnitine metabolic process, CoA-linked(GO:0019254) |
| 0.0 | 0.2 | GO:0060012 | synaptic transmission, glycinergic(GO:0060012) |
| 0.0 | 0.1 | GO:0036123 | histone H3-K9 dimethylation(GO:0036123) |
| 0.0 | 0.1 | GO:0035166 | post-embryonic hemopoiesis(GO:0035166) |
| 0.0 | 0.1 | GO:2000393 | negative regulation of lamellipodium morphogenesis(GO:2000393) |
| 0.0 | 0.0 | GO:2001015 | negative regulation of skeletal muscle cell differentiation(GO:2001015) |
| 0.0 | 0.3 | GO:0006691 | leukotriene metabolic process(GO:0006691) |
| 0.0 | 0.1 | GO:0042339 | keratan sulfate metabolic process(GO:0042339) |
| 0.0 | 0.1 | GO:0035754 | B cell chemotaxis(GO:0035754) |
| 0.0 | 0.4 | GO:0009649 | entrainment of circadian clock(GO:0009649) |
| 0.0 | 0.0 | GO:2000586 | regulation of platelet-derived growth factor receptor-beta signaling pathway(GO:2000586) |
| 0.0 | 0.0 | GO:0045113 | regulation of integrin biosynthetic process(GO:0045113) |
| 0.0 | 0.1 | GO:2001188 | regulation of T cell activation via T cell receptor contact with antigen bound to MHC molecule on antigen presenting cell(GO:2001188) |
| 0.0 | 0.0 | GO:2000286 | receptor internalization involved in canonical Wnt signaling pathway(GO:2000286) |
| 0.0 | 0.0 | GO:2001204 | regulation of osteoclast development(GO:2001204) |
| 0.0 | 0.1 | GO:0097211 | response to gonadotropin-releasing hormone(GO:0097210) cellular response to gonadotropin-releasing hormone(GO:0097211) |
| 0.0 | 0.1 | GO:0003105 | negative regulation of glomerular filtration(GO:0003105) |
| 0.0 | 0.1 | GO:0009125 | nucleoside monophosphate catabolic process(GO:0009125) |
| 0.0 | 0.0 | GO:0002876 | regulation of chronic inflammatory response to antigenic stimulus(GO:0002874) positive regulation of chronic inflammatory response to antigenic stimulus(GO:0002876) |
| 0.0 | 0.1 | GO:0003164 | His-Purkinje system development(GO:0003164) |
| 0.0 | 0.1 | GO:2000288 | positive regulation of myoblast proliferation(GO:2000288) |
| 0.0 | 0.1 | GO:0015015 | heparan sulfate proteoglycan biosynthetic process, enzymatic modification(GO:0015015) |
| 0.0 | 0.1 | GO:0030237 | female sex determination(GO:0030237) |
| 0.0 | 0.1 | GO:0030388 | fructose 1,6-bisphosphate metabolic process(GO:0030388) |
| 0.0 | 0.1 | GO:0048387 | negative regulation of retinoic acid receptor signaling pathway(GO:0048387) |
| 0.0 | 0.1 | GO:0019720 | Mo-molybdopterin cofactor biosynthetic process(GO:0006777) Mo-molybdopterin cofactor metabolic process(GO:0019720) |
| 0.0 | 0.1 | GO:0070475 | rRNA base methylation(GO:0070475) |
| 0.0 | 0.1 | GO:1903251 | multi-ciliated epithelial cell differentiation(GO:1903251) |
| 0.0 | 0.0 | GO:0032470 | positive regulation of endoplasmic reticulum calcium ion concentration(GO:0032470) |
| 0.0 | 0.3 | GO:0032482 | Rab protein signal transduction(GO:0032482) |
| 0.0 | 0.1 | GO:2000001 | regulation of DNA damage checkpoint(GO:2000001) |
| 0.0 | 0.1 | GO:0002386 | immune response in mucosal-associated lymphoid tissue(GO:0002386) |
| 0.0 | 0.2 | GO:0045072 | interferon-gamma biosynthetic process(GO:0042095) regulation of interferon-gamma biosynthetic process(GO:0045072) positive regulation of interferon-gamma biosynthetic process(GO:0045078) |
| 0.0 | 0.3 | GO:0006783 | heme biosynthetic process(GO:0006783) |
| 0.0 | 0.2 | GO:0002523 | leukocyte migration involved in inflammatory response(GO:0002523) |
| 0.0 | 0.1 | GO:0042574 | retinal metabolic process(GO:0042574) |
| 0.0 | 0.1 | GO:0043456 | regulation of pentose-phosphate shunt(GO:0043456) |
| 0.0 | 0.1 | GO:0031296 | cobalamin transport(GO:0015889) B cell costimulation(GO:0031296) |
| 0.0 | 0.1 | GO:0048630 | skeletal muscle tissue growth(GO:0048630) |
| 0.0 | 0.1 | GO:0016246 | RNA interference(GO:0016246) |
| 0.0 | 0.1 | GO:0050916 | sensory perception of sweet taste(GO:0050916) |
| 0.0 | 0.2 | GO:0021631 | optic nerve morphogenesis(GO:0021631) |
| 0.0 | 1.2 | GO:0006457 | protein folding(GO:0006457) |
| 0.0 | 0.3 | GO:0030225 | macrophage differentiation(GO:0030225) |
| 0.0 | 0.1 | GO:0002679 | respiratory burst involved in defense response(GO:0002679) |
| 0.0 | 0.1 | GO:0043951 | negative regulation of cAMP-mediated signaling(GO:0043951) |
| 0.0 | 0.0 | GO:0071492 | cellular response to UV-A(GO:0071492) |
| 0.0 | 0.1 | GO:0019373 | epoxygenase P450 pathway(GO:0019373) |
| 0.0 | 0.1 | GO:0006578 | amino-acid betaine biosynthetic process(GO:0006578) |
| 0.0 | 0.1 | GO:0031508 | pericentric heterochromatin assembly(GO:0031508) |
| 0.0 | 0.2 | GO:0003376 | sphingosine-1-phosphate signaling pathway(GO:0003376) |
| 0.0 | 0.0 | GO:2001199 | negative regulation of dendritic cell differentiation(GO:2001199) |
| 0.0 | 0.0 | GO:0061073 | ciliary body morphogenesis(GO:0061073) |
| 0.0 | 0.3 | GO:0033169 | histone H3-K9 demethylation(GO:0033169) |
| 0.0 | 0.1 | GO:0048386 | positive regulation of retinoic acid receptor signaling pathway(GO:0048386) |
| 0.0 | 0.1 | GO:1902951 | negative regulation of dendritic spine maintenance(GO:1902951) |
| 0.0 | 0.1 | GO:0006021 | inositol biosynthetic process(GO:0006021) |
| 0.0 | 0.1 | GO:0006265 | DNA topological change(GO:0006265) |
| 0.0 | 0.2 | GO:0021681 | cerebellar granular layer development(GO:0021681) |
| 0.0 | 0.0 | GO:0006072 | glycerol-3-phosphate metabolic process(GO:0006072) |
| 0.0 | 0.1 | GO:0045780 | positive regulation of bone resorption(GO:0045780) positive regulation of bone remodeling(GO:0046852) |
| 0.0 | 0.3 | GO:0070979 | protein K11-linked ubiquitination(GO:0070979) |
| 0.0 | 0.0 | GO:0008355 | olfactory learning(GO:0008355) |
| 0.0 | 0.1 | GO:0060382 | regulation of DNA strand elongation(GO:0060382) |
| 0.0 | 0.1 | GO:0002430 | complement receptor mediated signaling pathway(GO:0002430) |
| 0.0 | 0.1 | GO:0051490 | negative regulation of filopodium assembly(GO:0051490) |
| 0.0 | 0.0 | GO:1990792 | response to glial cell derived neurotrophic factor(GO:1990790) cellular response to glial cell derived neurotrophic factor(GO:1990792) |
| 0.0 | 0.1 | GO:0015747 | urate transport(GO:0015747) |
| 0.0 | 0.0 | GO:1905225 | response to thyrotropin-releasing hormone(GO:1905225) |
| 0.0 | 0.1 | GO:0009263 | deoxyribonucleotide biosynthetic process(GO:0009263) |
| 0.0 | 0.5 | GO:0070534 | protein K63-linked ubiquitination(GO:0070534) |
| 0.0 | 0.0 | GO:0032914 | positive regulation of transforming growth factor beta1 production(GO:0032914) |
| 0.0 | 0.0 | GO:0072679 | thymocyte migration(GO:0072679) |
| 0.0 | 0.1 | GO:0051447 | negative regulation of meiotic cell cycle(GO:0051447) |
| 0.0 | 0.2 | GO:0042407 | cristae formation(GO:0042407) |
| 0.0 | 0.4 | GO:0035082 | axoneme assembly(GO:0035082) |
| 0.0 | 0.0 | GO:0000105 | histidine biosynthetic process(GO:0000105) |
| 0.0 | 0.1 | GO:0070541 | response to platinum ion(GO:0070541) |
| 0.0 | 0.0 | GO:0045590 | negative regulation of regulatory T cell differentiation(GO:0045590) |
| 0.0 | 0.0 | GO:0048808 | male genitalia morphogenesis(GO:0048808) male anatomical structure morphogenesis(GO:0090598) |
| 0.0 | 0.0 | GO:1903165 | response to polycyclic arene(GO:1903165) |
| 0.0 | 0.0 | GO:0052405 | negative regulation by host of symbiont molecular function(GO:0052405) modification by host of symbiont molecular function(GO:0052428) |
| 0.0 | 0.1 | GO:0071218 | response to misfolded protein(GO:0051788) cellular response to misfolded protein(GO:0071218) |
| 0.0 | 0.0 | GO:0051204 | protein insertion into mitochondrial membrane(GO:0051204) |
| 0.0 | 0.2 | GO:0050908 | detection of light stimulus involved in visual perception(GO:0050908) detection of light stimulus involved in sensory perception(GO:0050962) |
| 0.0 | 0.1 | GO:0032098 | regulation of appetite(GO:0032098) |
| 0.0 | 0.0 | GO:0035413 | esophagus smooth muscle contraction(GO:0014846) positive regulation of catenin import into nucleus(GO:0035413) |
| 0.0 | 0.1 | GO:0017183 | peptidyl-diphthamide metabolic process(GO:0017182) peptidyl-diphthamide biosynthetic process from peptidyl-histidine(GO:0017183) |
| 0.0 | 0.0 | GO:2000195 | negative regulation of female gonad development(GO:2000195) |
| 0.0 | 0.2 | GO:0045116 | protein neddylation(GO:0045116) |
| 0.0 | 0.0 | GO:2000354 | regulation of ovarian follicle development(GO:2000354) |
| 0.0 | 0.0 | GO:0030885 | regulation of myeloid dendritic cell activation(GO:0030885) negative regulation of myeloid dendritic cell activation(GO:0030886) |
| 0.0 | 0.1 | GO:0060143 | positive regulation of syncytium formation by plasma membrane fusion(GO:0060143) |
| 0.0 | 0.4 | GO:0050909 | sensory perception of taste(GO:0050909) |
| 0.0 | 0.0 | GO:0042414 | epinephrine metabolic process(GO:0042414) |
| 0.0 | 0.0 | GO:1901421 | positive regulation of response to alcohol(GO:1901421) |
| 0.0 | 0.0 | GO:0061153 | trachea submucosa development(GO:0061152) trachea gland development(GO:0061153) |
| 0.0 | 0.1 | GO:1901031 | regulation of response to reactive oxygen species(GO:1901031) |
| 0.0 | 0.1 | GO:0042989 | sequestering of actin monomers(GO:0042989) |
| 0.0 | 0.1 | GO:1903142 | positive regulation of endothelial cell development(GO:1901552) positive regulation of establishment of endothelial barrier(GO:1903142) |
| 0.0 | 0.4 | GO:0032094 | response to food(GO:0032094) |
| 0.0 | 0.0 | GO:0090187 | positive regulation of pancreatic juice secretion(GO:0090187) |
| 0.0 | 0.1 | GO:0060297 | regulation of sarcomere organization(GO:0060297) |
| 0.0 | 0.1 | GO:0070257 | positive regulation of mucus secretion(GO:0070257) |
| 0.0 | 0.0 | GO:0046604 | positive regulation of mitotic centrosome separation(GO:0046604) |
| 0.0 | 0.6 | GO:0045454 | cell redox homeostasis(GO:0045454) |
| 0.0 | 0.1 | GO:0061179 | negative regulation of insulin secretion involved in cellular response to glucose stimulus(GO:0061179) |
| 0.0 | 0.0 | GO:0060830 | ciliary receptor clustering involved in smoothened signaling pathway(GO:0060830) |
| 0.0 | 0.1 | GO:0006656 | phosphatidylcholine biosynthetic process(GO:0006656) |
| 0.0 | 0.1 | GO:0032689 | negative regulation of interferon-gamma production(GO:0032689) |
| 0.0 | 0.1 | GO:0042940 | D-amino acid transport(GO:0042940) |
| 0.0 | 0.1 | GO:0000711 | meiotic DNA repair synthesis(GO:0000711) |
| 0.0 | 0.1 | GO:0048845 | venous blood vessel morphogenesis(GO:0048845) |
| 0.0 | 0.1 | GO:0046827 | positive regulation of protein export from nucleus(GO:0046827) |
| 0.0 | 0.8 | GO:0006334 | nucleosome assembly(GO:0006334) |
| 0.0 | 0.1 | GO:0071684 | blastocyst hatching(GO:0001835) hatching(GO:0035188) organism emergence from protective structure(GO:0071684) |
| 0.0 | 0.1 | GO:0014012 | peripheral nervous system axon regeneration(GO:0014012) |
| 0.0 | 0.1 | GO:0042178 | xenobiotic catabolic process(GO:0042178) |
| 0.0 | 0.1 | GO:0006030 | chitin metabolic process(GO:0006030) chitin catabolic process(GO:0006032) |
| 0.0 | 0.0 | GO:0043366 | beta selection(GO:0043366) |
| 0.0 | 0.0 | GO:0071400 | cellular response to oleic acid(GO:0071400) |
| 0.0 | 0.1 | GO:1902222 | L-phenylalanine metabolic process(GO:0006558) L-phenylalanine catabolic process(GO:0006559) erythrose 4-phosphate/phosphoenolpyruvate family amino acid metabolic process(GO:1902221) erythrose 4-phosphate/phosphoenolpyruvate family amino acid catabolic process(GO:1902222) |
| 0.0 | 0.0 | GO:0031642 | negative regulation of myelination(GO:0031642) |
| 0.0 | 0.1 | GO:0009146 | purine nucleoside triphosphate catabolic process(GO:0009146) |
| 0.0 | 0.1 | GO:0042168 | heme metabolic process(GO:0042168) |
| 0.0 | 0.0 | GO:1901979 | regulation of inward rectifier potassium channel activity(GO:1901979) |
| 0.0 | 0.1 | GO:0006337 | nucleosome disassembly(GO:0006337) protein-DNA complex disassembly(GO:0032986) |
| 0.0 | 0.1 | GO:0015840 | urea transport(GO:0015840) one-carbon compound transport(GO:0019755) |
| 0.0 | 0.1 | GO:0046836 | glycolipid transport(GO:0046836) |
| 0.0 | 0.1 | GO:0032291 | central nervous system myelination(GO:0022010) axon ensheathment in central nervous system(GO:0032291) |
| 0.0 | 0.0 | GO:0006388 | tRNA splicing, via endonucleolytic cleavage and ligation(GO:0006388) |
| 0.0 | 0.0 | GO:2000617 | positive regulation of histone H3-K9 acetylation(GO:2000617) |
| 0.0 | 0.3 | GO:0003016 | respiratory system process(GO:0003016) |
| 0.0 | 0.1 | GO:0006957 | complement activation, alternative pathway(GO:0006957) |
| 0.0 | 0.0 | GO:0050779 | RNA destabilization(GO:0050779) |
| 0.0 | 0.0 | GO:2001140 | regulation of phospholipid transport(GO:2001138) positive regulation of phospholipid transport(GO:2001140) |
| 0.0 | 0.0 | GO:0006546 | glycine catabolic process(GO:0006546) glycine decarboxylation via glycine cleavage system(GO:0019464) |
| 0.0 | 0.2 | GO:0050995 | negative regulation of lipid catabolic process(GO:0050995) |
| 0.0 | 0.1 | GO:0018195 | peptidyl-arginine modification(GO:0018195) |
| 0.0 | 0.2 | GO:0006098 | pentose-phosphate shunt(GO:0006098) glyceraldehyde-3-phosphate metabolic process(GO:0019682) |
| 0.0 | 0.1 | GO:0071787 | endoplasmic reticulum tubular network assembly(GO:0071787) |
| 0.0 | 0.2 | GO:0045070 | positive regulation of viral genome replication(GO:0045070) |
| 0.0 | 0.1 | GO:0032466 | negative regulation of cytokinesis(GO:0032466) |
| 0.0 | 0.2 | GO:0045599 | negative regulation of fat cell differentiation(GO:0045599) |
| 0.0 | 0.0 | GO:0019430 | removal of superoxide radicals(GO:0019430) |
| 0.0 | 0.1 | GO:0042347 | negative regulation of NF-kappaB import into nucleus(GO:0042347) |
| 0.0 | 0.1 | GO:0010818 | T cell chemotaxis(GO:0010818) |
| 0.0 | 0.3 | GO:0021762 | substantia nigra development(GO:0021762) |
| 0.0 | 0.0 | GO:0051152 | positive regulation of smooth muscle cell differentiation(GO:0051152) |
| 0.0 | 0.1 | GO:0045792 | negative regulation of cell size(GO:0045792) |
| 0.0 | 0.1 | GO:0019934 | cGMP-mediated signaling(GO:0019934) |
| 0.0 | 0.1 | GO:1900028 | negative regulation of ruffle assembly(GO:1900028) |
| 0.0 | 0.0 | GO:0007096 | regulation of exit from mitosis(GO:0007096) |
| 0.0 | 0.4 | GO:0090502 | RNA phosphodiester bond hydrolysis, endonucleolytic(GO:0090502) |
| 0.0 | 0.0 | GO:0036438 | maintenance of lens transparency(GO:0036438) |
| 0.0 | 0.0 | GO:0098961 | dendritic transport of ribonucleoprotein complex(GO:0098961) dendritic transport of messenger ribonucleoprotein complex(GO:0098963) anterograde dendritic transport of messenger ribonucleoprotein complex(GO:0098964) |
| 0.0 | 0.0 | GO:0033385 | geranylgeranyl diphosphate metabolic process(GO:0033385) geranylgeranyl diphosphate biosynthetic process(GO:0033386) |
Gene overrepresentation in cellular component category:
| Log-likelihood per target | Total log-likelihood | Term | Description |
|---|---|---|---|
| 0.4 | 3.5 | GO:0005833 | hemoglobin complex(GO:0005833) |
| 0.2 | 0.7 | GO:0036488 | CHOP-C/EBP complex(GO:0036488) |
| 0.2 | 1.3 | GO:0005683 | U7 snRNP(GO:0005683) |
| 0.2 | 0.9 | GO:0071256 | Sec61 translocon complex(GO:0005784) translocon complex(GO:0071256) |
| 0.2 | 1.4 | GO:0031466 | Cul5-RING ubiquitin ligase complex(GO:0031466) |
| 0.2 | 1.1 | GO:0032280 | symmetric synapse(GO:0032280) |
| 0.2 | 0.9 | GO:1990726 | Lsm1-7-Pat1 complex(GO:1990726) |
| 0.2 | 1.7 | GO:0005750 | mitochondrial respiratory chain complex III(GO:0005750) |
| 0.1 | 0.9 | GO:0005787 | signal peptidase complex(GO:0005787) |
| 0.1 | 0.4 | GO:0005962 | mitochondrial isocitrate dehydrogenase complex (NAD+)(GO:0005962) isocitrate dehydrogenase complex (NAD+)(GO:0045242) |
| 0.1 | 0.9 | GO:0032133 | chromosome passenger complex(GO:0032133) |
| 0.1 | 1.9 | GO:0000276 | mitochondrial proton-transporting ATP synthase complex, coupling factor F(o)(GO:0000276) |
| 0.1 | 0.4 | GO:0097453 | mesaxon(GO:0097453) ensheathing process(GO:1990015) |
| 0.1 | 0.3 | GO:0070557 | PCNA-p21 complex(GO:0070557) |
| 0.1 | 0.3 | GO:0005749 | mitochondrial respiratory chain complex II, succinate dehydrogenase complex (ubiquinone)(GO:0005749) succinate dehydrogenase complex (ubiquinone)(GO:0045257) fumarate reductase complex(GO:0045283) |
| 0.1 | 0.6 | GO:0034751 | aryl hydrocarbon receptor complex(GO:0034751) |
| 0.1 | 1.9 | GO:0031362 | anchored component of external side of plasma membrane(GO:0031362) |
| 0.1 | 1.1 | GO:0002177 | manchette(GO:0002177) |
| 0.1 | 2.8 | GO:0005763 | organellar small ribosomal subunit(GO:0000314) mitochondrial small ribosomal subunit(GO:0005763) |
| 0.1 | 0.5 | GO:0005947 | mitochondrial alpha-ketoglutarate dehydrogenase complex(GO:0005947) |
| 0.1 | 0.3 | GO:1990037 | Lewy body core(GO:1990037) |
| 0.1 | 7.1 | GO:0015935 | small ribosomal subunit(GO:0015935) |
| 0.1 | 1.1 | GO:0042583 | chromaffin granule(GO:0042583) |
| 0.1 | 0.9 | GO:0019773 | proteasome core complex, alpha-subunit complex(GO:0019773) |
| 0.1 | 1.4 | GO:0005839 | proteasome core complex(GO:0005839) |
| 0.1 | 0.5 | GO:0071953 | elastic fiber(GO:0071953) |
| 0.1 | 0.6 | GO:0033269 | internode region of axon(GO:0033269) |
| 0.1 | 1.7 | GO:0045277 | respiratory chain complex IV(GO:0045277) |
| 0.1 | 4.6 | GO:0030964 | mitochondrial respiratory chain complex I(GO:0005747) NADH dehydrogenase complex(GO:0030964) respiratory chain complex I(GO:0045271) |
| 0.1 | 8.9 | GO:0022625 | cytosolic large ribosomal subunit(GO:0022625) |
| 0.1 | 0.7 | GO:0016272 | prefoldin complex(GO:0016272) |
| 0.1 | 0.3 | GO:0031680 | G-protein beta/gamma-subunit complex(GO:0031680) |
| 0.1 | 0.5 | GO:0015934 | large ribosomal subunit(GO:0015934) |
| 0.1 | 0.3 | GO:0000839 | Hrd1p ubiquitin ligase ERAD-L complex(GO:0000839) |
| 0.1 | 0.8 | GO:0005641 | nuclear envelope lumen(GO:0005641) |
| 0.1 | 0.2 | GO:0034715 | pICln-Sm protein complex(GO:0034715) |
| 0.1 | 0.9 | GO:0000176 | nuclear exosome (RNase complex)(GO:0000176) |
| 0.1 | 0.3 | GO:0044299 | C-fiber(GO:0044299) |
| 0.1 | 0.4 | GO:1990452 | Parkin-FBXW7-Cul1 ubiquitin ligase complex(GO:1990452) |
| 0.1 | 5.0 | GO:0005761 | organellar ribosome(GO:0000313) mitochondrial ribosome(GO:0005761) |
| 0.1 | 0.3 | GO:0097422 | tubular endosome(GO:0097422) |
| 0.1 | 0.5 | GO:0045179 | apical cortex(GO:0045179) |
| 0.1 | 0.3 | GO:1990462 | omegasome membrane(GO:1903349) omegasome(GO:1990462) |
| 0.1 | 0.5 | GO:0071541 | eukaryotic translation initiation factor 3 complex, eIF3m(GO:0071541) |
| 0.1 | 0.5 | GO:0034709 | methylosome(GO:0034709) |
| 0.1 | 0.2 | GO:1990907 | beta-catenin-TCF complex(GO:1990907) |
| 0.1 | 4.1 | GO:0005840 | ribosome(GO:0005840) |
| 0.1 | 1.0 | GO:0005753 | mitochondrial proton-transporting ATP synthase complex(GO:0005753) |
| 0.1 | 0.3 | GO:0098845 | postsynaptic endosome(GO:0098845) |
| 0.1 | 0.3 | GO:0002189 | ribose phosphate diphosphokinase complex(GO:0002189) |
| 0.1 | 0.2 | GO:0043159 | acrosomal matrix(GO:0043159) |
| 0.1 | 0.1 | GO:0035068 | micro-ribonucleoprotein complex(GO:0035068) |
| 0.1 | 0.1 | GO:1990429 | Pex17p-Pex14p docking complex(GO:1990415) peroxisomal importomer complex(GO:1990429) |
| 0.1 | 1.0 | GO:0016471 | vacuolar proton-transporting V-type ATPase complex(GO:0016471) |
| 0.1 | 0.2 | GO:0031417 | NatC complex(GO:0031417) |
| 0.1 | 0.8 | GO:0035686 | sperm fibrous sheath(GO:0035686) |
| 0.1 | 0.9 | GO:0042612 | MHC class I protein complex(GO:0042612) |
| 0.1 | 0.2 | GO:0033185 | dolichol-phosphate-mannose synthase complex(GO:0033185) |
| 0.1 | 0.5 | GO:0008541 | proteasome regulatory particle, lid subcomplex(GO:0008541) |
| 0.1 | 0.4 | GO:0071986 | Ragulator complex(GO:0071986) |
| 0.1 | 4.8 | GO:0000786 | nucleosome(GO:0000786) |
| 0.1 | 0.2 | GO:0030906 | retromer, cargo-selective complex(GO:0030906) |
| 0.1 | 0.8 | GO:0044754 | autolysosome(GO:0044754) |
| 0.1 | 0.5 | GO:0033256 | I-kappaB/NF-kappaB complex(GO:0033256) |
| 0.1 | 0.2 | GO:0071204 | histone pre-mRNA 3'end processing complex(GO:0071204) |
| 0.1 | 0.6 | GO:0034362 | low-density lipoprotein particle(GO:0034362) |
| 0.1 | 0.3 | GO:0070847 | core mediator complex(GO:0070847) |
| 0.1 | 0.4 | GO:0005862 | muscle thin filament tropomyosin(GO:0005862) |
| 0.1 | 0.3 | GO:0071817 | MMXD complex(GO:0071817) |
| 0.0 | 0.3 | GO:0005785 | signal recognition particle receptor complex(GO:0005785) |
| 0.0 | 0.3 | GO:0005672 | transcription factor TFIIA complex(GO:0005672) |
| 0.0 | 0.2 | GO:0033588 | Elongator holoenzyme complex(GO:0033588) |
| 0.0 | 0.1 | GO:0071148 | TEAD-1-YAP complex(GO:0071148) |
| 0.0 | 0.2 | GO:0097196 | Shu complex(GO:0097196) |
| 0.0 | 0.6 | GO:0060091 | kinocilium(GO:0060091) |
| 0.0 | 0.3 | GO:0036194 | muscle cell projection(GO:0036194) muscle cell projection membrane(GO:0036195) |
| 0.0 | 0.4 | GO:0001940 | male pronucleus(GO:0001940) |
| 0.0 | 0.5 | GO:0032426 | stereocilium tip(GO:0032426) |
| 0.0 | 0.2 | GO:0032299 | ribonuclease H2 complex(GO:0032299) |
| 0.0 | 0.4 | GO:0072546 | ER membrane protein complex(GO:0072546) |
| 0.0 | 0.3 | GO:0016589 | NURF complex(GO:0016589) |
| 0.0 | 0.3 | GO:0042406 | extrinsic component of endoplasmic reticulum membrane(GO:0042406) |
| 0.0 | 0.1 | GO:0097058 | CRLF-CLCF1 complex(GO:0097058) |
| 0.0 | 0.3 | GO:0070578 | RISC-loading complex(GO:0070578) |
| 0.0 | 0.9 | GO:0030663 | COPI-coated vesicle membrane(GO:0030663) |
| 0.0 | 0.2 | GO:0031262 | Ndc80 complex(GO:0031262) |
| 0.0 | 0.2 | GO:0034657 | GID complex(GO:0034657) |
| 0.0 | 0.3 | GO:0000137 | Golgi cis cisterna(GO:0000137) |
| 0.0 | 0.3 | GO:0031595 | nuclear proteasome complex(GO:0031595) |
| 0.0 | 0.1 | GO:1990730 | VCP-NSFL1C complex(GO:1990730) |
| 0.0 | 0.3 | GO:0017059 | serine C-palmitoyltransferase complex(GO:0017059) endoplasmic reticulum palmitoyltransferase complex(GO:0031211) |
| 0.0 | 0.3 | GO:0030870 | Mre11 complex(GO:0030870) |
| 0.0 | 0.4 | GO:0031105 | septin complex(GO:0031105) |
| 0.0 | 0.1 | GO:0098982 | glycine-gated chloride channel complex(GO:0016935) GABA-ergic synapse(GO:0098982) |
| 0.0 | 0.4 | GO:0031298 | replication fork protection complex(GO:0031298) |
| 0.0 | 0.5 | GO:0072687 | meiotic spindle(GO:0072687) |
| 0.0 | 0.3 | GO:0061617 | MICOS complex(GO:0061617) |
| 0.0 | 0.2 | GO:0042567 | insulin-like growth factor ternary complex(GO:0042567) |
| 0.0 | 0.2 | GO:0097342 | ripoptosome(GO:0097342) |
| 0.0 | 0.1 | GO:0046691 | intracellular canaliculus(GO:0046691) |
| 0.0 | 0.2 | GO:0005869 | dynactin complex(GO:0005869) |
| 0.0 | 0.2 | GO:0042382 | paraspeckles(GO:0042382) |
| 0.0 | 0.1 | GO:0005853 | eukaryotic translation elongation factor 1 complex(GO:0005853) |
| 0.0 | 0.2 | GO:0005744 | mitochondrial inner membrane presequence translocase complex(GO:0005744) |
| 0.0 | 0.3 | GO:0036513 | Derlin-1 retrotranslocation complex(GO:0036513) |
| 0.0 | 0.2 | GO:0071014 | post-mRNA release spliceosomal complex(GO:0071014) |
| 0.0 | 0.2 | GO:0033010 | paranodal junction(GO:0033010) |
| 0.0 | 0.4 | GO:0030008 | TRAPP complex(GO:0030008) |
| 0.0 | 0.3 | GO:0005885 | Arp2/3 protein complex(GO:0005885) |
| 0.0 | 0.1 | GO:0030062 | mitochondrial tricarboxylic acid cycle enzyme complex(GO:0030062) |
| 0.0 | 0.1 | GO:0035101 | FACT complex(GO:0035101) |
| 0.0 | 0.3 | GO:0031462 | Cul2-RING ubiquitin ligase complex(GO:0031462) |
| 0.0 | 0.4 | GO:0005859 | muscle myosin complex(GO:0005859) |
| 0.0 | 0.1 | GO:0061574 | ASAP complex(GO:0061574) |
| 0.0 | 0.3 | GO:0070469 | respiratory chain(GO:0070469) |
| 0.0 | 0.4 | GO:0042589 | zymogen granule membrane(GO:0042589) |
| 0.0 | 2.1 | GO:0005758 | mitochondrial intermembrane space(GO:0005758) |
| 0.0 | 0.7 | GO:0031305 | intrinsic component of mitochondrial inner membrane(GO:0031304) integral component of mitochondrial inner membrane(GO:0031305) |
| 0.0 | 0.1 | GO:0005945 | 6-phosphofructokinase complex(GO:0005945) |
| 0.0 | 0.1 | GO:1990130 | Iml1 complex(GO:1990130) |
| 0.0 | 0.2 | GO:0042824 | MHC class I peptide loading complex(GO:0042824) |
| 0.0 | 0.1 | GO:0005927 | muscle tendon junction(GO:0005927) |
| 0.0 | 0.3 | GO:0097433 | dense body(GO:0097433) |
| 0.0 | 0.2 | GO:0005786 | signal recognition particle, endoplasmic reticulum targeting(GO:0005786) |
| 0.0 | 0.1 | GO:0005960 | glycine cleavage complex(GO:0005960) |
| 0.0 | 0.1 | GO:1990712 | HFE-transferrin receptor complex(GO:1990712) |
| 0.0 | 0.2 | GO:0034045 | pre-autophagosomal structure membrane(GO:0034045) |
| 0.0 | 0.1 | GO:0008622 | epsilon DNA polymerase complex(GO:0008622) |
| 0.0 | 0.2 | GO:1990023 | mitotic spindle midzone(GO:1990023) |
| 0.0 | 0.2 | GO:0016281 | eukaryotic translation initiation factor 4F complex(GO:0016281) |
| 0.0 | 0.1 | GO:0033290 | eukaryotic 48S preinitiation complex(GO:0033290) |
| 0.0 | 0.1 | GO:0032777 | Piccolo NuA4 histone acetyltransferase complex(GO:0032777) |
| 0.0 | 0.1 | GO:0031510 | SUMO activating enzyme complex(GO:0031510) |
| 0.0 | 0.2 | GO:0044233 | ER-mitochondrion membrane contact site(GO:0044233) |
| 0.0 | 0.2 | GO:0097197 | tetraspanin-enriched microdomain(GO:0097197) |
| 0.0 | 0.2 | GO:0099571 | postsynaptic actin cytoskeleton(GO:0098871) postsynaptic cytoskeleton(GO:0099571) |
| 0.0 | 0.1 | GO:0042765 | GPI-anchor transamidase complex(GO:0042765) |
| 0.0 | 0.1 | GO:0030478 | actin cap(GO:0030478) |
| 0.0 | 0.4 | GO:0005662 | DNA replication factor A complex(GO:0005662) |
| 0.0 | 0.1 | GO:0005971 | ribonucleoside-diphosphate reductase complex(GO:0005971) |
| 0.0 | 0.1 | GO:0070545 | PeBoW complex(GO:0070545) |
| 0.0 | 0.1 | GO:0032983 | kainate selective glutamate receptor complex(GO:0032983) |
| 0.0 | 0.1 | GO:0097452 | GAIT complex(GO:0097452) |
| 0.0 | 0.2 | GO:0042587 | glycogen granule(GO:0042587) |
| 0.0 | 2.0 | GO:0048770 | melanosome(GO:0042470) pigment granule(GO:0048770) |
| 0.0 | 0.6 | GO:0000159 | protein phosphatase type 2A complex(GO:0000159) |
| 0.0 | 0.1 | GO:0070937 | CRD-mediated mRNA stability complex(GO:0070937) |
| 0.0 | 0.3 | GO:0097539 | ciliary transition fiber(GO:0097539) |
| 0.0 | 0.2 | GO:0016600 | flotillin complex(GO:0016600) |
| 0.0 | 0.1 | GO:0000802 | transverse filament(GO:0000802) |
| 0.0 | 0.2 | GO:0031464 | Cul4A-RING E3 ubiquitin ligase complex(GO:0031464) |
| 0.0 | 0.1 | GO:0048476 | Holliday junction resolvase complex(GO:0048476) |
| 0.0 | 0.2 | GO:0030915 | Smc5-Smc6 complex(GO:0030915) |
| 0.0 | 0.2 | GO:0022624 | proteasome accessory complex(GO:0022624) |
| 0.0 | 0.1 | GO:0000164 | protein phosphatase type 1 complex(GO:0000164) |
| 0.0 | 0.3 | GO:0030867 | rough endoplasmic reticulum membrane(GO:0030867) |
| 0.0 | 0.1 | GO:0043625 | delta DNA polymerase complex(GO:0043625) |
| 0.0 | 0.1 | GO:0043259 | laminin-10 complex(GO:0043259) |
| 0.0 | 0.1 | GO:0070765 | gamma-secretase complex(GO:0070765) |
| 0.0 | 0.2 | GO:0031390 | Ctf18 RFC-like complex(GO:0031390) |
| 0.0 | 0.1 | GO:0016461 | unconventional myosin complex(GO:0016461) |
| 0.0 | 0.1 | GO:0000814 | ESCRT II complex(GO:0000814) |
| 0.0 | 0.1 | GO:0005852 | eukaryotic translation initiation factor 3 complex(GO:0005852) |
| 0.0 | 0.2 | GO:0000506 | glycosylphosphatidylinositol-N-acetylglucosaminyltransferase (GPI-GnT) complex(GO:0000506) |
| 0.0 | 0.1 | GO:0034663 | endoplasmic reticulum chaperone complex(GO:0034663) |
| 0.0 | 0.1 | GO:1903768 | sweet taste receptor complex(GO:1903767) taste receptor complex(GO:1903768) |
| 0.0 | 0.1 | GO:0046696 | lipopolysaccharide receptor complex(GO:0046696) |
| 0.0 | 0.1 | GO:0033596 | TSC1-TSC2 complex(GO:0033596) |
| 0.0 | 0.4 | GO:0030687 | preribosome, large subunit precursor(GO:0030687) |
| 0.0 | 0.4 | GO:0005665 | DNA-directed RNA polymerase II, core complex(GO:0005665) |
| 0.0 | 0.2 | GO:0005796 | Golgi lumen(GO:0005796) |
| 0.0 | 0.0 | GO:0031166 | integral component of vacuolar membrane(GO:0031166) intrinsic component of vacuolar membrane(GO:0031310) |
| 0.0 | 0.4 | GO:0030670 | phagocytic vesicle membrane(GO:0030670) |
| 0.0 | 0.1 | GO:0031232 | extrinsic component of external side of plasma membrane(GO:0031232) |
| 0.0 | 0.3 | GO:0070971 | endoplasmic reticulum exit site(GO:0070971) |
| 0.0 | 0.1 | GO:0014801 | longitudinal sarcoplasmic reticulum(GO:0014801) |
| 0.0 | 0.0 | GO:0032798 | Swi5-Sfr1 complex(GO:0032798) |
| 0.0 | 0.0 | GO:0030485 | smooth muscle contractile fiber(GO:0030485) |
| 0.0 | 0.2 | GO:0051233 | spindle midzone(GO:0051233) |
| 0.0 | 0.2 | GO:0017071 | intracellular cyclic nucleotide activated cation channel complex(GO:0017071) |
| 0.0 | 0.2 | GO:0042613 | MHC class II protein complex(GO:0042613) |
| 0.0 | 0.1 | GO:0000015 | phosphopyruvate hydratase complex(GO:0000015) |
| 0.0 | 0.1 | GO:0002142 | stereocilia ankle link complex(GO:0002142) |
| 0.0 | 0.2 | GO:0001673 | male germ cell nucleus(GO:0001673) |
| 0.0 | 0.0 | GO:0031515 | tRNA (m1A) methyltransferase complex(GO:0031515) |
| 0.0 | 0.0 | GO:0031372 | UBC13-MMS2 complex(GO:0031372) |
| 0.0 | 0.1 | GO:0043202 | lysosomal lumen(GO:0043202) |
| 0.0 | 0.0 | GO:0097149 | centralspindlin complex(GO:0097149) |
| 0.0 | 0.1 | GO:0072379 | BAT3 complex(GO:0071818) ER membrane insertion complex(GO:0072379) |
| 0.0 | 0.1 | GO:1990769 | proximal neuron projection(GO:1990769) |
| 0.0 | 0.2 | GO:0005832 | chaperonin-containing T-complex(GO:0005832) |
| 0.0 | 0.1 | GO:0005858 | axonemal dynein complex(GO:0005858) |
| 0.0 | 0.5 | GO:0005834 | heterotrimeric G-protein complex(GO:0005834) |
| 0.0 | 4.0 | GO:0030141 | secretory granule(GO:0030141) |
| 0.0 | 0.2 | GO:0030904 | retromer complex(GO:0030904) |
| 0.0 | 0.1 | GO:0042105 | alpha-beta T cell receptor complex(GO:0042105) |
| 0.0 | 0.2 | GO:0098984 | neuron to neuron synapse(GO:0098984) |
| 0.0 | 0.0 | GO:1902560 | GMP reductase complex(GO:1902560) |
| 0.0 | 0.0 | GO:0033165 | interphotoreceptor matrix(GO:0033165) |
| 0.0 | 0.0 | GO:0000322 | storage vacuole(GO:0000322) |
| 0.0 | 0.1 | GO:0043564 | Ku70:Ku80 complex(GO:0043564) |
| 0.0 | 0.1 | GO:1990716 | axonemal central apparatus(GO:1990716) |
| 0.0 | 0.1 | GO:0017101 | aminoacyl-tRNA synthetase multienzyme complex(GO:0017101) |
| 0.0 | 0.0 | GO:0005967 | mitochondrial pyruvate dehydrogenase complex(GO:0005967) |
| 0.0 | 0.2 | GO:0046581 | intercellular canaliculus(GO:0046581) |
| 0.0 | 0.0 | GO:0034457 | Mpp10 complex(GO:0034457) |
| 0.0 | 0.0 | GO:0031233 | intrinsic component of external side of plasma membrane(GO:0031233) |
| 0.0 | 0.9 | GO:0031225 | anchored component of membrane(GO:0031225) |
| 0.0 | 0.0 | GO:0035032 | phosphatidylinositol 3-kinase complex, class III(GO:0035032) |
| 0.0 | 0.1 | GO:0044326 | dendritic spine neck(GO:0044326) |
| 0.0 | 0.2 | GO:0031231 | integral component of peroxisomal membrane(GO:0005779) intrinsic component of peroxisomal membrane(GO:0031231) |
| 0.0 | 0.2 | GO:0005640 | nuclear outer membrane(GO:0005640) |
| 0.0 | 0.1 | GO:1990454 | L-type voltage-gated calcium channel complex(GO:1990454) |
| 0.0 | 0.1 | GO:0034388 | Pwp2p-containing subcomplex of 90S preribosome(GO:0034388) |
| 0.0 | 0.1 | GO:0072669 | tRNA-splicing ligase complex(GO:0072669) |
| 0.0 | 0.0 | GO:0070195 | growth hormone receptor complex(GO:0070195) |
| 0.0 | 0.0 | GO:0032156 | septin cytoskeleton(GO:0032156) |
| 0.0 | 0.1 | GO:0034719 | SMN-Sm protein complex(GO:0034719) |
Gene overrepresentation in molecular function category:
| Log-likelihood per target | Total log-likelihood | Term | Description |
|---|---|---|---|
| 0.4 | 1.3 | GO:0004698 | calcium-dependent protein kinase C activity(GO:0004698) |
| 0.4 | 1.6 | GO:0051870 | methotrexate binding(GO:0051870) |
| 0.4 | 1.2 | GO:0031893 | vasopressin receptor binding(GO:0031893) |
| 0.4 | 1.1 | GO:0031720 | haptoglobin binding(GO:0031720) |
| 0.4 | 2.8 | GO:0005344 | oxygen transporter activity(GO:0005344) |
| 0.2 | 0.6 | GO:0070976 | TIR domain binding(GO:0070976) |
| 0.2 | 0.6 | GO:0004807 | triose-phosphate isomerase activity(GO:0004807) |
| 0.2 | 0.8 | GO:0030492 | hemoglobin binding(GO:0030492) |
| 0.2 | 0.6 | GO:0002060 | purine nucleobase binding(GO:0002060) |
| 0.2 | 5.2 | GO:0005184 | neuropeptide hormone activity(GO:0005184) |
| 0.2 | 0.6 | GO:0004566 | beta-glucuronidase activity(GO:0004566) |
| 0.2 | 1.0 | GO:0004090 | carbonyl reductase (NADPH) activity(GO:0004090) |
| 0.2 | 0.5 | GO:0004464 | leukotriene-C4 synthase activity(GO:0004464) |
| 0.2 | 1.1 | GO:0070181 | small ribosomal subunit rRNA binding(GO:0070181) |
| 0.2 | 0.5 | GO:0050145 | nucleoside phosphate kinase activity(GO:0050145) |
| 0.2 | 0.6 | GO:0004969 | histamine receptor activity(GO:0004969) |
| 0.2 | 1.4 | GO:1990446 | U1 snRNP binding(GO:1990446) |
| 0.2 | 0.6 | GO:0033149 | FFAT motif binding(GO:0033149) |
| 0.1 | 0.7 | GO:0004126 | cytidine deaminase activity(GO:0004126) |
| 0.1 | 0.4 | GO:0050220 | prostaglandin-E synthase activity(GO:0050220) |
| 0.1 | 1.2 | GO:0016681 | ubiquinol-cytochrome-c reductase activity(GO:0008121) oxidoreductase activity, acting on diphenols and related substances as donors, cytochrome as acceptor(GO:0016681) |
| 0.1 | 0.4 | GO:0034437 | glycoprotein transporter activity(GO:0034437) |
| 0.1 | 0.7 | GO:0018812 | 3-hydroxyacyl-CoA dehydratase activity(GO:0018812) |
| 0.1 | 0.5 | GO:0004449 | isocitrate dehydrogenase (NAD+) activity(GO:0004449) |
| 0.1 | 0.1 | GO:0001758 | retinal dehydrogenase activity(GO:0001758) |
| 0.1 | 0.5 | GO:0099510 | calcium ion binding involved in regulation of cytosolic calcium ion concentration(GO:0099510) |
| 0.1 | 0.5 | GO:0036004 | GAF domain binding(GO:0036004) |
| 0.1 | 0.4 | GO:0004938 | alpha2-adrenergic receptor activity(GO:0004938) |
| 0.1 | 1.0 | GO:0050815 | phosphoserine binding(GO:0050815) |
| 0.1 | 0.7 | GO:0098519 | nucleotide phosphatase activity, acting on free nucleotides(GO:0098519) |
| 0.1 | 0.3 | GO:0004663 | Rab geranylgeranyltransferase activity(GO:0004663) |
| 0.1 | 0.5 | GO:0008241 | peptidyl-dipeptidase activity(GO:0008241) |
| 0.1 | 0.3 | GO:0008177 | succinate dehydrogenase (ubiquinone) activity(GO:0008177) |
| 0.1 | 1.0 | GO:0051022 | Rho GDP-dissociation inhibitor binding(GO:0051022) |
| 0.1 | 0.4 | GO:0004365 | glyceraldehyde-3-phosphate dehydrogenase (NAD+) (phosphorylating) activity(GO:0004365) glyceraldehyde-3-phosphate dehydrogenase (NAD(P)+) (phosphorylating) activity(GO:0043891) |
| 0.1 | 2.7 | GO:0004298 | threonine-type endopeptidase activity(GO:0004298) threonine-type peptidase activity(GO:0070003) |
| 0.1 | 0.3 | GO:0019807 | aspartoacylase activity(GO:0019807) |
| 0.1 | 25.9 | GO:0003735 | structural constituent of ribosome(GO:0003735) |
| 0.1 | 0.3 | GO:0019912 | cyclin-dependent protein kinase activating kinase activity(GO:0019912) |
| 0.1 | 2.5 | GO:0003954 | NADH dehydrogenase activity(GO:0003954) |
| 0.1 | 0.5 | GO:0032051 | clathrin light chain binding(GO:0032051) |
| 0.1 | 0.4 | GO:0030911 | TPR domain binding(GO:0030911) |
| 0.1 | 0.3 | GO:0030984 | kininogen binding(GO:0030984) |
| 0.1 | 0.3 | GO:0035514 | DNA demethylase activity(GO:0035514) |
| 0.1 | 0.2 | GO:0004982 | N-formyl peptide receptor activity(GO:0004982) |
| 0.1 | 0.2 | GO:0030023 | extracellular matrix constituent conferring elasticity(GO:0030023) |
| 0.1 | 0.4 | GO:0046923 | ER retention sequence binding(GO:0046923) |
| 0.1 | 0.2 | GO:0004925 | prolactin receptor activity(GO:0004925) |
| 0.1 | 0.2 | GO:0004392 | heme oxygenase (decyclizing) activity(GO:0004392) |
| 0.1 | 0.4 | GO:0050833 | pyruvate transmembrane transporter activity(GO:0050833) |
| 0.1 | 0.5 | GO:0030881 | beta-2-microglobulin binding(GO:0030881) |
| 0.1 | 0.2 | GO:0005333 | norepinephrine transmembrane transporter activity(GO:0005333) |
| 0.1 | 0.2 | GO:0015199 | amino-acid betaine transmembrane transporter activity(GO:0015199) carnitine transmembrane transporter activity(GO:0015226) |
| 0.1 | 0.7 | GO:0015450 | P-P-bond-hydrolysis-driven protein transmembrane transporter activity(GO:0015450) |
| 0.1 | 0.2 | GO:0004167 | dopachrome isomerase activity(GO:0004167) |
| 0.1 | 0.3 | GO:0005330 | dopamine:sodium symporter activity(GO:0005330) |
| 0.1 | 0.4 | GO:0019770 | IgG receptor activity(GO:0019770) |
| 0.1 | 0.9 | GO:0070324 | thyroid hormone binding(GO:0070324) |
| 0.1 | 0.4 | GO:0035368 | selenocysteine insertion sequence binding(GO:0035368) |
| 0.1 | 0.2 | GO:0016403 | dimethylargininase activity(GO:0016403) |
| 0.1 | 0.5 | GO:0016714 | oxidoreductase activity, acting on paired donors, with incorporation or reduction of molecular oxygen, reduced pteridine as one donor, and incorporation of one atom of oxygen(GO:0016714) |
| 0.1 | 0.3 | GO:0070883 | pre-miRNA binding(GO:0070883) |
| 0.1 | 1.5 | GO:0046933 | proton-transporting ATP synthase activity, rotational mechanism(GO:0046933) |
| 0.1 | 0.2 | GO:0047025 | 3-oxoacyl-[acyl-carrier-protein] reductase (NADH) activity(GO:0047025) |
| 0.1 | 0.4 | GO:0004103 | choline kinase activity(GO:0004103) |
| 0.1 | 0.2 | GO:0016882 | cyclo-ligase activity(GO:0016882) |
| 0.1 | 0.2 | GO:0031752 | D5 dopamine receptor binding(GO:0031752) |
| 0.1 | 1.5 | GO:0051537 | 2 iron, 2 sulfur cluster binding(GO:0051537) |
| 0.1 | 0.1 | GO:0071208 | histone pre-mRNA DCP binding(GO:0071208) |
| 0.1 | 0.4 | GO:0031802 | type 5 metabotropic glutamate receptor binding(GO:0031802) |
| 0.1 | 0.2 | GO:0033823 | procollagen-lysine 5-dioxygenase activity(GO:0008475) procollagen glucosyltransferase activity(GO:0033823) |
| 0.1 | 0.2 | GO:0047045 | testosterone 17-beta-dehydrogenase (NADP+) activity(GO:0047045) |
| 0.1 | 0.5 | GO:0016624 | oxidoreductase activity, acting on the aldehyde or oxo group of donors, disulfide as acceptor(GO:0016624) |
| 0.1 | 0.3 | GO:0019863 | IgE binding(GO:0019863) advanced glycation end-product receptor activity(GO:0050785) |
| 0.1 | 0.3 | GO:0031705 | bombesin receptor binding(GO:0031705) |
| 0.1 | 0.7 | GO:0043023 | ribosomal large subunit binding(GO:0043023) |
| 0.1 | 0.7 | GO:0019911 | structural constituent of myelin sheath(GO:0019911) |
| 0.1 | 0.3 | GO:0008504 | monoamine transmembrane transporter activity(GO:0008504) |
| 0.1 | 0.2 | GO:0004058 | aromatic-L-amino-acid decarboxylase activity(GO:0004058) L-dopa decarboxylase activity(GO:0036468) |
| 0.1 | 0.4 | GO:0035242 | protein-arginine omega-N asymmetric methyltransferase activity(GO:0035242) |
| 0.1 | 5.3 | GO:0004984 | olfactory receptor activity(GO:0004984) |
| 0.1 | 0.2 | GO:0015220 | choline transmembrane transporter activity(GO:0015220) |
| 0.1 | 0.1 | GO:0019763 | immunoglobulin receptor activity(GO:0019763) |
| 0.1 | 0.2 | GO:0004069 | L-aspartate:2-oxoglutarate aminotransferase activity(GO:0004069) |
| 0.1 | 0.2 | GO:0016971 | flavin-linked sulfhydryl oxidase activity(GO:0016971) |
| 0.1 | 0.4 | GO:0019976 | interleukin-2 binding(GO:0019976) |
| 0.1 | 0.4 | GO:0046920 | alpha-(1->3)-fucosyltransferase activity(GO:0046920) |
| 0.1 | 0.2 | GO:0004946 | bombesin receptor activity(GO:0004946) |
| 0.1 | 0.2 | GO:0003845 | 11-beta-hydroxysteroid dehydrogenase [NAD(P)] activity(GO:0003845) |
| 0.1 | 0.2 | GO:0008142 | oxysterol binding(GO:0008142) |
| 0.1 | 0.6 | GO:0016783 | sulfurtransferase activity(GO:0016783) |
| 0.1 | 0.2 | GO:0071885 | N-terminal protein N-methyltransferase activity(GO:0071885) |
| 0.1 | 0.2 | GO:0042806 | fucose binding(GO:0042806) |
| 0.1 | 1.7 | GO:0015002 | cytochrome-c oxidase activity(GO:0004129) heme-copper terminal oxidase activity(GO:0015002) oxidoreductase activity, acting on a heme group of donors, oxygen as acceptor(GO:0016676) |
| 0.1 | 0.2 | GO:0004582 | dolichyl-phosphate beta-D-mannosyltransferase activity(GO:0004582) |
| 0.1 | 0.2 | GO:0050429 | calcium-dependent phospholipase C activity(GO:0050429) |
| 0.1 | 0.2 | GO:0044378 | non-sequence-specific DNA binding, bending(GO:0044378) |
| 0.1 | 0.4 | GO:0043423 | 3-phosphoinositide-dependent protein kinase binding(GO:0043423) |
| 0.1 | 0.2 | GO:0008401 | retinoic acid 4-hydroxylase activity(GO:0008401) |
| 0.1 | 0.5 | GO:0031701 | angiotensin receptor binding(GO:0031701) |
| 0.1 | 0.2 | GO:0036042 | long-chain fatty acyl-CoA binding(GO:0036042) |
| 0.1 | 0.2 | GO:0060228 | phosphatidylcholine-sterol O-acyltransferase activator activity(GO:0060228) |
| 0.1 | 0.7 | GO:0005528 | macrolide binding(GO:0005527) FK506 binding(GO:0005528) |
| 0.1 | 0.2 | GO:0018479 | benzaldehyde dehydrogenase (NAD+) activity(GO:0018479) |
| 0.1 | 0.2 | GO:0036132 | 13-prostaglandin reductase activity(GO:0036132) |
| 0.1 | 0.1 | GO:0004647 | phosphoserine phosphatase activity(GO:0004647) |
| 0.1 | 0.2 | GO:0044715 | 8-oxo-dGDP phosphatase activity(GO:0044715) |
| 0.1 | 0.8 | GO:0008253 | 5'-nucleotidase activity(GO:0008253) |
| 0.1 | 0.2 | GO:0000033 | alpha-1,3-mannosyltransferase activity(GO:0000033) |
| 0.1 | 0.2 | GO:0004459 | L-lactate dehydrogenase activity(GO:0004459) |
| 0.0 | 0.3 | GO:0008312 | 7S RNA binding(GO:0008312) |
| 0.0 | 0.2 | GO:0016608 | growth hormone-releasing hormone activity(GO:0016608) |
| 0.0 | 0.3 | GO:0046979 | TAP binding(GO:0046977) TAP1 binding(GO:0046978) TAP2 binding(GO:0046979) |
| 0.0 | 0.2 | GO:0047179 | platelet-activating factor acetyltransferase activity(GO:0047179) |
| 0.0 | 0.3 | GO:0010853 | cyclase activator activity(GO:0010853) guanylate cyclase activator activity(GO:0030250) |
| 0.0 | 0.1 | GO:0072542 | protein phosphatase activator activity(GO:0072542) |
| 0.0 | 0.3 | GO:0005338 | nucleotide-sugar transmembrane transporter activity(GO:0005338) |
| 0.0 | 0.3 | GO:0019788 | NEDD8 transferase activity(GO:0019788) |
| 0.0 | 0.3 | GO:0035197 | siRNA binding(GO:0035197) |
| 0.0 | 0.1 | GO:0042903 | tubulin deacetylase activity(GO:0042903) |
| 0.0 | 0.1 | GO:0046573 | lactonohydrolase activity(GO:0046573) acyl-L-homoserine-lactone lactonohydrolase activity(GO:0102007) |
| 0.0 | 0.6 | GO:0035174 | histone serine kinase activity(GO:0035174) |
| 0.0 | 0.3 | GO:0036402 | proteasome-activating ATPase activity(GO:0036402) |
| 0.0 | 0.3 | GO:0004767 | sphingomyelin phosphodiesterase activity(GO:0004767) |
| 0.0 | 0.2 | GO:0089720 | caspase binding(GO:0089720) |
| 0.0 | 0.4 | GO:0047498 | calcium-dependent phospholipase A2 activity(GO:0047498) |
| 0.0 | 0.1 | GO:0004127 | cytidylate kinase activity(GO:0004127) |
| 0.0 | 0.1 | GO:0004774 | succinate-CoA ligase activity(GO:0004774) succinate-CoA ligase (ADP-forming) activity(GO:0004775) |
| 0.0 | 0.1 | GO:0034057 | RNA strand-exchange activity(GO:0034057) |
| 0.0 | 0.4 | GO:0022833 | mechanically-gated ion channel activity(GO:0008381) mechanically gated channel activity(GO:0022833) |
| 0.0 | 0.3 | GO:0004749 | ribose phosphate diphosphokinase activity(GO:0004749) |
| 0.0 | 0.1 | GO:0070735 | protein-glycine ligase activity(GO:0070735) |
| 0.0 | 0.2 | GO:0004144 | diacylglycerol O-acyltransferase activity(GO:0004144) |
| 0.0 | 0.5 | GO:0008199 | ferric iron binding(GO:0008199) |
| 0.0 | 0.1 | GO:0042015 | interleukin-20 binding(GO:0042015) |
| 0.0 | 0.2 | GO:0070739 | protein-glutamic acid ligase activity(GO:0070739) |
| 0.0 | 0.1 | GO:0031783 | corticotropin hormone receptor binding(GO:0031780) type 5 melanocortin receptor binding(GO:0031783) |
| 0.0 | 0.0 | GO:0032427 | GBD domain binding(GO:0032427) |
| 0.0 | 0.1 | GO:0070012 | oligopeptidase activity(GO:0070012) |
| 0.0 | 0.1 | GO:0032422 | purine-rich negative regulatory element binding(GO:0032422) |
| 0.0 | 0.3 | GO:0016861 | intramolecular oxidoreductase activity, interconverting aldoses and ketoses(GO:0016861) |
| 0.0 | 0.2 | GO:0019959 | interleukin-8 binding(GO:0019959) |
| 0.0 | 0.2 | GO:0034431 | endopolyphosphatase activity(GO:0000298) diphosphoinositol-polyphosphate diphosphatase activity(GO:0008486) bis(5'-adenosyl)-hexaphosphatase activity(GO:0034431) bis(5'-adenosyl)-pentaphosphatase activity(GO:0034432) |
| 0.0 | 0.2 | GO:0019834 | phospholipase A2 inhibitor activity(GO:0019834) |
| 0.0 | 0.2 | GO:0047751 | 3-oxo-5-alpha-steroid 4-dehydrogenase activity(GO:0003865) cholestenone 5-alpha-reductase activity(GO:0047751) |
| 0.0 | 0.3 | GO:1990459 | transferrin receptor binding(GO:1990459) |
| 0.0 | 0.1 | GO:0005131 | growth hormone receptor binding(GO:0005131) |
| 0.0 | 0.1 | GO:0005171 | hepatocyte growth factor receptor binding(GO:0005171) |
| 0.0 | 0.5 | GO:0004861 | cyclin-dependent protein serine/threonine kinase inhibitor activity(GO:0004861) |
| 0.0 | 0.2 | GO:0030297 | transmembrane receptor protein tyrosine kinase activator activity(GO:0030297) |
| 0.0 | 0.2 | GO:0035727 | lysophosphatidic acid binding(GO:0035727) |
| 0.0 | 0.6 | GO:0050308 | sugar-phosphatase activity(GO:0050308) |
| 0.0 | 0.2 | GO:0004814 | arginine-tRNA ligase activity(GO:0004814) |
| 0.0 | 0.1 | GO:0086057 | voltage-gated calcium channel activity involved in bundle of His cell action potential(GO:0086057) |
| 0.0 | 0.1 | GO:0019211 | phosphatase activator activity(GO:0019211) |
| 0.0 | 0.2 | GO:0001594 | trace-amine receptor activity(GO:0001594) |
| 0.0 | 0.3 | GO:0019238 | cyclohydrolase activity(GO:0019238) |
| 0.0 | 0.3 | GO:0031995 | insulin-like growth factor II binding(GO:0031995) |
| 0.0 | 0.3 | GO:0004111 | creatine kinase activity(GO:0004111) |
| 0.0 | 0.2 | GO:0004826 | phenylalanine-tRNA ligase activity(GO:0004826) |
| 0.0 | 0.7 | GO:0055103 | ligase regulator activity(GO:0055103) |
| 0.0 | 0.1 | GO:0004839 | ubiquitin activating enzyme activity(GO:0004839) |
| 0.0 | 0.0 | GO:0030283 | testosterone dehydrogenase [NAD(P)] activity(GO:0030283) |
| 0.0 | 0.1 | GO:0022852 | glycine-gated chloride ion channel activity(GO:0022852) |
| 0.0 | 0.1 | GO:0004859 | phospholipase inhibitor activity(GO:0004859) |
| 0.0 | 0.1 | GO:0070404 | NADH binding(GO:0070404) |
| 0.0 | 0.5 | GO:0048156 | tau protein binding(GO:0048156) |
| 0.0 | 0.1 | GO:0050786 | RAGE receptor binding(GO:0050786) |
| 0.0 | 0.1 | GO:0036470 | tyrosine 3-monooxygenase activator activity(GO:0036470) L-dopa decarboxylase activator activity(GO:0036478) |
| 0.0 | 2.7 | GO:0005179 | hormone activity(GO:0005179) |
| 0.0 | 0.0 | GO:0051021 | GDP-dissociation inhibitor binding(GO:0051021) |
| 0.0 | 0.2 | GO:0004427 | inorganic diphosphatase activity(GO:0004427) |
| 0.0 | 0.1 | GO:0031419 | cobalamin binding(GO:0031419) |
| 0.0 | 0.4 | GO:0033691 | sialic acid binding(GO:0033691) |
| 0.0 | 0.1 | GO:0017042 | glycosylceramidase activity(GO:0017042) |
| 0.0 | 0.1 | GO:0005290 | L-histidine transmembrane transporter activity(GO:0005290) |
| 0.0 | 0.1 | GO:0004185 | serine-type carboxypeptidase activity(GO:0004185) |
| 0.0 | 0.4 | GO:0008191 | metalloendopeptidase inhibitor activity(GO:0008191) |
| 0.0 | 0.1 | GO:0032296 | ribonuclease III activity(GO:0004525) double-stranded RNA-specific ribonuclease activity(GO:0032296) |
| 0.0 | 0.3 | GO:0000774 | adenyl-nucleotide exchange factor activity(GO:0000774) |
| 0.0 | 0.1 | GO:0019776 | Atg8 ligase activity(GO:0019776) |
| 0.0 | 0.1 | GO:0071535 | RING-like zinc finger domain binding(GO:0071535) |
| 0.0 | 0.1 | GO:0005499 | vitamin D binding(GO:0005499) |
| 0.0 | 0.3 | GO:1990825 | sequence-specific mRNA binding(GO:1990825) |
| 0.0 | 0.1 | GO:0008900 | hydrogen:potassium-exchanging ATPase activity(GO:0008900) |
| 0.0 | 0.1 | GO:0033906 | hyaluronoglucuronidase activity(GO:0033906) |
| 0.0 | 0.2 | GO:0051787 | misfolded protein binding(GO:0051787) |
| 0.0 | 0.1 | GO:0004574 | oligo-1,6-glucosidase activity(GO:0004574) |
| 0.0 | 0.1 | GO:0042978 | ornithine decarboxylase activator activity(GO:0042978) |
| 0.0 | 0.2 | GO:0004351 | glutamate decarboxylase activity(GO:0004351) |
| 0.0 | 0.1 | GO:0016532 | superoxide dismutase copper chaperone activity(GO:0016532) |
| 0.0 | 0.4 | GO:0004029 | aldehyde dehydrogenase (NAD) activity(GO:0004029) |
| 0.0 | 0.0 | GO:0008097 | 5S rRNA binding(GO:0008097) |
| 0.0 | 0.1 | GO:0016899 | oxidoreductase activity, acting on the CH-OH group of donors, oxygen as acceptor(GO:0016899) |
| 0.0 | 0.2 | GO:0004974 | leukotriene receptor activity(GO:0004974) |
| 0.0 | 0.2 | GO:0008970 | phosphatidylcholine 1-acylhydrolase activity(GO:0008970) |
| 0.0 | 0.2 | GO:0008494 | translation activator activity(GO:0008494) |
| 0.0 | 0.1 | GO:0019958 | C-X-C chemokine binding(GO:0019958) |
| 0.0 | 0.1 | GO:0001565 | phorbol ester receptor activity(GO:0001565) |
| 0.0 | 0.1 | GO:0004169 | dolichyl-phosphate-mannose-protein mannosyltransferase activity(GO:0004169) |
| 0.0 | 0.1 | GO:0003922 | GMP synthase activity(GO:0003921) GMP synthase (glutamine-hydrolyzing) activity(GO:0003922) |
| 0.0 | 0.1 | GO:0004045 | aminoacyl-tRNA hydrolase activity(GO:0004045) |
| 0.0 | 0.5 | GO:0042288 | MHC class I protein binding(GO:0042288) |
| 0.0 | 0.1 | GO:0047619 | acylcarnitine hydrolase activity(GO:0047619) |
| 0.0 | 0.1 | GO:0042392 | sphingosine-1-phosphate phosphatase activity(GO:0042392) |
| 0.0 | 0.1 | GO:0003842 | 1-pyrroline-5-carboxylate dehydrogenase activity(GO:0003842) |
| 0.0 | 0.1 | GO:0086089 | voltage-gated potassium channel activity involved in atrial cardiac muscle cell action potential repolarization(GO:0086089) |
| 0.0 | 0.4 | GO:0004955 | prostaglandin receptor activity(GO:0004955) |
| 0.0 | 0.2 | GO:0015217 | ATP transmembrane transporter activity(GO:0005347) ADP transmembrane transporter activity(GO:0015217) |
| 0.0 | 0.1 | GO:0034618 | arginine binding(GO:0034618) |
| 0.0 | 0.2 | GO:0051920 | peroxiredoxin activity(GO:0051920) |
| 0.0 | 0.1 | GO:0008532 | N-acetyllactosaminide beta-1,3-N-acetylglucosaminyltransferase activity(GO:0008532) |
| 0.0 | 0.2 | GO:0031386 | protein tag(GO:0031386) |
| 0.0 | 0.6 | GO:0030247 | pattern binding(GO:0001871) polysaccharide binding(GO:0030247) |
| 0.0 | 0.1 | GO:0017098 | sulfonylurea receptor binding(GO:0017098) |
| 0.0 | 0.3 | GO:0046703 | natural killer cell lectin-like receptor binding(GO:0046703) |
| 0.0 | 0.1 | GO:0035529 | NADH pyrophosphatase activity(GO:0035529) |
| 0.0 | 0.2 | GO:0046790 | virion binding(GO:0046790) |
| 0.0 | 0.4 | GO:0045236 | CXCR chemokine receptor binding(GO:0045236) |
| 0.0 | 0.1 | GO:0004335 | galactokinase activity(GO:0004335) |
| 0.0 | 0.1 | GO:0001591 | dopamine neurotransmitter receptor activity, coupled via Gi/Go(GO:0001591) |
| 0.0 | 0.7 | GO:0008157 | protein phosphatase 1 binding(GO:0008157) |
| 0.0 | 0.1 | GO:0045159 | myosin II binding(GO:0045159) |
| 0.0 | 0.4 | GO:0035925 | mRNA 3'-UTR AU-rich region binding(GO:0035925) |
| 0.0 | 0.2 | GO:0008479 | queuine tRNA-ribosyltransferase activity(GO:0008479) |
| 0.0 | 0.1 | GO:0019809 | spermidine binding(GO:0019809) |
| 0.0 | 0.7 | GO:0017025 | TBP-class protein binding(GO:0017025) |
| 0.0 | 0.3 | GO:0033170 | DNA clamp loader activity(GO:0003689) protein-DNA loading ATPase activity(GO:0033170) |
| 0.0 | 0.1 | GO:0003997 | acyl-CoA oxidase activity(GO:0003997) |
| 0.0 | 0.1 | GO:0045134 | uridine-diphosphatase activity(GO:0045134) |
| 0.0 | 0.2 | GO:0008172 | S-methyltransferase activity(GO:0008172) |
| 0.0 | 0.4 | GO:0008106 | alcohol dehydrogenase (NADP+) activity(GO:0008106) |
| 0.0 | 0.2 | GO:1990715 | mRNA CDS binding(GO:1990715) |
| 0.0 | 0.2 | GO:0016018 | cyclosporin A binding(GO:0016018) |
| 0.0 | 0.1 | GO:0004096 | catalase activity(GO:0004096) |
| 0.0 | 0.2 | GO:0046624 | sphingolipid transporter activity(GO:0046624) |
| 0.0 | 0.1 | GO:0010385 | double-stranded methylated DNA binding(GO:0010385) |
| 0.0 | 0.3 | GO:0015250 | water channel activity(GO:0015250) |
| 0.0 | 0.2 | GO:0030368 | interleukin-17 receptor activity(GO:0030368) |
| 0.0 | 0.2 | GO:1990381 | ubiquitin-specific protease binding(GO:1990381) |
| 0.0 | 0.1 | GO:0043262 | adenosine-diphosphatase activity(GO:0043262) |
| 0.0 | 0.1 | GO:0004448 | isocitrate dehydrogenase activity(GO:0004448) |
| 0.0 | 0.1 | GO:0004758 | serine C-palmitoyltransferase activity(GO:0004758) C-palmitoyltransferase activity(GO:0016454) |
| 0.0 | 0.4 | GO:0042609 | CD4 receptor binding(GO:0042609) |
| 0.0 | 0.1 | GO:0031208 | POZ domain binding(GO:0031208) |
| 0.0 | 0.2 | GO:0086006 | voltage-gated sodium channel activity involved in cardiac muscle cell action potential(GO:0086006) |
| 0.0 | 0.3 | GO:0004526 | ribonuclease P activity(GO:0004526) |
| 0.0 | 0.1 | GO:0004303 | estradiol 17-beta-dehydrogenase activity(GO:0004303) |
| 0.0 | 0.3 | GO:0070628 | proteasome binding(GO:0070628) |
| 0.0 | 0.1 | GO:0003923 | GPI-anchor transamidase activity(GO:0003923) |
| 0.0 | 0.0 | GO:0031711 | bradykinin receptor binding(GO:0031711) |
| 0.0 | 0.1 | GO:0000179 | rRNA (adenine-N6,N6-)-dimethyltransferase activity(GO:0000179) |
| 0.0 | 0.1 | GO:0003986 | acetyl-CoA hydrolase activity(GO:0003986) |
| 0.0 | 0.1 | GO:0050733 | RS domain binding(GO:0050733) |
| 0.0 | 0.1 | GO:0004809 | tRNA (guanine-N2-)-methyltransferase activity(GO:0004809) |
| 0.0 | 0.1 | GO:1990829 | C-rich single-stranded DNA binding(GO:1990829) |
| 0.0 | 0.8 | GO:0030544 | Hsp70 protein binding(GO:0030544) |
| 0.0 | 0.3 | GO:0015194 | L-serine transmembrane transporter activity(GO:0015194) serine transmembrane transporter activity(GO:0022889) |
| 0.0 | 0.1 | GO:0017089 | glycolipid transporter activity(GO:0017089) |
| 0.0 | 0.2 | GO:0005412 | glucose:sodium symporter activity(GO:0005412) |
| 0.0 | 0.1 | GO:1901612 | phosphatidylglycerol binding(GO:1901611) cardiolipin binding(GO:1901612) |
| 0.0 | 0.2 | GO:0048027 | mRNA 5'-UTR binding(GO:0048027) |
| 0.0 | 0.4 | GO:0008195 | phosphatidate phosphatase activity(GO:0008195) |
| 0.0 | 0.2 | GO:0004300 | enoyl-CoA hydratase activity(GO:0004300) |
| 0.0 | 0.1 | GO:0045340 | mercury ion binding(GO:0045340) |
| 0.0 | 0.2 | GO:0008440 | inositol-1,4,5-trisphosphate 3-kinase activity(GO:0008440) |
| 0.0 | 0.1 | GO:0016833 | oxo-acid-lyase activity(GO:0016833) |
| 0.0 | 0.2 | GO:1901702 | urate transmembrane transporter activity(GO:0015143) salt transmembrane transporter activity(GO:1901702) |
| 0.0 | 0.1 | GO:0030348 | syntaxin-3 binding(GO:0030348) |
| 0.0 | 0.7 | GO:0061650 | ubiquitin conjugating enzyme activity(GO:0061631) ubiquitin-like protein conjugating enzyme activity(GO:0061650) |
| 0.0 | 0.1 | GO:0033265 | choline binding(GO:0033265) |
| 0.0 | 0.4 | GO:0098641 | cadherin binding involved in cell-cell adhesion(GO:0098641) |
| 0.0 | 0.1 | GO:0017176 | phosphatidylinositol N-acetylglucosaminyltransferase activity(GO:0017176) |
| 0.0 | 0.1 | GO:0055100 | adiponectin binding(GO:0055100) |
| 0.0 | 0.2 | GO:0008131 | primary amine oxidase activity(GO:0008131) |
| 0.0 | 0.1 | GO:0099609 | microtubule lateral binding(GO:0099609) |
| 0.0 | 0.1 | GO:0032139 | dinucleotide insertion or deletion binding(GO:0032139) |
| 0.0 | 0.2 | GO:0005223 | intracellular cGMP activated cation channel activity(GO:0005223) |
| 0.0 | 0.1 | GO:0016647 | oxidoreductase activity, acting on the CH-NH group of donors, oxygen as acceptor(GO:0016647) |
| 0.0 | 1.5 | GO:0004867 | serine-type endopeptidase inhibitor activity(GO:0004867) |
| 0.0 | 0.1 | GO:0008427 | calcium-dependent protein kinase inhibitor activity(GO:0008427) calcium-dependent protein kinase regulator activity(GO:0010858) |
| 0.0 | 0.1 | GO:0015349 | thyroid hormone transmembrane transporter activity(GO:0015349) |
| 0.0 | 0.1 | GO:0015277 | kainate selective glutamate receptor activity(GO:0015277) |
| 0.0 | 0.1 | GO:0048019 | receptor antagonist activity(GO:0048019) |
| 0.0 | 0.8 | GO:0005504 | fatty acid binding(GO:0005504) |
| 0.0 | 0.2 | GO:0008656 | cysteine-type endopeptidase activator activity involved in apoptotic process(GO:0008656) |
| 0.0 | 0.2 | GO:0047134 | protein-disulfide reductase activity(GO:0047134) |
| 0.0 | 0.1 | GO:0034190 | apolipoprotein receptor binding(GO:0034190) |
| 0.0 | 0.1 | GO:0000268 | peroxisome targeting sequence binding(GO:0000268) |
| 0.0 | 0.1 | GO:0001010 | transcription factor activity, sequence-specific DNA binding transcription factor recruiting(GO:0001010) |
| 0.0 | 0.2 | GO:0003796 | lysozyme activity(GO:0003796) |
| 0.0 | 0.1 | GO:0005005 | transmembrane-ephrin receptor activity(GO:0005005) |
| 0.0 | 0.1 | GO:0005549 | odorant binding(GO:0005549) |
| 0.0 | 0.1 | GO:0017168 | 5-oxoprolinase (ATP-hydrolyzing) activity(GO:0017168) |
| 0.0 | 1.5 | GO:0051087 | chaperone binding(GO:0051087) |
| 0.0 | 0.1 | GO:0004052 | arachidonate 12-lipoxygenase activity(GO:0004052) |
| 0.0 | 0.0 | GO:0019841 | retinol binding(GO:0019841) |
| 0.0 | 0.6 | GO:0004364 | glutathione transferase activity(GO:0004364) |
| 0.0 | 0.1 | GO:0004332 | fructose-bisphosphate aldolase activity(GO:0004332) |
| 0.0 | 0.1 | GO:0032217 | riboflavin transporter activity(GO:0032217) |
| 0.0 | 0.2 | GO:0001055 | RNA polymerase II activity(GO:0001055) |
| 0.0 | 0.1 | GO:0005068 | transmembrane receptor protein tyrosine kinase adaptor activity(GO:0005068) |
| 0.0 | 0.2 | GO:0031730 | CCR5 chemokine receptor binding(GO:0031730) |
| 0.0 | 0.1 | GO:0016728 | ribonucleoside-diphosphate reductase activity, thioredoxin disulfide as acceptor(GO:0004748) oxidoreductase activity, acting on CH or CH2 groups, disulfide as acceptor(GO:0016728) ribonucleoside-diphosphate reductase activity(GO:0061731) |
| 0.0 | 0.1 | GO:0051575 | 5'-deoxyribose-5-phosphate lyase activity(GO:0051575) |
| 0.0 | 0.1 | GO:0071987 | WD40-repeat domain binding(GO:0071987) |
| 0.0 | 0.0 | GO:0033592 | RNA strand annealing activity(GO:0033592) |
| 0.0 | 0.1 | GO:0017169 | CDP-alcohol phosphatidyltransferase activity(GO:0017169) |
| 0.0 | 0.1 | GO:0005134 | interleukin-2 receptor binding(GO:0005134) |
| 0.0 | 0.1 | GO:0019002 | GMP binding(GO:0019002) |
| 0.0 | 0.6 | GO:0050699 | WW domain binding(GO:0050699) |
| 0.0 | 0.9 | GO:0051082 | unfolded protein binding(GO:0051082) |
| 0.0 | 0.1 | GO:0004852 | uroporphyrinogen-III synthase activity(GO:0004852) |
| 0.0 | 0.1 | GO:0046538 | bisphosphoglycerate mutase activity(GO:0004082) phosphoglycerate mutase activity(GO:0004619) 2,3-bisphosphoglycerate-dependent phosphoglycerate mutase activity(GO:0046538) |
| 0.0 | 0.1 | GO:0008889 | glycerophosphodiester phosphodiesterase activity(GO:0008889) |
| 0.0 | 0.0 | GO:0016716 | oxidoreductase activity, acting on paired donors, with incorporation or reduction of molecular oxygen, another compound as one donor, and incorporation of one atom of oxygen(GO:0016716) |
| 0.0 | 0.0 | GO:0003857 | 3-hydroxyacyl-CoA dehydrogenase activity(GO:0003857) |
| 0.0 | 0.3 | GO:0044769 | ATPase activity, coupled to transmembrane movement of ions, rotational mechanism(GO:0044769) |
| 0.0 | 0.0 | GO:0043812 | phosphatidylinositol-4-phosphate phosphatase activity(GO:0043812) |
| 0.0 | 0.1 | GO:0035650 | AP-1 adaptor complex binding(GO:0035650) |
| 0.0 | 0.1 | GO:0003988 | acetyl-CoA C-acyltransferase activity(GO:0003988) |
| 0.0 | 0.0 | GO:0034235 | GPI anchor binding(GO:0034235) |
| 0.0 | 0.3 | GO:0017049 | GTP-Rho binding(GO:0017049) |
| 0.0 | 0.0 | GO:0008476 | protein-tyrosine sulfotransferase activity(GO:0008476) |
| 0.0 | 0.5 | GO:0051059 | NF-kappaB binding(GO:0051059) |
| 0.0 | 0.1 | GO:0019864 | IgG binding(GO:0019864) |
| 0.0 | 0.2 | GO:0043522 | leucine zipper domain binding(GO:0043522) |
| 0.0 | 0.2 | GO:0097602 | cullin family protein binding(GO:0097602) |
| 0.0 | 0.2 | GO:0050750 | low-density lipoprotein particle receptor binding(GO:0050750) |
| 0.0 | 0.1 | GO:0031014 | troponin T binding(GO:0031014) |
| 0.0 | 0.1 | GO:0004634 | phosphopyruvate hydratase activity(GO:0004634) |
| 0.0 | 0.0 | GO:0016429 | tRNA (adenine-N1-)-methyltransferase activity(GO:0016429) |
| 0.0 | 0.1 | GO:0004416 | hydroxyacylglutathione hydrolase activity(GO:0004416) |
| 0.0 | 0.0 | GO:0008553 | hydrogen-exporting ATPase activity, phosphorylative mechanism(GO:0008553) |
| 0.0 | 0.0 | GO:0070053 | thrombospondin receptor activity(GO:0070053) |
| 0.0 | 0.3 | GO:0004198 | calcium-dependent cysteine-type endopeptidase activity(GO:0004198) |
| 0.0 | 0.1 | GO:0017040 | ceramidase activity(GO:0017040) |
| 0.0 | 0.2 | GO:0051371 | muscle alpha-actinin binding(GO:0051371) |
| 0.0 | 0.1 | GO:0005166 | neurotrophin p75 receptor binding(GO:0005166) |
| 0.0 | 0.2 | GO:0005402 | sugar:proton symporter activity(GO:0005351) cation:sugar symporter activity(GO:0005402) |
| 0.0 | 0.1 | GO:0034046 | poly(G) binding(GO:0034046) |
| 0.0 | 0.2 | GO:0008392 | arachidonic acid epoxygenase activity(GO:0008392) |
| 0.0 | 0.1 | GO:0016421 | CoA carboxylase activity(GO:0016421) |
| 0.0 | 0.1 | GO:0016918 | retinal binding(GO:0016918) |
| 0.0 | 0.3 | GO:0015020 | glucuronosyltransferase activity(GO:0015020) |
| 0.0 | 0.0 | GO:0031714 | C5a anaphylatoxin chemotactic receptor binding(GO:0031714) |
| 0.0 | 0.0 | GO:0047237 | glucuronylgalactosylproteoglycan 4-beta-N-acetylgalactosaminyltransferase activity(GO:0047237) |
| 0.0 | 0.2 | GO:0023026 | MHC class II protein complex binding(GO:0023026) |
| 0.0 | 0.1 | GO:0004865 | protein serine/threonine phosphatase inhibitor activity(GO:0004865) |
| 0.0 | 0.2 | GO:0070717 | poly-purine tract binding(GO:0070717) |
| 0.0 | 0.1 | GO:0016846 | carbon-sulfur lyase activity(GO:0016846) |
| 0.0 | 0.0 | GO:0008511 | sodium:potassium:chloride symporter activity(GO:0008511) |
| 0.0 | 0.1 | GO:0004118 | cGMP-stimulated cyclic-nucleotide phosphodiesterase activity(GO:0004118) |
| 0.0 | 0.1 | GO:0001665 | alpha-N-acetylgalactosaminide alpha-2,6-sialyltransferase activity(GO:0001665) |
| 0.0 | 0.2 | GO:0031005 | filamin binding(GO:0031005) |
| 0.0 | 0.1 | GO:0045505 | dynein intermediate chain binding(GO:0045505) |
| 0.0 | 0.0 | GO:0003920 | GMP reductase activity(GO:0003920) oxidoreductase activity, acting on NAD(P)H, nitrogenous group as acceptor(GO:0016657) |
| 0.0 | 0.3 | GO:0003755 | peptidyl-prolyl cis-trans isomerase activity(GO:0003755) cis-trans isomerase activity(GO:0016859) |
| 0.0 | 0.2 | GO:0003993 | acid phosphatase activity(GO:0003993) |
| 0.0 | 0.1 | GO:0004563 | beta-N-acetylhexosaminidase activity(GO:0004563) |
| 0.0 | 0.1 | GO:0050291 | sphingosine N-acyltransferase activity(GO:0050291) |
| 0.0 | 0.1 | GO:0016717 | oxidoreductase activity, acting on paired donors, with oxidation of a pair of donors resulting in the reduction of molecular oxygen to two molecules of water(GO:0016717) |
| 0.0 | 0.0 | GO:0015272 | ATP-activated inward rectifier potassium channel activity(GO:0015272) |
| 0.0 | 0.1 | GO:0070016 | armadillo repeat domain binding(GO:0070016) |
| 0.0 | 0.0 | GO:0031849 | olfactory receptor binding(GO:0031849) |
| 0.0 | 0.0 | GO:0030144 | alpha-1,6-mannosylglycoprotein 6-beta-N-acetylglucosaminyltransferase activity(GO:0030144) |
| 0.0 | 0.1 | GO:0016892 | endoribonuclease activity, producing 3'-phosphomonoesters(GO:0016892) |
| 0.0 | 0.2 | GO:0004089 | carbonate dehydratase activity(GO:0004089) |
| 0.0 | 0.1 | GO:0005176 | ErbB-2 class receptor binding(GO:0005176) |
| 0.0 | 0.2 | GO:0003746 | translation elongation factor activity(GO:0003746) |
| 0.0 | 0.2 | GO:0000400 | four-way junction DNA binding(GO:0000400) |
| 0.0 | 0.2 | GO:0016503 | pheromone receptor activity(GO:0016503) |
| 0.0 | 0.3 | GO:0035035 | histone acetyltransferase binding(GO:0035035) |
| 0.0 | 0.0 | GO:0008254 | 3'-nucleotidase activity(GO:0008254) |
| 0.0 | 0.1 | GO:0016813 | hydrolase activity, acting on carbon-nitrogen (but not peptide) bonds, in linear amidines(GO:0016813) |
| 0.0 | 0.0 | GO:0008396 | oxysterol 7-alpha-hydroxylase activity(GO:0008396) |
| 0.0 | 0.2 | GO:0001223 | transcription coactivator binding(GO:0001223) |
| 0.0 | 0.0 | GO:0008330 | protein tyrosine/threonine phosphatase activity(GO:0008330) |
| 0.0 | 0.1 | GO:0098505 | G-rich strand telomeric DNA binding(GO:0098505) |
| 0.0 | 0.0 | GO:0030976 | thiamine pyrophosphate binding(GO:0030976) |
| 0.0 | 0.0 | GO:0008449 | N-acetylglucosamine-6-sulfatase activity(GO:0008449) |
| 0.0 | 0.0 | GO:0035613 | RNA stem-loop binding(GO:0035613) |
| 0.0 | 0.1 | GO:1990247 | N6-methyladenosine-containing RNA binding(GO:1990247) |
| 0.0 | 0.1 | GO:0004568 | chitinase activity(GO:0004568) |
| 0.0 | 0.1 | GO:0015556 | C4-dicarboxylate transmembrane transporter activity(GO:0015556) |
| 0.0 | 0.0 | GO:0008109 | N-acetyllactosaminide beta-1,6-N-acetylglucosaminyltransferase activity(GO:0008109) |
| 0.0 | 0.0 | GO:0005087 | Ran guanyl-nucleotide exchange factor activity(GO:0005087) |
| 0.0 | 0.1 | GO:0004439 | phosphatidylinositol-4,5-bisphosphate 5-phosphatase activity(GO:0004439) |
| 0.0 | 0.0 | GO:0004903 | growth hormone receptor activity(GO:0004903) |
| 0.0 | 0.1 | GO:0003841 | 1-acylglycerol-3-phosphate O-acyltransferase activity(GO:0003841) |
| 0.0 | 0.1 | GO:0030550 | acetylcholine receptor inhibitor activity(GO:0030550) |
| 0.0 | 0.0 | GO:0061676 | importin-alpha family protein binding(GO:0061676) |
Gene overrepresentation in curated gene sets: canonical pathways category:
| Log-likelihood per target | Total log-likelihood | Term | Description |
|---|---|---|---|
| 0.1 | 0.1 | SA FAS SIGNALING | The TNF-type receptor Fas induces apoptosis on ligand binding. |
| 0.1 | 0.1 | PID TXA2PATHWAY | Thromboxane A2 receptor signaling |
| 0.1 | 0.1 | PID EPHA2 FWD PATHWAY | EPHA2 forward signaling |
| 0.1 | 0.1 | SIG PIP3 SIGNALING IN B LYMPHOCYTES | Genes related to PIP3 signaling in B lymphocytes |
| 0.1 | 3.0 | PID HNF3B PATHWAY | FOXA2 and FOXA3 transcription factor networks |
| 0.1 | 0.1 | PID CXCR3 PATHWAY | CXCR3-mediated signaling events |
| 0.1 | 0.1 | ST DIFFERENTIATION PATHWAY IN PC12 CELLS | Differentiation Pathway in PC12 Cells; this is a specific case of PAC1 Receptor Pathway. |
| 0.0 | 0.1 | PID WNT NONCANONICAL PATHWAY | Noncanonical Wnt signaling pathway |
| 0.0 | 1.4 | PID PRL SIGNALING EVENTS PATHWAY | Signaling events mediated by PRL |
| 0.0 | 1.8 | PID AURORA A PATHWAY | Aurora A signaling |
| 0.0 | 1.2 | PID INSULIN GLUCOSE PATHWAY | Insulin-mediated glucose transport |
| 0.0 | 0.2 | PID HIF1A PATHWAY | Hypoxic and oxygen homeostasis regulation of HIF-1-alpha |
| 0.0 | 0.1 | PID SYNDECAN 1 PATHWAY | Syndecan-1-mediated signaling events |
| 0.0 | 0.1 | PID FAS PATHWAY | FAS (CD95) signaling pathway |
| 0.0 | 0.8 | PID RHODOPSIN PATHWAY | Visual signal transduction: Rods |
| 0.0 | 1.2 | PID ALPHA SYNUCLEIN PATHWAY | Alpha-synuclein signaling |
| 0.0 | 0.5 | PID FRA PATHWAY | Validated transcriptional targets of AP1 family members Fra1 and Fra2 |
| 0.0 | 0.2 | PID LYSOPHOSPHOLIPID PATHWAY | LPA receptor mediated events |
| 0.0 | 0.1 | PID ERBB1 RECEPTOR PROXIMAL PATHWAY | EGF receptor (ErbB1) signaling pathway |
| 0.0 | 0.1 | SA TRKA RECEPTOR | The TrkA receptor binds nerve growth factor to activate MAP kinase pathways and promote cell growth. |
| 0.0 | 1.0 | PID ATR PATHWAY | ATR signaling pathway |
| 0.0 | 0.0 | PID IL5 PATHWAY | IL5-mediated signaling events |
| 0.0 | 0.3 | ST INTERFERON GAMMA PATHWAY | Interferon gamma pathway. |
| 0.0 | 0.9 | SIG REGULATION OF THE ACTIN CYTOSKELETON BY RHO GTPASES | Genes related to regulation of the actin cytoskeleton |
| 0.0 | 0.3 | PID HIF2PATHWAY | HIF-2-alpha transcription factor network |
| 0.0 | 1.3 | PID AP1 PATHWAY | AP-1 transcription factor network |
| 0.0 | 0.9 | PID IL12 2PATHWAY | IL12-mediated signaling events |
| 0.0 | 0.3 | PID IL27 PATHWAY | IL27-mediated signaling events |
| 0.0 | 0.0 | PID AR NONGENOMIC PATHWAY | Nongenotropic Androgen signaling |
| 0.0 | 0.2 | ST G ALPHA S PATHWAY | G alpha s Pathway |
| 0.0 | 0.1 | PID P38 GAMMA DELTA PATHWAY | Signaling mediated by p38-gamma and p38-delta |
| 0.0 | 0.5 | PID UPA UPAR PATHWAY | Urokinase-type plasminogen activator (uPA) and uPAR-mediated signaling |
| 0.0 | 0.0 | SA G2 AND M PHASES | Cdc25 activates the cdc2/cyclin B complex to induce the G2/M transition. |
| 0.0 | 0.2 | PID ERBB NETWORK PATHWAY | ErbB receptor signaling network |
| 0.0 | 0.1 | PID EPO PATHWAY | EPO signaling pathway |
| 0.0 | 0.4 | PID PLK1 PATHWAY | PLK1 signaling events |
| 0.0 | 0.0 | PID THROMBIN PAR1 PATHWAY | PAR1-mediated thrombin signaling events |
| 0.0 | 0.1 | PID ERB GENOMIC PATHWAY | Validated nuclear estrogen receptor beta network |
| 0.0 | 0.0 | PID PS1 PATHWAY | Presenilin action in Notch and Wnt signaling |
| 0.0 | 0.1 | PID RANBP2 PATHWAY | Sumoylation by RanBP2 regulates transcriptional repression |
Gene overrepresentation in curated gene sets: REACTOME pathways category:
| Log-likelihood per target | Total log-likelihood | Term | Description |
|---|---|---|---|
| 0.1 | 2.2 | REACTOME FORMATION OF ATP BY CHEMIOSMOTIC COUPLING | Genes involved in Formation of ATP by chemiosmotic coupling |
| 0.1 | 12.3 | REACTOME PEPTIDE CHAIN ELONGATION | Genes involved in Peptide chain elongation |
| 0.1 | 1.3 | REACTOME SLBP DEPENDENT PROCESSING OF REPLICATION DEPENDENT HISTONE PRE MRNAS | Genes involved in SLBP Dependent Processing of Replication-Dependent Histone Pre-mRNAs |
| 0.1 | 7.2 | REACTOME RESPIRATORY ELECTRON TRANSPORT | Genes involved in Respiratory electron transport |
| 0.1 | 2.3 | REACTOME RNA POL I PROMOTER OPENING | Genes involved in RNA Polymerase I Promoter Opening |
| 0.1 | 0.9 | REACTOME TRANSPORT OF ORGANIC ANIONS | Genes involved in Transport of organic anions |
| 0.1 | 1.3 | REACTOME AMYLOIDS | Genes involved in Amyloids |
| 0.1 | 2.0 | REACTOME PREFOLDIN MEDIATED TRANSFER OF SUBSTRATE TO CCT TRIC | Genes involved in Prefoldin mediated transfer of substrate to CCT/TriC |
| 0.1 | 0.7 | REACTOME HORMONE LIGAND BINDING RECEPTORS | Genes involved in Hormone ligand-binding receptors |
| 0.1 | 0.1 | REACTOME BINDING AND ENTRY OF HIV VIRION | Genes involved in Binding and entry of HIV virion |
| 0.1 | 0.3 | REACTOME CROSS PRESENTATION OF SOLUBLE EXOGENOUS ANTIGENS ENDOSOMES | Genes involved in Cross-presentation of soluble exogenous antigens (endosomes) |
| 0.1 | 3.7 | REACTOME ER PHAGOSOME PATHWAY | Genes involved in ER-Phagosome pathway |
| 0.1 | 0.1 | REACTOME ENDOSOMAL VACUOLAR PATHWAY | Genes involved in Endosomal/Vacuolar pathway |
| 0.1 | 0.7 | REACTOME TETRAHYDROBIOPTERIN BH4 SYNTHESIS RECYCLING SALVAGE AND REGULATION | Genes involved in Tetrahydrobiopterin (BH4) synthesis, recycling, salvage and regulation |
| 0.1 | 0.8 | REACTOME SYNTHESIS SECRETION AND DEACYLATION OF GHRELIN | Genes involved in Synthesis, Secretion, and Deacylation of Ghrelin |
| 0.1 | 0.7 | REACTOME MRNA DECAY BY 3 TO 5 EXORIBONUCLEASE | Genes involved in mRNA Decay by 3' to 5' Exoribonuclease |
| 0.1 | 0.5 | REACTOME NFKB IS ACTIVATED AND SIGNALS SURVIVAL | Genes involved in NF-kB is activated and signals survival |
| 0.1 | 9.1 | REACTOME PEPTIDE LIGAND BINDING RECEPTORS | Genes involved in Peptide ligand-binding receptors |
| 0.1 | 0.4 | REACTOME SCF BETA TRCP MEDIATED DEGRADATION OF EMI1 | Genes involved in SCF-beta-TrCP mediated degradation of Emi1 |
| 0.1 | 0.7 | REACTOME AMINE DERIVED HORMONES | Genes involved in Amine-derived hormones |
| 0.0 | 0.6 | REACTOME ACYL CHAIN REMODELLING OF PI | Genes involved in Acyl chain remodelling of PI |
| 0.0 | 1.1 | REACTOME NONSENSE MEDIATED DECAY ENHANCED BY THE EXON JUNCTION COMPLEX | Genes involved in Nonsense Mediated Decay Enhanced by the Exon Junction Complex |
| 0.0 | 0.1 | REACTOME VIF MEDIATED DEGRADATION OF APOBEC3G | Genes involved in Vif-mediated degradation of APOBEC3G |
| 0.0 | 0.8 | REACTOME SRP DEPENDENT COTRANSLATIONAL PROTEIN TARGETING TO MEMBRANE | Genes involved in SRP-dependent cotranslational protein targeting to membrane |
| 0.0 | 0.9 | REACTOME APC C CDH1 MEDIATED DEGRADATION OF CDC20 AND OTHER APC C CDH1 TARGETED PROTEINS IN LATE MITOSIS EARLY G1 | Genes involved in APC/C:Cdh1 mediated degradation of Cdc20 and other APC/C:Cdh1 targeted proteins in late mitosis/early G1 |
| 0.0 | 0.4 | REACTOME COMMON PATHWAY | Genes involved in Common Pathway |
| 0.0 | 0.7 | REACTOME REGULATION OF IFNG SIGNALING | Genes involved in Regulation of IFNG signaling |
| 0.0 | 1.0 | REACTOME PROSTACYCLIN SIGNALLING THROUGH PROSTACYCLIN RECEPTOR | Genes involved in Prostacyclin signalling through prostacyclin receptor |
| 0.0 | 1.7 | REACTOME MITOCHONDRIAL PROTEIN IMPORT | Genes involved in Mitochondrial Protein Import |
| 0.0 | 1.6 | REACTOME GLUCONEOGENESIS | Genes involved in Gluconeogenesis |
| 0.0 | 1.2 | REACTOME TIGHT JUNCTION INTERACTIONS | Genes involved in Tight junction interactions |
| 0.0 | 0.4 | REACTOME ADVANCED GLYCOSYLATION ENDPRODUCT RECEPTOR SIGNALING | Genes involved in Advanced glycosylation endproduct receptor signaling |
| 0.0 | 0.7 | REACTOME INTRINSIC PATHWAY | Genes involved in Intrinsic Pathway |
| 0.0 | 0.4 | REACTOME CITRIC ACID CYCLE TCA CYCLE | Genes involved in Citric acid cycle (TCA cycle) |
| 0.0 | 0.1 | REACTOME CDK MEDIATED PHOSPHORYLATION AND REMOVAL OF CDC6 | Genes involved in CDK-mediated phosphorylation and removal of Cdc6 |
| 0.0 | 0.7 | REACTOME MICRORNA MIRNA BIOGENESIS | Genes involved in MicroRNA (miRNA) Biogenesis |
| 0.0 | 0.1 | REACTOME BETA DEFENSINS | Genes involved in Beta defensins |
| 0.0 | 0.7 | REACTOME CD28 DEPENDENT VAV1 PATHWAY | Genes involved in CD28 dependent Vav1 pathway |
| 0.0 | 0.6 | REACTOME REGULATION OF INSULIN LIKE GROWTH FACTOR IGF ACTIVITY BY INSULIN LIKE GROWTH FACTOR BINDING PROTEINS IGFBPS | Genes involved in Regulation of Insulin-like Growth Factor (IGF) Activity by Insulin-like Growth Factor Binding Proteins (IGFBPs) |
| 0.0 | 0.3 | REACTOME ABACAVIR TRANSPORT AND METABOLISM | Genes involved in Abacavir transport and metabolism |
| 0.0 | 0.3 | REACTOME SCFSKP2 MEDIATED DEGRADATION OF P27 P21 | Genes involved in SCF(Skp2)-mediated degradation of p27/p21 |
| 0.0 | 0.9 | REACTOME REGULATION OF MRNA STABILITY BY PROTEINS THAT BIND AU RICH ELEMENTS | Genes involved in Regulation of mRNA Stability by Proteins that Bind AU-rich Elements |
| 0.0 | 0.1 | REACTOME REGULATION OF ORNITHINE DECARBOXYLASE ODC | Genes involved in Regulation of ornithine decarboxylase (ODC) |
| 0.0 | 1.2 | REACTOME LIPID DIGESTION MOBILIZATION AND TRANSPORT | Genes involved in Lipid digestion, mobilization, and transport |
| 0.0 | 0.5 | REACTOME METABOLISM OF POLYAMINES | Genes involved in Metabolism of polyamines |
| 0.0 | 0.3 | REACTOME COPI MEDIATED TRANSPORT | Genes involved in COPI Mediated Transport |
| 0.0 | 0.2 | REACTOME AKT PHOSPHORYLATES TARGETS IN THE CYTOSOL | Genes involved in AKT phosphorylates targets in the cytosol |
| 0.0 | 0.5 | REACTOME LYSOSOME VESICLE BIOGENESIS | Genes involved in Lysosome Vesicle Biogenesis |
| 0.0 | 0.1 | REACTOME PHOSPHORYLATION OF CD3 AND TCR ZETA CHAINS | Genes involved in Phosphorylation of CD3 and TCR zeta chains |
| 0.0 | 0.6 | REACTOME 3 UTR MEDIATED TRANSLATIONAL REGULATION | Genes involved in 3' -UTR-mediated translational regulation |
| 0.0 | 0.8 | REACTOME AMINE LIGAND BINDING RECEPTORS | Genes involved in Amine ligand-binding receptors |
| 0.0 | 0.1 | REACTOME MEMBRANE BINDING AND TARGETTING OF GAG PROTEINS | Genes involved in Membrane binding and targetting of GAG proteins |
| 0.0 | 0.1 | REACTOME KERATAN SULFATE KERATIN METABOLISM | Genes involved in Keratan sulfate/keratin metabolism |
| 0.0 | 0.1 | REACTOME ANDROGEN BIOSYNTHESIS | Genes involved in Androgen biosynthesis |
| 0.0 | 0.5 | REACTOME FGFR LIGAND BINDING AND ACTIVATION | Genes involved in FGFR ligand binding and activation |
| 0.0 | 0.2 | REACTOME YAP1 AND WWTR1 TAZ STIMULATED GENE EXPRESSION | Genes involved in YAP1- and WWTR1 (TAZ)-stimulated gene expression |
| 0.0 | 0.1 | REACTOME DIGESTION OF DIETARY CARBOHYDRATE | Genes involved in Digestion of dietary carbohydrate |
| 0.0 | 0.2 | REACTOME POST CHAPERONIN TUBULIN FOLDING PATHWAY | Genes involved in Post-chaperonin tubulin folding pathway |
| 0.0 | 0.4 | REACTOME METABOLISM OF PORPHYRINS | Genes involved in Metabolism of porphyrins |
| 0.0 | 0.1 | REACTOME INTERACTIONS OF VPR WITH HOST CELLULAR PROTEINS | Genes involved in Interactions of Vpr with host cellular proteins |
| 0.0 | 0.1 | REACTOME G BETA GAMMA SIGNALLING THROUGH PI3KGAMMA | Genes involved in G beta:gamma signalling through PI3Kgamma |
| 0.0 | 0.2 | REACTOME REMOVAL OF THE FLAP INTERMEDIATE FROM THE C STRAND | Genes involved in Removal of the Flap Intermediate from the C-strand |
| 0.0 | 0.2 | REACTOME TRAFFICKING AND PROCESSING OF ENDOSOMAL TLR | Genes involved in Trafficking and processing of endosomal TLR |
| 0.0 | 0.2 | REACTOME P38MAPK EVENTS | Genes involved in p38MAPK events |
| 0.0 | 0.5 | REACTOME DEPOSITION OF NEW CENPA CONTAINING NUCLEOSOMES AT THE CENTROMERE | Genes involved in Deposition of New CENPA-containing Nucleosomes at the Centromere |
| 0.0 | 0.2 | REACTOME SYNTHESIS OF PC | Genes involved in Synthesis of PC |
| 0.0 | 0.3 | REACTOME MITOCHONDRIAL FATTY ACID BETA OXIDATION | Genes involved in Mitochondrial Fatty Acid Beta-Oxidation |
| 0.0 | 1.1 | REACTOME CLASS A1 RHODOPSIN LIKE RECEPTORS | Genes involved in Class A/1 (Rhodopsin-like receptors) |
| 0.0 | 0.3 | REACTOME PRE NOTCH PROCESSING IN GOLGI | Genes involved in Pre-NOTCH Processing in Golgi |
| 0.0 | 0.3 | REACTOME SYNTHESIS OF SUBSTRATES IN N GLYCAN BIOSYTHESIS | Genes involved in Synthesis of substrates in N-glycan biosythesis |
| 0.0 | 0.1 | REACTOME GAMMA CARBOXYLATION TRANSPORT AND AMINO TERMINAL CLEAVAGE OF PROTEINS | Genes involved in Gamma-carboxylation, transport, and amino-terminal cleavage of proteins |
| 0.0 | 0.3 | REACTOME PTM GAMMA CARBOXYLATION HYPUSINE FORMATION AND ARYLSULFATASE ACTIVATION | Genes involved in PTM: gamma carboxylation, hypusine formation and arylsulfatase activation |
| 0.0 | 0.4 | REACTOME CGMP EFFECTS | Genes involved in cGMP effects |
| 0.0 | 0.1 | REACTOME SYNTHESIS SECRETION AND INACTIVATION OF GIP | Genes involved in Synthesis, Secretion, and Inactivation of Glucose-dependent Insulinotropic Polypeptide (GIP) |
| 0.0 | 0.4 | REACTOME MRNA SPLICING MINOR PATHWAY | Genes involved in mRNA Splicing - Minor Pathway |
| 0.0 | 0.2 | REACTOME RIP MEDIATED NFKB ACTIVATION VIA DAI | Genes involved in RIP-mediated NFkB activation via DAI |
| 0.0 | 0.5 | REACTOME SMAD2 SMAD3 SMAD4 HETEROTRIMER REGULATES TRANSCRIPTION | Genes involved in SMAD2/SMAD3:SMAD4 heterotrimer regulates transcription |
| 0.0 | 0.3 | REACTOME SYNTHESIS AND INTERCONVERSION OF NUCLEOTIDE DI AND TRIPHOSPHATES | Genes involved in Synthesis and interconversion of nucleotide di- and triphosphates |
| 0.0 | 0.4 | REACTOME INSULIN RECEPTOR RECYCLING | Genes involved in Insulin receptor recycling |
| 0.0 | 0.5 | REACTOME REGULATION OF BETA CELL DEVELOPMENT | Genes involved in Regulation of beta-cell development |
| 0.0 | 0.1 | REACTOME RAS ACTIVATION UOPN CA2 INFUX THROUGH NMDA RECEPTOR | Genes involved in Ras activation uopn Ca2+ infux through NMDA receptor |
| 0.0 | 0.1 | REACTOME ENOS ACTIVATION AND REGULATION | Genes involved in eNOS activation and regulation |
| 0.0 | 0.2 | REACTOME CYTOCHROME P450 ARRANGED BY SUBSTRATE TYPE | Genes involved in Cytochrome P450 - arranged by substrate type |
| 0.0 | 0.1 | REACTOME ACTIVATION OF NF KAPPAB IN B CELLS | Genes involved in Activation of NF-kappaB in B Cells |
| 0.0 | 0.5 | REACTOME GLUTATHIONE CONJUGATION | Genes involved in Glutathione conjugation |
| 0.0 | 0.1 | REACTOME SIGNALING BY FGFR IN DISEASE | Genes involved in Signaling by FGFR in disease |
| 0.0 | 0.4 | REACTOME TRANSPORT OF VITAMINS NUCLEOSIDES AND RELATED MOLECULES | Genes involved in Transport of vitamins, nucleosides, and related molecules |
| 0.0 | 0.2 | REACTOME HYALURONAN UPTAKE AND DEGRADATION | Genes involved in Hyaluronan uptake and degradation |
| 0.0 | 0.2 | REACTOME GLUCURONIDATION | Genes involved in Glucuronidation |
| 0.0 | 0.2 | REACTOME PURINE SALVAGE | Genes involved in Purine salvage |
| 0.0 | 0.1 | REACTOME AQUAPORIN MEDIATED TRANSPORT | Genes involved in Aquaporin-mediated transport |
| 0.0 | 0.1 | REACTOME CDT1 ASSOCIATION WITH THE CDC6 ORC ORIGIN COMPLEX | Genes involved in CDT1 association with the CDC6:ORC:origin complex |
| 0.0 | 0.2 | REACTOME RAP1 SIGNALLING | Genes involved in Rap1 signalling |
| 0.0 | 0.1 | REACTOME ORGANIC CATION ANION ZWITTERION TRANSPORT | Genes involved in Organic cation/anion/zwitterion transport |
| 0.0 | 0.2 | REACTOME SYNTHESIS OF VERY LONG CHAIN FATTY ACYL COAS | Genes involved in Synthesis of very long-chain fatty acyl-CoAs |
| 0.0 | 0.0 | REACTOME TRANSLOCATION OF ZAP 70 TO IMMUNOLOGICAL SYNAPSE | Genes involved in Translocation of ZAP-70 to Immunological synapse |
| 0.0 | 0.1 | REACTOME ALPHA LINOLENIC ACID ALA METABOLISM | Genes involved in alpha-linolenic acid (ALA) metabolism |
| 0.0 | 0.2 | REACTOME TANDEM PORE DOMAIN POTASSIUM CHANNELS | Genes involved in Tandem pore domain potassium channels |
| 0.0 | 0.3 | REACTOME CYTOSOLIC TRNA AMINOACYLATION | Genes involved in Cytosolic tRNA aminoacylation |
| 0.0 | 0.4 | REACTOME AMINE COMPOUND SLC TRANSPORTERS | Genes involved in Amine compound SLC transporters |
| 0.0 | 0.3 | REACTOME CHOLESTEROL BIOSYNTHESIS | Genes involved in Cholesterol biosynthesis |
| 0.0 | 0.1 | REACTOME PASSIVE TRANSPORT BY AQUAPORINS | Genes involved in Passive Transport by Aquaporins |
| 0.0 | 0.2 | REACTOME PHASE II CONJUGATION | Genes involved in Phase II conjugation |
| 0.0 | 0.2 | REACTOME AMINO ACID SYNTHESIS AND INTERCONVERSION TRANSAMINATION | Genes involved in Amino acid synthesis and interconversion (transamination) |
| 0.0 | 0.0 | REACTOME INFLUENZA LIFE CYCLE | Genes involved in Influenza Life Cycle |
| 0.0 | 0.1 | REACTOME FACILITATIVE NA INDEPENDENT GLUCOSE TRANSPORTERS | Genes involved in Facilitative Na+-independent glucose transporters |
| 0.0 | 0.2 | REACTOME DEGRADATION OF THE EXTRACELLULAR MATRIX | Genes involved in Degradation of the extracellular matrix |
| 0.0 | 0.1 | REACTOME PYRIMIDINE CATABOLISM | Genes involved in Pyrimidine catabolism |
| 0.0 | 0.2 | REACTOME PYRUVATE METABOLISM | Genes involved in Pyruvate metabolism |