Project
GSE49485: Hypoxia transcriptome sequencing of rat brain.
Navigation
Downloads
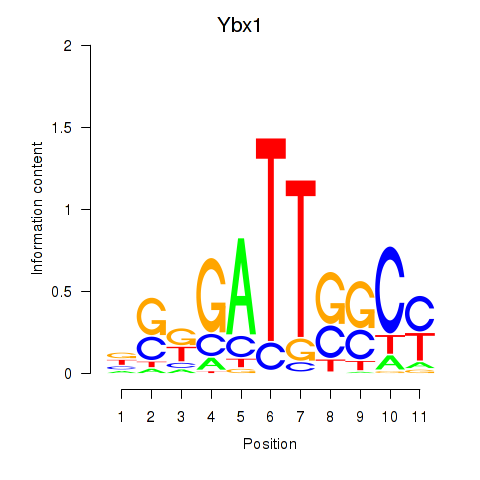
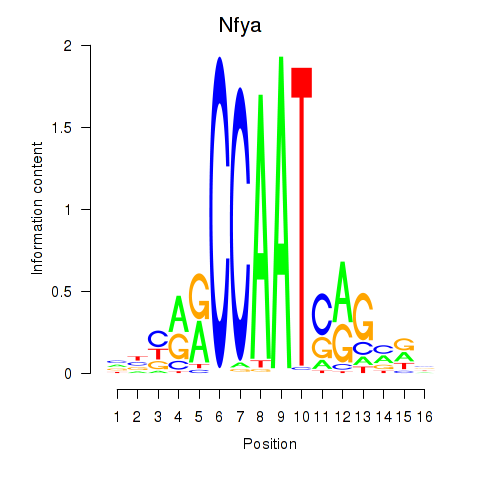
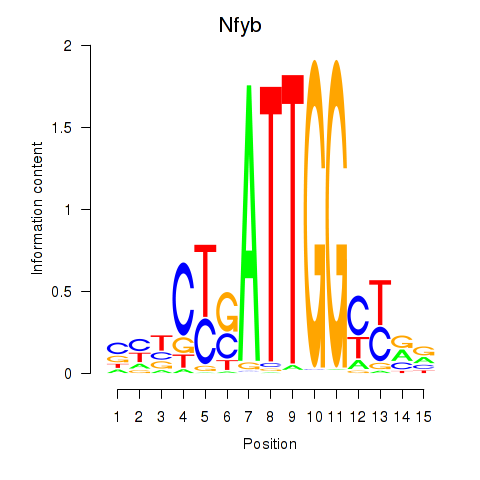
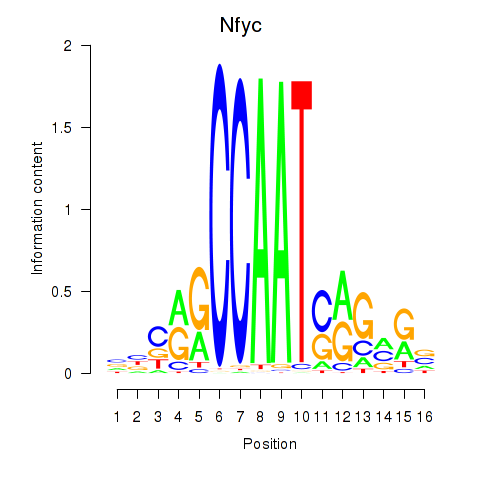
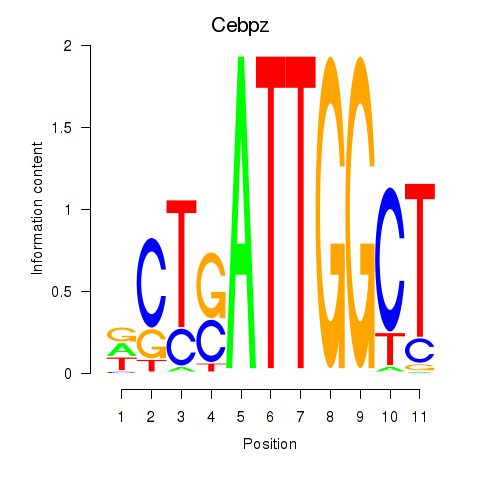
Results for Ybx1_Nfya_Nfyb_Nfyc_Cebpz
Z-value: 2.65
Motif logo
Transcription factors associated with Ybx1_Nfya_Nfyb_Nfyc_Cebpz
| Gene Symbol | Gene ID | Gene Info |
|---|---|---|
|
Ybx1
|
ENSRNOG00000023786 | Y box binding protein 1 |
|
Nfya
|
ENSRNOG00000012702 | nuclear transcription factor Y subunit alpha |
|
Nfyb
|
ENSRNOG00000010309 | nuclear transcription factor Y subunit beta |
|
Nfyc
|
ENSRNOG00000010735 | nuclear transcription factor Y subunit gamma |
|
Cebpz
|
ENSRNOG00000005087 | CCAAT/enhancer binding protein zeta |
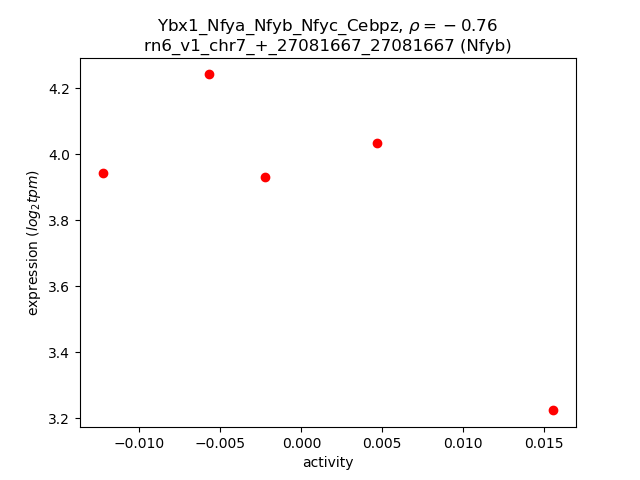
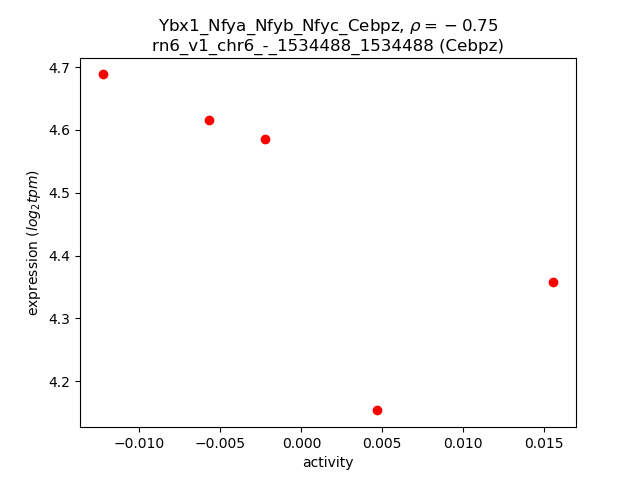
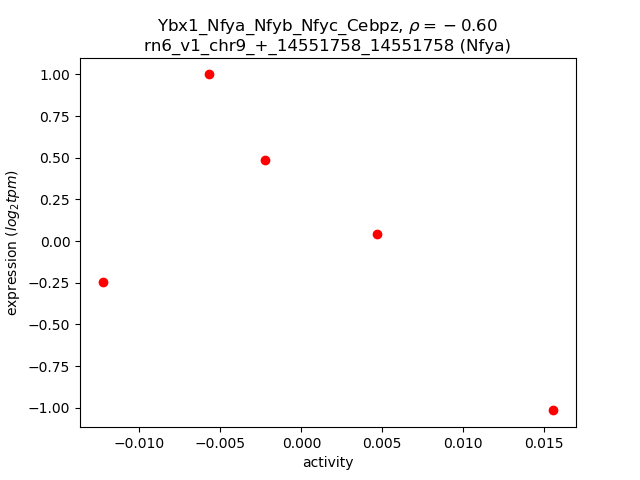
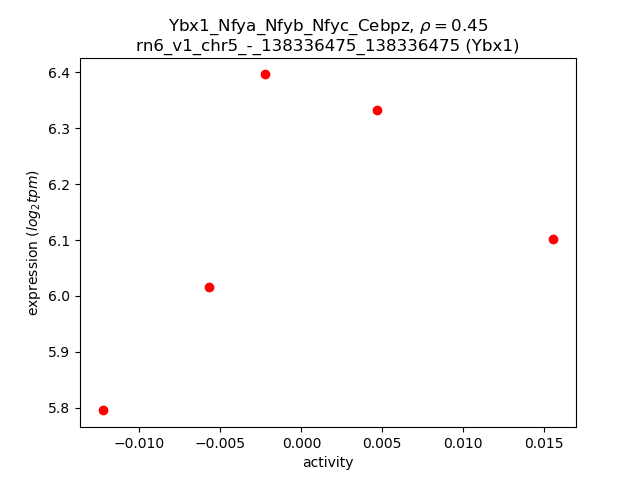
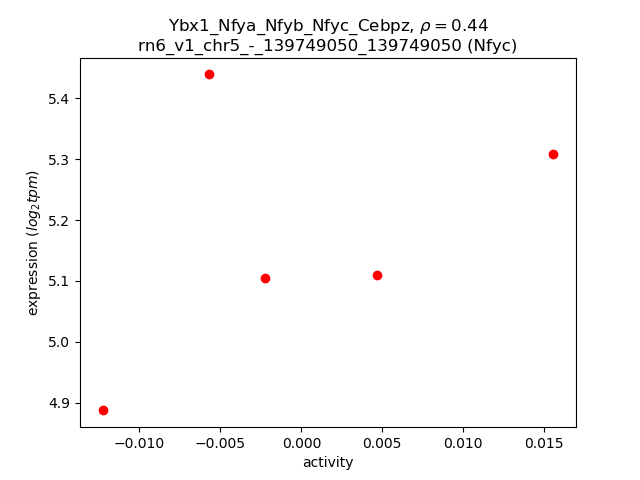
Activity-expression correlation:
| Gene | Promoter | Pearson corr. coef. | P-value | Plot |
|---|---|---|---|---|
| Nfyb | rn6_v1_chr7_+_27081667_27081667 | -0.76 | 1.3e-01 | Click! |
| Cebpz | rn6_v1_chr6_-_1534488_1534488 | -0.75 | 1.5e-01 | Click! |
| Nfya | rn6_v1_chr9_+_14551758_14551758 | -0.60 | 2.9e-01 | Click! |
| Ybx1 | rn6_v1_chr5_-_138336475_138336475 | 0.45 | 4.5e-01 | Click! |
| Nfyc | rn6_v1_chr5_-_139749050_139749050 | 0.44 | 4.6e-01 | Click! |
Activity profile of Ybx1_Nfya_Nfyb_Nfyc_Cebpz motif
Sorted Z-values of Ybx1_Nfya_Nfyb_Nfyc_Cebpz motif
| Promoter | Log-likelihood | Transcript | Gene | Gene Info |
|---|---|---|---|---|
| chr10_+_105393072 | 2.56 |
ENSRNOT00000013359
|
Ubald2
|
UBA-like domain containing 2 |
| chr2_-_198382190 | 2.35 |
ENSRNOT00000044268
|
Hist2h2aa2
|
histone cluster 2, H2aa2 |
| chr2_+_198388809 | 2.30 |
ENSRNOT00000083087
|
Hist2h2aa3
|
histone cluster 2, H2aa3 |
| chr10_-_15577977 | 2.14 |
ENSRNOT00000052292
|
Hba-a3
|
hemoglobin alpha, adult chain 3 |
| chr2_+_198359754 | 1.96 |
ENSRNOT00000048582
|
Hist2h2ab
|
histone cluster 2 H2A family member b |
| chr3_-_9037942 | 1.89 |
ENSRNOT00000036770
|
Ier5l
|
immediate early response 5-like |
| chr10_-_15590220 | 1.66 |
ENSRNOT00000048977
|
Hba-a2
|
hemoglobin alpha, adult chain 2 |
| chr2_-_198360678 | 1.66 |
ENSRNOT00000051917
|
Hist2h2ac
|
histone cluster 2 H2A family member c |
| chr10_-_15603649 | 1.55 |
ENSRNOT00000051483
|
Hba-a2
|
hemoglobin alpha, adult chain 2 |
| chr1_-_216663720 | 1.55 |
ENSRNOT00000078944
ENSRNOT00000077409 |
Cdkn1c
|
cyclin-dependent kinase inhibitor 1C |
| chr7_-_11400805 | 1.49 |
ENSRNOT00000027634
|
Dapk3
|
death-associated protein kinase 3 |
| chr5_-_151709877 | 1.48 |
ENSRNOT00000080602
|
Trnp1
|
TMF1-regulated nuclear protein 1 |
| chr17_-_44527801 | 1.45 |
ENSRNOT00000089643
|
Hist1h2bk
|
histone cluster 1 H2B family member k |
| chr7_-_28715224 | 1.39 |
ENSRNOT00000065899
|
Parpbp
|
PARP1 binding protein |
| chr10_-_104575890 | 1.33 |
ENSRNOT00000050223
|
H3f3b
|
H3 histone family member 3B |
| chr10_+_40247436 | 1.33 |
ENSRNOT00000079830
|
Gpx3
|
glutathione peroxidase 3 |
| chr11_+_88122271 | 1.30 |
ENSRNOT00000002540
|
Sdf2l1
|
stromal cell-derived factor 2-like 1 |
| chr4_+_44321883 | 1.22 |
ENSRNOT00000091095
|
Tes
|
testin LIM domain protein |
| chr3_+_13838304 | 1.22 |
ENSRNOT00000025067
|
Hspa5
|
heat shock protein family A member 5 |
| chr4_-_10269748 | 1.19 |
ENSRNOT00000074662
|
Fam185a
|
family with sequence similarity 185, member A |
| chr17_-_13393243 | 1.16 |
ENSRNOT00000018252
|
Gadd45g
|
growth arrest and DNA-damage-inducible, gamma |
| chr20_-_13706205 | 1.15 |
ENSRNOT00000038623
|
Derl3
|
derlin 3 |
| chr2_+_198418691 | 1.14 |
ENSRNOT00000089409
|
Hist1h2bk
|
histone cluster 1, H2bk |
| chr1_-_211923929 | 1.11 |
ENSRNOT00000054887
|
Nkx6-2
|
NK6 homeobox 2 |
| chr11_+_31389514 | 1.09 |
ENSRNOT00000000325
|
Olig2
|
oligodendrocyte lineage transcription factor 2 |
| chr17_+_43627930 | 1.09 |
ENSRNOT00000081719
|
LOC102549061
|
histone H2B type 1-N-like |
| chr2_+_58724855 | 1.08 |
ENSRNOT00000089609
|
Capsl
|
calcyphosine-like |
| chr8_+_48665652 | 1.05 |
ENSRNOT00000059715
|
H2afx
|
H2A histone family, member X |
| chr4_+_8256611 | 1.04 |
ENSRNOT00000061894
|
AABR07059198.1
|
|
| chr5_+_138154673 | 1.03 |
ENSRNOT00000064452
|
Slc2a1
|
solute carrier family 2 member 1 |
| chr10_-_85574889 | 1.01 |
ENSRNOT00000072274
|
LOC691153
|
hypothetical protein LOC691153 |
| chr13_-_102643223 | 1.00 |
ENSRNOT00000003155
|
Hlx
|
H2.0-like homeobox |
| chr10_+_13836128 | 1.00 |
ENSRNOT00000012720
|
Pgp
|
phosphoglycolate phosphatase |
| chr8_-_115626380 | 0.99 |
ENSRNOT00000019107
|
Manf
|
mesencephalic astrocyte-derived neurotrophic factor |
| chr19_-_43596801 | 0.97 |
ENSRNOT00000025625
|
Fa2h
|
fatty acid 2-hydroxylase |
| chr2_-_197991198 | 0.96 |
ENSRNOT00000056322
|
Ciart
|
circadian associated repressor of transcription |
| chr4_-_113610243 | 0.92 |
ENSRNOT00000008813
|
Hk2
|
hexokinase 2 |
| chr2_-_197991574 | 0.91 |
ENSRNOT00000085632
|
Ciart
|
circadian associated repressor of transcription |
| chr10_+_74413989 | 0.90 |
ENSRNOT00000036098
|
Ska2
|
spindle and kinetochore associated complex subunit 2 |
| chr19_-_26094756 | 0.89 |
ENSRNOT00000067780
|
Junb
|
JunB proto-oncogene, AP-1 transcription factor subunit |
| chr10_-_45297385 | 0.88 |
ENSRNOT00000041187
|
Hist3h2bb
|
histone cluster 3 H2B family member b |
| chr20_+_5374985 | 0.87 |
ENSRNOT00000052270
|
RT1-A2
|
RT1 class Ia, locus A2 |
| chr17_-_43807540 | 0.87 |
ENSRNOT00000074763
|
LOC684762
|
similar to CG31613-PA |
| chr10_+_109278712 | 0.86 |
ENSRNOT00000065565
|
LOC690871
|
hypothetical protein LOC690871 |
| chr15_+_50891127 | 0.86 |
ENSRNOT00000020728
|
Stc1
|
stanniocalcin 1 |
| chr5_-_61410812 | 0.85 |
ENSRNOT00000015270
|
Igfbpl1
|
insulin-like growth factor binding protein-like 1 |
| chr13_+_104284660 | 0.84 |
ENSRNOT00000005400
|
Dusp10
|
dual specificity phosphatase 10 |
| chr1_+_219345918 | 0.83 |
ENSRNOT00000025018
|
Cdk2ap2
|
cyclin-dependent kinase 2 associated protein 2 |
| chr11_+_31428358 | 0.83 |
ENSRNOT00000002827
|
Olig1
|
oligodendrocyte transcription factor 1 |
| chr1_-_168972725 | 0.82 |
ENSRNOT00000090422
|
Hbb
|
hemoglobin subunit beta |
| chr10_-_109747987 | 0.81 |
ENSRNOT00000054958
|
P4hb
|
prolyl 4-hydroxylase subunit beta |
| chr11_-_36479868 | 0.81 |
ENSRNOT00000075762
|
LOC100911295
|
non-histone chromosomal protein HMG-14-like |
| chr5_+_139597731 | 0.80 |
ENSRNOT00000072427
|
Cited4
|
Cbp/p300-interacting transactivator, with Glu/Asp-rich carboxy-terminal domain, 4 |
| chr15_+_23553128 | 0.79 |
ENSRNOT00000012985
|
Cdkn3
|
cyclin-dependent kinase inhibitor 3 |
| chr16_-_36080191 | 0.79 |
ENSRNOT00000017635
|
Hmgb2l1
|
high mobility group box 2-like 1 |
| chr10_-_74413745 | 0.78 |
ENSRNOT00000038296
|
Prr11
|
proline rich 11 |
| chr2_+_198390166 | 0.78 |
ENSRNOT00000081042
|
Hist2h3c2
|
histone cluster 2, H3c2 |
| chr12_-_41671437 | 0.78 |
ENSRNOT00000001883
|
Lhx5
|
LIM homeobox 5 |
| chr1_-_129780356 | 0.76 |
ENSRNOT00000077479
|
Arrdc4
|
arrestin domain containing 4 |
| chr1_-_145931583 | 0.73 |
ENSRNOT00000016433
|
Cfap161
|
cilia and flagella associated protein 161 |
| chr2_-_188413219 | 0.72 |
ENSRNOT00000065065
|
Fdps
|
farnesyl diphosphate synthase |
| chr20_-_29511382 | 0.70 |
ENSRNOT00000085026
|
Ddit4
|
DNA-damage-inducible transcript 4 |
| chr7_-_119409710 | 0.69 |
ENSRNOT00000008450
|
Ift27
|
intraflagellar transport 27 |
| chr17_-_13593423 | 0.69 |
ENSRNOT00000019234
|
Cks2
|
CDC28 protein kinase regulatory subunit 2 |
| chr17_+_6909728 | 0.68 |
ENSRNOT00000061231
|
LOC681410
|
hypothetical protein LOC681410 |
| chr10_-_83898527 | 0.67 |
ENSRNOT00000009815
|
Atp5g1
|
ATP synthase, H+ transporting, mitochondrial Fo complex, subunit C1 (subunit 9) |
| chr9_+_93545396 | 0.67 |
ENSRNOT00000025093
|
LOC100359583
|
hypothetical protein LOC100359583 |
| chr15_-_23969011 | 0.66 |
ENSRNOT00000014821
|
Gch1
|
GTP cyclohydrolase 1 |
| chr2_-_187668677 | 0.66 |
ENSRNOT00000056898
ENSRNOT00000092563 |
Tsacc
|
TSSK6 activating co-chaperone |
| chr10_+_55626741 | 0.66 |
ENSRNOT00000008492
|
Aurkb
|
aurora kinase B |
| chr2_-_198380836 | 0.66 |
ENSRNOT00000040906
|
LOC102548682
|
histone H4-like |
| chr5_-_139749050 | 0.65 |
ENSRNOT00000056651
|
Nfyc
|
nuclear transcription factor Y subunit gamma |
| chr10_+_45289741 | 0.65 |
ENSRNOT00000066190
|
Hist3h2ba
|
histone cluster 3, H2ba |
| chr17_-_43627629 | 0.64 |
ENSRNOT00000022965
|
Hist1h2af
|
histone cluster 1, H2af |
| chr7_-_27240528 | 0.64 |
ENSRNOT00000029435
ENSRNOT00000079731 |
Hsp90b1
|
heat shock protein 90 beta family member 1 |
| chr7_+_380741 | 0.64 |
ENSRNOT00000091013
|
LOC102554748
|
nidogen-2-like |
| chr9_+_82120059 | 0.63 |
ENSRNOT00000057368
|
Cdk5r2
|
cyclin-dependent kinase 5 regulatory subunit 2 |
| chr2_-_156807305 | 0.63 |
ENSRNOT00000080578
|
AABR07011031.1
|
uncharacterized protein LOC302022 |
| chr5_-_153924896 | 0.63 |
ENSRNOT00000065247
|
Grhl3
|
grainyhead-like transcription factor 3 |
| chr17_-_43640387 | 0.62 |
ENSRNOT00000087731
|
Hist1h1c
|
histone cluster 1 H1 family member c |
| chr10_-_18131562 | 0.62 |
ENSRNOT00000006676
|
Tlx3
|
T-cell leukemia, homeobox 3 |
| chr11_-_81757813 | 0.61 |
ENSRNOT00000002462
|
Dnajb11
|
DnaJ heat shock protein family (Hsp40) member B11 |
| chr3_-_7498555 | 0.61 |
ENSRNOT00000017725
|
Barhl1
|
BarH-like homeobox 1 |
| chr4_+_157348020 | 0.61 |
ENSRNOT00000020803
|
Cdca3
|
cell division cycle associated 3 |
| chr1_+_90948976 | 0.61 |
ENSRNOT00000056877
|
LOC108348111
|
succinate dehydrogenase assembly factor 1, mitochondrial |
| chr10_+_45297937 | 0.60 |
ENSRNOT00000066367
|
Trim17
|
tripartite motif-containing 17 |
| chr3_-_58181971 | 0.60 |
ENSRNOT00000002076
|
Dlx2
|
distal-less homeobox 2 |
| chr1_+_168964202 | 0.60 |
ENSRNOT00000089102
|
LOC103694855
|
hemoglobin subunit beta-2-like |
| chr3_+_148215540 | 0.60 |
ENSRNOT00000029660
|
Id1
|
inhibitor of DNA binding 1, HLH protein |
| chr6_-_33691301 | 0.60 |
ENSRNOT00000008008
|
Rhob
|
ras homolog family member B |
| chr3_+_110975923 | 0.59 |
ENSRNOT00000016458
|
Gchfr
|
GTP cyclohydrolase I feedback regulator |
| chr5_+_57845819 | 0.59 |
ENSRNOT00000017712
|
Nudt2
|
nudix hydrolase 2 |
| chr8_-_66863476 | 0.58 |
ENSRNOT00000018820
|
Rplp1
|
ribosomal protein lateral stalk subunit P1 |
| chr11_+_82945104 | 0.58 |
ENSRNOT00000002410
|
Ehhadh
|
enoyl-CoA hydratase and 3-hydroxyacyl CoA dehydrogenase |
| chr3_-_95954983 | 0.58 |
ENSRNOT00000006385
|
AABR07053185.1
|
|
| chr14_-_86706626 | 0.57 |
ENSRNOT00000082893
|
H2afv
|
H2A histone family, member V |
| chr8_+_61607015 | 0.57 |
ENSRNOT00000023456
|
Imp3
|
IMP3, U3 small nucleolar ribonucleoprotein |
| chr14_+_10692764 | 0.57 |
ENSRNOT00000003012
|
LOC100910270
|
uncharacterized LOC100910270 |
| chr1_+_221735517 | 0.57 |
ENSRNOT00000028628
ENSRNOT00000044866 |
Sf1
|
splicing factor 1 |
| chr5_-_59152599 | 0.56 |
ENSRNOT00000021387
|
Hint2
|
histidine triad nucleotide binding protein 2 |
| chr1_+_72661211 | 0.56 |
ENSRNOT00000033197
|
Cox6b2
|
cytochrome c oxidase subunit VIb polypeptide 2 |
| chr5_-_137265015 | 0.55 |
ENSRNOT00000036151
|
Cdc20
|
cell division cycle 20 |
| chr5_+_145079803 | 0.55 |
ENSRNOT00000084202
|
Sfpq
|
splicing factor proline and glutamine rich |
| chr3_-_2444281 | 0.55 |
ENSRNOT00000013863
|
Tubb4b
|
tubulin, beta 4B class IVb |
| chr19_-_25961666 | 0.55 |
ENSRNOT00000004091
|
Calr
|
calreticulin |
| chr16_-_75855745 | 0.55 |
ENSRNOT00000031291
|
Agpat5
|
1-acylglycerol-3-phosphate O-acyltransferase 5 |
| chr10_+_55627025 | 0.54 |
ENSRNOT00000091016
|
Aurkb
|
aurora kinase B |
| chr17_-_43815183 | 0.54 |
ENSRNOT00000073188
|
Hist1h2ail1
|
histone cluster 1, H2ai-like1 |
| chr10_-_34961608 | 0.54 |
ENSRNOT00000033056
|
LOC103689931
|
heterogeneous nuclear ribonucleoprotein A/B |
| chr6_-_44361908 | 0.54 |
ENSRNOT00000009491
|
Id2
|
inhibitor of DNA binding 2, HLH protein |
| chr9_+_98924134 | 0.53 |
ENSRNOT00000027597
|
Twist2
|
twist family bHLH transcription factor 2 |
| chrX_+_62363953 | 0.53 |
ENSRNOT00000083362
|
Arx
|
aristaless related homeobox |
| chr1_-_255376833 | 0.53 |
ENSRNOT00000024941
|
Ppp1r3c
|
protein phosphatase 1, regulatory subunit 3C |
| chr4_-_77489535 | 0.52 |
ENSRNOT00000008728
|
Pdia4
|
protein disulfide isomerase family A, member 4 |
| chr3_-_111422203 | 0.52 |
ENSRNOT00000084290
|
Oip5
|
Opa interacting protein 5 |
| chr15_+_4882947 | 0.52 |
ENSRNOT00000049255
ENSRNOT00000092002 |
RGD1304704
|
similar to Hypothetical protein CGI-99 |
| chr19_+_25095089 | 0.52 |
ENSRNOT00000041717
|
Prkaca
|
protein kinase cAMP-activated catalytic subunit alpha |
| chrX_+_1787266 | 0.51 |
ENSRNOT00000011183
|
Ndufb11
|
NADH:ubiquinone oxidoreductase subunit B11 |
| chr19_-_24732024 | 0.51 |
ENSRNOT00000037608
|
Tecr
|
trans-2,3-enoyl-CoA reductase |
| chr10_+_91830654 | 0.51 |
ENSRNOT00000005176
|
Wnt3
|
wingless-type MMTV integration site family, member 3 |
| chr20_+_12429315 | 0.50 |
ENSRNOT00000001675
|
Pcbp3
|
poly(rC) binding protein 3 |
| chr2_-_48501436 | 0.50 |
ENSRNOT00000017305
|
Isl1
|
ISL LIM homeobox 1 |
| chr20_-_2701637 | 0.50 |
ENSRNOT00000049667
|
Hspa1a
|
heat shock protein family A (Hsp70) member 1A |
| chr9_-_16406338 | 0.50 |
ENSRNOT00000073079
|
Tbcc
|
tubulin folding cofactor C |
| chr10_-_15098791 | 0.50 |
ENSRNOT00000026139
|
Chtf18
|
chromosome transmission fidelity factor 18 |
| chr16_+_49462889 | 0.50 |
ENSRNOT00000039909
|
Ankrd37
|
ankyrin repeat domain 37 |
| chr5_-_151397603 | 0.49 |
ENSRNOT00000076866
|
Gpr3
|
G protein-coupled receptor 3 |
| chr19_-_58399816 | 0.49 |
ENSRNOT00000026843
|
Sipa1l2
|
signal-induced proliferation-associated 1 like 2 |
| chr1_-_222293148 | 0.49 |
ENSRNOT00000028743
|
Stip1
|
stress-induced phosphoprotein 1 |
| chr7_+_11414446 | 0.49 |
ENSRNOT00000027441
|
Pias4
|
protein inhibitor of activated STAT, 4 |
| chr5_-_169017295 | 0.49 |
ENSRNOT00000067481
|
Camta1
|
calmodulin binding transcription activator 1 |
| chr20_-_4921348 | 0.48 |
ENSRNOT00000082497
ENSRNOT00000041151 |
RT1-CE4
|
RT1 class I, locus CE4 |
| chr12_+_12738812 | 0.48 |
ENSRNOT00000092233
ENSRNOT00000001379 |
Aimp2
|
aminoacyl tRNA synthetase complex-interacting multifunctional protein 2 |
| chr9_+_61655963 | 0.48 |
ENSRNOT00000040461
|
Coq10b
|
coenzyme Q10B |
| chr5_+_167952728 | 0.48 |
ENSRNOT00000085315
|
Errfi1
|
ERBB receptor feedback inhibitor 1 |
| chr9_-_78969013 | 0.48 |
ENSRNOT00000019772
ENSRNOT00000057585 |
Fn1
|
fibronectin 1 |
| chr10_+_14248399 | 0.47 |
ENSRNOT00000077689
|
Spsb3
|
splA/ryanodine receptor domain and SOCS box containing 3 |
| chr6_+_128750795 | 0.47 |
ENSRNOT00000005781
|
Glrx5
|
glutaredoxin 5 |
| chr10_-_15166457 | 0.47 |
ENSRNOT00000026676
|
Metrn
|
meteorin, glial cell differentiation regulator |
| chr11_+_36851038 | 0.47 |
ENSRNOT00000002221
ENSRNOT00000061047 |
Pcp4
|
Purkinje cell protein 4 |
| chr6_-_109692218 | 0.46 |
ENSRNOT00000012327
|
RGD1310769
|
similar to HSPC288 |
| chr1_+_282134981 | 0.46 |
ENSRNOT00000036203
|
Nanos1
|
nanos C2HC-type zinc finger 1 |
| chr10_+_58613674 | 0.46 |
ENSRNOT00000010975
|
Fam64a
|
family with sequence similarity 64, member A |
| chr3_+_67849966 | 0.46 |
ENSRNOT00000057826
|
Dusp19
|
dual specificity phosphatase 19 |
| chr8_+_118926478 | 0.46 |
ENSRNOT00000028426
|
Ccdc12
|
coiled-coil domain containing 12 |
| chr10_+_55642070 | 0.46 |
ENSRNOT00000008507
|
Borcs6
|
BLOC-1 related complex subunit 6 |
| chr7_+_120153184 | 0.46 |
ENSRNOT00000013538
|
Lgals1
|
galectin 1 |
| chrX_-_156999650 | 0.45 |
ENSRNOT00000083557
|
Ssr4
|
signal sequence receptor subunit 4 |
| chr8_-_116391158 | 0.45 |
ENSRNOT00000078720
ENSRNOT00000022550 |
Gnai2
|
G protein subunit alpha i2 |
| chr7_-_11648322 | 0.45 |
ENSRNOT00000026871
|
Gadd45b
|
growth arrest and DNA-damage-inducible, beta |
| chr12_+_38965063 | 0.44 |
ENSRNOT00000074936
|
Morn3
|
MORN repeat containing 3 |
| chr4_-_157266018 | 0.44 |
ENSRNOT00000019570
|
LOC100911713
|
protein C10-like |
| chr5_-_151768123 | 0.44 |
ENSRNOT00000079380
|
Nudc
|
nuclear distribution C, dynein complex regulator |
| chr19_-_11057254 | 0.44 |
ENSRNOT00000025559
|
Herpud1
|
homocysteine inducible ER protein with ubiquitin like domain 1 |
| chr7_-_138707221 | 0.43 |
ENSRNOT00000009199
|
Amigo2
|
adhesion molecule with Ig like domain 2 |
| chr8_+_118525682 | 0.43 |
ENSRNOT00000028288
|
Elp6
|
elongator acetyltransferase complex subunit 6 |
| chr4_-_113954272 | 0.43 |
ENSRNOT00000039966
ENSRNOT00000082996 |
LOC103692173
|
WW domain-binding protein 1 |
| chr12_+_2170630 | 0.43 |
ENSRNOT00000071928
|
Pet100
|
PET100 homolog |
| chr11_+_36555416 | 0.43 |
ENSRNOT00000064981
|
Sh3bgr
|
SH3 domain binding glutamate-rich protein |
| chr6_-_106971250 | 0.43 |
ENSRNOT00000010926
|
Dpf3
|
double PHD fingers 3 |
| chr2_+_225005019 | 0.42 |
ENSRNOT00000015579
|
Cnn3
|
calponin 3 |
| chr10_-_59743315 | 0.42 |
ENSRNOT00000093646
|
Emc6
|
ER membrane protein complex subunit 6 |
| chr1_-_190914610 | 0.42 |
ENSRNOT00000023189
|
Cdr2
|
cerebellar degeneration-related protein 2 |
| chr12_-_54885 | 0.42 |
ENSRNOT00000090447
|
AABR07034833.1
|
|
| chr17_-_61332391 | 0.42 |
ENSRNOT00000034599
|
LOC100362965
|
SNRPN upstream reading frame protein-like |
| chr2_-_200513564 | 0.42 |
ENSRNOT00000056173
|
Phgdh
|
phosphoglycerate dehydrogenase |
| chr18_-_28454756 | 0.42 |
ENSRNOT00000040091
|
Spata24
|
spermatogenesis associated 24 |
| chr4_-_114820127 | 0.41 |
ENSRNOT00000079376
|
Wbp1
|
WW domain binding protein 1 |
| chr1_-_199037267 | 0.41 |
ENSRNOT00000078779
|
Ccdc189
|
coiled-coil domain containing 189 |
| chr6_-_22138286 | 0.41 |
ENSRNOT00000007607
|
Yipf4
|
Yip1 domain family, member 4 |
| chr3_-_150108898 | 0.41 |
ENSRNOT00000022914
|
Pxmp4
|
peroxisomal membrane protein 4 |
| chr16_+_20432899 | 0.41 |
ENSRNOT00000026271
|
Mpv17l2
|
MPV17 mitochondrial inner membrane protein like 2 |
| chr12_+_51878153 | 0.41 |
ENSRNOT00000056798
|
Hscb
|
HscB mitochondrial iron-sulfur cluster co-chaperone |
| chr9_+_16543688 | 0.41 |
ENSRNOT00000021868
|
Cnpy3
|
canopy FGF signaling regulator 3 |
| chr20_-_2701815 | 0.40 |
ENSRNOT00000061950
|
Hspa1a
|
heat shock protein family A (Hsp70) member 1A |
| chr20_-_4879779 | 0.40 |
ENSRNOT00000081924
|
Hspa1b
|
heat shock protein family A (Hsp70) member 1B |
| chr12_-_30314519 | 0.40 |
ENSRNOT00000001220
|
Zbed5
|
zinc finger, BED-type containing 5 |
| chr10_-_29026002 | 0.40 |
ENSRNOT00000005070
|
Pttg1
|
pituitary tumor-transforming 1 |
| chr16_-_20652889 | 0.40 |
ENSRNOT00000077756
|
Fkbp8
|
FK506 binding protein 8 |
| chr17_-_43776460 | 0.40 |
ENSRNOT00000089055
|
Hist2h3c2
|
histone cluster 2, H3c2 |
| chr20_-_5533448 | 0.39 |
ENSRNOT00000000568
|
Cuta
|
cutA divalent cation tolerance homolog |
| chr3_-_83048289 | 0.39 |
ENSRNOT00000047571
ENSRNOT00000012806 |
Hsd17b12
|
hydroxysteroid (17-beta) dehydrogenase 12 |
| chr13_-_36156076 | 0.39 |
ENSRNOT00000074685
|
Dbi
|
diazepam binding inhibitor, acyl-CoA binding protein |
| chr17_-_44748188 | 0.39 |
ENSRNOT00000081970
|
LOC103690190
|
histone H2A type 1-E |
| chr9_+_40972089 | 0.39 |
ENSRNOT00000067928
|
Ptpn18
|
protein tyrosine phosphatase, non-receptor type 18 |
| chr4_-_85192834 | 0.39 |
ENSRNOT00000043752
|
Ggct
|
gamma-glutamyl cyclotransferase |
| chr6_-_123894826 | 0.38 |
ENSRNOT00000082444
|
Efcab11
|
EF-hand calcium binding domain 11 |
| chr14_+_84231639 | 0.38 |
ENSRNOT00000066362
|
Gal3st1
|
galactose-3-O-sulfotransferase 1 |
| chr1_+_80417310 | 0.38 |
ENSRNOT00000023652
|
Trappc6a
|
trafficking protein particle complex 6A |
| chr4_-_84768249 | 0.38 |
ENSRNOT00000013205
|
Fkbp14
|
FK506 binding protein 14 |
| chr11_-_74315248 | 0.38 |
ENSRNOT00000002346
|
Hes1
|
hes family bHLH transcription factor 1 |
| chr2_-_115836846 | 0.37 |
ENSRNOT00000014359
|
Cldn11
|
claudin 11 |
| chr4_-_157347803 | 0.37 |
ENSRNOT00000020785
|
Usp5
|
ubiquitin specific peptidase 5 |
| chr20_-_5533600 | 0.37 |
ENSRNOT00000072319
|
Cuta
|
cutA divalent cation tolerance homolog |
| chr9_-_26932201 | 0.37 |
ENSRNOT00000017081
|
Mcm3
|
minichromosome maintenance complex component 3 |
| chr2_+_198417619 | 0.37 |
ENSRNOT00000085945
|
Hist2h3c2
|
histone cluster 2, H3c2 |
| chr3_-_148313810 | 0.37 |
ENSRNOT00000010762
|
Bcl2l1
|
Bcl2-like 1 |
| chr17_+_43633675 | 0.37 |
ENSRNOT00000072119
|
LOC102549173
|
histone H3.2-like |
| chr20_+_44680449 | 0.37 |
ENSRNOT00000000728
|
Traf3ip2
|
Traf3 interacting protein 2 |
| chr10_-_57653359 | 0.37 |
ENSRNOT00000089638
|
Derl2
|
derlin 2 |
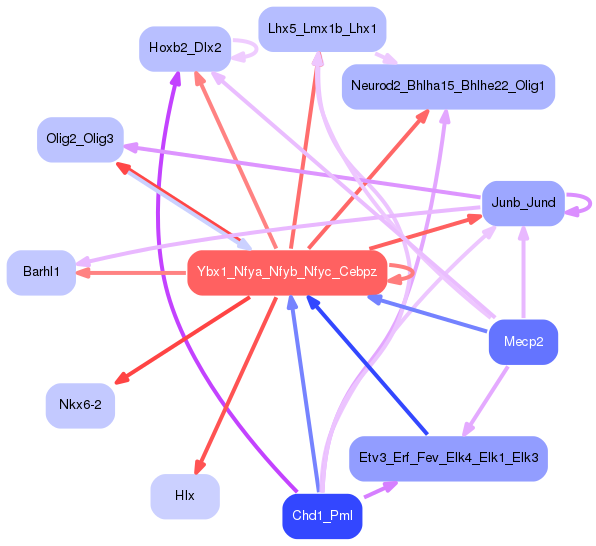
Network of associatons between targets according to the STRING database.

First level regulatory network of Ybx1_Nfya_Nfyb_Nfyc_Cebpz
Gene Ontology Analysis
Gene overrepresentation in biological process category:
| Log-likelihood per target | Total log-likelihood | Term | Description |
|---|---|---|---|
| 0.6 | 6.8 | GO:0015671 | oxygen transport(GO:0015671) |
| 0.4 | 1.3 | GO:0031439 | positive regulation of mRNA cleavage(GO:0031439) positive regulation of endoribonuclease activity(GO:1902380) positive regulation of mRNA endonucleolytic cleavage involved in unfolded protein response(GO:1904722) |
| 0.4 | 1.2 | GO:0021577 | hindbrain structural organization(GO:0021577) cerebellum structural organization(GO:0021589) |
| 0.4 | 1.1 | GO:0021530 | spinal cord oligodendrocyte cell differentiation(GO:0021529) spinal cord oligodendrocyte cell fate specification(GO:0021530) |
| 0.3 | 1.7 | GO:1902746 | regulation of lens fiber cell differentiation(GO:1902746) |
| 0.3 | 1.0 | GO:0016129 | phytosteroid metabolic process(GO:0016128) phytosteroid biosynthetic process(GO:0016129) |
| 0.3 | 1.1 | GO:0090074 | negative regulation of protein homodimerization activity(GO:0090074) |
| 0.3 | 1.3 | GO:0031508 | pericentric heterochromatin assembly(GO:0031508) |
| 0.3 | 1.3 | GO:0021913 | regulation of transcription from RNA polymerase II promoter involved in spinal cord motor neuron fate specification(GO:0021912) regulation of transcription from RNA polymerase II promoter involved in ventral spinal cord interneuron specification(GO:0021913) |
| 0.3 | 1.1 | GO:0006114 | glycerol biosynthetic process(GO:0006114) |
| 0.3 | 0.8 | GO:0021898 | regulation of transcription from RNA polymerase II promoter involved in forebrain neuron fate commitment(GO:0021882) commitment of multipotent stem cells to neuronal lineage in forebrain(GO:0021898) |
| 0.2 | 1.5 | GO:0035795 | negative regulation of mitochondrial membrane permeability(GO:0035795) |
| 0.2 | 1.0 | GO:0060266 | negative regulation of respiratory burst involved in inflammatory response(GO:0060266) |
| 0.2 | 0.9 | GO:0045903 | positive regulation of translational fidelity(GO:0045903) |
| 0.2 | 0.2 | GO:0061740 | protein targeting to lysosome involved in chaperone-mediated autophagy(GO:0061740) |
| 0.2 | 0.7 | GO:0014916 | regulation of lung blood pressure(GO:0014916) |
| 0.2 | 0.2 | GO:0009182 | purine deoxyribonucleoside diphosphate metabolic process(GO:0009182) dGDP metabolic process(GO:0046066) |
| 0.2 | 0.6 | GO:0052047 | interaction with other organism via secreted substance involved in symbiotic interaction(GO:0052047) |
| 0.2 | 0.8 | GO:1903334 | positive regulation of protein folding(GO:1903334) |
| 0.2 | 1.0 | GO:0045627 | positive regulation of T-helper 1 cell differentiation(GO:0045627) negative regulation of T-helper 2 cell differentiation(GO:0045629) |
| 0.2 | 0.8 | GO:0043988 | histone H3-S28 phosphorylation(GO:0043988) |
| 0.2 | 1.3 | GO:0002238 | response to molecule of fungal origin(GO:0002238) |
| 0.2 | 0.9 | GO:0045578 | negative regulation of B cell differentiation(GO:0045578) |
| 0.2 | 0.5 | GO:0002397 | MHC class I protein complex assembly(GO:0002397) |
| 0.2 | 0.2 | GO:1902659 | regulation of glucose mediated signaling pathway(GO:1902659) |
| 0.2 | 1.0 | GO:0042908 | xenobiotic transport(GO:0042908) |
| 0.2 | 0.3 | GO:0051344 | negative regulation of cyclic-nucleotide phosphodiesterase activity(GO:0051344) |
| 0.2 | 0.9 | GO:1904401 | cellular response to Thyroid stimulating hormone(GO:1904401) |
| 0.2 | 0.5 | GO:1904954 | Spemann organizer formation(GO:0060061) canonical Wnt signaling pathway involved in midbrain dopaminergic neuron differentiation(GO:1904954) |
| 0.2 | 0.5 | GO:1903630 | regulation of aminoacyl-tRNA ligase activity(GO:1903630) |
| 0.2 | 0.3 | GO:0000720 | pyrimidine dimer repair by nucleotide-excision repair(GO:0000720) |
| 0.2 | 1.0 | GO:0032286 | central nervous system myelin maintenance(GO:0032286) |
| 0.2 | 0.8 | GO:0033384 | geranyl diphosphate metabolic process(GO:0033383) geranyl diphosphate biosynthetic process(GO:0033384) |
| 0.2 | 0.5 | GO:1903243 | negative regulation of cardiac muscle hypertrophy in response to stress(GO:1903243) |
| 0.2 | 0.6 | GO:0021586 | pons maturation(GO:0021586) |
| 0.2 | 1.7 | GO:1904153 | negative regulation of protein exit from endoplasmic reticulum(GO:0070862) negative regulation of retrograde protein transport, ER to cytosol(GO:1904153) |
| 0.2 | 0.5 | GO:0009249 | protein lipoylation(GO:0009249) |
| 0.2 | 0.6 | GO:0010994 | regulation of ubiquitin homeostasis(GO:0010993) free ubiquitin chain polymerization(GO:0010994) |
| 0.2 | 0.8 | GO:0034553 | respiratory chain complex II assembly(GO:0034552) mitochondrial respiratory chain complex II assembly(GO:0034553) mitochondrial respiratory chain complex II biogenesis(GO:0097032) |
| 0.2 | 2.4 | GO:0002227 | innate immune response in mucosa(GO:0002227) |
| 0.1 | 1.8 | GO:0071712 | ER-associated misfolded protein catabolic process(GO:0071712) |
| 0.1 | 0.6 | GO:0061303 | cornea development in camera-type eye(GO:0061303) |
| 0.1 | 0.4 | GO:0098749 | cerebellar neuron development(GO:0098749) |
| 0.1 | 0.1 | GO:0002481 | antigen processing and presentation of exogenous peptide antigen via MHC class Ib(GO:0002477) antigen processing and presentation of exogenous protein antigen via MHC class Ib, TAP-dependent(GO:0002481) |
| 0.1 | 0.6 | GO:1904009 | cellular response to monosodium glutamate(GO:1904009) |
| 0.1 | 0.1 | GO:2000040 | regulation of planar cell polarity pathway involved in axis elongation(GO:2000040) negative regulation of planar cell polarity pathway involved in axis elongation(GO:2000041) |
| 0.1 | 0.8 | GO:0018401 | peptidyl-proline hydroxylation to 4-hydroxy-L-proline(GO:0018401) |
| 0.1 | 0.5 | GO:0002317 | plasma cell differentiation(GO:0002317) |
| 0.1 | 11.7 | GO:0006342 | chromatin silencing(GO:0006342) |
| 0.1 | 0.4 | GO:0061732 | mitochondrial acetyl-CoA biosynthetic process from pyruvate(GO:0061732) |
| 0.1 | 1.0 | GO:0019885 | antigen processing and presentation of endogenous peptide antigen via MHC class I(GO:0019885) |
| 0.1 | 0.4 | GO:0019375 | galactosylceramide biosynthetic process(GO:0006682) galactolipid biosynthetic process(GO:0019375) |
| 0.1 | 0.4 | GO:0021557 | oculomotor nerve development(GO:0021557) trochlear nerve development(GO:0021558) |
| 0.1 | 0.4 | GO:1990792 | response to glial cell derived neurotrophic factor(GO:1990790) cellular response to glial cell derived neurotrophic factor(GO:1990792) |
| 0.1 | 0.4 | GO:1905218 | cellular response to astaxanthin(GO:1905218) |
| 0.1 | 2.9 | GO:0006335 | DNA replication-dependent nucleosome assembly(GO:0006335) DNA replication-dependent nucleosome organization(GO:0034723) |
| 0.1 | 0.5 | GO:1902174 | positive regulation of keratinocyte apoptotic process(GO:1902174) |
| 0.1 | 0.4 | GO:0032057 | negative regulation of translational initiation in response to stress(GO:0032057) |
| 0.1 | 0.8 | GO:0021937 | cerebellar Purkinje cell-granule cell precursor cell signaling involved in regulation of granule cell precursor cell proliferation(GO:0021937) |
| 0.1 | 0.3 | GO:0048210 | Golgi vesicle fusion to target membrane(GO:0048210) |
| 0.1 | 0.2 | GO:2001034 | positive regulation of double-strand break repair via nonhomologous end joining(GO:2001034) |
| 0.1 | 0.5 | GO:0006420 | arginyl-tRNA aminoacylation(GO:0006420) |
| 0.1 | 0.2 | GO:0036506 | maintenance of unfolded protein(GO:0036506) maintenance of unfolded protein involved in ERAD pathway(GO:1904378) |
| 0.1 | 0.3 | GO:1903699 | tarsal gland development(GO:1903699) |
| 0.1 | 0.3 | GO:0090481 | pyrimidine nucleotide-sugar transmembrane transport(GO:0090481) |
| 0.1 | 0.1 | GO:0046671 | negative regulation of retinal cell programmed cell death(GO:0046671) |
| 0.1 | 0.3 | GO:0016094 | polyprenol biosynthetic process(GO:0016094) |
| 0.1 | 0.2 | GO:0080033 | cellular response to nitrite(GO:0071250) response to nitrite(GO:0080033) |
| 0.1 | 0.1 | GO:0039526 | suppression by virus of host apoptotic process(GO:0019050) modulation by virus of host apoptotic process(GO:0039526) |
| 0.1 | 0.5 | GO:0019243 | methylglyoxal catabolic process to D-lactate via S-lactoyl-glutathione(GO:0019243) methylglyoxal catabolic process(GO:0051596) methylglyoxal catabolic process to lactate(GO:0061727) |
| 0.1 | 0.2 | GO:0002344 | peripheral B cell selection(GO:0002343) B cell affinity maturation(GO:0002344) |
| 0.1 | 0.2 | GO:0070173 | regulation of enamel mineralization(GO:0070173) |
| 0.1 | 0.5 | GO:0051754 | meiotic sister chromatid cohesion, centromeric(GO:0051754) |
| 0.1 | 0.5 | GO:0006566 | threonine metabolic process(GO:0006566) |
| 0.1 | 0.3 | GO:0035880 | embryonic nail plate morphogenesis(GO:0035880) |
| 0.1 | 0.9 | GO:1902177 | positive regulation of oxidative stress-induced intrinsic apoptotic signaling pathway(GO:1902177) |
| 0.1 | 0.3 | GO:0035359 | negative regulation of peroxisome proliferator activated receptor signaling pathway(GO:0035359) |
| 0.1 | 1.7 | GO:0000185 | activation of MAPKKK activity(GO:0000185) |
| 0.1 | 0.2 | GO:0002489 | antigen processing and presentation of endogenous peptide antigen via MHC class Ib via ER pathway(GO:0002488) antigen processing and presentation of endogenous peptide antigen via MHC class Ib via ER pathway, TAP-dependent(GO:0002489) |
| 0.1 | 0.4 | GO:0036151 | phosphatidylcholine acyl-chain remodeling(GO:0036151) |
| 0.1 | 1.0 | GO:0071318 | cellular response to ATP(GO:0071318) |
| 0.1 | 0.4 | GO:0046490 | isopentenyl diphosphate biosynthetic process(GO:0009240) isopentenyl diphosphate metabolic process(GO:0046490) |
| 0.1 | 0.2 | GO:0034140 | negative regulation of toll-like receptor 3 signaling pathway(GO:0034140) |
| 0.1 | 0.7 | GO:0097428 | protein maturation by iron-sulfur cluster transfer(GO:0097428) |
| 0.1 | 0.2 | GO:0071733 | transcriptional activation by promoter-enhancer looping(GO:0071733) gene looping(GO:0090202) dsDNA loop formation(GO:0090579) |
| 0.1 | 0.7 | GO:0016584 | nucleosome positioning(GO:0016584) |
| 0.1 | 2.0 | GO:0045475 | locomotor rhythm(GO:0045475) |
| 0.1 | 0.3 | GO:1990036 | calcium ion import into sarcoplasmic reticulum(GO:1990036) |
| 0.1 | 1.1 | GO:0045820 | negative regulation of glycolytic process(GO:0045820) |
| 0.1 | 0.3 | GO:0019230 | proprioception(GO:0019230) |
| 0.1 | 0.3 | GO:0055129 | L-proline biosynthetic process(GO:0055129) |
| 0.1 | 0.5 | GO:0007341 | penetration of zona pellucida(GO:0007341) |
| 0.1 | 1.1 | GO:0006265 | DNA topological change(GO:0006265) |
| 0.1 | 0.3 | GO:0090158 | endoplasmic reticulum membrane organization(GO:0090158) |
| 0.1 | 0.9 | GO:0001886 | endothelial cell morphogenesis(GO:0001886) |
| 0.1 | 0.3 | GO:0010725 | regulation of primitive erythrocyte differentiation(GO:0010725) |
| 0.1 | 0.3 | GO:0010609 | mRNA localization resulting in posttranscriptional regulation of gene expression(GO:0010609) positive regulation of DNA damage response, signal transduction by p53 class mediator resulting in transcription of p21 class mediator(GO:1902164) |
| 0.1 | 0.8 | GO:2000035 | regulation of stem cell division(GO:2000035) |
| 0.1 | 0.2 | GO:0060648 | mammary gland bud morphogenesis(GO:0060648) |
| 0.1 | 1.5 | GO:0031033 | myosin filament organization(GO:0031033) |
| 0.1 | 0.4 | GO:1903071 | positive regulation of ER-associated ubiquitin-dependent protein catabolic process(GO:1903071) |
| 0.1 | 0.2 | GO:0070814 | hydrogen sulfide biosynthetic process(GO:0070814) |
| 0.1 | 0.2 | GO:0031583 | phospholipase D-activating G-protein coupled receptor signaling pathway(GO:0031583) |
| 0.1 | 0.4 | GO:0061668 | mitochondrial ribosome assembly(GO:0061668) |
| 0.1 | 0.4 | GO:0016557 | peroxisome membrane biogenesis(GO:0016557) |
| 0.1 | 0.7 | GO:0007023 | post-chaperonin tubulin folding pathway(GO:0007023) |
| 0.1 | 0.3 | GO:0017185 | peptidyl-lysine hydroxylation(GO:0017185) |
| 0.1 | 0.3 | GO:0045048 | protein insertion into ER membrane(GO:0045048) |
| 0.1 | 0.2 | GO:0000915 | assembly of actomyosin apparatus involved in cytokinesis(GO:0000912) actomyosin contractile ring assembly(GO:0000915) actomyosin contractile ring organization(GO:0044837) |
| 0.1 | 0.3 | GO:0035494 | SNARE complex disassembly(GO:0035494) |
| 0.1 | 0.4 | GO:0043985 | histone H4-R3 methylation(GO:0043985) |
| 0.1 | 0.2 | GO:0052564 | response to immune response of other organism involved in symbiotic interaction(GO:0052564) response to host immune response(GO:0052572) |
| 0.1 | 0.2 | GO:0009153 | purine deoxyribonucleotide biosynthetic process(GO:0009153) purine deoxyribonucleoside triphosphate biosynthetic process(GO:0009216) AMP salvage(GO:0044209) adenosine biosynthetic process(GO:0046086) |
| 0.1 | 0.2 | GO:1904253 | positive regulation of bile acid biosynthetic process(GO:0070859) positive regulation of bile acid metabolic process(GO:1904253) |
| 0.1 | 0.2 | GO:1900195 | positive regulation of oocyte maturation(GO:1900195) positive regulation of proteasomal ubiquitin-dependent protein catabolic process involved in cellular response to hypoxia(GO:2000777) |
| 0.1 | 0.3 | GO:0097069 | cellular response to thyroxine stimulus(GO:0097069) |
| 0.1 | 4.0 | GO:0006334 | nucleosome assembly(GO:0006334) |
| 0.1 | 0.1 | GO:0048865 | stem cell fate commitment(GO:0048865) |
| 0.1 | 0.2 | GO:1904580 | regulation of intracellular mRNA localization(GO:1904580) |
| 0.1 | 0.3 | GO:1904504 | regulation of lipophagy(GO:1904502) positive regulation of lipophagy(GO:1904504) |
| 0.1 | 0.2 | GO:2001137 | positive regulation of endocytic recycling(GO:2001137) |
| 0.1 | 0.4 | GO:2000348 | regulation of CD40 signaling pathway(GO:2000348) |
| 0.1 | 0.3 | GO:1902618 | cellular response to fluoride(GO:1902618) |
| 0.1 | 0.4 | GO:0007253 | cytoplasmic sequestering of NF-kappaB(GO:0007253) |
| 0.1 | 0.5 | GO:0006703 | estrogen biosynthetic process(GO:0006703) |
| 0.1 | 0.1 | GO:1904815 | negative regulation of protein localization to chromosome, telomeric region(GO:1904815) |
| 0.1 | 0.3 | GO:1902416 | positive regulation of mRNA binding(GO:1902416) |
| 0.1 | 0.3 | GO:0030382 | sperm mitochondrion organization(GO:0030382) |
| 0.1 | 0.1 | GO:0006407 | rRNA export from nucleus(GO:0006407) |
| 0.1 | 0.2 | GO:0043060 | meiotic metaphase I plate congression(GO:0043060) |
| 0.1 | 0.5 | GO:1900264 | regulation of DNA-directed DNA polymerase activity(GO:1900262) positive regulation of DNA-directed DNA polymerase activity(GO:1900264) |
| 0.1 | 0.3 | GO:0021546 | rhombomere development(GO:0021546) |
| 0.1 | 0.2 | GO:2000660 | negative regulation of interleukin-1-mediated signaling pathway(GO:2000660) |
| 0.1 | 0.2 | GO:0036135 | Schwann cell migration(GO:0036135) regulation of Schwann cell migration(GO:1900147) |
| 0.1 | 0.2 | GO:1903026 | negative regulation of RNA polymerase II regulatory region sequence-specific DNA binding(GO:1903026) |
| 0.1 | 0.6 | GO:0031915 | positive regulation of synaptic plasticity(GO:0031915) |
| 0.1 | 0.2 | GO:0033277 | abortive mitotic cell cycle(GO:0033277) |
| 0.1 | 0.1 | GO:0034635 | glutathione transport(GO:0034635) tripeptide transport(GO:0042939) |
| 0.1 | 0.2 | GO:0034418 | urate biosynthetic process(GO:0034418) |
| 0.1 | 0.3 | GO:0007621 | negative regulation of female receptivity(GO:0007621) |
| 0.1 | 0.2 | GO:1902303 | negative regulation of potassium ion export(GO:1902303) |
| 0.1 | 0.1 | GO:0021678 | third ventricle development(GO:0021678) |
| 0.1 | 0.3 | GO:0021759 | globus pallidus development(GO:0021759) |
| 0.1 | 0.1 | GO:0032058 | positive regulation of translational initiation in response to stress(GO:0032058) |
| 0.1 | 0.3 | GO:2000774 | positive regulation of cellular senescence(GO:2000774) |
| 0.1 | 0.2 | GO:0010626 | negative regulation of Schwann cell proliferation(GO:0010626) |
| 0.1 | 0.8 | GO:0040015 | negative regulation of multicellular organism growth(GO:0040015) |
| 0.1 | 1.2 | GO:0060716 | labyrinthine layer blood vessel development(GO:0060716) |
| 0.1 | 0.2 | GO:1904674 | ectoderm and mesoderm interaction(GO:0007499) positive regulation of somatic stem cell population maintenance(GO:1904674) |
| 0.1 | 0.2 | GO:0060399 | positive regulation of growth hormone receptor signaling pathway(GO:0060399) |
| 0.1 | 0.2 | GO:0045900 | SRP-dependent cotranslational protein targeting to membrane, translocation(GO:0006616) negative regulation of translational elongation(GO:0045900) |
| 0.1 | 0.1 | GO:0071245 | cellular response to carbon monoxide(GO:0071245) |
| 0.1 | 0.2 | GO:0042732 | D-xylose metabolic process(GO:0042732) |
| 0.1 | 0.3 | GO:0046836 | glycolipid transport(GO:0046836) |
| 0.1 | 0.7 | GO:0033617 | mitochondrial respiratory chain complex IV assembly(GO:0033617) |
| 0.1 | 0.9 | GO:0030150 | protein import into mitochondrial matrix(GO:0030150) |
| 0.1 | 0.9 | GO:0003084 | positive regulation of systemic arterial blood pressure(GO:0003084) |
| 0.1 | 0.1 | GO:0014834 | skeletal muscle satellite cell maintenance involved in skeletal muscle regeneration(GO:0014834) |
| 0.1 | 0.3 | GO:1904781 | positive regulation of protein localization to centrosome(GO:1904781) |
| 0.1 | 0.2 | GO:0010813 | neuropeptide catabolic process(GO:0010813) |
| 0.1 | 0.1 | GO:0002032 | desensitization of G-protein coupled receptor protein signaling pathway by arrestin(GO:0002032) |
| 0.1 | 0.3 | GO:0051490 | negative regulation of filopodium assembly(GO:0051490) |
| 0.1 | 0.3 | GO:0006102 | isocitrate metabolic process(GO:0006102) |
| 0.1 | 0.4 | GO:1904869 | protein localization to nuclear body(GO:1903405) protein localization to Cajal body(GO:1904867) regulation of protein localization to Cajal body(GO:1904869) positive regulation of protein localization to Cajal body(GO:1904871) protein localization to nucleoplasm(GO:1990173) |
| 0.1 | 0.3 | GO:0002072 | optic cup morphogenesis involved in camera-type eye development(GO:0002072) |
| 0.1 | 0.3 | GO:1903142 | positive regulation of endothelial cell development(GO:1901552) positive regulation of establishment of endothelial barrier(GO:1903142) |
| 0.1 | 0.2 | GO:0032978 | protein insertion into membrane from inner side(GO:0032978) |
| 0.1 | 0.2 | GO:0032077 | positive regulation of deoxyribonuclease activity(GO:0032077) |
| 0.1 | 0.5 | GO:0061029 | eyelid development in camera-type eye(GO:0061029) |
| 0.1 | 0.1 | GO:2000592 | pronephric field specification(GO:0039003) pattern specification involved in pronephros development(GO:0039017) thyroid-stimulating hormone secretion(GO:0070460) kidney field specification(GO:0072004) regulation of mesenchymal cell apoptotic process involved in metanephric nephron morphogenesis(GO:0072304) negative regulation of mesenchymal cell apoptotic process involved in metanephric nephron morphogenesis(GO:0072305) apoptotic process involved in metanephric collecting duct development(GO:1900204) apoptotic process involved in metanephric nephron tubule development(GO:1900205) regulation of apoptotic process involved in metanephric collecting duct development(GO:1900214) negative regulation of apoptotic process involved in metanephric collecting duct development(GO:1900215) regulation of apoptotic process involved in metanephric nephron tubule development(GO:1900217) negative regulation of apoptotic process involved in metanephric nephron tubule development(GO:1900218) mesenchymal cell apoptotic process involved in metanephric nephron morphogenesis(GO:1901147) regulation of metanephric DCT cell differentiation(GO:2000592) positive regulation of metanephric DCT cell differentiation(GO:2000594) regulation of thyroid-stimulating hormone secretion(GO:2000612) |
| 0.1 | 0.4 | GO:0045059 | positive thymic T cell selection(GO:0045059) |
| 0.1 | 0.2 | GO:1901873 | regulation of post-translational protein modification(GO:1901873) |
| 0.1 | 0.2 | GO:0048619 | embryonic hindgut morphogenesis(GO:0048619) |
| 0.1 | 0.2 | GO:0060800 | regulation of cell differentiation involved in embryonic placenta development(GO:0060800) |
| 0.0 | 0.5 | GO:0005981 | regulation of glycogen catabolic process(GO:0005981) |
| 0.0 | 0.2 | GO:0072709 | cellular response to sorbitol(GO:0072709) |
| 0.0 | 0.5 | GO:2000042 | negative regulation of double-strand break repair via homologous recombination(GO:2000042) |
| 0.0 | 0.7 | GO:0030575 | nuclear body organization(GO:0030575) |
| 0.0 | 0.1 | GO:0052314 | phytoalexin metabolic process(GO:0052314) |
| 0.0 | 0.3 | GO:0048539 | bone marrow development(GO:0048539) |
| 0.0 | 0.2 | GO:1900019 | regulation of protein kinase C activity(GO:1900019) positive regulation of protein kinase C activity(GO:1900020) |
| 0.0 | 0.0 | GO:1903936 | cellular response to sodium arsenite(GO:1903936) |
| 0.0 | 0.4 | GO:1903232 | melanosome assembly(GO:1903232) |
| 0.0 | 0.1 | GO:0001306 | age-dependent response to oxidative stress(GO:0001306) age-dependent general metabolic decline(GO:0007571) |
| 0.0 | 0.1 | GO:1902268 | negative regulation of polyamine transmembrane transport(GO:1902268) |
| 0.0 | 0.3 | GO:0043456 | regulation of pentose-phosphate shunt(GO:0043456) |
| 0.0 | 0.1 | GO:0007356 | thorax and anterior abdomen determination(GO:0007356) cranial nerve formation(GO:0021603) vestibulocochlear nerve formation(GO:0021650) |
| 0.0 | 0.2 | GO:0045040 | protein import into mitochondrial outer membrane(GO:0045040) |
| 0.0 | 0.2 | GO:0052651 | monoacylglycerol metabolic process(GO:0046462) monoacylglycerol catabolic process(GO:0052651) |
| 0.0 | 0.1 | GO:0051005 | negative regulation of lipoprotein lipase activity(GO:0051005) |
| 0.0 | 0.0 | GO:0060594 | mammary gland specification(GO:0060594) |
| 0.0 | 0.3 | GO:0006776 | vitamin A metabolic process(GO:0006776) |
| 0.0 | 1.3 | GO:0015985 | energy coupled proton transport, down electrochemical gradient(GO:0015985) ATP synthesis coupled proton transport(GO:0015986) |
| 0.0 | 0.5 | GO:0035900 | response to isolation stress(GO:0035900) |
| 0.0 | 0.0 | GO:0045338 | farnesyl diphosphate metabolic process(GO:0045338) |
| 0.0 | 0.7 | GO:0002230 | positive regulation of defense response to virus by host(GO:0002230) |
| 0.0 | 0.2 | GO:0048133 | germ-line stem cell division(GO:0042078) male germ-line stem cell asymmetric division(GO:0048133) germline stem cell asymmetric division(GO:0098728) |
| 0.0 | 0.3 | GO:0016191 | synaptic vesicle uncoating(GO:0016191) |
| 0.0 | 0.4 | GO:0034975 | protein folding in endoplasmic reticulum(GO:0034975) |
| 0.0 | 0.8 | GO:0097031 | NADH dehydrogenase complex assembly(GO:0010257) mitochondrial respiratory chain complex I assembly(GO:0032981) mitochondrial respiratory chain complex I biogenesis(GO:0097031) |
| 0.0 | 0.2 | GO:0060620 | regulation of cholesterol import(GO:0060620) regulation of sterol import(GO:2000909) |
| 0.0 | 0.2 | GO:1904528 | positive regulation of microtubule binding(GO:1904528) |
| 0.0 | 0.1 | GO:0032474 | otolith morphogenesis(GO:0032474) |
| 0.0 | 0.3 | GO:0002501 | MHC protein complex assembly(GO:0002396) peptide antigen assembly with MHC protein complex(GO:0002501) |
| 0.0 | 0.3 | GO:1901621 | negative regulation of smoothened signaling pathway involved in dorsal/ventral neural tube patterning(GO:1901621) |
| 0.0 | 0.3 | GO:0034551 | respiratory chain complex III assembly(GO:0017062) mitochondrial respiratory chain complex III assembly(GO:0034551) mitochondrial respiratory chain complex III biogenesis(GO:0097033) |
| 0.0 | 0.2 | GO:0032919 | spermine acetylation(GO:0032919) |
| 0.0 | 0.1 | GO:0070494 | regulation of thrombin receptor signaling pathway(GO:0070494) negative regulation of thrombin receptor signaling pathway(GO:0070495) |
| 0.0 | 0.5 | GO:0006388 | tRNA splicing, via endonucleolytic cleavage and ligation(GO:0006388) |
| 0.0 | 0.2 | GO:0038031 | non-canonical Wnt signaling pathway via JNK cascade(GO:0038031) |
| 0.0 | 0.1 | GO:1902856 | negative regulation of nonmotile primary cilium assembly(GO:1902856) |
| 0.0 | 0.4 | GO:0070244 | negative regulation of thymocyte apoptotic process(GO:0070244) |
| 0.0 | 0.3 | GO:0070934 | CRD-mediated mRNA stabilization(GO:0070934) |
| 0.0 | 0.1 | GO:0015780 | nucleotide-sugar transport(GO:0015780) |
| 0.0 | 0.2 | GO:0006004 | fucose metabolic process(GO:0006004) |
| 0.0 | 0.4 | GO:0001973 | adenosine receptor signaling pathway(GO:0001973) |
| 0.0 | 0.1 | GO:1902445 | regulation of mitochondrial membrane permeability involved in programmed necrotic cell death(GO:1902445) |
| 0.0 | 0.2 | GO:0097116 | gephyrin clustering involved in postsynaptic density assembly(GO:0097116) |
| 0.0 | 0.1 | GO:0042427 | serotonin biosynthetic process(GO:0042427) primary amino compound biosynthetic process(GO:1901162) |
| 0.0 | 0.3 | GO:0061469 | regulation of type B pancreatic cell proliferation(GO:0061469) |
| 0.0 | 0.3 | GO:0044829 | positive regulation by host of viral genome replication(GO:0044829) |
| 0.0 | 0.3 | GO:0021553 | olfactory nerve development(GO:0021553) |
| 0.0 | 0.2 | GO:0019509 | L-methionine biosynthetic process from methylthioadenosine(GO:0019509) |
| 0.0 | 0.1 | GO:1902512 | positive regulation of apoptotic DNA fragmentation(GO:1902512) positive regulation of DNA catabolic process(GO:1903626) |
| 0.0 | 0.1 | GO:0032472 | Golgi calcium ion transport(GO:0032472) |
| 0.0 | 0.2 | GO:0060363 | cranial suture morphogenesis(GO:0060363) |
| 0.0 | 0.2 | GO:0090084 | negative regulation of inclusion body assembly(GO:0090084) |
| 0.0 | 0.1 | GO:0050975 | sensory perception of touch(GO:0050975) |
| 0.0 | 0.1 | GO:0071461 | cellular response to redox state(GO:0071461) |
| 0.0 | 0.5 | GO:0044241 | lipid digestion(GO:0044241) |
| 0.0 | 0.3 | GO:1903297 | regulation of hypoxia-induced intrinsic apoptotic signaling pathway(GO:1903297) negative regulation of hypoxia-induced intrinsic apoptotic signaling pathway(GO:1903298) |
| 0.0 | 0.2 | GO:0042989 | sequestering of actin monomers(GO:0042989) |
| 0.0 | 0.2 | GO:2000327 | regulation of ligand-dependent nuclear receptor transcription coactivator activity(GO:2000325) positive regulation of ligand-dependent nuclear receptor transcription coactivator activity(GO:2000327) |
| 0.0 | 0.1 | GO:0072193 | ureter smooth muscle development(GO:0072191) ureter smooth muscle cell differentiation(GO:0072193) |
| 0.0 | 0.1 | GO:0006710 | androgen catabolic process(GO:0006710) |
| 0.0 | 1.2 | GO:0021696 | cerebellar cortex morphogenesis(GO:0021696) |
| 0.0 | 0.3 | GO:1904706 | negative regulation of vascular smooth muscle cell proliferation(GO:1904706) |
| 0.0 | 0.3 | GO:0019372 | lipoxygenase pathway(GO:0019372) |
| 0.0 | 0.3 | GO:0045721 | negative regulation of gluconeogenesis(GO:0045721) |
| 0.0 | 0.6 | GO:0048665 | neuron fate specification(GO:0048665) |
| 0.0 | 0.3 | GO:0006751 | glutathione catabolic process(GO:0006751) |
| 0.0 | 0.1 | GO:0071895 | odontoblast differentiation(GO:0071895) |
| 0.0 | 0.3 | GO:0033234 | negative regulation of protein sumoylation(GO:0033234) |
| 0.0 | 0.5 | GO:0030497 | fatty acid elongation(GO:0030497) |
| 0.0 | 0.2 | GO:0071569 | protein ufmylation(GO:0071569) |
| 0.0 | 0.4 | GO:0006123 | mitochondrial electron transport, cytochrome c to oxygen(GO:0006123) |
| 0.0 | 0.1 | GO:0009438 | methylglyoxal metabolic process(GO:0009438) |
| 0.0 | 0.2 | GO:0035413 | positive regulation of catenin import into nucleus(GO:0035413) |
| 0.0 | 0.2 | GO:0003062 | regulation of heart rate by chemical signal(GO:0003062) |
| 0.0 | 0.1 | GO:0006106 | fumarate metabolic process(GO:0006106) |
| 0.0 | 0.1 | GO:0016480 | negative regulation of transcription from RNA polymerase III promoter(GO:0016480) |
| 0.0 | 0.2 | GO:0006880 | intracellular sequestering of iron ion(GO:0006880) sequestering of iron ion(GO:0097577) |
| 0.0 | 0.1 | GO:0061031 | endodermal digestive tract morphogenesis(GO:0061031) |
| 0.0 | 0.3 | GO:0030644 | cellular chloride ion homeostasis(GO:0030644) |
| 0.0 | 0.4 | GO:0016338 | calcium-independent cell-cell adhesion via plasma membrane cell-adhesion molecules(GO:0016338) |
| 0.0 | 0.2 | GO:0035630 | bone mineralization involved in bone maturation(GO:0035630) |
| 0.0 | 0.1 | GO:0042262 | DNA protection(GO:0042262) |
| 0.0 | 0.1 | GO:0071883 | activation of MAPK activity by adrenergic receptor signaling pathway(GO:0071883) |
| 0.0 | 0.2 | GO:0001552 | ovarian follicle atresia(GO:0001552) |
| 0.0 | 0.2 | GO:0001842 | neural fold formation(GO:0001842) |
| 0.0 | 0.2 | GO:0008291 | acetylcholine metabolic process(GO:0008291) acetate ester metabolic process(GO:1900619) |
| 0.0 | 0.2 | GO:0015870 | acetylcholine transport(GO:0015870) |
| 0.0 | 0.1 | GO:0001978 | regulation of systemic arterial blood pressure by carotid sinus baroreceptor feedback(GO:0001978) baroreceptor response to increased systemic arterial blood pressure(GO:0001983) |
| 0.0 | 0.1 | GO:0045054 | constitutive secretory pathway(GO:0045054) |
| 0.0 | 0.2 | GO:0021631 | optic nerve morphogenesis(GO:0021631) |
| 0.0 | 0.1 | GO:0070368 | positive regulation of hepatocyte differentiation(GO:0070368) |
| 0.0 | 0.4 | GO:0061179 | negative regulation of insulin secretion involved in cellular response to glucose stimulus(GO:0061179) |
| 0.0 | 0.5 | GO:0001731 | formation of translation preinitiation complex(GO:0001731) |
| 0.0 | 0.2 | GO:0014807 | regulation of somitogenesis(GO:0014807) |
| 0.0 | 0.1 | GO:0061043 | positive regulation of vascular wound healing(GO:0035470) regulation of vascular wound healing(GO:0061043) |
| 0.0 | 0.0 | GO:0070370 | cellular heat acclimation(GO:0070370) |
| 0.0 | 0.1 | GO:0043132 | NAD transport(GO:0043132) |
| 0.0 | 0.4 | GO:0090201 | negative regulation of release of cytochrome c from mitochondria(GO:0090201) |
| 0.0 | 0.0 | GO:0032917 | polyamine acetylation(GO:0032917) spermidine acetylation(GO:0032918) |
| 0.0 | 0.1 | GO:0006419 | alanyl-tRNA aminoacylation(GO:0006419) |
| 0.0 | 0.1 | GO:0030327 | prenylated protein catabolic process(GO:0030327) |
| 0.0 | 0.1 | GO:1903215 | negative regulation of protein targeting to mitochondrion(GO:1903215) |
| 0.0 | 0.1 | GO:2000843 | testosterone secretion(GO:0035936) negative regulation of glucagon secretion(GO:0070093) regulation of testosterone secretion(GO:2000843) positive regulation of testosterone secretion(GO:2000845) |
| 0.0 | 0.3 | GO:1990416 | cellular response to brain-derived neurotrophic factor stimulus(GO:1990416) |
| 0.0 | 0.1 | GO:0048861 | leukemia inhibitory factor signaling pathway(GO:0048861) |
| 0.0 | 0.2 | GO:0014050 | negative regulation of glutamate secretion(GO:0014050) |
| 0.0 | 0.2 | GO:0051342 | regulation of cyclic-nucleotide phosphodiesterase activity(GO:0051342) positive regulation of cyclic-nucleotide phosphodiesterase activity(GO:0051343) |
| 0.0 | 0.1 | GO:1903849 | regulation of aorta morphogenesis(GO:1903847) positive regulation of aorta morphogenesis(GO:1903849) |
| 0.0 | 0.1 | GO:2001053 | regulation of mesenchymal cell apoptotic process(GO:2001053) |
| 0.0 | 0.1 | GO:0035054 | embryonic heart tube anterior/posterior pattern specification(GO:0035054) |
| 0.0 | 0.1 | GO:0098507 | polynucleotide 5' dephosphorylation(GO:0098507) |
| 0.0 | 0.1 | GO:1903588 | negative regulation of blood vessel endothelial cell proliferation involved in sprouting angiogenesis(GO:1903588) |
| 0.0 | 0.1 | GO:2001206 | positive regulation of osteoclast development(GO:2001206) |
| 0.0 | 0.1 | GO:0035694 | mitochondrial protein catabolic process(GO:0035694) |
| 0.0 | 0.3 | GO:0006465 | signal peptide processing(GO:0006465) |
| 0.0 | 0.1 | GO:0048227 | plasma membrane to endosome transport(GO:0048227) |
| 0.0 | 0.3 | GO:0043248 | proteasome assembly(GO:0043248) |
| 0.0 | 0.0 | GO:0006533 | aspartate catabolic process(GO:0006533) |
| 0.0 | 0.7 | GO:0002474 | antigen processing and presentation of peptide antigen via MHC class I(GO:0002474) |
| 0.0 | 0.1 | GO:0006565 | L-serine catabolic process(GO:0006565) |
| 0.0 | 0.3 | GO:0003159 | morphogenesis of an endothelium(GO:0003159) |
| 0.0 | 0.4 | GO:0016556 | mRNA modification(GO:0016556) |
| 0.0 | 0.4 | GO:0036158 | outer dynein arm assembly(GO:0036158) |
| 0.0 | 0.7 | GO:0000387 | spliceosomal snRNP assembly(GO:0000387) |
| 0.0 | 0.2 | GO:0006488 | dolichol-linked oligosaccharide biosynthetic process(GO:0006488) |
| 0.0 | 0.2 | GO:0015697 | quaternary ammonium group transport(GO:0015697) |
| 0.0 | 0.1 | GO:0090283 | regulation of protein glycosylation in Golgi(GO:0090283) |
| 0.0 | 0.1 | GO:1903281 | positive regulation of calcium:sodium antiporter activity(GO:1903281) |
| 0.0 | 0.1 | GO:0051771 | negative regulation of nitric-oxide synthase biosynthetic process(GO:0051771) |
| 0.0 | 0.1 | GO:0018002 | N-terminal peptidyl-serine acetylation(GO:0017198) N-terminal peptidyl-glutamic acid acetylation(GO:0018002) peptidyl-serine acetylation(GO:0030920) |
| 0.0 | 0.2 | GO:0007549 | dosage compensation(GO:0007549) dosage compensation by inactivation of X chromosome(GO:0009048) |
| 0.0 | 0.0 | GO:1903750 | regulation of intrinsic apoptotic signaling pathway in response to hydrogen peroxide(GO:1903750) negative regulation of intrinsic apoptotic signaling pathway in response to hydrogen peroxide(GO:1903751) |
| 0.0 | 0.2 | GO:0009396 | folic acid-containing compound biosynthetic process(GO:0009396) |
| 0.0 | 0.1 | GO:2001015 | negative regulation of skeletal muscle cell differentiation(GO:2001015) |
| 0.0 | 0.1 | GO:0006104 | succinyl-CoA metabolic process(GO:0006104) |
| 0.0 | 0.1 | GO:0045603 | positive regulation of endothelial cell differentiation(GO:0045603) |
| 0.0 | 0.1 | GO:0034421 | post-translational protein acetylation(GO:0034421) |
| 0.0 | 0.1 | GO:0009822 | alkaloid catabolic process(GO:0009822) |
| 0.0 | 0.1 | GO:2001032 | regulation of double-strand break repair via nonhomologous end joining(GO:2001032) |
| 0.0 | 0.5 | GO:0006379 | mRNA cleavage(GO:0006379) |
| 0.0 | 0.1 | GO:0006435 | threonyl-tRNA aminoacylation(GO:0006435) |
| 0.0 | 0.2 | GO:0032780 | negative regulation of ATPase activity(GO:0032780) |
| 0.0 | 0.2 | GO:0006777 | Mo-molybdopterin cofactor biosynthetic process(GO:0006777) Mo-molybdopterin cofactor metabolic process(GO:0019720) |
| 0.0 | 0.1 | GO:0071028 | nuclear RNA surveillance(GO:0071027) nuclear mRNA surveillance(GO:0071028) |
| 0.0 | 0.1 | GO:0048102 | autophagic cell death(GO:0048102) |
| 0.0 | 0.7 | GO:0061077 | chaperone-mediated protein folding(GO:0061077) |
| 0.0 | 0.1 | GO:0070900 | mitochondrial tRNA modification(GO:0070900) mitochondrial RNA modification(GO:1900864) |
| 0.0 | 0.2 | GO:0006068 | ethanol catabolic process(GO:0006068) |
| 0.0 | 0.0 | GO:0060157 | urinary bladder development(GO:0060157) |
| 0.0 | 0.1 | GO:0010002 | cardioblast differentiation(GO:0010002) |
| 0.0 | 0.3 | GO:0050832 | defense response to fungus(GO:0050832) |
| 0.0 | 0.1 | GO:0035188 | blastocyst hatching(GO:0001835) hatching(GO:0035188) organism emergence from protective structure(GO:0071684) |
| 0.0 | 0.1 | GO:1902455 | negative regulation of stem cell population maintenance(GO:1902455) |
| 0.0 | 0.3 | GO:0002021 | response to dietary excess(GO:0002021) |
| 0.0 | 0.4 | GO:0070979 | protein K11-linked ubiquitination(GO:0070979) |
| 0.0 | 0.1 | GO:0070200 | establishment of protein localization to telomere(GO:0070200) |
| 0.0 | 0.1 | GO:0002159 | desmosome assembly(GO:0002159) |
| 0.0 | 0.2 | GO:0006108 | malate metabolic process(GO:0006108) |
| 0.0 | 0.3 | GO:0043153 | entrainment of circadian clock by photoperiod(GO:0043153) |
| 0.0 | 0.1 | GO:1903445 | protein transport from ciliary membrane to plasma membrane(GO:1903445) |
| 0.0 | 0.7 | GO:0021762 | substantia nigra development(GO:0021762) |
| 0.0 | 0.2 | GO:0016322 | neuron remodeling(GO:0016322) |
| 0.0 | 0.1 | GO:0035563 | positive regulation of chromatin binding(GO:0035563) |
| 0.0 | 0.5 | GO:0035428 | hexose transmembrane transport(GO:0035428) glucose transmembrane transport(GO:1904659) |
| 0.0 | 0.0 | GO:0042695 | thelarche(GO:0042695) mammary gland branching involved in thelarche(GO:0060744) |
| 0.0 | 0.1 | GO:0043649 | dicarboxylic acid catabolic process(GO:0043649) |
| 0.0 | 0.1 | GO:0034372 | triglyceride-rich lipoprotein particle remodeling(GO:0034370) very-low-density lipoprotein particle remodeling(GO:0034372) |
| 0.0 | 0.2 | GO:1901341 | activation of store-operated calcium channel activity(GO:0032237) positive regulation of store-operated calcium channel activity(GO:1901341) |
| 0.0 | 0.1 | GO:0006172 | ADP biosynthetic process(GO:0006172) purine nucleoside diphosphate biosynthetic process(GO:0009136) purine ribonucleoside diphosphate biosynthetic process(GO:0009180) adenine metabolic process(GO:0046083) |
| 0.0 | 0.3 | GO:0097503 | sialylation(GO:0097503) |
| 0.0 | 0.1 | GO:0031274 | positive regulation of pseudopodium assembly(GO:0031274) |
| 0.0 | 0.2 | GO:2000009 | negative regulation of protein localization to cell surface(GO:2000009) |
| 0.0 | 0.3 | GO:0045747 | positive regulation of Notch signaling pathway(GO:0045747) |
| 0.0 | 0.4 | GO:0035774 | positive regulation of insulin secretion involved in cellular response to glucose stimulus(GO:0035774) |
| 0.0 | 0.2 | GO:0043486 | histone exchange(GO:0043486) |
| 0.0 | 0.1 | GO:0036376 | sodium ion export from cell(GO:0036376) |
| 0.0 | 0.1 | GO:0017004 | cytochrome complex assembly(GO:0017004) |
| 0.0 | 0.1 | GO:0000459 | exonucleolytic trimming involved in rRNA processing(GO:0000459) exonucleolytic trimming to generate mature 3'-end of 5.8S rRNA from tricistronic rRNA transcript (SSU-rRNA, 5.8S rRNA, LSU-rRNA)(GO:0000467) |
| 0.0 | 0.4 | GO:0048663 | neuron fate commitment(GO:0048663) |
| 0.0 | 0.1 | GO:0016127 | cholesterol catabolic process(GO:0006707) sterol catabolic process(GO:0016127) |
| 0.0 | 0.3 | GO:0048268 | clathrin coat assembly(GO:0048268) |
| 0.0 | 0.1 | GO:0045901 | positive regulation of translational elongation(GO:0045901) |
| 0.0 | 0.1 | GO:0018230 | peptidyl-L-cysteine S-palmitoylation(GO:0018230) peptidyl-S-diacylglycerol-L-cysteine biosynthetic process from peptidyl-cysteine(GO:0018231) |
| 0.0 | 0.0 | GO:0060676 | ureteric bud formation(GO:0060676) |
| 0.0 | 0.4 | GO:0060122 | inner ear receptor stereocilium organization(GO:0060122) |
| 0.0 | 0.1 | GO:0097527 | necroptotic signaling pathway(GO:0097527) |
| 0.0 | 0.1 | GO:0070327 | thyroid hormone transport(GO:0070327) |
| 0.0 | 0.2 | GO:0046784 | viral mRNA export from host cell nucleus(GO:0046784) |
| 0.0 | 0.2 | GO:0071625 | vocalization behavior(GO:0071625) |
| 0.0 | 0.2 | GO:0030539 | male genitalia development(GO:0030539) |
| 0.0 | 0.3 | GO:0032968 | positive regulation of transcription elongation from RNA polymerase II promoter(GO:0032968) |
| 0.0 | 0.0 | GO:0051572 | negative regulation of histone H3-K4 methylation(GO:0051572) |
| 0.0 | 0.2 | GO:0050765 | negative regulation of phagocytosis(GO:0050765) |
| 0.0 | 0.1 | GO:1904117 | cellular response to vasopressin(GO:1904117) |
| 0.0 | 0.1 | GO:0050884 | neuromuscular process controlling posture(GO:0050884) |
| 0.0 | 0.1 | GO:0070863 | positive regulation of protein exit from endoplasmic reticulum(GO:0070863) |
| 0.0 | 0.2 | GO:2000651 | positive regulation of sodium ion transmembrane transporter activity(GO:2000651) |
| 0.0 | 0.1 | GO:0035872 | nucleotide-binding domain, leucine rich repeat containing receptor signaling pathway(GO:0035872) |
| 0.0 | 0.1 | GO:0033539 | fatty acid beta-oxidation using acyl-CoA dehydrogenase(GO:0033539) |
| 0.0 | 0.0 | GO:0072363 | regulation of glycolytic process by positive regulation of transcription from RNA polymerase II promoter(GO:0072363) |
| 0.0 | 0.2 | GO:1903846 | positive regulation of transforming growth factor beta receptor signaling pathway(GO:0030511) positive regulation of cellular response to transforming growth factor beta stimulus(GO:1903846) |
| 0.0 | 0.3 | GO:1905145 | acetylcholine receptor signaling pathway(GO:0095500) signal transduction involved in cellular response to ammonium ion(GO:1903831) response to acetylcholine(GO:1905144) cellular response to acetylcholine(GO:1905145) |
| 0.0 | 0.1 | GO:0006868 | glutamine transport(GO:0006868) |
| 0.0 | 0.6 | GO:0050885 | neuromuscular process controlling balance(GO:0050885) |
| 0.0 | 0.1 | GO:0000290 | deadenylation-dependent decapping of nuclear-transcribed mRNA(GO:0000290) |
| 0.0 | 0.1 | GO:0031087 | nuclear-transcribed mRNA catabolic process, deadenylation-independent decay(GO:0031086) deadenylation-independent decapping of nuclear-transcribed mRNA(GO:0031087) |
| 0.0 | 0.1 | GO:0008635 | activation of cysteine-type endopeptidase activity involved in apoptotic process by cytochrome c(GO:0008635) |
| 0.0 | 0.1 | GO:0016255 | attachment of GPI anchor to protein(GO:0016255) |
| 0.0 | 0.1 | GO:0090190 | positive regulation of branching involved in ureteric bud morphogenesis(GO:0090190) |
| 0.0 | 0.1 | GO:0018410 | C-terminal protein amino acid modification(GO:0018410) |
| 0.0 | 0.0 | GO:0032914 | positive regulation of transforming growth factor beta1 production(GO:0032914) |
| 0.0 | 0.1 | GO:1903358 | regulation of Golgi organization(GO:1903358) |
| 0.0 | 0.4 | GO:0010501 | RNA secondary structure unwinding(GO:0010501) |
| 0.0 | 0.0 | GO:0019401 | alditol biosynthetic process(GO:0019401) |
| 0.0 | 0.4 | GO:0060393 | regulation of pathway-restricted SMAD protein phosphorylation(GO:0060393) |
| 0.0 | 0.2 | GO:0006582 | melanin metabolic process(GO:0006582) melanin biosynthetic process(GO:0042438) |
| 0.0 | 0.1 | GO:1990001 | inhibition of cysteine-type endopeptidase activity involved in apoptotic process(GO:1990001) |
| 0.0 | 0.1 | GO:0031163 | iron-sulfur cluster assembly(GO:0016226) metallo-sulfur cluster assembly(GO:0031163) |
| 0.0 | 0.0 | GO:0034441 | plasma lipoprotein particle oxidation(GO:0034441) regulation of lipoprotein oxidation(GO:0034442) negative regulation of lipoprotein oxidation(GO:0034443) |
| 0.0 | 0.1 | GO:0048642 | negative regulation of skeletal muscle tissue development(GO:0048642) |
| 0.0 | 0.1 | GO:0051131 | chaperone-mediated protein complex assembly(GO:0051131) |
| 0.0 | 0.0 | GO:0000448 | cleavage in ITS2 between 5.8S rRNA and LSU-rRNA of tricistronic rRNA transcript (SSU-rRNA, 5.8S rRNA, LSU-rRNA)(GO:0000448) |
| 0.0 | 0.1 | GO:0042407 | cristae formation(GO:0042407) |
| 0.0 | 0.1 | GO:0010572 | positive regulation of platelet activation(GO:0010572) |
| 0.0 | 0.0 | GO:0034983 | peptidyl-lysine deacetylation(GO:0034983) |
| 0.0 | 0.0 | GO:0003419 | growth plate cartilage chondrocyte proliferation(GO:0003419) |
Gene overrepresentation in cellular component category:
| Log-likelihood per target | Total log-likelihood | Term | Description |
|---|---|---|---|
| 1.0 | 4.0 | GO:0031838 | haptoglobin-hemoglobin complex(GO:0031838) |
| 0.6 | 2.8 | GO:0005833 | hemoglobin complex(GO:0005833) |
| 0.5 | 5.6 | GO:0034663 | endoplasmic reticulum chaperone complex(GO:0034663) |
| 0.3 | 24.3 | GO:0000786 | nucleosome(GO:0000786) |
| 0.3 | 1.7 | GO:0005785 | signal recognition particle receptor complex(GO:0005785) |
| 0.3 | 0.8 | GO:1990037 | Lewy body core(GO:1990037) |
| 0.2 | 1.1 | GO:0035976 | AP1 complex(GO:0035976) |
| 0.2 | 0.6 | GO:0016533 | cyclin-dependent protein kinase 5 holoenzyme complex(GO:0016533) |
| 0.2 | 0.5 | GO:0034457 | Mpp10 complex(GO:0034457) |
| 0.1 | 0.9 | GO:0032133 | chromosome passenger complex(GO:0032133) |
| 0.1 | 0.1 | GO:0032398 | MHC class Ib protein complex(GO:0032398) |
| 0.1 | 0.6 | GO:0033018 | sarcoplasmic reticulum lumen(GO:0033018) |
| 0.1 | 0.7 | GO:0071256 | Sec61 translocon complex(GO:0005784) translocon complex(GO:0071256) |
| 0.1 | 0.7 | GO:1903349 | omegasome membrane(GO:1903349) omegasome(GO:1990462) |
| 0.1 | 0.3 | GO:0099524 | region of cytosol(GO:0099522) postsynaptic cytosol(GO:0099524) |
| 0.1 | 1.8 | GO:0042612 | MHC class I protein complex(GO:0042612) |
| 0.1 | 0.3 | GO:0043159 | acrosomal matrix(GO:0043159) |
| 0.1 | 0.7 | GO:0016602 | CCAAT-binding factor complex(GO:0016602) |
| 0.1 | 0.5 | GO:0005947 | mitochondrial alpha-ketoglutarate dehydrogenase complex(GO:0005947) |
| 0.1 | 0.7 | GO:0042382 | paraspeckles(GO:0042382) |
| 0.1 | 0.2 | GO:0042585 | germinal vesicle(GO:0042585) |
| 0.1 | 0.3 | GO:0005962 | mitochondrial isocitrate dehydrogenase complex (NAD+)(GO:0005962) isocitrate dehydrogenase complex (NAD+)(GO:0045242) |
| 0.1 | 1.7 | GO:0019028 | viral nucleocapsid(GO:0019013) viral capsid(GO:0019028) |
| 0.1 | 0.3 | GO:0097149 | centralspindlin complex(GO:0097149) |
| 0.1 | 1.0 | GO:0001939 | female pronucleus(GO:0001939) |
| 0.1 | 0.2 | GO:0070821 | azurophil granule membrane(GO:0035577) tertiary granule membrane(GO:0070821) |
| 0.1 | 1.0 | GO:0000276 | mitochondrial proton-transporting ATP synthase complex, coupling factor F(o)(GO:0000276) |
| 0.1 | 1.5 | GO:0005680 | anaphase-promoting complex(GO:0005680) |
| 0.1 | 0.4 | GO:0033588 | Elongator holoenzyme complex(GO:0033588) |
| 0.1 | 0.2 | GO:1990836 | integral component of vacuolar membrane(GO:0031166) intrinsic component of vacuolar membrane(GO:0031310) lysosomal matrix(GO:1990836) |
| 0.1 | 0.7 | GO:0005744 | mitochondrial inner membrane presequence translocase complex(GO:0005744) |
| 0.1 | 0.3 | GO:0036398 | TCR signalosome(GO:0036398) |
| 0.1 | 0.8 | GO:0002199 | zona pellucida receptor complex(GO:0002199) |
| 0.1 | 0.1 | GO:1990357 | terminal web(GO:1990357) |
| 0.1 | 0.4 | GO:0097255 | R2TP complex(GO:0097255) |
| 0.1 | 0.3 | GO:0034751 | aryl hydrocarbon receptor complex(GO:0034751) |
| 0.1 | 0.3 | GO:0009330 | DNA topoisomerase complex (ATP-hydrolyzing)(GO:0009330) |
| 0.1 | 0.2 | GO:0031095 | platelet dense tubular network membrane(GO:0031095) |
| 0.1 | 0.6 | GO:0042587 | glycogen granule(GO:0042587) |
| 0.1 | 0.2 | GO:0005713 | chiasma(GO:0005712) recombination nodule(GO:0005713) |
| 0.1 | 1.5 | GO:0005719 | nuclear euchromatin(GO:0005719) |
| 0.1 | 0.5 | GO:0005577 | fibrinogen complex(GO:0005577) |
| 0.1 | 0.1 | GO:0031205 | endoplasmic reticulum Sec complex(GO:0031205) |
| 0.1 | 0.2 | GO:0005656 | nuclear pre-replicative complex(GO:0005656) pre-replicative complex(GO:0036387) |
| 0.1 | 0.5 | GO:0005952 | cAMP-dependent protein kinase complex(GO:0005952) |
| 0.1 | 0.2 | GO:0072379 | BAT3 complex(GO:0071818) ER membrane insertion complex(GO:0072379) |
| 0.1 | 0.5 | GO:0031390 | Ctf18 RFC-like complex(GO:0031390) |
| 0.1 | 0.2 | GO:0034715 | pICln-Sm protein complex(GO:0034715) |
| 0.1 | 0.4 | GO:0071986 | Ragulator complex(GO:0071986) |
| 0.1 | 0.2 | GO:0070557 | PCNA-p21 complex(GO:0070557) |
| 0.1 | 0.3 | GO:0070044 | synaptobrevin 2-SNAP-25-syntaxin-1a complex(GO:0070044) |
| 0.1 | 0.2 | GO:0014801 | longitudinal sarcoplasmic reticulum(GO:0014801) |
| 0.1 | 0.7 | GO:0071565 | nBAF complex(GO:0071565) |
| 0.1 | 0.2 | GO:0034657 | GID complex(GO:0034657) |
| 0.0 | 0.4 | GO:0072669 | tRNA-splicing ligase complex(GO:0072669) |
| 0.0 | 0.0 | GO:1990826 | nucleoplasmic periphery of the nuclear pore complex(GO:1990826) |
| 0.0 | 0.4 | GO:0017059 | serine C-palmitoyltransferase complex(GO:0017059) endoplasmic reticulum palmitoyltransferase complex(GO:0031211) |
| 0.0 | 0.6 | GO:0042613 | MHC class II protein complex(GO:0042613) |
| 0.0 | 0.2 | GO:0097452 | GAIT complex(GO:0097452) |
| 0.0 | 0.3 | GO:0048237 | rough endoplasmic reticulum lumen(GO:0048237) |
| 0.0 | 0.6 | GO:0017101 | aminoacyl-tRNA synthetase multienzyme complex(GO:0017101) |
| 0.0 | 0.3 | GO:0005787 | signal peptidase complex(GO:0005787) |
| 0.0 | 0.6 | GO:0000940 | condensed chromosome outer kinetochore(GO:0000940) |
| 0.0 | 0.3 | GO:0016461 | unconventional myosin complex(GO:0016461) |
| 0.0 | 0.1 | GO:0033186 | CAF-1 complex(GO:0033186) |
| 0.0 | 0.4 | GO:0008541 | proteasome regulatory particle, lid subcomplex(GO:0008541) |
| 0.0 | 0.3 | GO:0000275 | mitochondrial proton-transporting ATP synthase complex, catalytic core F(1)(GO:0000275) proton-transporting ATP synthase complex, catalytic core F(1)(GO:0045261) |
| 0.0 | 0.3 | GO:0005818 | astral microtubule(GO:0000235) aster(GO:0005818) |
| 0.0 | 0.6 | GO:0030061 | mitochondrial crista(GO:0030061) |
| 0.0 | 0.5 | GO:0032593 | insulin-responsive compartment(GO:0032593) |
| 0.0 | 0.6 | GO:0005782 | peroxisomal matrix(GO:0005782) microbody lumen(GO:0031907) |
| 0.0 | 0.3 | GO:0042824 | MHC class I peptide loading complex(GO:0042824) |
| 0.0 | 0.3 | GO:0070449 | elongin complex(GO:0070449) |
| 0.0 | 0.3 | GO:1990316 | ATG1/ULK1 kinase complex(GO:1990316) |
| 0.0 | 0.1 | GO:0002178 | palmitoyltransferase complex(GO:0002178) |
| 0.0 | 0.6 | GO:0008250 | oligosaccharyltransferase complex(GO:0008250) |
| 0.0 | 0.4 | GO:0008540 | proteasome regulatory particle, base subcomplex(GO:0008540) |
| 0.0 | 0.4 | GO:0030008 | TRAPP complex(GO:0030008) |
| 0.0 | 0.2 | GO:0045098 | type III intermediate filament(GO:0045098) |
| 0.0 | 0.2 | GO:0000015 | phosphopyruvate hydratase complex(GO:0000015) |
| 0.0 | 0.4 | GO:0045120 | pronucleus(GO:0045120) |
| 0.0 | 0.3 | GO:0033256 | I-kappaB/NF-kappaB complex(GO:0033256) |
| 0.0 | 0.2 | GO:0031466 | Cul5-RING ubiquitin ligase complex(GO:0031466) |
| 0.0 | 0.2 | GO:0005642 | annulate lamellae(GO:0005642) |
| 0.0 | 0.3 | GO:0005688 | U6 snRNP(GO:0005688) |
| 0.0 | 0.2 | GO:0071203 | WASH complex(GO:0071203) |
| 0.0 | 0.2 | GO:0033093 | Weibel-Palade body(GO:0033093) |
| 0.0 | 0.2 | GO:0070552 | BRISC complex(GO:0070552) |
| 0.0 | 0.1 | GO:0000322 | storage vacuole(GO:0000322) |
| 0.0 | 0.3 | GO:0097227 | septin complex(GO:0031105) sperm annulus(GO:0097227) |
| 0.0 | 0.5 | GO:0005883 | neurofilament(GO:0005883) |
| 0.0 | 0.1 | GO:0032937 | SREBP-SCAP-Insig complex(GO:0032937) |
| 0.0 | 0.1 | GO:0097196 | Shu complex(GO:0097196) |
| 0.0 | 0.1 | GO:0030062 | mitochondrial tricarboxylic acid cycle enzyme complex(GO:0030062) |
| 0.0 | 0.4 | GO:0012510 | trans-Golgi network transport vesicle membrane(GO:0012510) |
| 0.0 | 0.2 | GO:0042105 | alpha-beta T cell receptor complex(GO:0042105) |
| 0.0 | 0.5 | GO:0010369 | chromocenter(GO:0010369) |
| 0.0 | 0.1 | GO:0031262 | Ndc80 complex(GO:0031262) |
| 0.0 | 0.1 | GO:0031314 | extrinsic component of mitochondrial inner membrane(GO:0031314) |
| 0.0 | 0.1 | GO:0071664 | catenin-TCF7L2 complex(GO:0071664) |
| 0.0 | 0.2 | GO:0033010 | paranodal junction(GO:0033010) |
| 0.0 | 0.1 | GO:1990730 | VCP-NSFL1C complex(GO:1990730) |
| 0.0 | 0.0 | GO:0020018 | ciliary pocket(GO:0020016) ciliary pocket membrane(GO:0020018) |
| 0.0 | 0.3 | GO:0097433 | dense body(GO:0097433) |
| 0.0 | 0.2 | GO:0071204 | histone pre-mRNA 3'end processing complex(GO:0071204) |
| 0.0 | 0.2 | GO:0071598 | neuronal ribonucleoprotein granule(GO:0071598) |
| 0.0 | 0.7 | GO:0097225 | sperm midpiece(GO:0097225) |
| 0.0 | 0.1 | GO:0071797 | LUBAC complex(GO:0071797) |
| 0.0 | 0.3 | GO:0072357 | PTW/PP1 phosphatase complex(GO:0072357) |
| 0.0 | 0.2 | GO:0065010 | extracellular membrane-bounded organelle(GO:0065010) |
| 0.0 | 0.3 | GO:0005641 | nuclear envelope lumen(GO:0005641) |
| 0.0 | 0.1 | GO:0005687 | U4 snRNP(GO:0005687) |
| 0.0 | 0.1 | GO:0030906 | retromer, cargo-selective complex(GO:0030906) |
| 0.0 | 0.2 | GO:0030289 | protein phosphatase 4 complex(GO:0030289) |
| 0.0 | 0.2 | GO:1990075 | periciliary membrane compartment(GO:1990075) |
| 0.0 | 0.1 | GO:0071008 | U2-type post-mRNA release spliceosomal complex(GO:0071008) |
| 0.0 | 0.1 | GO:0000444 | MIS12/MIND type complex(GO:0000444) |
| 0.0 | 0.1 | GO:0032585 | multivesicular body membrane(GO:0032585) |
| 0.0 | 0.1 | GO:0044326 | dendritic spine neck(GO:0044326) |
| 0.0 | 0.4 | GO:0005751 | mitochondrial respiratory chain complex IV(GO:0005751) |
| 0.0 | 0.2 | GO:0030877 | beta-catenin destruction complex(GO:0030877) |
| 0.0 | 0.4 | GO:0030140 | trans-Golgi network transport vesicle(GO:0030140) |
| 0.0 | 0.1 | GO:0000138 | Golgi trans cisterna(GO:0000138) |
| 0.0 | 0.2 | GO:0005583 | fibrillar collagen trimer(GO:0005583) banded collagen fibril(GO:0098643) |
| 0.0 | 0.1 | GO:0036128 | CatSper complex(GO:0036128) |
| 0.0 | 0.3 | GO:0031258 | lamellipodium membrane(GO:0031258) |
| 0.0 | 0.1 | GO:0071942 | XPC complex(GO:0071942) |
| 0.0 | 0.6 | GO:0031305 | intrinsic component of mitochondrial inner membrane(GO:0031304) integral component of mitochondrial inner membrane(GO:0031305) |
| 0.0 | 0.4 | GO:0090545 | NuRD complex(GO:0016581) CHD-type complex(GO:0090545) |
| 0.0 | 0.2 | GO:0097197 | tetraspanin-enriched microdomain(GO:0097197) |
| 0.0 | 0.1 | GO:0035061 | interchromatin granule(GO:0035061) |
| 0.0 | 0.1 | GO:0043293 | apoptosome(GO:0043293) |
| 0.0 | 0.5 | GO:0005839 | proteasome core complex(GO:0005839) |
| 0.0 | 0.2 | GO:0033180 | proton-transporting V-type ATPase, V1 domain(GO:0033180) |
| 0.0 | 0.9 | GO:0045271 | mitochondrial respiratory chain complex I(GO:0005747) NADH dehydrogenase complex(GO:0030964) respiratory chain complex I(GO:0045271) |
| 0.0 | 0.4 | GO:0030663 | COPI-coated vesicle membrane(GO:0030663) |
| 0.0 | 0.3 | GO:0005732 | small nucleolar ribonucleoprotein complex(GO:0005732) |
| 0.0 | 2.0 | GO:0005884 | actin filament(GO:0005884) |
| 0.0 | 0.8 | GO:0031228 | integral component of Golgi membrane(GO:0030173) intrinsic component of Golgi membrane(GO:0031228) |
| 0.0 | 0.1 | GO:0005742 | mitochondrial outer membrane translocase complex(GO:0005742) |
| 0.0 | 0.1 | GO:0033269 | internode region of axon(GO:0033269) |
| 0.0 | 0.4 | GO:0070469 | respiratory chain(GO:0070469) |
| 0.0 | 0.3 | GO:0005666 | DNA-directed RNA polymerase III complex(GO:0005666) |
| 0.0 | 2.8 | GO:0043209 | myelin sheath(GO:0043209) |
| 0.0 | 0.1 | GO:0070765 | gamma-secretase complex(GO:0070765) |
| 0.0 | 0.3 | GO:0097038 | perinuclear endoplasmic reticulum(GO:0097038) |
| 0.0 | 0.1 | GO:0000974 | Prp19 complex(GO:0000974) |
| 0.0 | 0.2 | GO:0031464 | Cul4A-RING E3 ubiquitin ligase complex(GO:0031464) |
| 0.0 | 0.4 | GO:0000314 | organellar small ribosomal subunit(GO:0000314) mitochondrial small ribosomal subunit(GO:0005763) |
| 0.0 | 1.4 | GO:0072562 | blood microparticle(GO:0072562) |
| 0.0 | 0.1 | GO:0042406 | extrinsic component of endoplasmic reticulum membrane(GO:0042406) |
| 0.0 | 0.1 | GO:0016282 | eukaryotic 43S preinitiation complex(GO:0016282) eukaryotic 48S preinitiation complex(GO:0033290) eukaryotic translation initiation factor 3 complex, eIF3m(GO:0071541) |
| 0.0 | 0.0 | GO:0032807 | DNA ligase IV complex(GO:0032807) |
| 0.0 | 0.2 | GO:0032541 | cortical endoplasmic reticulum(GO:0032541) |
| 0.0 | 0.1 | GO:0030915 | Smc5-Smc6 complex(GO:0030915) |
| 0.0 | 0.2 | GO:0034385 | very-low-density lipoprotein particle(GO:0034361) triglyceride-rich lipoprotein particle(GO:0034385) |
| 0.0 | 0.3 | GO:0042629 | mast cell granule(GO:0042629) |
| 0.0 | 1.3 | GO:0022625 | cytosolic large ribosomal subunit(GO:0022625) |
| 0.0 | 0.0 | GO:0031092 | platelet alpha granule membrane(GO:0031092) |
| 0.0 | 0.1 | GO:0034709 | methylosome(GO:0034709) |
| 0.0 | 0.1 | GO:0031618 | nuclear pericentric heterochromatin(GO:0031618) |
| 0.0 | 0.3 | GO:0005640 | nuclear outer membrane(GO:0005640) |
| 0.0 | 0.1 | GO:0042765 | GPI-anchor transamidase complex(GO:0042765) |
| 0.0 | 0.7 | GO:0022627 | cytosolic small ribosomal subunit(GO:0022627) |
| 0.0 | 0.1 | GO:0097550 | transcriptional preinitiation complex(GO:0097550) |
| 0.0 | 0.0 | GO:0061574 | ASAP complex(GO:0061574) |
| 0.0 | 0.1 | GO:0005861 | troponin complex(GO:0005861) |
| 0.0 | 0.0 | GO:0090498 | extrinsic component of Golgi membrane(GO:0090498) |
| 0.0 | 0.5 | GO:0005881 | cytoplasmic microtubule(GO:0005881) |
| 0.0 | 0.1 | GO:0044754 | autolysosome(GO:0044754) |
| 0.0 | 0.1 | GO:0071546 | pi-body(GO:0071546) |
| 0.0 | 0.1 | GO:0060091 | kinocilium(GO:0060091) |
| 0.0 | 0.1 | GO:0016272 | prefoldin complex(GO:0016272) |
Gene overrepresentation in molecular function category:
| Log-likelihood per target | Total log-likelihood | Term | Description |
|---|---|---|---|
| 1.3 | 4.0 | GO:0031720 | haptoglobin binding(GO:0031720) |
| 0.4 | 1.3 | GO:0031249 | denatured protein binding(GO:0031249) |
| 0.3 | 2.8 | GO:0005344 | oxygen transporter activity(GO:0005344) |
| 0.3 | 1.3 | GO:0004169 | dolichyl-phosphate-mannose-protein mannosyltransferase activity(GO:0004169) |
| 0.2 | 1.4 | GO:0098519 | nucleotide phosphatase activity, acting on free nucleotides(GO:0098519) |
| 0.2 | 1.9 | GO:0008430 | selenium binding(GO:0008430) |
| 0.2 | 0.9 | GO:0044378 | non-sequence-specific DNA binding, bending(GO:0044378) |
| 0.2 | 0.8 | GO:0004656 | procollagen-proline 4-dioxygenase activity(GO:0004656) |
| 0.2 | 0.7 | GO:0003839 | gamma-glutamylcyclotransferase activity(GO:0003839) |
| 0.2 | 0.6 | GO:0031750 | D3 dopamine receptor binding(GO:0031750) |
| 0.2 | 0.8 | GO:0004337 | dimethylallyltranstransferase activity(GO:0004161) geranyltranstransferase activity(GO:0004337) |
| 0.2 | 0.6 | GO:0004165 | dodecenoyl-CoA delta-isomerase activity(GO:0004165) |
| 0.2 | 0.5 | GO:0008330 | protein tyrosine/threonine phosphatase activity(GO:0008330) |
| 0.2 | 0.9 | GO:0004340 | glucokinase activity(GO:0004340) hexokinase activity(GO:0004396) fructokinase activity(GO:0008865) mannokinase activity(GO:0019158) |
| 0.1 | 1.3 | GO:0055056 | D-glucose transmembrane transporter activity(GO:0055056) |
| 0.1 | 0.6 | GO:0061575 | cyclin-dependent protein serine/threonine kinase activator activity(GO:0061575) |
| 0.1 | 1.9 | GO:0004861 | cyclin-dependent protein serine/threonine kinase inhibitor activity(GO:0004861) |
| 0.1 | 1.9 | GO:0043522 | leucine zipper domain binding(GO:0043522) |
| 0.1 | 0.5 | GO:0004691 | cAMP-dependent protein kinase activity(GO:0004691) |
| 0.1 | 0.4 | GO:0016509 | long-chain-3-hydroxyacyl-CoA dehydrogenase activity(GO:0016509) |
| 0.1 | 0.4 | GO:0030156 | benzodiazepine receptor binding(GO:0030156) |
| 0.1 | 0.5 | GO:0061665 | SUMO ligase activity(GO:0061665) |
| 0.1 | 0.8 | GO:0019238 | cyclohydrolase activity(GO:0019238) |
| 0.1 | 0.5 | GO:0004814 | arginine-tRNA ligase activity(GO:0004814) |
| 0.1 | 0.2 | GO:0042903 | tubulin deacetylase activity(GO:0042903) |
| 0.1 | 0.5 | GO:0004416 | hydroxyacylglutathione hydrolase activity(GO:0004416) |
| 0.1 | 1.2 | GO:0035174 | histone serine kinase activity(GO:0035174) |
| 0.1 | 0.3 | GO:0005483 | soluble NSF attachment protein activity(GO:0005483) |
| 0.1 | 0.7 | GO:0045340 | mercury ion binding(GO:0045340) |
| 0.1 | 0.3 | GO:0018479 | benzaldehyde dehydrogenase (NAD+) activity(GO:0018479) |
| 0.1 | 0.4 | GO:0042806 | fucose binding(GO:0042806) |
| 0.1 | 0.3 | GO:0004311 | farnesyltranstransferase activity(GO:0004311) |
| 0.1 | 0.4 | GO:0001733 | galactosylceramide sulfotransferase activity(GO:0001733) |
| 0.1 | 0.3 | GO:0008142 | oxysterol binding(GO:0008142) |
| 0.1 | 0.5 | GO:1990829 | C-rich single-stranded DNA binding(GO:1990829) |
| 0.1 | 3.0 | GO:0031492 | nucleosomal DNA binding(GO:0031492) |
| 0.1 | 0.6 | GO:0046790 | virion binding(GO:0046790) |
| 0.1 | 0.3 | GO:0008948 | oxaloacetate decarboxylase activity(GO:0008948) hydrolase activity, acting on acid carbon-carbon bonds(GO:0016822) hydrolase activity, acting on acid carbon-carbon bonds, in ketonic substances(GO:0016823) |
| 0.1 | 0.3 | GO:0015165 | pyrimidine nucleotide-sugar transmembrane transporter activity(GO:0015165) |
| 0.1 | 0.3 | GO:0036004 | GAF domain binding(GO:0036004) |
| 0.1 | 0.3 | GO:0016453 | C-acetyltransferase activity(GO:0016453) |
| 0.1 | 0.3 | GO:0017089 | glycolipid transporter activity(GO:0017089) |
| 0.1 | 0.2 | GO:0004768 | stearoyl-CoA 9-desaturase activity(GO:0004768) |
| 0.1 | 0.3 | GO:0070815 | peptidyl-lysine 5-dioxygenase activity(GO:0070815) |
| 0.1 | 0.3 | GO:1990715 | mRNA CDS binding(GO:1990715) |
| 0.1 | 0.4 | GO:0016454 | serine C-palmitoyltransferase activity(GO:0004758) C-palmitoyltransferase activity(GO:0016454) |
| 0.1 | 1.6 | GO:0046933 | proton-transporting ATP synthase activity, rotational mechanism(GO:0046933) |
| 0.1 | 0.4 | GO:0050833 | pyruvate transmembrane transporter activity(GO:0050833) |
| 0.1 | 0.5 | GO:0048030 | disaccharide binding(GO:0048030) |
| 0.1 | 1.1 | GO:0051787 | misfolded protein binding(GO:0051787) |
| 0.1 | 0.3 | GO:0046538 | bisphosphoglycerate mutase activity(GO:0004082) phosphoglycerate mutase activity(GO:0004619) 2,3-bisphosphoglycerate-dependent phosphoglycerate mutase activity(GO:0046538) |
| 0.1 | 0.2 | GO:0044715 | 8-oxo-dGDP phosphatase activity(GO:0044715) |
| 0.1 | 0.2 | GO:0004792 | thiosulfate sulfurtransferase activity(GO:0004792) |
| 0.1 | 0.3 | GO:0050816 | phosphothreonine binding(GO:0050816) |
| 0.1 | 0.3 | GO:1990932 | 5.8S rRNA binding(GO:1990932) |
| 0.1 | 0.3 | GO:0004449 | isocitrate dehydrogenase (NAD+) activity(GO:0004449) |
| 0.1 | 0.6 | GO:0015266 | protein channel activity(GO:0015266) |
| 0.1 | 0.3 | GO:0003918 | DNA topoisomerase type II (ATP-hydrolyzing) activity(GO:0003918) DNA topoisomerase II activity(GO:0061505) |
| 0.1 | 0.5 | GO:0000268 | peroxisome targeting sequence binding(GO:0000268) |
| 0.1 | 0.2 | GO:0032810 | sterol response element binding(GO:0032810) |
| 0.1 | 0.4 | GO:0051434 | BH3 domain binding(GO:0051434) |
| 0.1 | 0.8 | GO:0005528 | macrolide binding(GO:0005527) FK506 binding(GO:0005528) |
| 0.1 | 0.8 | GO:0017017 | MAP kinase tyrosine/serine/threonine phosphatase activity(GO:0017017) |
| 0.1 | 0.2 | GO:0035614 | snRNA stem-loop binding(GO:0035614) |
| 0.1 | 0.2 | GO:0004167 | dopachrome isomerase activity(GO:0004167) |
| 0.1 | 0.2 | GO:0003988 | acetyl-CoA C-acyltransferase activity(GO:0003988) |
| 0.1 | 0.3 | GO:0010997 | anaphase-promoting complex binding(GO:0010997) |
| 0.1 | 0.2 | GO:0016863 | intramolecular oxidoreductase activity, transposing C=C bonds(GO:0016863) |
| 0.1 | 0.9 | GO:0070628 | proteasome binding(GO:0070628) |
| 0.1 | 0.2 | GO:0016717 | oxidoreductase activity, acting on paired donors, with oxidation of a pair of donors resulting in the reduction of molecular oxygen to two molecules of water(GO:0016717) |
| 0.1 | 1.4 | GO:0071837 | HMG box domain binding(GO:0071837) |
| 0.1 | 2.4 | GO:0070888 | E-box binding(GO:0070888) |
| 0.1 | 0.2 | GO:0008511 | sodium:potassium:chloride symporter activity(GO:0008511) |
| 0.1 | 0.2 | GO:0030337 | DNA polymerase processivity factor activity(GO:0030337) |
| 0.1 | 0.3 | GO:0004726 | non-membrane spanning protein tyrosine phosphatase activity(GO:0004726) |
| 0.1 | 2.0 | GO:0042605 | peptide antigen binding(GO:0042605) |
| 0.1 | 0.3 | GO:0035473 | lipase binding(GO:0035473) |
| 0.0 | 0.5 | GO:0003689 | DNA clamp loader activity(GO:0003689) protein-DNA loading ATPase activity(GO:0033170) |
| 0.0 | 0.1 | GO:0036468 | aromatic-L-amino-acid decarboxylase activity(GO:0004058) L-dopa decarboxylase activity(GO:0036468) |
| 0.0 | 0.2 | GO:0015057 | thrombin receptor activity(GO:0015057) |
| 0.0 | 0.1 | GO:0008073 | ornithine decarboxylase inhibitor activity(GO:0008073) |
| 0.0 | 0.7 | GO:0004551 | nucleotide diphosphatase activity(GO:0004551) |
| 0.0 | 0.1 | GO:0004735 | pyrroline-5-carboxylate reductase activity(GO:0004735) |
| 0.0 | 0.3 | GO:0070728 | leucine binding(GO:0070728) |
| 0.0 | 0.6 | GO:0015037 | peptide disulfide oxidoreductase activity(GO:0015037) |
| 0.0 | 0.2 | GO:0055131 | C3HC4-type RING finger domain binding(GO:0055131) |
| 0.0 | 0.3 | GO:1904264 | ubiquitin protein ligase activity involved in ERAD pathway(GO:1904264) |
| 0.0 | 0.1 | GO:0031493 | nucleosomal histone binding(GO:0031493) |
| 0.0 | 0.2 | GO:0070404 | NADH binding(GO:0070404) |
| 0.0 | 0.2 | GO:0044183 | protein binding involved in protein folding(GO:0044183) |
| 0.0 | 0.1 | GO:0071886 | 1-(4-iodo-2,5-dimethoxyphenyl)propan-2-amine binding(GO:0071886) |
| 0.0 | 0.2 | GO:0004145 | diamine N-acetyltransferase activity(GO:0004145) |
| 0.0 | 1.3 | GO:0009055 | electron carrier activity(GO:0009055) |
| 0.0 | 0.1 | GO:0005338 | nucleotide-sugar transmembrane transporter activity(GO:0005338) |
| 0.0 | 0.2 | GO:0004969 | histamine receptor activity(GO:0004969) |
| 0.0 | 0.2 | GO:0033743 | peptide-methionine (R)-S-oxide reductase activity(GO:0033743) |
| 0.0 | 0.1 | GO:0031871 | proteinase activated receptor binding(GO:0031871) |
| 0.0 | 0.1 | GO:0031997 | N-terminal myristoylation domain binding(GO:0031997) calcium ion binding involved in regulation of postsynaptic cytosolic calcium ion concentration(GO:0099567) |
| 0.0 | 1.0 | GO:0004129 | cytochrome-c oxidase activity(GO:0004129) heme-copper terminal oxidase activity(GO:0015002) oxidoreductase activity, acting on a heme group of donors, oxygen as acceptor(GO:0016676) |
| 0.0 | 1.3 | GO:0050699 | WW domain binding(GO:0050699) |
| 0.0 | 0.1 | GO:0030984 | kininogen binding(GO:0030984) |
| 0.0 | 0.3 | GO:0030235 | nitric-oxide synthase regulator activity(GO:0030235) |
| 0.0 | 0.2 | GO:0048019 | receptor antagonist activity(GO:0048019) |
| 0.0 | 3.0 | GO:0051082 | unfolded protein binding(GO:0051082) |
| 0.0 | 0.2 | GO:0051575 | 5'-deoxyribose-5-phosphate lyase activity(GO:0051575) |
| 0.0 | 0.2 | GO:1990254 | keratin filament binding(GO:1990254) |
| 0.0 | 0.3 | GO:0017070 | U6 snRNA binding(GO:0017070) |
| 0.0 | 0.1 | GO:0031762 | follicle-stimulating hormone receptor binding(GO:0031762) |
| 0.0 | 0.3 | GO:0004111 | creatine kinase activity(GO:0004111) |
| 0.0 | 0.4 | GO:0032041 | histone deacetylase activity (H3-K14 specific)(GO:0031078) NAD-dependent histone deacetylase activity (H3-K14 specific)(GO:0032041) |
| 0.0 | 0.2 | GO:0004634 | phosphopyruvate hydratase activity(GO:0004634) |
| 0.0 | 0.1 | GO:0005146 | leukemia inhibitory factor receptor binding(GO:0005146) |
| 0.0 | 1.9 | GO:0051087 | chaperone binding(GO:0051087) |
| 0.0 | 0.1 | GO:0017077 | oxidative phosphorylation uncoupler activity(GO:0017077) |
| 0.0 | 0.2 | GO:0097371 | MDM2/MDM4 family protein binding(GO:0097371) |
| 0.0 | 1.4 | GO:0001105 | RNA polymerase II transcription coactivator activity(GO:0001105) |
| 0.0 | 0.2 | GO:0016774 | phosphotransferase activity, carboxyl group as acceptor(GO:0016774) |
| 0.0 | 0.3 | GO:0019198 | transmembrane receptor protein tyrosine phosphatase activity(GO:0005001) transmembrane receptor protein phosphatase activity(GO:0019198) |
| 0.0 | 0.9 | GO:0071889 | 14-3-3 protein binding(GO:0071889) |
| 0.0 | 0.3 | GO:0098505 | G-rich strand telomeric DNA binding(GO:0098505) |
| 0.0 | 0.2 | GO:0048039 | ubiquinone binding(GO:0048039) |
| 0.0 | 0.0 | GO:0099609 | microtubule lateral binding(GO:0099609) |
| 0.0 | 0.1 | GO:1990381 | ubiquitin-specific protease binding(GO:1990381) |
| 0.0 | 0.0 | GO:0016492 | G-protein coupled neurotensin receptor activity(GO:0016492) |
| 0.0 | 0.4 | GO:0004576 | oligosaccharyl transferase activity(GO:0004576) dolichyl-diphosphooligosaccharide-protein glycotransferase activity(GO:0004579) |
| 0.0 | 0.1 | GO:0070976 | calcium-independent protein kinase C activity(GO:0004699) TIR domain binding(GO:0070976) |
| 0.0 | 0.3 | GO:0030275 | LRR domain binding(GO:0030275) |
| 0.0 | 0.2 | GO:0008312 | 7S RNA binding(GO:0008312) |
| 0.0 | 0.1 | GO:0032795 | heterotrimeric G-protein binding(GO:0032795) |
| 0.0 | 0.3 | GO:0032050 | clathrin heavy chain binding(GO:0032050) |
| 0.0 | 0.2 | GO:0097157 | pre-mRNA intronic binding(GO:0097157) |
| 0.0 | 0.2 | GO:0001094 | TFIID-class transcription factor binding(GO:0001094) |
| 0.0 | 0.2 | GO:0035251 | UDP-glucosyltransferase activity(GO:0035251) |
| 0.0 | 1.2 | GO:0000980 | RNA polymerase II distal enhancer sequence-specific DNA binding(GO:0000980) |
| 0.0 | 0.5 | GO:0048018 | receptor agonist activity(GO:0048018) |
| 0.0 | 16.4 | GO:0046982 | protein heterodimerization activity(GO:0046982) |
| 0.0 | 0.3 | GO:0003841 | 1-acylglycerol-3-phosphate O-acyltransferase activity(GO:0003841) |
| 0.0 | 0.1 | GO:0030060 | L-malate dehydrogenase activity(GO:0030060) |
| 0.0 | 0.8 | GO:0005520 | insulin-like growth factor binding(GO:0005520) |
| 0.0 | 0.1 | GO:0004813 | alanine-tRNA ligase activity(GO:0004813) |
| 0.0 | 0.1 | GO:0008396 | oxysterol 7-alpha-hydroxylase activity(GO:0008396) |
| 0.0 | 0.2 | GO:0019855 | calcium channel inhibitor activity(GO:0019855) |
| 0.0 | 0.7 | GO:0043539 | protein serine/threonine kinase activator activity(GO:0043539) |
| 0.0 | 0.2 | GO:0015651 | quaternary ammonium group transmembrane transporter activity(GO:0015651) |
| 0.0 | 0.3 | GO:0005537 | mannose binding(GO:0005537) |
| 0.0 | 0.2 | GO:0001163 | RNA polymerase I regulatory region DNA binding(GO:0001013) RNA polymerase I regulatory region sequence-specific DNA binding(GO:0001163) RNA polymerase I CORE element sequence-specific DNA binding(GO:0001164) |
| 0.0 | 0.1 | GO:0031752 | D5 dopamine receptor binding(GO:0031752) |
| 0.0 | 0.1 | GO:0003680 | AT DNA binding(GO:0003680) |
| 0.0 | 0.1 | GO:0019788 | NEDD8 transferase activity(GO:0019788) |
| 0.0 | 0.1 | GO:0016882 | cyclo-ligase activity(GO:0016882) |
| 0.0 | 1.4 | GO:0019003 | GDP binding(GO:0019003) |
| 0.0 | 0.1 | GO:0034186 | apolipoprotein A-I binding(GO:0034186) |
| 0.0 | 0.1 | GO:0016724 | ferroxidase activity(GO:0004322) oxidoreductase activity, oxidizing metal ions, oxygen as acceptor(GO:0016724) |
| 0.0 | 0.3 | GO:0030550 | acetylcholine receptor inhibitor activity(GO:0030550) |
| 0.0 | 0.0 | GO:1990599 | 3' overhang single-stranded DNA endodeoxyribonuclease activity(GO:1990599) |
| 0.0 | 0.0 | GO:0005087 | Ran guanyl-nucleotide exchange factor activity(GO:0005087) |
| 0.0 | 0.8 | GO:0008138 | protein tyrosine/serine/threonine phosphatase activity(GO:0008138) |
| 0.0 | 0.2 | GO:0004659 | prenyltransferase activity(GO:0004659) |
| 0.0 | 0.1 | GO:0080130 | L-aspartate:2-oxoglutarate aminotransferase activity(GO:0004069) L-phenylalanine:2-oxoglutarate aminotransferase activity(GO:0080130) |
| 0.0 | 0.2 | GO:0097109 | neuroligin family protein binding(GO:0097109) |
| 0.0 | 0.1 | GO:0003941 | L-serine ammonia-lyase activity(GO:0003941) |
| 0.0 | 0.7 | GO:0030742 | GTP-dependent protein binding(GO:0030742) |
| 0.0 | 0.2 | GO:0042577 | lipid phosphatase activity(GO:0042577) |
| 0.0 | 0.1 | GO:0019103 | pyrimidine nucleotide binding(GO:0019103) nucleoside-triphosphate diphosphatase activity(GO:0047429) |
| 0.0 | 0.1 | GO:1990190 | peptide-glutamate-N-acetyltransferase activity(GO:1990190) |
| 0.0 | 0.7 | GO:0061631 | ubiquitin conjugating enzyme activity(GO:0061631) |
| 0.0 | 0.1 | GO:0004749 | ribose phosphate diphosphokinase activity(GO:0004749) |
| 0.0 | 1.9 | GO:0005179 | hormone activity(GO:0005179) |
| 0.0 | 0.1 | GO:0004829 | threonine-tRNA ligase activity(GO:0004829) |
| 0.0 | 0.2 | GO:0008568 | microtubule-severing ATPase activity(GO:0008568) |
| 0.0 | 0.1 | GO:0030899 | troponin C binding(GO:0030172) calcium-dependent ATPase activity(GO:0030899) |
| 0.0 | 0.9 | GO:0016627 | oxidoreductase activity, acting on the CH-CH group of donors(GO:0016627) |
| 0.0 | 0.1 | GO:0015349 | thyroid hormone transmembrane transporter activity(GO:0015349) |
| 0.0 | 0.1 | GO:0004859 | phospholipase inhibitor activity(GO:0004859) |
| 0.0 | 0.3 | GO:0005388 | calcium-transporting ATPase activity(GO:0005388) |
| 0.0 | 0.1 | GO:0050072 | m7G(5')pppN diphosphatase activity(GO:0050072) |
| 0.0 | 0.2 | GO:0042288 | MHC class I protein binding(GO:0042288) |
| 0.0 | 0.1 | GO:0070181 | small ribosomal subunit rRNA binding(GO:0070181) |
| 0.0 | 0.1 | GO:0008199 | ferric iron binding(GO:0008199) |
| 0.0 | 0.1 | GO:0016018 | cyclosporin A binding(GO:0016018) |
| 0.0 | 0.0 | GO:0004096 | catalase activity(GO:0004096) |
| 0.0 | 0.3 | GO:0008253 | 5'-nucleotidase activity(GO:0008253) |
| 0.0 | 0.2 | GO:0005351 | sugar:proton symporter activity(GO:0005351) |
| 0.0 | 0.0 | GO:0072542 | protein phosphatase activator activity(GO:0072542) |
| 0.0 | 0.1 | GO:0004865 | protein serine/threonine phosphatase inhibitor activity(GO:0004865) |
| 0.0 | 0.1 | GO:0051998 | carboxyl-O-methyltransferase activity(GO:0010340) protein carboxyl O-methyltransferase activity(GO:0051998) |
| 0.0 | 0.1 | GO:0016714 | oxidoreductase activity, acting on paired donors, with incorporation or reduction of molecular oxygen, reduced pteridine as one donor, and incorporation of one atom of oxygen(GO:0016714) |
| 0.0 | 0.2 | GO:0017127 | cholesterol transporter activity(GO:0017127) |
| 0.0 | 0.4 | GO:0008198 | ferrous iron binding(GO:0008198) |
| 0.0 | 0.4 | GO:0030544 | Hsp70 protein binding(GO:0030544) |
| 0.0 | 0.4 | GO:0070003 | threonine-type endopeptidase activity(GO:0004298) threonine-type peptidase activity(GO:0070003) |
| 0.0 | 0.0 | GO:1990763 | arrestin family protein binding(GO:1990763) |
| 0.0 | 0.8 | GO:0005507 | copper ion binding(GO:0005507) |
| 0.0 | 0.2 | GO:0010314 | phosphatidylinositol-5-phosphate binding(GO:0010314) |
| 0.0 | 0.3 | GO:0003746 | translation elongation factor activity(GO:0003746) |
| 0.0 | 0.1 | GO:0005007 | fibroblast growth factor-activated receptor activity(GO:0005007) |
| 0.0 | 0.5 | GO:0016709 | oxidoreductase activity, acting on paired donors, with incorporation or reduction of molecular oxygen, NAD(P)H as one donor, and incorporation of one atom of oxygen(GO:0016709) |
| 0.0 | 0.0 | GO:0004781 | adenylylsulfate kinase activity(GO:0004020) sulfate adenylyltransferase activity(GO:0004779) sulfate adenylyltransferase (ATP) activity(GO:0004781) |
| 0.0 | 0.3 | GO:0008373 | sialyltransferase activity(GO:0008373) |
| 0.0 | 0.1 | GO:0045159 | myosin II binding(GO:0045159) |
| 0.0 | 0.1 | GO:0016615 | malic enzyme activity(GO:0004470) malate dehydrogenase (decarboxylating) (NAD+) activity(GO:0004471) malate dehydrogenase (decarboxylating) (NADP+) activity(GO:0004473) malate dehydrogenase activity(GO:0016615) |
| 0.0 | 0.0 | GO:0030283 | testosterone dehydrogenase [NAD(P)] activity(GO:0030283) |
| 0.0 | 0.2 | GO:0019789 | SUMO transferase activity(GO:0019789) |
| 0.0 | 0.1 | GO:0016670 | oxidoreductase activity, acting on a sulfur group of donors, oxygen as acceptor(GO:0016670) |
| 0.0 | 0.0 | GO:0004655 | porphobilinogen synthase activity(GO:0004655) |
| 0.0 | 0.2 | GO:0019206 | nucleoside kinase activity(GO:0019206) |
| 0.0 | 0.2 | GO:0016290 | palmitoyl-CoA hydrolase activity(GO:0016290) |
| 0.0 | 0.3 | GO:0043175 | RNA polymerase core enzyme binding(GO:0043175) |
| 0.0 | 0.4 | GO:0030515 | snoRNA binding(GO:0030515) |
| 0.0 | 0.0 | GO:0008379 | thioredoxin peroxidase activity(GO:0008379) |
| 0.0 | 1.3 | GO:0005200 | structural constituent of cytoskeleton(GO:0005200) |
| 0.0 | 1.2 | GO:0030674 | protein binding, bridging(GO:0030674) |
| 0.0 | 0.3 | GO:0008157 | protein phosphatase 1 binding(GO:0008157) |
| 0.0 | 0.5 | GO:0034062 | DNA-directed RNA polymerase activity(GO:0003899) RNA polymerase activity(GO:0034062) |
| 0.0 | 0.1 | GO:0050815 | phosphoserine binding(GO:0050815) |
| 0.0 | 0.3 | GO:0051059 | NF-kappaB binding(GO:0051059) |
| 0.0 | 0.5 | GO:0031593 | polyubiquitin binding(GO:0031593) |
| 0.0 | 0.2 | GO:0032454 | histone demethylase activity (H3-K9 specific)(GO:0032454) |
| 0.0 | 0.1 | GO:0003923 | GPI-anchor transamidase activity(GO:0003923) |
| 0.0 | 0.7 | GO:0002039 | p53 binding(GO:0002039) |
| 0.0 | 0.2 | GO:0015215 | nucleotide transmembrane transporter activity(GO:0015215) |
| 0.0 | 0.2 | GO:0043014 | alpha-tubulin binding(GO:0043014) |
| 0.0 | 0.0 | GO:0002060 | purine nucleobase binding(GO:0002060) purine-nucleoside phosphorylase activity(GO:0004731) |
| 0.0 | 0.1 | GO:0004468 | lysine N-acetyltransferase activity, acting on acetyl phosphate as donor(GO:0004468) |
| 0.0 | 0.1 | GO:0070402 | NADPH binding(GO:0070402) |
| 0.0 | 0.1 | GO:0043237 | laminin-1 binding(GO:0043237) |
| 0.0 | 0.0 | GO:0102007 | lactonohydrolase activity(GO:0046573) acyl-L-homoserine-lactone lactonohydrolase activity(GO:0102007) |
| 0.0 | 0.2 | GO:0070063 | RNA polymerase binding(GO:0070063) |
| 0.0 | 0.2 | GO:0000030 | mannosyltransferase activity(GO:0000030) |
| 0.0 | 0.3 | GO:0004114 | 3',5'-cyclic-nucleotide phosphodiesterase activity(GO:0004114) |
| 0.0 | 0.5 | GO:0043130 | ubiquitin binding(GO:0043130) |
| 0.0 | 0.0 | GO:0005134 | interleukin-2 receptor binding(GO:0005134) |
| 0.0 | 0.1 | GO:0016803 | ether hydrolase activity(GO:0016803) |
| 0.0 | 0.4 | GO:0004869 | cysteine-type endopeptidase inhibitor activity(GO:0004869) |
| 0.0 | 0.2 | GO:0050136 | NADH dehydrogenase (ubiquinone) activity(GO:0008137) NADH dehydrogenase (quinone) activity(GO:0050136) |
| 0.0 | 0.1 | GO:0008191 | metalloendopeptidase inhibitor activity(GO:0008191) |
| 0.0 | 0.0 | GO:0000179 | rRNA (adenine-N6,N6-)-dimethyltransferase activity(GO:0000179) |
| 0.0 | 0.1 | GO:0051525 | NFAT protein binding(GO:0051525) |
Gene overrepresentation in curated gene sets: canonical pathways category:
| Log-likelihood per target | Total log-likelihood | Term | Description |
|---|---|---|---|
| 0.1 | 0.2 | PID NFAT 3PATHWAY | Role of Calcineurin-dependent NFAT signaling in lymphocytes |
| 0.0 | 1.5 | PID IL3 PATHWAY | IL3-mediated signaling events |
| 0.0 | 1.3 | PID P38 MKK3 6PATHWAY | p38 MAPK signaling pathway |
| 0.0 | 0.7 | PID LYMPH ANGIOGENESIS PATHWAY | VEGFR3 signaling in lymphatic endothelium |
| 0.0 | 3.2 | PID HIF1 TFPATHWAY | HIF-1-alpha transcription factor network |
| 0.0 | 0.4 | SA REG CASCADE OF CYCLIN EXPR | Expression of cyclins regulates progression through the cell cycle by activating cyclin-dependent kinases. |
| 0.0 | 0.5 | PID RANBP2 PATHWAY | Sumoylation by RanBP2 regulates transcriptional repression |
| 0.0 | 0.3 | PID PTP1B PATHWAY | Signaling events mediated by PTP1B |
| 0.0 | 0.5 | PID S1P S1P4 PATHWAY | S1P4 pathway |
| 0.0 | 1.1 | PID LIS1 PATHWAY | Lissencephaly gene (LIS1) in neuronal migration and development |
| 0.0 | 1.2 | ST WNT BETA CATENIN PATHWAY | Wnt/beta-catenin Pathway |
| 0.0 | 1.1 | PID AURORA A PATHWAY | Aurora A signaling |
| 0.0 | 0.3 | PID HIF1A PATHWAY | Hypoxic and oxygen homeostasis regulation of HIF-1-alpha |
| 0.0 | 0.9 | PID PI3K PLC TRK PATHWAY | Trk receptor signaling mediated by PI3K and PLC-gamma |
| 0.0 | 1.1 | PID FRA PATHWAY | Validated transcriptional targets of AP1 family members Fra1 and Fra2 |
| 0.0 | 0.3 | SA FAS SIGNALING | The TNF-type receptor Fas induces apoptosis on ligand binding. |
| 0.0 | 0.7 | ST P38 MAPK PATHWAY | p38 MAPK Pathway |
| 0.0 | 0.7 | PID RAS PATHWAY | Regulation of Ras family activation |
| 0.0 | 1.1 | PID DELTA NP63 PATHWAY | Validated transcriptional targets of deltaNp63 isoforms |
| 0.0 | 0.4 | PID INSULIN GLUCOSE PATHWAY | Insulin-mediated glucose transport |
| 0.0 | 0.1 | PID P38 GAMMA DELTA PATHWAY | Signaling mediated by p38-gamma and p38-delta |
| 0.0 | 0.4 | PID SYNDECAN 4 PATHWAY | Syndecan-4-mediated signaling events |
| 0.0 | 0.4 | PID IL8 CXCR2 PATHWAY | IL8- and CXCR2-mediated signaling events |
| 0.0 | 0.0 | PID S1P S1P3 PATHWAY | S1P3 pathway |
| 0.0 | 0.5 | PID EPHRINB REV PATHWAY | Ephrin B reverse signaling |
| 0.0 | 0.3 | ST TUMOR NECROSIS FACTOR PATHWAY | Tumor Necrosis Factor Pathway. |
| 0.0 | 0.1 | PID IL6 7 PATHWAY | IL6-mediated signaling events |
| 0.0 | 0.4 | PID ILK PATHWAY | Integrin-linked kinase signaling |
| 0.0 | 0.4 | PID BARD1 PATHWAY | BARD1 signaling events |
| 0.0 | 0.1 | PID IL12 STAT4 PATHWAY | IL12 signaling mediated by STAT4 |
| 0.0 | 0.2 | PID ALPHA SYNUCLEIN PATHWAY | Alpha-synuclein signaling |
| 0.0 | 0.3 | PID RHODOPSIN PATHWAY | Visual signal transduction: Rods |
| 0.0 | 0.1 | PID HDAC CLASSIII PATHWAY | Signaling events mediated by HDAC Class III |
| 0.0 | 0.4 | PID RXR VDR PATHWAY | RXR and RAR heterodimerization with other nuclear receptor |
| 0.0 | 0.3 | PID CD8 TCR DOWNSTREAM PATHWAY | Downstream signaling in naïve CD8+ T cells |
Gene overrepresentation in curated gene sets: REACTOME pathways category:
| Log-likelihood per target | Total log-likelihood | Term | Description |
|---|---|---|---|
| 0.6 | 11.6 | REACTOME RNA POL I PROMOTER OPENING | Genes involved in RNA Polymerase I Promoter Opening |
| 0.3 | 2.8 | REACTOME ACTIVATION OF CHAPERONE GENES BY ATF6 ALPHA | Genes involved in Activation of Chaperone Genes by ATF6-alpha |
| 0.1 | 1.4 | REACTOME TETRAHYDROBIOPTERIN BH4 SYNTHESIS RECYCLING SALVAGE AND REGULATION | Genes involved in Tetrahydrobiopterin (BH4) synthesis, recycling, salvage and regulation |
| 0.1 | 1.5 | REACTOME ROLE OF DCC IN REGULATING APOPTOSIS | Genes involved in Role of DCC in regulating apoptosis |
| 0.1 | 1.8 | REACTOME POST CHAPERONIN TUBULIN FOLDING PATHWAY | Genes involved in Post-chaperonin tubulin folding pathway |
| 0.1 | 1.6 | REACTOME FACILITATIVE NA INDEPENDENT GLUCOSE TRANSPORTERS | Genes involved in Facilitative Na+-independent glucose transporters |
| 0.1 | 2.3 | REACTOME CHOLESTEROL BIOSYNTHESIS | Genes involved in Cholesterol biosynthesis |
| 0.1 | 0.2 | REACTOME NEP NS2 INTERACTS WITH THE CELLULAR EXPORT MACHINERY | Genes involved in NEP/NS2 Interacts with the Cellular Export Machinery |
| 0.1 | 1.3 | REACTOME FORMATION OF ATP BY CHEMIOSMOTIC COUPLING | Genes involved in Formation of ATP by chemiosmotic coupling |
| 0.1 | 1.2 | REACTOME CONVERSION FROM APC C CDC20 TO APC C CDH1 IN LATE ANAPHASE | Genes involved in Conversion from APC/C:Cdc20 to APC/C:Cdh1 in late anaphase |
| 0.1 | 0.8 | REACTOME SYNTHESIS SECRETION AND INACTIVATION OF GIP | Genes involved in Synthesis, Secretion, and Inactivation of Glucose-dependent Insulinotropic Polypeptide (GIP) |
| 0.1 | 0.5 | REACTOME NEF MEDIATED DOWNREGULATION OF MHC CLASS I COMPLEX CELL SURFACE EXPRESSION | Genes involved in Nef mediated downregulation of MHC class I complex cell surface expression |
| 0.1 | 0.4 | REACTOME ALPHA LINOLENIC ACID ALA METABOLISM | Genes involved in alpha-linolenic acid (ALA) metabolism |
| 0.1 | 0.1 | REACTOME VIF MEDIATED DEGRADATION OF APOBEC3G | Genes involved in Vif-mediated degradation of APOBEC3G |
| 0.1 | 0.4 | REACTOME FORMATION OF TUBULIN FOLDING INTERMEDIATES BY CCT TRIC | Genes involved in Formation of tubulin folding intermediates by CCT/TriC |
| 0.1 | 1.2 | REACTOME FATTY ACYL COA BIOSYNTHESIS | Genes involved in Fatty Acyl-CoA Biosynthesis |
| 0.1 | 0.4 | REACTOME DESTABILIZATION OF MRNA BY AUF1 HNRNP D0 | Genes involved in Destabilization of mRNA by AUF1 (hnRNP D0) |
| 0.0 | 0.8 | REACTOME CHYLOMICRON MEDIATED LIPID TRANSPORT | Genes involved in Chylomicron-mediated lipid transport |
| 0.0 | 2.1 | REACTOME MITOCHONDRIAL PROTEIN IMPORT | Genes involved in Mitochondrial Protein Import |
| 0.0 | 0.4 | REACTOME ETHANOL OXIDATION | Genes involved in Ethanol oxidation |
| 0.0 | 2.4 | REACTOME APC C CDH1 MEDIATED DEGRADATION OF CDC20 AND OTHER APC C CDH1 TARGETED PROTEINS IN LATE MITOSIS EARLY G1 | Genes involved in APC/C:Cdh1 mediated degradation of Cdc20 and other APC/C:Cdh1 targeted proteins in late mitosis/early G1 |
| 0.0 | 0.5 | REACTOME TRAFFICKING AND PROCESSING OF ENDOSOMAL TLR | Genes involved in Trafficking and processing of endosomal TLR |
| 0.0 | 0.1 | REACTOME CDK MEDIATED PHOSPHORYLATION AND REMOVAL OF CDC6 | Genes involved in CDK-mediated phosphorylation and removal of Cdc6 |
| 0.0 | 0.6 | REACTOME HORMONE SENSITIVE LIPASE HSL MEDIATED TRIACYLGLYCEROL HYDROLYSIS | Genes involved in Hormone-sensitive lipase (HSL)-mediated triacylglycerol hydrolysis |
| 0.0 | 0.3 | REACTOME GAP JUNCTION DEGRADATION | Genes involved in Gap junction degradation |
| 0.0 | 0.3 | REACTOME ER PHAGOSOME PATHWAY | Genes involved in ER-Phagosome pathway |
| 0.0 | 0.4 | REACTOME SCFSKP2 MEDIATED DEGRADATION OF P27 P21 | Genes involved in SCF(Skp2)-mediated degradation of p27/p21 |
| 0.0 | 0.3 | REACTOME VIRAL MESSENGER RNA SYNTHESIS | Genes involved in Viral Messenger RNA Synthesis |
| 0.0 | 0.9 | REACTOME TIGHT JUNCTION INTERACTIONS | Genes involved in Tight junction interactions |
| 0.0 | 3.3 | REACTOME SRP DEPENDENT COTRANSLATIONAL PROTEIN TARGETING TO MEMBRANE | Genes involved in SRP-dependent cotranslational protein targeting to membrane |
| 0.0 | 0.4 | REACTOME MRNA DECAY BY 5 TO 3 EXORIBONUCLEASE | Genes involved in mRNA Decay by 5' to 3' Exoribonuclease |
| 0.0 | 0.7 | REACTOME SMAD2 SMAD3 SMAD4 HETEROTRIMER REGULATES TRANSCRIPTION | Genes involved in SMAD2/SMAD3:SMAD4 heterotrimer regulates transcription |
| 0.0 | 0.5 | REACTOME P130CAS LINKAGE TO MAPK SIGNALING FOR INTEGRINS | Genes involved in p130Cas linkage to MAPK signaling for integrins |
| 0.0 | 0.2 | REACTOME PREFOLDIN MEDIATED TRANSFER OF SUBSTRATE TO CCT TRIC | Genes involved in Prefoldin mediated transfer of substrate to CCT/TriC |
| 0.0 | 1.1 | REACTOME ACTIVATION OF CHAPERONE GENES BY XBP1S | Genes involved in Activation of Chaperone Genes by XBP1(S) |
| 0.0 | 0.3 | REACTOME RAF MAP KINASE CASCADE | Genes involved in RAF/MAP kinase cascade |
| 0.0 | 0.1 | REACTOME THROMBIN SIGNALLING THROUGH PROTEINASE ACTIVATED RECEPTORS PARS | Genes involved in Thrombin signalling through proteinase activated receptors (PARs) |
| 0.0 | 0.5 | REACTOME RNA POL III CHAIN ELONGATION | Genes involved in RNA Polymerase III Chain Elongation |
| 0.0 | 0.4 | REACTOME ADENYLATE CYCLASE INHIBITORY PATHWAY | Genes involved in Adenylate cyclase inhibitory pathway |
| 0.0 | 0.3 | REACTOME ACYL CHAIN REMODELLING OF PG | Genes involved in Acyl chain remodelling of PG |
| 0.0 | 0.9 | REACTOME NOTCH1 INTRACELLULAR DOMAIN REGULATES TRANSCRIPTION | Genes involved in NOTCH1 Intracellular Domain Regulates Transcription |
| 0.0 | 0.6 | REACTOME PROCESSING OF CAPPED INTRONLESS PRE MRNA | Genes involved in Processing of Capped Intronless Pre-mRNA |
| 0.0 | 0.2 | REACTOME SIGNAL REGULATORY PROTEIN SIRP FAMILY INTERACTIONS | Genes involved in Signal regulatory protein (SIRP) family interactions |
| 0.0 | 0.5 | REACTOME DEPOSITION OF NEW CENPA CONTAINING NUCLEOSOMES AT THE CENTROMERE | Genes involved in Deposition of New CENPA-containing Nucleosomes at the Centromere |
| 0.0 | 0.2 | REACTOME SPRY REGULATION OF FGF SIGNALING | Genes involved in Spry regulation of FGF signaling |
| 0.0 | 0.1 | REACTOME SEMAPHORIN INTERACTIONS | Genes involved in Semaphorin interactions |
| 0.0 | 0.3 | REACTOME METABOLISM OF POLYAMINES | Genes involved in Metabolism of polyamines |
| 0.0 | 0.6 | REACTOME SEMA4D INDUCED CELL MIGRATION AND GROWTH CONE COLLAPSE | Genes involved in Sema4D induced cell migration and growth-cone collapse |
| 0.0 | 0.3 | REACTOME ACTIVATION OF NF KAPPAB IN B CELLS | Genes involved in Activation of NF-kappaB in B Cells |
| 0.0 | 0.3 | REACTOME REGULATION OF AMPK ACTIVITY VIA LKB1 | Genes involved in Regulation of AMPK activity via LKB1 |
| 0.0 | 0.1 | REACTOME BINDING AND ENTRY OF HIV VIRION | Genes involved in Binding and entry of HIV virion |
| 0.0 | 0.3 | REACTOME AMINE DERIVED HORMONES | Genes involved in Amine-derived hormones |
| 0.0 | 0.2 | REACTOME FGFR2C LIGAND BINDING AND ACTIVATION | Genes involved in FGFR2c ligand binding and activation |
| 0.0 | 0.0 | REACTOME ENERGY DEPENDENT REGULATION OF MTOR BY LKB1 AMPK | Genes involved in Energy dependent regulation of mTOR by LKB1-AMPK |
| 0.0 | 0.3 | REACTOME PURINE SALVAGE | Genes involved in Purine salvage |
| 0.0 | 0.3 | REACTOME DARPP 32 EVENTS | Genes involved in DARPP-32 events |
| 0.0 | 0.4 | REACTOME PLATELET CALCIUM HOMEOSTASIS | Genes involved in Platelet calcium homeostasis |
| 0.0 | 1.0 | REACTOME RESPIRATORY ELECTRON TRANSPORT ATP SYNTHESIS BY CHEMIOSMOTIC COUPLING AND HEAT PRODUCTION BY UNCOUPLING PROTEINS | Genes involved in Respiratory electron transport, ATP synthesis by chemiosmotic coupling, and heat production by uncoupling proteins. |
| 0.0 | 0.5 | REACTOME GLUCOSE TRANSPORT | Genes involved in Glucose transport |
| 0.0 | 0.4 | REACTOME GLUCONEOGENESIS | Genes involved in Gluconeogenesis |
| 0.0 | 0.1 | REACTOME CITRIC ACID CYCLE TCA CYCLE | Genes involved in Citric acid cycle (TCA cycle) |
| 0.0 | 0.2 | REACTOME MITOCHONDRIAL FATTY ACID BETA OXIDATION | Genes involved in Mitochondrial Fatty Acid Beta-Oxidation |
| 0.0 | 0.2 | REACTOME PROTEOLYTIC CLEAVAGE OF SNARE COMPLEX PROTEINS | Genes involved in Proteolytic cleavage of SNARE complex proteins |
| 0.0 | 0.1 | REACTOME TRANSPORT OF ORGANIC ANIONS | Genes involved in Transport of organic anions |
| 0.0 | 0.8 | REACTOME MITOTIC PROMETAPHASE | Genes involved in Mitotic Prometaphase |
| 0.0 | 0.1 | REACTOME SYNTHESIS OF BILE ACIDS AND BILE SALTS VIA 24 HYDROXYCHOLESTEROL | Genes involved in Synthesis of bile acids and bile salts via 24-hydroxycholesterol |
| 0.0 | 0.2 | REACTOME PLATELET ADHESION TO EXPOSED COLLAGEN | Genes involved in Platelet Adhesion to exposed collagen |
| 0.0 | 0.1 | REACTOME INTEGRIN ALPHAIIB BETA3 SIGNALING | Genes involved in Integrin alphaIIb beta3 signaling |
| 0.0 | 0.4 | REACTOME INTRINSIC PATHWAY FOR APOPTOSIS | Genes involved in Intrinsic Pathway for Apoptosis |
| 0.0 | 0.1 | REACTOME COPI MEDIATED TRANSPORT | Genes involved in COPI Mediated Transport |
| 0.0 | 0.0 | REACTOME CYCLIN A B1 ASSOCIATED EVENTS DURING G2 M TRANSITION | Genes involved in Cyclin A/B1 associated events during G2/M transition |
| 0.0 | 0.2 | REACTOME ACTIVATED TAK1 MEDIATES P38 MAPK ACTIVATION | Genes involved in activated TAK1 mediates p38 MAPK activation |
| 0.0 | 0.1 | REACTOME LIPOPROTEIN METABOLISM | Genes involved in Lipoprotein metabolism |