Project
GSE49485: Hypoxia transcriptome sequencing of rat brain.
Navigation
Downloads
Results for Trp53
Z-value: 0.52
Motif logo
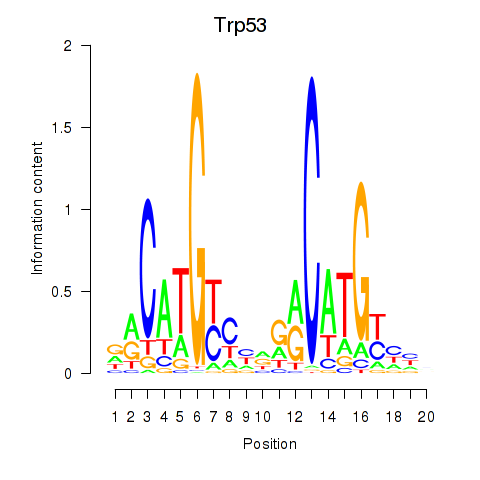
Transcription factors associated with Trp53
| Gene Symbol | Gene ID | Gene Info |
|---|
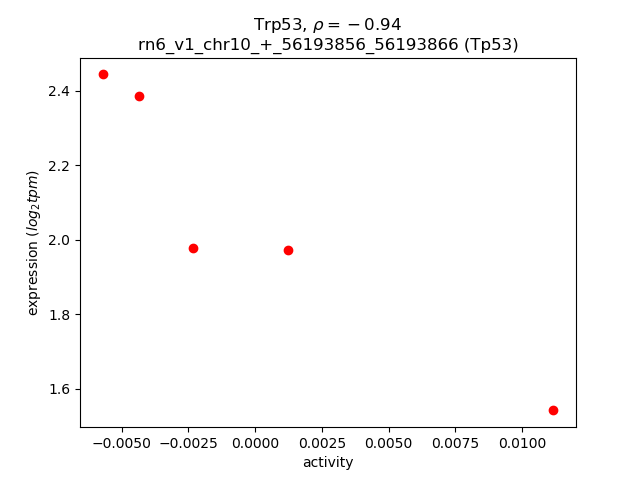
Activity-expression correlation:
| Gene | Promoter | Pearson corr. coef. | P-value | Plot |
|---|---|---|---|---|
| Tp53 | rn6_v1_chr10_+_56193856_56193866 | -0.94 | 1.8e-02 | Click! |
Activity profile of Trp53 motif
Sorted Z-values of Trp53 motif
| Promoter | Log-likelihood | Transcript | Gene | Gene Info |
|---|---|---|---|---|
| chr10_-_63176463 | 0.35 |
ENSRNOT00000004717
|
Slc6a4
|
solute carrier family 6 member 4 |
| chr7_-_28711761 | 0.26 |
ENSRNOT00000006249
|
Parpbp
|
PARP1 binding protein |
| chr8_+_72743426 | 0.24 |
ENSRNOT00000072573
|
Rps27l
|
ribosomal protein S27-like |
| chr6_-_76270457 | 0.24 |
ENSRNOT00000009894
|
Nfkbia
|
NFKB inhibitor alpha |
| chr14_-_37770059 | 0.22 |
ENSRNOT00000029721
|
Slc10a4
|
solute carrier family 10, member 4 |
| chr5_-_153924896 | 0.21 |
ENSRNOT00000065247
|
Grhl3
|
grainyhead-like transcription factor 3 |
| chr20_-_14020007 | 0.20 |
ENSRNOT00000093521
|
Ggt1
|
gamma-glutamyltransferase 1 |
| chr19_+_41482728 | 0.18 |
ENSRNOT00000022943
|
Calb2
|
calbindin 2 |
| chr10_-_90049112 | 0.18 |
ENSRNOT00000028323
|
Pyy
|
peptide YY (mapped) |
| chr20_-_3439983 | 0.17 |
ENSRNOT00000080822
ENSRNOT00000001099 |
Ier3
|
immediate early response 3 |
| chr8_+_106503504 | 0.17 |
ENSRNOT00000018755
|
Rbp2
|
retinol binding protein 2 |
| chr16_+_20020444 | 0.15 |
ENSRNOT00000024827
|
Pgls
|
6-phosphogluconolactonase |
| chr1_+_77541359 | 0.14 |
ENSRNOT00000049028
|
LOC103690015
|
40S ribosomal protein S19-like |
| chr4_+_181243338 | 0.14 |
ENSRNOT00000034051
|
Smco2
|
single-pass membrane protein with coiled-coil domains 2 |
| chr12_-_13133219 | 0.14 |
ENSRNOT00000092292
|
Daglb
|
diacylglycerol lipase, beta |
| chr10_+_90929423 | 0.13 |
ENSRNOT00000093180
|
Higd1b
|
HIG1 hypoxia inducible domain family, member 1B |
| chr2_+_154604832 | 0.13 |
ENSRNOT00000013777
|
Vom2r44
|
vomeronasal 2 receptor 44 |
| chr1_+_201429771 | 0.13 |
ENSRNOT00000027836
|
Plekha1
|
pleckstrin homology domain containing A1 |
| chr19_-_49448072 | 0.13 |
ENSRNOT00000014997
|
Cmc2
|
C-x(9)-C motif containing 2 |
| chr11_-_71523267 | 0.13 |
ENSRNOT00000033026
|
Zdhhc19
|
zinc finger, DHHC-type containing 19 |
| chr10_-_25910298 | 0.13 |
ENSRNOT00000065633
ENSRNOT00000079646 |
Ccng1
|
cyclin G1 |
| chr4_-_123494742 | 0.12 |
ENSRNOT00000073268
|
Slc41a3
|
solute carrier family 41, member 3 |
| chr1_+_266075782 | 0.12 |
ENSRNOT00000026471
|
Fbxl15
|
F-box and leucine-rich repeat protein 15 |
| chr7_+_126736732 | 0.12 |
ENSRNOT00000022012
|
Gtse1
|
G-2 and S-phase expressed 1 |
| chr17_-_44527801 | 0.12 |
ENSRNOT00000089643
|
Hist1h2bk
|
histone cluster 1 H2B family member k |
| chr1_-_89194602 | 0.11 |
ENSRNOT00000028518
|
Gapdhs
|
glyceraldehyde-3-phosphate dehydrogenase, spermatogenic |
| chr5_-_152473868 | 0.11 |
ENSRNOT00000022130
|
Fam110d
|
family with sequence similarity 110, member D |
| chr20_+_1889652 | 0.11 |
ENSRNOT00000068508
ENSRNOT00000000996 |
Olr1746
|
olfactory receptor 1746 |
| chr19_+_25123724 | 0.11 |
ENSRNOT00000007407
|
LOC686013
|
hypothetical protein LOC686013 |
| chr10_-_14061703 | 0.11 |
ENSRNOT00000017917
|
Gfer
|
growth factor, augmenter of liver regeneration |
| chr4_+_100407658 | 0.10 |
ENSRNOT00000018562
|
Capg
|
capping actin protein, gelsolin like |
| chr18_-_4371899 | 0.10 |
ENSRNOT00000051207
|
LOC108349606
|
60S ribosomal protein L7a-like |
| chr2_+_208541361 | 0.10 |
ENSRNOT00000021288
|
Tmigd3
|
transmembrane and immunoglobulin domain containing 3 |
| chr17_-_44520240 | 0.10 |
ENSRNOT00000086538
|
Hist1h2bh
|
histone cluster 1 H2B family member h |
| chr1_-_81412251 | 0.10 |
ENSRNOT00000026946
|
Pinlyp
|
phospholipase A2 inhibitor and LY6/PLAUR domain containing |
| chr13_-_44345735 | 0.10 |
ENSRNOT00000005006
|
Tmem163
|
transmembrane protein 163 |
| chr4_+_67378188 | 0.10 |
ENSRNOT00000030892
|
Ndufb2
|
NADH:ubiquinone oxidoreductase subunit B2 |
| chr8_+_85489553 | 0.09 |
ENSRNOT00000082158
|
Rpl12-ps1
|
ribosomal protein L12, pseudogene 1 |
| chr12_+_38160464 | 0.09 |
ENSRNOT00000032249
|
Hcar2
|
hydroxycarboxylic acid receptor 2 |
| chr19_+_58565576 | 0.09 |
ENSRNOT00000026965
|
Ntpcr
|
nucleoside-triphosphatase, cancer-related |
| chr16_-_14300951 | 0.09 |
ENSRNOT00000017038
|
Rgr
|
retinal G protein coupled receptor |
| chr1_-_24924918 | 0.09 |
ENSRNOT00000043416
|
AABR07000740.1
|
|
| chr1_+_209769282 | 0.09 |
ENSRNOT00000083316
|
Glrx3
|
glutaredoxin 3 |
| chr5_+_59008933 | 0.09 |
ENSRNOT00000023060
|
Car9
|
carbonic anhydrase 9 |
| chr10_+_75529009 | 0.09 |
ENSRNOT00000013771
|
Mrps23
|
mitochondrial ribosomal protein S23 |
| chr3_+_2643610 | 0.09 |
ENSRNOT00000037169
|
Fut7
|
fucosyltransferase 7 |
| chr3_-_7051953 | 0.09 |
ENSRNOT00000013473
|
RGD1306233
|
similar to hypothetical protein MGC29761 |
| chr8_-_108777717 | 0.08 |
ENSRNOT00000034188
|
Il20rb
|
interleukin 20 receptor subunit beta |
| chr11_-_32088002 | 0.08 |
ENSRNOT00000002732
|
Atp5o
|
ATP synthase, H+ transporting, mitochondrial F1 complex, O subunit |
| chr2_-_149347796 | 0.08 |
ENSRNOT00000091020
|
P2ry14
|
purinergic receptor P2Y14 |
| chr20_+_46707362 | 0.08 |
ENSRNOT00000071045
|
AABR07045411.1
|
|
| chr1_+_89162639 | 0.08 |
ENSRNOT00000028508
|
Atp4a
|
ATPase H+/K+ transporting alpha subunit |
| chr13_+_80517536 | 0.08 |
ENSRNOT00000004386
|
Myoc
|
myocilin |
| chr5_-_155258392 | 0.08 |
ENSRNOT00000017065
|
C1qc
|
complement C1q C chain |
| chr3_+_151285249 | 0.08 |
ENSRNOT00000055254
|
Procr
|
protein C receptor |
| chr4_-_170841187 | 0.08 |
ENSRNOT00000007485
|
Art4
|
ADP-ribosyltransferase 4 |
| chr19_+_19395655 | 0.07 |
ENSRNOT00000019130
|
Snx20
|
sorting nexin 20 |
| chr10_+_45289741 | 0.07 |
ENSRNOT00000066190
|
Hist3h2ba
|
histone cluster 3, H2ba |
| chr5_+_133864798 | 0.07 |
ENSRNOT00000091977
|
Tal1
|
TAL bHLH transcription factor 1, erythroid differentiation factor |
| chr5_-_159336429 | 0.07 |
ENSRNOT00000009230
|
Padi3
|
peptidyl arginine deiminase 3 |
| chr14_-_114047527 | 0.07 |
ENSRNOT00000083199
|
AABR07016779.1
|
|
| chr5_+_133865331 | 0.07 |
ENSRNOT00000035409
|
Tal1
|
TAL bHLH transcription factor 1, erythroid differentiation factor |
| chr1_+_212359177 | 0.07 |
ENSRNOT00000046314
|
Zfp511
|
zinc finger protein 511 |
| chr4_-_100228809 | 0.07 |
ENSRNOT00000016699
|
Rnf181
|
ring finger protein 181 |
| chr1_+_217039755 | 0.07 |
ENSRNOT00000091603
|
LOC102552318
|
actin-like |
| chr20_-_1099336 | 0.07 |
ENSRNOT00000071766
|
LOC100362856
|
olfactory receptor-like protein-like |
| chr6_-_99273033 | 0.06 |
ENSRNOT00000088808
|
Tex21
|
testis expressed 21 |
| chr1_-_165680176 | 0.06 |
ENSRNOT00000025245
ENSRNOT00000082697 |
Plekhb1
|
pleckstrin homology domain containing B1 |
| chr19_+_15294248 | 0.06 |
ENSRNOT00000024622
|
Ces1f
|
carboxylesterase 1F |
| chr13_+_48427038 | 0.06 |
ENSRNOT00000009241
|
Ctse
|
cathepsin E |
| chr1_+_84573496 | 0.06 |
ENSRNOT00000057158
|
RGD1565183
|
similar to ribosomal protein L28 |
| chr13_+_47454591 | 0.06 |
ENSRNOT00000005791
|
LOC498222
|
similar to specifically androgen-regulated protein |
| chr9_+_95241609 | 0.06 |
ENSRNOT00000032634
ENSRNOT00000077416 |
Ugt1a5
|
UDP glucuronosyltransferase family 1 member A5 |
| chr15_+_52265557 | 0.06 |
ENSRNOT00000015969
|
Nudt18
|
nudix hydrolase 18 |
| chr9_-_16807966 | 0.06 |
ENSRNOT00000073160
|
Rps19
|
ribosomal protein S19 |
| chr8_+_33514042 | 0.06 |
ENSRNOT00000081614
ENSRNOT00000081525 |
Kcnj1
|
potassium voltage-gated channel subfamily J member 1 |
| chr1_-_162385575 | 0.06 |
ENSRNOT00000016540
|
Thrsp
|
thyroid hormone responsive |
| chr9_+_61692154 | 0.06 |
ENSRNOT00000082300
|
Hspe1
|
heat shock protein family E member 1 |
| chr20_-_5166252 | 0.06 |
ENSRNOT00000001138
|
Aif1
|
allograft inflammatory factor 1 |
| chr17_-_43798383 | 0.06 |
ENSRNOT00000075069
|
LOC684828
|
similar to Histone H1.2 (H1 VAR.1) (H1c) |
| chr10_-_86393141 | 0.06 |
ENSRNOT00000009485
|
Mien1
|
migration and invasion enhancer 1 |
| chr18_-_52047816 | 0.06 |
ENSRNOT00000018368
ENSRNOT00000077491 |
LOC100174910
|
glutaredoxin-like protein |
| chr8_+_47674321 | 0.06 |
ENSRNOT00000026170
ENSRNOT00000078776 |
Trim29
|
tripartite motif-containing 29 |
| chr17_+_44738643 | 0.06 |
ENSRNOT00000087643
|
LOC100910554
|
histone H2A type 1-like |
| chr10_-_107424710 | 0.06 |
ENSRNOT00000004320
|
Lgals3bp
|
galectin 3 binding protein |
| chr1_+_91433030 | 0.06 |
ENSRNOT00000015205
|
Slc7a10
|
solute carrier family 7 member 10 |
| chr1_+_81750928 | 0.06 |
ENSRNOT00000027246
|
NEWGENE_68440
|
ribosomal protein S19 |
| chrX_-_158655198 | 0.05 |
ENSRNOT00000045153
|
LOC103689983
|
hypoxanthine-guanine phosphoribosyltransferase |
| chr10_-_12990405 | 0.05 |
ENSRNOT00000078647
|
Thoc6
|
THO complex 6 |
| chr12_-_30180115 | 0.05 |
ENSRNOT00000001202
|
Crcp
|
CGRP receptor component |
| chr18_-_24693481 | 0.05 |
ENSRNOT00000021708
|
Sft2d3
|
SFT2 domain containing 3 |
| chr5_+_162808646 | 0.05 |
ENSRNOT00000021155
|
Dhrs3
|
dehydrogenase/reductase 3 |
| chr18_+_41022552 | 0.05 |
ENSRNOT00000005260
|
Commd10
|
COMM domain containing 10 |
| chr19_+_56585767 | 0.05 |
ENSRNOT00000049337
|
Rab4a
|
RAB4A, member RAS oncogene family |
| chr3_+_91463660 | 0.05 |
ENSRNOT00000081984
ENSRNOT00000006628 |
Commd9
|
COMM domain containing 9 |
| chr14_+_77079402 | 0.05 |
ENSRNOT00000042200
|
Slc2a9
|
solute carrier family 2 member 9 |
| chr1_+_107344904 | 0.05 |
ENSRNOT00000082582
|
Gas2
|
growth arrest-specific 2 |
| chr3_-_82757204 | 0.05 |
ENSRNOT00000012214
|
Accs
|
1-aminocyclopropane-1-carboxylate synthase homolog |
| chr8_+_96395317 | 0.05 |
ENSRNOT00000044521
|
Trim43a
|
tripartite motif-containing 43A |
| chr1_-_89483988 | 0.05 |
ENSRNOT00000028603
|
Fxyd7
|
FXYD domain-containing ion transport regulator 7 |
| chr8_-_115179191 | 0.05 |
ENSRNOT00000017224
|
Parp3
|
poly (ADP-ribose) polymerase family, member 3 |
| chr16_-_75855745 | 0.05 |
ENSRNOT00000031291
|
Agpat5
|
1-acylglycerol-3-phosphate O-acyltransferase 5 |
| chr7_-_140401686 | 0.05 |
ENSRNOT00000083955
|
Fkbp11
|
FK506 binding protein 11 |
| chr15_+_32894938 | 0.05 |
ENSRNOT00000012837
|
Abhd4
|
abhydrolase domain containing 4 |
| chr11_+_53140599 | 0.05 |
ENSRNOT00000083438
|
Bbx
|
BBX, HMG-box containing |
| chr7_+_118507224 | 0.05 |
ENSRNOT00000075451
|
LOC108348142
|
60S ribosomal protein L8 |
| chr1_-_170653920 | 0.05 |
ENSRNOT00000050562
|
Mrpl17
|
mitochondrial ribosomal protein L17 |
| chr10_-_65329279 | 0.05 |
ENSRNOT00000088721
ENSRNOT00000078757 ENSRNOT00000014104 ENSRNOT00000014118 |
Flot2
|
flotillin 2 |
| chr16_+_18690246 | 0.05 |
ENSRNOT00000081484
|
Mat1a
|
methionine adenosyltransferase 1A |
| chr19_-_28645488 | 0.05 |
ENSRNOT00000044160
|
AABR07043449.1
|
|
| chr1_-_221507181 | 0.05 |
ENSRNOT00000093048
|
Arl2
|
ADP-ribosylation factor like GTPase 2 |
| chr16_+_18690649 | 0.05 |
ENSRNOT00000015190
|
Mat1a
|
methionine adenosyltransferase 1A |
| chrX_+_31984612 | 0.04 |
ENSRNOT00000005181
|
Bmx
|
BMX non-receptor tyrosine kinase |
| chr15_-_28918162 | 0.04 |
ENSRNOT00000060428
|
Olr1644
|
olfactory receptor 1644 |
| chr7_-_139483997 | 0.04 |
ENSRNOT00000086062
|
Col2a1
|
collagen type II alpha 1 chain |
| chr13_-_89343868 | 0.04 |
ENSRNOT00000058497
ENSRNOT00000035400 |
Fcgr2b
|
Fc fragment of IgG receptor IIb |
| chr4_+_78382287 | 0.04 |
ENSRNOT00000084927
|
Gimap5
|
GTPase, IMAP family member 5 |
| chr4_-_176720012 | 0.04 |
ENSRNOT00000017965
|
Ldhb
|
lactate dehydrogenase B |
| chr1_-_227175096 | 0.04 |
ENSRNOT00000054811
|
AABR07006259.1
|
|
| chr4_-_157263890 | 0.04 |
ENSRNOT00000065416
|
Ptpn6
|
protein tyrosine phosphatase, non-receptor type 6 |
| chr11_+_7422272 | 0.04 |
ENSRNOT00000075964
|
Gbe1
|
1,4-alpha-glucan branching enzyme 1 |
| chr7_-_15723127 | 0.04 |
ENSRNOT00000071599
|
LOC100909683
|
olfactory receptor 63-like |
| chr4_+_61912210 | 0.04 |
ENSRNOT00000013569
|
Bpgm
|
bisphosphoglycerate mutase |
| chr11_-_60546997 | 0.04 |
ENSRNOT00000083124
ENSRNOT00000050092 |
Btla
|
B and T lymphocyte associated |
| chr12_+_40517657 | 0.04 |
ENSRNOT00000065314
|
Mapkapk5
|
mitogen-activated protein kinase-activated protein kinase 5 |
| chr19_-_17045349 | 0.04 |
ENSRNOT00000086829
|
Fto
|
FTO, alpha-ketoglutarate dependent dioxygenase |
| chr6_+_99444013 | 0.04 |
ENSRNOT00000058642
|
Ppp1r36
|
protein phosphatase 1, regulatory subunit 36 |
| chr14_+_77829400 | 0.04 |
ENSRNOT00000052006
|
Stk32b
|
serine/threonine kinase 32B |
| chr3_-_122006803 | 0.04 |
ENSRNOT00000089660
|
RGD1566226
|
similar to hypothetical protein F830045P16 |
| chr6_+_111176798 | 0.04 |
ENSRNOT00000072215
|
Gstz1
|
glutathione S-transferase zeta 1 |
| chr2_+_30685840 | 0.04 |
ENSRNOT00000031385
|
Ccdc125
|
coiled-coil domain containing 125 |
| chr2_+_189582991 | 0.04 |
ENSRNOT00000022627
|
Rab13
|
RAB13, member RAS oncogene family |
| chr19_+_11450760 | 0.04 |
ENSRNOT00000026297
|
Nudt21
|
nudix hydrolase 21 |
| chr8_+_119064351 | 0.04 |
ENSRNOT00000051211
|
Prss42
|
protease, serine, 42 |
| chr9_-_15410943 | 0.04 |
ENSRNOT00000074217
|
Ccnd3
|
cyclin D3 |
| chrX_-_139916883 | 0.04 |
ENSRNOT00000090442
|
Gpc3
|
glypican 3 |
| chr8_-_22173797 | 0.04 |
ENSRNOT00000042314
ENSRNOT00000079949 |
Cdc37
|
cell division cycle 37 |
| chr2_-_250981623 | 0.04 |
ENSRNOT00000018435
|
Clca2
|
chloride channel accessory 2 |
| chr18_-_24823837 | 0.03 |
ENSRNOT00000021405
ENSRNOT00000090390 |
Myo7b
|
myosin VIIb |
| chr1_+_217018916 | 0.03 |
ENSRNOT00000028195
ENSRNOT00000078979 |
Dhcr7
|
7-dehydrocholesterol reductase |
| chr5_-_28317887 | 0.03 |
ENSRNOT00000093515
ENSRNOT00000093302 ENSRNOT00000093691 ENSRNOT00000008656 |
Lrrc69
|
leucine rich repeat containing 69 |
| chr4_+_117594805 | 0.03 |
ENSRNOT00000074924
|
LOC103690067
|
EKC/KEOPS complex subunit Tprkb |
| chr3_+_146980923 | 0.03 |
ENSRNOT00000011654
|
Nsfl1c
|
NSFL1 cofactor |
| chr17_+_44520537 | 0.03 |
ENSRNOT00000077985
|
hist1h2ail2
|
histone cluster 1, H2ai-like2 |
| chr4_+_162078905 | 0.03 |
ENSRNOT00000049620
|
LOC100910725
|
C-type lectin domain family 2 member D-related protein-like |
| chr2_-_206293599 | 0.03 |
ENSRNOT00000026213
|
Dclre1b
|
DNA cross-link repair 1B |
| chr13_+_82369493 | 0.03 |
ENSRNOT00000003733
|
Sell
|
selectin L |
| chr17_+_78911581 | 0.03 |
ENSRNOT00000085104
|
AC128960.2
|
|
| chr13_+_105408179 | 0.03 |
ENSRNOT00000003378
|
Ddx3y
|
DEAD (Asp-Glu-Ala-Asp) box helicase 3, Y-linked |
| chr12_+_22965025 | 0.03 |
ENSRNOT00000080068
|
Col26a1
|
collagen type XXVI alpha 1 chain |
| chr9_+_96746440 | 0.03 |
ENSRNOT00000065720
|
Agap1
|
ArfGAP with GTPase domain, ankyrin repeat and PH domain 1 |
| chr5_+_173237642 | 0.03 |
ENSRNOT00000068770
|
Ankrd65
|
ankyrin repeat domain 65 |
| chr8_+_71125414 | 0.03 |
ENSRNOT00000021265
|
Pif1
|
PIF1 5'-to-3' DNA helicase |
| chr20_+_7788084 | 0.03 |
ENSRNOT00000000597
|
Def6
|
DEF6 guanine nucleotide exchange factor |
| chr11_+_58624198 | 0.03 |
ENSRNOT00000002091
|
Gap43
|
growth associated protein 43 |
| chr2_-_250778269 | 0.03 |
ENSRNOT00000085670
ENSRNOT00000083535 ENSRNOT00000017824 |
Clca5
|
chloride channel accessory 5 |
| chr4_-_120467932 | 0.03 |
ENSRNOT00000018454
|
Sec61a1
|
Sec61 translocon alpha 1 subunit |
| chr8_+_69484174 | 0.03 |
ENSRNOT00000077290
ENSRNOT00000056518 |
RGD1562747
|
similar to RIKEN cDNA 1110012L19 |
| chr2_-_189765415 | 0.03 |
ENSRNOT00000020815
|
Slc27a3
|
solute carrier family 27 member 3 |
| chr1_-_151106802 | 0.03 |
ENSRNOT00000021971
|
Tyr
|
tyrosinase |
| chr5_-_64702892 | 0.03 |
ENSRNOT00000078547
|
Acnat2
|
acyl-coenzyme A amino acid N-acyltransferase 2 |
| chr1_+_162817611 | 0.03 |
ENSRNOT00000091952
|
Pak1
|
p21 (RAC1) activated kinase 1 |
| chrX_-_158228749 | 0.03 |
ENSRNOT00000065935
|
Hprt1
|
hypoxanthine phosphoribosyltransferase 1 |
| chr17_+_44528125 | 0.03 |
ENSRNOT00000084538
|
LOC680322
|
similar to Histone H2A type 1 |
| chr19_-_44078320 | 0.03 |
ENSRNOT00000026249
ENSRNOT00000089873 |
Cfdp1
|
craniofacial development protein 1 |
| chr15_-_4035064 | 0.03 |
ENSRNOT00000012300
|
Fut11
|
fucosyltransferase 11 |
| chr20_-_32139789 | 0.03 |
ENSRNOT00000078140
|
Srgn
|
serglycin |
| chr19_+_15339152 | 0.03 |
ENSRNOT00000060929
|
Ces1a
|
carboxylesterase 1A |
| chr2_-_152911553 | 0.03 |
ENSRNOT00000019929
|
Gpr149
|
G protein-coupled receptor 149 |
| chr8_-_83693472 | 0.03 |
ENSRNOT00000015947
|
Fam83b
|
family with sequence similarity 83, member B |
| chr14_-_60964324 | 0.03 |
ENSRNOT00000005155
|
Sod3
|
superoxide dismutase 3, extracellular |
| chr19_-_29802083 | 0.03 |
ENSRNOT00000024755
|
AC123471.1
|
|
| chr10_+_13786459 | 0.03 |
ENSRNOT00000010915
|
Rnps1
|
RNA binding protein with serine rich domain 1 |
| chr7_-_71048383 | 0.03 |
ENSRNOT00000005693
|
Gpr182
|
G protein-coupled receptor 182 |
| chr3_+_102925471 | 0.03 |
ENSRNOT00000040364
|
Olr772
|
olfactory receptor 772 |
| chr17_+_90802393 | 0.03 |
ENSRNOT00000003535
|
Edaradd
|
EDAR-associated death domain |
| chr13_+_26903052 | 0.03 |
ENSRNOT00000003625
|
Serpinb5
|
serpin family B member 5 |
| chrX_-_66602458 | 0.03 |
ENSRNOT00000076510
ENSRNOT00000017429 |
Eda2r
|
ectodysplasin A2 receptor |
| chr6_+_132242328 | 0.03 |
ENSRNOT00000081088
|
Cyp46a1
|
cytochrome P450, family 46, subfamily a, polypeptide 1 |
| chr10_-_83104173 | 0.03 |
ENSRNOT00000031252
|
Kat7
|
lysine acetyltransferase 7 |
| chr1_-_214844858 | 0.03 |
ENSRNOT00000046344
|
Tollip
|
toll interacting protein |
| chr5_-_64718131 | 0.03 |
ENSRNOT00000088211
|
Acnat1
|
acyl-coenzyme A amino acid N-acyltransferase 1 |
| chr7_+_117326279 | 0.03 |
ENSRNOT00000050522
|
Spatc1
|
spermatogenesis and centriole associated 1 |
| chr11_+_86715981 | 0.03 |
ENSRNOT00000050269
|
Comt
|
catechol-O-methyltransferase |
| chr3_-_11820549 | 0.03 |
ENSRNOT00000020660
|
Cfap157
|
cilia and flagella associated protein 157 |
| chr11_+_64522130 | 0.03 |
ENSRNOT00000004315
|
Upk1b
|
uroplakin 1B |
| chr8_+_50525091 | 0.03 |
ENSRNOT00000074357
|
Apoa1
|
apolipoprotein A1 |
| chr14_+_76657311 | 0.03 |
ENSRNOT00000076730
|
Clnk
|
cytokine-dependent hematopoietic cell linker |
| chr7_-_20118466 | 0.03 |
ENSRNOT00000080523
|
RGD1565071
|
similar to hypothetical protein 4930509O22 |
| chr8_+_97291580 | 0.02 |
ENSRNOT00000018794
|
Rasgrf1
|
RAS protein-specific guanine nucleotide-releasing factor 1 |
| chr9_-_100306829 | 0.02 |
ENSRNOT00000038563
|
RGD1563692
|
similar to hypothetical protein FLJ22671 |
| chr19_-_10460674 | 0.02 |
ENSRNOT00000081223
ENSRNOT00000020921 |
Adgrg1
|
adhesion G protein-coupled receptor G1 |
| chr5_-_101138427 | 0.02 |
ENSRNOT00000058615
|
Frem1
|
Fras1 related extracellular matrix 1 |
| chrX_-_124926171 | 0.02 |
ENSRNOT00000003449
|
C1galt1c1
|
C1GALT1-specific chaperone 1 |
| chr3_-_72895740 | 0.02 |
ENSRNOT00000012568
|
Fads2l1
|
fatty acid desaturase 2-like 1 |
| chr8_+_66296883 | 0.02 |
ENSRNOT00000018467
|
Tle3
|
transducin-like enhancer of split 3 |
| chr4_+_162437089 | 0.02 |
ENSRNOT00000038801
|
Clec2d2
|
C-type lectin domain family 2 member D2 |
| chr19_-_29134876 | 0.02 |
ENSRNOT00000040545
|
AABR07043523.1
|
|
| chr2_-_27296777 | 0.02 |
ENSRNOT00000080748
|
Ankdd1b
|
ankyrin repeat and death domain containing 1B |
| chr9_+_95398237 | 0.02 |
ENSRNOT00000025879
|
Trpm8
|
transient receptor potential cation channel, subfamily M, member 8 |
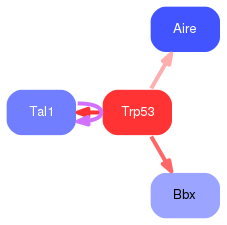
Network of associatons between targets according to the STRING database.

First level regulatory network of Trp53
Gene Ontology Analysis
Gene overrepresentation in biological process category:
| Log-likelihood per target | Total log-likelihood | Term | Description |
|---|---|---|---|
| 0.1 | 0.4 | GO:0032227 | negative regulation of synaptic transmission, dopaminergic(GO:0032227) |
| 0.0 | 0.2 | GO:0031179 | peptide modification(GO:0031179) |
| 0.0 | 0.1 | GO:0045799 | positive regulation of chromatin assembly or disassembly(GO:0045799) |
| 0.0 | 0.2 | GO:0070427 | nucleotide-binding oligomerization domain containing 1 signaling pathway(GO:0070427) |
| 0.0 | 0.1 | GO:1901069 | guanosine-containing compound catabolic process(GO:1901069) |
| 0.0 | 0.1 | GO:0002884 | negative regulation of hypersensitivity(GO:0002884) |
| 0.0 | 0.2 | GO:0006776 | vitamin A metabolic process(GO:0006776) |
| 0.0 | 0.2 | GO:2000042 | negative regulation of double-strand break repair via homologous recombination(GO:2000042) |
| 0.0 | 0.1 | GO:0018101 | protein citrullination(GO:0018101) histone citrullination(GO:0036414) |
| 0.0 | 0.1 | GO:0042776 | mitochondrial ATP synthesis coupled proton transport(GO:0042776) |
| 0.0 | 0.1 | GO:1901979 | regulation of inward rectifier potassium channel activity(GO:1901979) |
| 0.0 | 0.1 | GO:0038129 | ERBB2 signaling pathway(GO:0038128) ERBB3 signaling pathway(GO:0038129) |
| 0.0 | 0.1 | GO:0014739 | positive regulation of muscle hyperplasia(GO:0014739) |
| 0.0 | 0.1 | GO:0006556 | S-adenosylmethionine biosynthetic process(GO:0006556) |
| 0.0 | 0.1 | GO:0044571 | [2Fe-2S] cluster assembly(GO:0044571) |
| 0.0 | 0.5 | GO:0000028 | ribosomal small subunit assembly(GO:0000028) |
| 0.0 | 0.0 | GO:1990166 | protein localization to site of double-strand break(GO:1990166) |
| 0.0 | 0.0 | GO:1903903 | regulation of establishment of T cell polarity(GO:1903903) |
| 0.0 | 0.0 | GO:0002465 | peripheral T cell tolerance induction(GO:0002458) peripheral tolerance induction(GO:0002465) |
| 0.0 | 0.2 | GO:0090179 | planar cell polarity pathway involved in neural tube closure(GO:0090179) |
| 0.0 | 0.2 | GO:0045820 | negative regulation of glycolytic process(GO:0045820) negative regulation of mitochondrial outer membrane permeabilization involved in apoptotic signaling pathway(GO:1901029) |
| 0.0 | 0.0 | GO:0042245 | RNA repair(GO:0042245) |
| 0.0 | 0.1 | GO:0070162 | adiponectin secretion(GO:0070162) regulation of adiponectin secretion(GO:0070163) |
| 0.0 | 0.2 | GO:0032096 | negative regulation of response to food(GO:0032096) |
| 0.0 | 0.0 | GO:1902463 | protein localization to cell leading edge(GO:1902463) |
| 0.0 | 0.0 | GO:0016129 | phytosteroid metabolic process(GO:0016128) phytosteroid biosynthetic process(GO:0016129) |
| 0.0 | 0.1 | GO:0072716 | response to actinomycin D(GO:0072716) |
| 0.0 | 0.0 | GO:0033277 | abortive mitotic cell cycle(GO:0033277) |
| 0.0 | 0.1 | GO:0002361 | CD4-positive, CD25-positive, alpha-beta regulatory T cell differentiation(GO:0002361) |
Gene overrepresentation in cellular component category:
| Log-likelihood per target | Total log-likelihood | Term | Description |
|---|---|---|---|
| 0.0 | 0.1 | GO:0097453 | mesaxon(GO:0097453) ensheathing process(GO:1990015) |
| 0.0 | 0.2 | GO:0033256 | I-kappaB/NF-kappaB complex(GO:0033256) |
| 0.0 | 0.1 | GO:0098837 | postsynaptic recycling endosome(GO:0098837) |
| 0.0 | 0.1 | GO:0090543 | Flemming body(GO:0090543) |
| 0.0 | 0.0 | GO:1990730 | VCP-NSFL1C complex(GO:1990730) |
Gene overrepresentation in molecular function category:
| Log-likelihood per target | Total log-likelihood | Term | Description |
|---|---|---|---|
| 0.1 | 0.4 | GO:0015222 | serotonin transmembrane transporter activity(GO:0015222) |
| 0.1 | 0.2 | GO:0008508 | bile acid:sodium symporter activity(GO:0008508) |
| 0.0 | 0.1 | GO:0016971 | flavin-linked sulfhydryl oxidase activity(GO:0016971) |
| 0.0 | 0.2 | GO:0008494 | translation activator activity(GO:0008494) |
| 0.0 | 0.1 | GO:0004478 | methionine adenosyltransferase activity(GO:0004478) |
| 0.0 | 0.1 | GO:0004365 | glyceraldehyde-3-phosphate dehydrogenase (NAD+) (phosphorylating) activity(GO:0004365) glyceraldehyde-3-phosphate dehydrogenase (NAD(P)+) (phosphorylating) activity(GO:0043891) |
| 0.0 | 0.2 | GO:0036374 | gamma-glutamyltransferase activity(GO:0003840) glutathione hydrolase activity(GO:0036374) |
| 0.0 | 0.1 | GO:0042015 | interleukin-20 binding(GO:0042015) |
| 0.0 | 0.0 | GO:0001605 | adrenomedullin receptor activity(GO:0001605) |
| 0.0 | 0.1 | GO:0004668 | protein-arginine deiminase activity(GO:0004668) |
| 0.0 | 0.1 | GO:0044715 | 8-oxo-dGDP phosphatase activity(GO:0044715) |
| 0.0 | 0.1 | GO:0008900 | hydrogen:potassium-exchanging ATPase activity(GO:0008900) |
| 0.0 | 0.1 | GO:0046920 | alpha-(1->3)-fucosyltransferase activity(GO:0046920) |
| 0.0 | 0.1 | GO:0015272 | ATP-activated inward rectifier potassium channel activity(GO:0015272) |
| 0.0 | 0.1 | GO:0098519 | nucleotide phosphatase activity, acting on free nucleotides(GO:0098519) |
| 0.0 | 0.0 | GO:0004459 | L-lactate dehydrogenase activity(GO:0004459) |
| 0.0 | 0.2 | GO:0019841 | retinol binding(GO:0019841) |
| 0.0 | 0.1 | GO:0004859 | phospholipase inhibitor activity(GO:0004859) |
| 0.0 | 0.0 | GO:0003844 | 1,4-alpha-glucan branching enzyme activity(GO:0003844) |
| 0.0 | 0.1 | GO:0001635 | calcitonin gene-related peptide receptor activity(GO:0001635) |
| 0.0 | 0.1 | GO:0032027 | myosin light chain binding(GO:0032027) |
| 0.0 | 0.1 | GO:0003956 | NAD(P)+-protein-arginine ADP-ribosyltransferase activity(GO:0003956) |
| 0.0 | 0.0 | GO:0004619 | bisphosphoglycerate mutase activity(GO:0004082) phosphoglycerate mutase activity(GO:0004619) 2,3-bisphosphoglycerate-dependent phosphoglycerate mutase activity(GO:0046538) |
Gene overrepresentation in curated gene sets: canonical pathways category:
| Log-likelihood per target | Total log-likelihood | Term | Description |
|---|---|---|---|
| 0.0 | 0.2 | PID NFKAPPAB ATYPICAL PATHWAY | Atypical NF-kappaB pathway |
Gene overrepresentation in curated gene sets: REACTOME pathways category:
| Log-likelihood per target | Total log-likelihood | Term | Description |
|---|---|---|---|
| 0.0 | 0.2 | REACTOME NFKB IS ACTIVATED AND SIGNALS SURVIVAL | Genes involved in NF-kB is activated and signals survival |
| 0.0 | 0.1 | REACTOME OPSINS | Genes involved in Opsins |
| 0.0 | 0.2 | REACTOME RNA POL I PROMOTER OPENING | Genes involved in RNA Polymerase I Promoter Opening |