Project
GSE49485: Hypoxia transcriptome sequencing of rat brain.
Navigation
Downloads
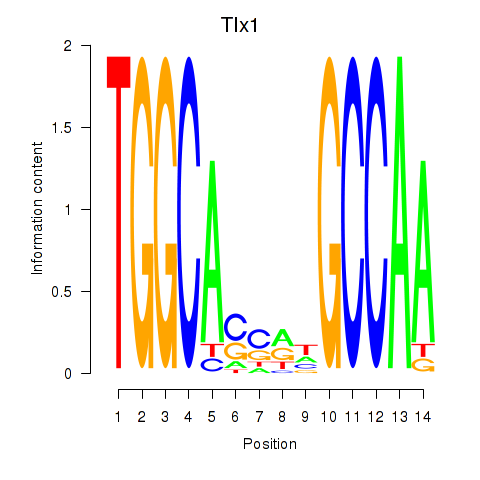
Results for Tlx1
Z-value: 0.86
Motif logo
Transcription factors associated with Tlx1
| Gene Symbol | Gene ID | Gene Info |
|---|---|---|
|
Tlx1
|
ENSRNOG00000016120 | T-cell leukemia, homeobox 1 |
Activity-expression correlation:
| Gene | Promoter | Pearson corr. coef. | P-value | Plot |
|---|---|---|---|---|
| Tlx1 | rn6_v1_chr1_+_264893162_264893162 | 0.48 | 4.1e-01 | Click! |
Activity profile of Tlx1 motif
Sorted Z-values of Tlx1 motif
| Promoter | Log-likelihood | Transcript | Gene | Gene Info |
|---|---|---|---|---|
| chr15_-_34550850 | 1.48 |
ENSRNOT00000027794
ENSRNOT00000090228 |
Cbln3
|
cerebellin 3 precursor |
| chr14_+_83724933 | 1.12 |
ENSRNOT00000029848
|
Pla2g3
|
phospholipase A2, group III |
| chr20_-_9855443 | 0.92 |
ENSRNOT00000090275
ENSRNOT00000066266 |
Tff3
|
trefoil factor 3 |
| chr7_-_123088819 | 0.67 |
ENSRNOT00000056077
|
AC096601.1
|
|
| chr17_-_61332391 | 0.64 |
ENSRNOT00000034599
|
LOC100362965
|
SNRPN upstream reading frame protein-like |
| chr4_-_147163467 | 0.60 |
ENSRNOT00000010748
|
Timp4
|
tissue inhibitor of metalloproteinase 4 |
| chr19_+_55669626 | 0.58 |
ENSRNOT00000033352
|
Cdh15
|
cadherin 15 |
| chr20_+_5008508 | 0.57 |
ENSRNOT00000001153
|
Vwa7
|
von Willebrand factor A domain containing 7 |
| chr10_-_88670430 | 0.51 |
ENSRNOT00000025547
|
Hcrt
|
hypocretin neuropeptide precursor |
| chr5_+_154522119 | 0.47 |
ENSRNOT00000072618
|
E2f2
|
E2F transcription factor 2 |
| chr7_-_119441487 | 0.45 |
ENSRNOT00000067635
|
Pvalb
|
parvalbumin |
| chr8_+_116776494 | 0.45 |
ENSRNOT00000050702
|
Cdhr4
|
cadherin-related family member 4 |
| chr4_+_8256611 | 0.44 |
ENSRNOT00000061894
|
AABR07059198.1
|
|
| chrX_-_10218583 | 0.43 |
ENSRNOT00000013382
|
Nyx
|
nyctalopin |
| chr5_-_134526089 | 0.43 |
ENSRNOT00000013321
|
Cyp4b1
|
cytochrome P450, family 4, subfamily b, polypeptide 1 |
| chr15_-_27815261 | 0.39 |
ENSRNOT00000032992
|
Klhl33
|
kelch-like family member 33 |
| chr9_+_117795132 | 0.35 |
ENSRNOT00000086943
|
Akain1
|
A-kinase anchor inhibitor 1 |
| chr10_+_84147836 | 0.35 |
ENSRNOT00000010527
|
Hoxb6
|
homeo box B6 |
| chr5_-_12526962 | 0.30 |
ENSRNOT00000092104
|
St18
|
suppression of tumorigenicity 18 |
| chr3_+_110975923 | 0.27 |
ENSRNOT00000016458
|
Gchfr
|
GTP cyclohydrolase I feedback regulator |
| chr8_-_61919874 | 0.25 |
ENSRNOT00000064830
|
RGD1305464
|
similar to human chromosome 15 open reading frame 39 |
| chr13_+_90723092 | 0.25 |
ENSRNOT00000010146
|
Kcnj10
|
ATP-sensitive inward rectifier potassium channel 10 |
| chr18_+_79406381 | 0.24 |
ENSRNOT00000022303
ENSRNOT00000058295 ENSRNOT00000058296 ENSRNOT00000022280 |
Mbp
|
myelin basic protein |
| chr2_+_226900619 | 0.23 |
ENSRNOT00000019638
|
Pde5a
|
phosphodiesterase 5A |
| chr20_-_12351813 | 0.22 |
ENSRNOT00000065236
|
Slc19a1
|
solute carrier family 19 member 1 |
| chr3_+_149668102 | 0.20 |
ENSRNOT00000055342
|
Bpifb1
|
BPI fold containing family B, member 1 |
| chr5_-_126395668 | 0.20 |
ENSRNOT00000010396
|
Acot11
|
acyl-CoA thioesterase 11 |
| chr1_-_124803363 | 0.19 |
ENSRNOT00000066380
|
Klf13
|
Kruppel-like factor 13 |
| chr4_+_7355574 | 0.19 |
ENSRNOT00000013800
|
Kcnh2
|
potassium voltage-gated channel subfamily H member 2 |
| chr8_+_116154736 | 0.19 |
ENSRNOT00000021218
|
Cacna2d2
|
calcium voltage-gated channel auxiliary subunit alpha2delta 2 |
| chr16_+_54291251 | 0.18 |
ENSRNOT00000079006
|
Mtus1
|
microtubule associated tumor suppressor 1 |
| chr4_+_169161585 | 0.18 |
ENSRNOT00000079785
|
Emp1
|
epithelial membrane protein 1 |
| chr9_+_9970209 | 0.18 |
ENSRNOT00000075215
|
Dennd1c
|
DENN/MADD domain containing 1C |
| chr10_-_104681377 | 0.18 |
ENSRNOT00000046026
|
Trim65
|
tripartite motif-containing 65 |
| chr11_+_31002451 | 0.18 |
ENSRNOT00000002838
|
Eva1c
|
eva-1 homolog C |
| chr12_+_41543696 | 0.17 |
ENSRNOT00000079639
|
Tpcn1
|
two pore segment channel 1 |
| chr10_-_104163634 | 0.17 |
ENSRNOT00000005198
|
Mif4gd
|
MIF4G domain containing |
| chr16_-_74122889 | 0.17 |
ENSRNOT00000025763
|
Plat
|
plasminogen activator, tissue type |
| chr1_-_162385575 | 0.17 |
ENSRNOT00000016540
|
Thrsp
|
thyroid hormone responsive |
| chr5_+_136669674 | 0.16 |
ENSRNOT00000048770
|
Slc6a9
|
solute carrier family 6 member 9 |
| chr6_-_104631355 | 0.16 |
ENSRNOT00000007825
|
Slc10a1
|
solute carrier family 10 member 1 |
| chr14_-_103321270 | 0.16 |
ENSRNOT00000006157
|
Meis1
|
Meis homeobox 1 |
| chr7_-_11001933 | 0.15 |
ENSRNOT00000084006
|
Tle2
|
transducin-like enhancer of split 2 |
| chr1_+_147021436 | 0.14 |
ENSRNOT00000042490
|
F8a1
|
coagulation factor VIII-associated 1 |
| chr13_-_80379929 | 0.14 |
ENSRNOT00000067653
ENSRNOT00000075938 |
Dnm3
|
dynamin 3 |
| chr3_-_105512939 | 0.14 |
ENSRNOT00000011773
|
Actc1
|
actin, alpha, cardiac muscle 1 |
| chr4_+_62019970 | 0.14 |
ENSRNOT00000013133
|
LOC100910708
|
aldose reductase-related protein 1-like |
| chr4_+_7377563 | 0.14 |
ENSRNOT00000084826
|
Kcnh2
|
potassium voltage-gated channel subfamily H member 2 |
| chr4_+_144382945 | 0.14 |
ENSRNOT00000007601
|
Cav3
|
caveolin 3 |
| chr3_-_3574787 | 0.13 |
ENSRNOT00000087651
|
Nacc2
|
NACC family member 2 |
| chr17_+_24416651 | 0.13 |
ENSRNOT00000024458
|
Cd83
|
CD83 molecule |
| chr17_-_43640387 | 0.13 |
ENSRNOT00000087731
|
Hist1h1c
|
histone cluster 1 H1 family member c |
| chr7_-_142348232 | 0.12 |
ENSRNOT00000078848
|
Galnt6
|
polypeptide N-acetylgalactosaminyltransferase 6 |
| chr13_+_52588917 | 0.12 |
ENSRNOT00000011999
|
Phlda3
|
pleckstrin homology-like domain, family A, member 3 |
| chr1_+_221099998 | 0.11 |
ENSRNOT00000028262
|
Ltbp3
|
latent transforming growth factor beta binding protein 3 |
| chr4_-_117575154 | 0.11 |
ENSRNOT00000075813
|
LOC102556148
|
probable N-acetyltransferase CML2-like |
| chr9_+_81615251 | 0.11 |
ENSRNOT00000081106
ENSRNOT00000020049 |
Pnkd
|
paroxysmal nonkinesigenic dyskinesia |
| chr1_-_89543967 | 0.11 |
ENSRNOT00000079631
|
Hpn
|
hepsin |
| chr2_-_195908037 | 0.11 |
ENSRNOT00000079776
|
Tuft1
|
tuftelin 1 |
| chr13_-_94289333 | 0.11 |
ENSRNOT00000078195
|
Pld5
|
phospholipase D family, member 5 |
| chr1_-_184188911 | 0.11 |
ENSRNOT00000055124
ENSRNOT00000014948 |
Calca
|
calcitonin-related polypeptide alpha |
| chr1_-_221281180 | 0.11 |
ENSRNOT00000028379
|
Cdc42ep2
|
CDC42 effector protein 2 |
| chr2_+_95320283 | 0.10 |
ENSRNOT00000015537
|
Hey1
|
hes-related family bHLH transcription factor with YRPW motif 1 |
| chr2_-_195888216 | 0.10 |
ENSRNOT00000056436
|
Tuft1
|
tuftelin 1 |
| chr14_+_84237520 | 0.10 |
ENSRNOT00000083580
|
Gal3st1
|
galactose-3-O-sulfotransferase 1 |
| chr5_+_120568242 | 0.10 |
ENSRNOT00000050597
|
Lepr
|
leptin receptor |
| chr17_+_80882666 | 0.10 |
ENSRNOT00000024430
|
Vim
|
vimentin |
| chr13_+_112031594 | 0.10 |
ENSRNOT00000008440
|
Lamb3
|
laminin subunit beta 3 |
| chr8_+_116154913 | 0.09 |
ENSRNOT00000081242
|
Cacna2d2
|
calcium voltage-gated channel auxiliary subunit alpha2delta 2 |
| chr10_+_65586504 | 0.09 |
ENSRNOT00000015535
ENSRNOT00000046388 |
Aldoc
|
aldolase, fructose-bisphosphate C |
| chr1_-_100669684 | 0.09 |
ENSRNOT00000091760
|
Myh14
|
myosin heavy chain 14 |
| chr1_+_59129951 | 0.09 |
ENSRNOT00000017165
|
Riok2
|
RIO kinase 2 |
| chr1_+_221538104 | 0.09 |
ENSRNOT00000028527
|
Batf2
|
basic leucine zipper ATF-like transcription factor 2 |
| chr12_-_46809849 | 0.09 |
ENSRNOT00000081134
|
Pxn
|
paxillin |
| chr1_-_49844547 | 0.08 |
ENSRNOT00000086127
ENSRNOT00000077423 ENSRNOT00000089439 ENSRNOT00000090521 |
AABR07001519.1
|
|
| chr13_+_47454591 | 0.08 |
ENSRNOT00000005791
|
LOC498222
|
similar to specifically androgen-regulated protein |
| chr1_-_89473904 | 0.08 |
ENSRNOT00000089474
|
Fxyd5
|
FXYD domain-containing ion transport regulator 5 |
| chr10_+_730247 | 0.07 |
ENSRNOT00000083714
|
Fopnl
|
FGFR1OP N-terminal like |
| chr4_+_62220736 | 0.07 |
ENSRNOT00000086377
|
Cald1
|
caldesmon 1 |
| chr2_+_93792601 | 0.07 |
ENSRNOT00000014701
ENSRNOT00000077311 |
Fabp4
|
fatty acid binding protein 4 |
| chr13_-_100672731 | 0.07 |
ENSRNOT00000004319
|
Degs1
|
delta(4)-desaturase, sphingolipid 1 |
| chr10_+_17486579 | 0.07 |
ENSRNOT00000080404
|
Stk10
|
serine/threonine kinase 10 |
| chr12_-_14244316 | 0.07 |
ENSRNOT00000001466
|
Foxk1
|
forkhead box K1 |
| chr3_-_175327689 | 0.07 |
ENSRNOT00000082981
|
Taf4
|
TATA-box binding protein associated factor 4 |
| chr1_+_135083974 | 0.07 |
ENSRNOT00000016481
ENSRNOT00000076098 |
Fam174b
|
family with sequence similarity 174, member B |
| chr7_+_18409147 | 0.07 |
ENSRNOT00000086336
ENSRNOT00000011849 |
Adamts10
|
ADAM metallopeptidase with thrombospondin type 1 motif, 10 |
| chr3_-_151224123 | 0.07 |
ENSRNOT00000026091
|
Trpc4ap
|
transient receptor potential cation channel, subfamily C, member 4 associated protein |
| chrX_+_156909913 | 0.07 |
ENSRNOT00000084390
|
L1cam
|
L1 cell adhesion molecule |
| chr7_-_60742660 | 0.07 |
ENSRNOT00000086116
|
Mdm2
|
MDM2 proto-oncogene |
| chr14_+_10534423 | 0.07 |
ENSRNOT00000002983
|
Hpse
|
heparanase |
| chr20_-_7307280 | 0.06 |
ENSRNOT00000000583
ENSRNOT00000079933 |
Spdef
|
SAM pointed domain containing ets transcription factor |
| chr4_+_71675383 | 0.06 |
ENSRNOT00000051265
|
Clcn1
|
chloride voltage-gated channel 1 |
| chr1_+_184299250 | 0.06 |
ENSRNOT00000030540
|
Insc
|
inscuteable homolog (Drosophila) |
| chrX_+_122724129 | 0.06 |
ENSRNOT00000017746
|
LOC100360218
|
interleukin 13 receptor, alpha 1-like |
| chr1_+_266781617 | 0.06 |
ENSRNOT00000027417
|
Ina
|
internexin neuronal intermediate filament protein, alpha |
| chr3_+_63510293 | 0.06 |
ENSRNOT00000058093
|
Dfnb59
|
deafness, autosomal recessive 59 |
| chr12_+_40553741 | 0.06 |
ENSRNOT00000057396
|
LOC100360238
|
rCG21419-like |
| chr2_-_206997519 | 0.06 |
ENSRNOT00000027042
|
Lrig2
|
leucine-rich repeats and immunoglobulin-like domains 2 |
| chr20_+_1749716 | 0.06 |
ENSRNOT00000048856
|
Olr1735
|
olfactory receptor 1735 |
| chr5_+_60900450 | 0.06 |
ENSRNOT00000016384
|
Dcaf10
|
DDB1 and CUL4 associated factor 10 |
| chr14_+_46001849 | 0.06 |
ENSRNOT00000076611
|
Rell1
|
RELT-like 1 |
| chr8_-_85413484 | 0.05 |
ENSRNOT00000010961
|
Fbxo9
|
f-box protein 9 |
| chr6_-_62798384 | 0.05 |
ENSRNOT00000093200
|
Ndufa10l1
|
NADH dehydrogenase (ubiquinone) 1 alpha subcomplex 10-like 1 |
| chr2_-_154418920 | 0.05 |
ENSRNOT00000076326
|
Plch1
|
phospholipase C, eta 1 |
| chr7_+_142575672 | 0.05 |
ENSRNOT00000080923
ENSRNOT00000008160 |
Scn8a
|
sodium voltage-gated channel alpha subunit 8 |
| chrX_-_81817101 | 0.05 |
ENSRNOT00000003730
|
AABR07039648.1
|
|
| chr4_+_85662892 | 0.05 |
ENSRNOT00000016175
ENSRNOT00000043851 ENSRNOT00000035722 ENSRNOT00000046192 |
Adcyap1r1
|
adenylate cyclase activating polypeptide 1 receptor type 1 |
| chr2_+_199831990 | 0.05 |
ENSRNOT00000063783
ENSRNOT00000086588 |
Prkab2
|
protein kinase AMP-activated non-catalytic subunit beta 2 |
| chr12_+_16988136 | 0.05 |
ENSRNOT00000078925
ENSRNOT00000036744 |
Micall2
|
MICAL-like 2 |
| chr12_-_37538403 | 0.05 |
ENSRNOT00000001402
|
Snrnp35
|
small nuclear ribonucleoprotein U11/U12 subunit 35 |
| chr20_+_27954433 | 0.05 |
ENSRNOT00000064288
|
Lims1
|
LIM zinc finger domain containing 1 |
| chr4_-_17594598 | 0.05 |
ENSRNOT00000008936
|
Sema3e
|
semaphorin 3E |
| chrX_+_63343546 | 0.05 |
ENSRNOT00000076315
|
Klhl15
|
kelch-like family member 15 |
| chr5_+_8876044 | 0.05 |
ENSRNOT00000008877
|
Cops5
|
COP9 signalosome subunit 5 |
| chr20_-_2212171 | 0.05 |
ENSRNOT00000085912
|
Trim26
|
tripartite motif-containing 26 |
| chr2_-_252691886 | 0.04 |
ENSRNOT00000068739
|
Prkacb
|
protein kinase cAMP-activated catalytic subunit beta |
| chr1_+_225048149 | 0.04 |
ENSRNOT00000036454
|
Lrrn4cl
|
LRRN4 C-terminal like |
| chr17_-_2705123 | 0.04 |
ENSRNOT00000024940
|
Olr1652
|
olfactory receptor 1652 |
| chr10_-_56289882 | 0.04 |
ENSRNOT00000090762
ENSRNOT00000056903 |
Tnfsf13
|
tumor necrosis factor superfamily member 13 |
| chrX_+_43881246 | 0.04 |
ENSRNOT00000005153
|
LOC317456
|
hypothetical LOC317456 |
| chr13_+_89919667 | 0.04 |
ENSRNOT00000006196
|
Itln1
|
intelectin 1 |
| chr16_+_23668595 | 0.04 |
ENSRNOT00000067886
|
Psd3
|
pleckstrin and Sec7 domain containing 3 |
| chrX_-_135521598 | 0.04 |
ENSRNOT00000033619
|
Gpr119
|
G protein-coupled receptor 119 |
| chr13_+_51034256 | 0.04 |
ENSRNOT00000004528
ENSRNOT00000046854 ENSRNOT00000087320 |
Mybph
|
myosin binding protein H |
| chr18_-_36579403 | 0.04 |
ENSRNOT00000025284
|
Lars
|
leucyl-tRNA synthetase |
| chr4_+_157126935 | 0.04 |
ENSRNOT00000056051
|
C1r
|
complement C1r |
| chr5_-_173098816 | 0.04 |
ENSRNOT00000023696
|
Mib2
|
mindbomb E3 ubiquitin protein ligase 2 |
| chrX_-_138972684 | 0.04 |
ENSRNOT00000040165
|
Hs6st2
|
heparan sulfate 6-O-sulfotransferase 2 |
| chr1_-_89042176 | 0.04 |
ENSRNOT00000080842
|
Kmt2b
|
lysine methyltransferase 2B |
| chr1_-_198104109 | 0.03 |
ENSRNOT00000026186
|
Sult1a1
|
sulfotransferase family 1A member 1 |
| chr18_+_68408890 | 0.03 |
ENSRNOT00000039702
|
Ccdc68
|
coiled-coil domain containing 68 |
| chr1_+_170383682 | 0.03 |
ENSRNOT00000024224
|
Smpd1
|
sphingomyelin phosphodiesterase 1 |
| chr4_+_169147243 | 0.03 |
ENSRNOT00000011580
|
Emp1
|
epithelial membrane protein 1 |
| chr10_+_105630810 | 0.03 |
ENSRNOT00000064904
|
Prcd
|
photoreceptor disc component |
| chr5_-_126911520 | 0.03 |
ENSRNOT00000091521
|
Dio1
|
deiodinase, iodothyronine, type I |
| chr17_-_14627937 | 0.03 |
ENSRNOT00000020532
|
NEWGENE_1308171
|
osteoglycin |
| chr9_-_94495333 | 0.03 |
ENSRNOT00000021507
|
Kcnj13
|
potassium voltage-gated channel subfamily J member 13 |
| chr5_-_138697641 | 0.03 |
ENSRNOT00000012062
|
Guca2b
|
guanylate cyclase activator 2B |
| chr7_-_70926903 | 0.03 |
ENSRNOT00000031005
|
Lrp1
|
LDL receptor related protein 1 |
| chr3_-_2689084 | 0.03 |
ENSRNOT00000020926
|
Ptgds
|
prostaglandin D2 synthase |
| chr8_-_116045954 | 0.03 |
ENSRNOT00000020065
|
Mapkapk3
|
mitogen-activated protein kinase-activated protein kinase 3 |
| chr5_-_172424081 | 0.03 |
ENSRNOT00000019096
|
Plch2
|
phospholipase C, eta 2 |
| chr17_-_90756048 | 0.03 |
ENSRNOT00000085669
|
Ero1b
|
endoplasmic reticulum oxidoreductase 1 beta |
| chr17_+_43679411 | 0.03 |
ENSRNOT00000085865
|
AC130391.3
|
|
| chr10_-_11942885 | 0.03 |
ENSRNOT00000061019
|
Olr1356
|
olfactory receptor 1356 |
| chr10_+_57322331 | 0.03 |
ENSRNOT00000041493
|
Kif1c
|
kinesin family member 1C |
| chr6_+_107245820 | 0.03 |
ENSRNOT00000012757
|
Papln
|
papilin, proteoglycan-like sulfated glycoprotein |
| chr11_+_30363280 | 0.03 |
ENSRNOT00000002885
|
Sod1
|
superoxide dismutase 1, soluble |
| chr16_-_83132785 | 0.03 |
ENSRNOT00000043449
|
Arhgef7
|
Rho guanine nucleotide exchange factor 7 |
| chr1_-_48565711 | 0.03 |
ENSRNOT00000023387
|
AABR07001512.1
|
|
| chr20_-_2211995 | 0.03 |
ENSRNOT00000077201
|
Trim26
|
tripartite motif-containing 26 |
| chr1_-_85368031 | 0.03 |
ENSRNOT00000026778
|
Paf1
|
PAF1 homolog, Paf1/RNA polymerase II complex component |
| chrX_-_159841072 | 0.03 |
ENSRNOT00000001158
|
Arhgef6
|
Rac/Cdc42 guanine nucleotide exchange factor 6 |
| chr2_-_196304169 | 0.03 |
ENSRNOT00000028639
|
Scnm1
|
sodium channel modifier 1 |
| chr20_-_6864387 | 0.03 |
ENSRNOT00000068527
|
Ppil1
|
peptidylprolyl isomerase like 1 |
| chr8_-_111107599 | 0.03 |
ENSRNOT00000031313
|
Cep63
|
centrosomal protein 63 |
| chr10_+_83201311 | 0.03 |
ENSRNOT00000006179
|
Slc35b1
|
solute carrier family 35, member B1 |
| chr7_+_119647375 | 0.03 |
ENSRNOT00000046563
|
Kctd17
|
potassium channel tetramerization domain containing 17 |
| chr12_+_41316764 | 0.03 |
ENSRNOT00000090867
|
Oas3
|
2'-5'-oligoadenylate synthetase 3 |
| chr17_+_42302540 | 0.02 |
ENSRNOT00000025389
|
Gmnn
|
geminin, DNA replication inhibitor |
| chr13_+_79269973 | 0.02 |
ENSRNOT00000003969
|
Tnfsf4
|
tumor necrosis factor superfamily member 4 |
| chr7_-_143016040 | 0.02 |
ENSRNOT00000029697
|
Krt80
|
keratin 80 |
| chr4_-_117111653 | 0.02 |
ENSRNOT00000057537
|
Sfxn5
|
sideroflexin 5 |
| chr16_+_20824864 | 0.02 |
ENSRNOT00000092293
ENSRNOT00000092446 |
Upf1
|
UPF1, RNA helicase and ATPase |
| chr8_-_60830448 | 0.02 |
ENSRNOT00000022419
|
Tspan3
|
tetraspanin 3 |
| chr10_+_13736313 | 0.02 |
ENSRNOT00000079700
|
Abca3
|
ATP binding cassette subfamily A member 3 |
| chr20_-_2224463 | 0.02 |
ENSRNOT00000001019
|
Trim26
|
tripartite motif-containing 26 |
| chr1_+_91433030 | 0.02 |
ENSRNOT00000015205
|
Slc7a10
|
solute carrier family 7 member 10 |
| chr1_-_199336451 | 0.02 |
ENSRNOT00000035672
|
Prss53
|
protease, serine, 53 |
| chr17_+_85364483 | 0.02 |
ENSRNOT00000064257
|
Bmi1
|
BMI1 proto-oncogene, polycomb ring finger |
| chr3_+_109862117 | 0.02 |
ENSRNOT00000083351
ENSRNOT00000070912 |
Thbs1
|
thrombospondin 1 |
| chr7_+_76980040 | 0.02 |
ENSRNOT00000050726
|
LOC108350501
|
40S ribosomal protein S29 |
| chr5_+_152466331 | 0.02 |
ENSRNOT00000082841
|
LOC108351043
|
uncharacterized LOC108351043 |
| chr20_-_13142856 | 0.02 |
ENSRNOT00000001743
|
S100b
|
S100 calcium binding protein B |
| chr4_+_147692028 | 0.02 |
ENSRNOT00000014207
|
Cand2
|
cullin-associated and neddylation-dissociated 2 (putative) |
| chr13_+_90759260 | 0.02 |
ENSRNOT00000010551
|
Pigm
|
phosphatidylinositol glycan anchor biosynthesis, class M |
| chrX_-_156589907 | 0.02 |
ENSRNOT00000083147
|
Opn1mw
|
opsin 1 (cone pigments), medium-wave-sensitive |
| chr3_-_2770620 | 0.02 |
ENSRNOT00000008253
|
Traf2
|
Tnf receptor-associated factor 2 |
| chr8_+_116857684 | 0.02 |
ENSRNOT00000026711
|
Mst1
|
macrophage stimulating 1 |
| chr10_+_86860685 | 0.02 |
ENSRNOT00000084644
|
Rara
|
retinoic acid receptor, alpha |
| chr14_-_8510138 | 0.02 |
ENSRNOT00000080758
|
Arhgap24
|
Rho GTPase activating protein 24 |
| chr7_-_70842405 | 0.02 |
ENSRNOT00000047449
|
Nxph4
|
neurexophilin 4 |
| chr2_-_187622373 | 0.02 |
ENSRNOT00000026396
|
Rhbg
|
Rh family B glycoprotein |
| chr18_+_86071662 | 0.01 |
ENSRNOT00000064901
|
Rttn
|
rotatin |
| chr1_+_215214853 | 0.01 |
ENSRNOT00000071235
ENSRNOT00000080442 |
LOC103690160
|
SH3 and multiple ankyrin repeat domains protein 2-like |
| chr1_+_212578450 | 0.01 |
ENSRNOT00000064501
|
Paox
|
polyamine oxidase |
| chrX_+_115561332 | 0.01 |
ENSRNOT00000076680
ENSRNOT00000075912 ENSRNOT00000007968 |
Alg13
|
ALG13, UDP-N-acetylglucosaminyltransferase subunit |
| chr10_-_82326771 | 0.01 |
ENSRNOT00000004673
|
Acsf2
|
acyl-CoA synthetase family member 2 |
| chr12_-_37688743 | 0.01 |
ENSRNOT00000030251
|
RGD1563482
|
similar to hypothetical protein FLJ38663 |
| chr15_+_10462749 | 0.01 |
ENSRNOT00000008035
|
Oxsm
|
3-oxoacyl-ACP synthase, mitochondrial |
| chr1_-_101514547 | 0.01 |
ENSRNOT00000079633
|
Ppp1r15a
|
protein phosphatase 1, regulatory subunit 15A |
| chr2_+_180936688 | 0.01 |
ENSRNOT00000016039
|
Asic5
|
acid sensing ion channel subunit family member 5 |
| chr12_-_52187164 | 0.01 |
ENSRNOT00000056722
|
Galnt9
|
polypeptide N-acetylgalactosaminyltransferase 9 |
| chr4_-_60358562 | 0.01 |
ENSRNOT00000018001
|
Chchd3
|
coiled-coil-helix-coiled-coil-helix domain containing 3 |
| chr19_-_31867850 | 0.01 |
ENSRNOT00000024689
|
Anapc10
|
anaphase promoting complex subunit 10 |
| chr9_-_95362014 | 0.01 |
ENSRNOT00000051065
|
Hjurp
|
Holliday junction recognition protein |
| chr16_-_70006016 | 0.01 |
ENSRNOT00000092030
|
Gm1141
|
predicted gene 1141 |
| chr4_-_85386231 | 0.01 |
ENSRNOT00000015316
|
Inmt
|
indolethylamine N-methyltransferase |
| chr6_-_77421286 | 0.01 |
ENSRNOT00000011453
|
Nkx2-1
|
NK2 homeobox 1 |
| chrX_-_82743753 | 0.01 |
ENSRNOT00000003512
|
Rps6ka6
|
ribosomal protein S6 kinase A6 |
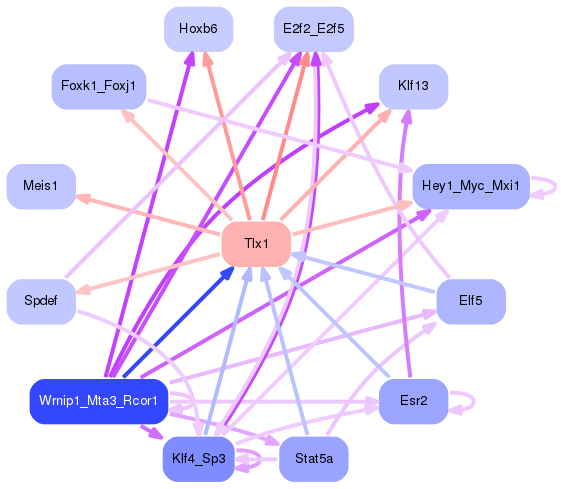
Network of associatons between targets according to the STRING database.

First level regulatory network of Tlx1
Gene Ontology Analysis
Gene overrepresentation in biological process category:
| Log-likelihood per target | Total log-likelihood | Term | Description |
|---|---|---|---|
| 0.1 | 1.1 | GO:0019372 | lipoxygenase pathway(GO:0019372) |
| 0.1 | 0.3 | GO:1902303 | negative regulation of potassium ion export(GO:1902303) |
| 0.1 | 0.7 | GO:0051045 | negative regulation of membrane protein ectodomain proteolysis(GO:0051045) |
| 0.1 | 0.2 | GO:0051935 | amino acid neurotransmitter reuptake(GO:0051933) glutamate reuptake(GO:0051935) |
| 0.1 | 0.2 | GO:1904209 | regulation of chemokine (C-C motif) ligand 2 secretion(GO:1904207) positive regulation of chemokine (C-C motif) ligand 2 secretion(GO:1904209) positive regulation of metalloendopeptidase activity(GO:1904685) |
| 0.1 | 0.5 | GO:1990086 | lens fiber cell apoptotic process(GO:1990086) |
| 0.1 | 0.5 | GO:0051970 | negative regulation of transmission of nerve impulse(GO:0051970) |
| 0.1 | 0.2 | GO:0051958 | methotrexate transport(GO:0051958) |
| 0.1 | 0.4 | GO:0018879 | biphenyl metabolic process(GO:0018879) |
| 0.1 | 0.2 | GO:0055118 | negative regulation of cardiac muscle contraction(GO:0055118) |
| 0.0 | 0.1 | GO:0035995 | detection of muscle stretch(GO:0035995) |
| 0.0 | 0.2 | GO:0060279 | positive regulation of ovulation(GO:0060279) |
| 0.0 | 0.1 | GO:1902460 | regulation of mesenchymal stem cell proliferation(GO:1902460) positive regulation of mesenchymal stem cell proliferation(GO:1902462) |
| 0.0 | 0.1 | GO:0034769 | basement membrane disassembly(GO:0034769) |
| 0.0 | 0.1 | GO:0001983 | baroreceptor response to increased systemic arterial blood pressure(GO:0001983) |
| 0.0 | 0.1 | GO:2000820 | negative regulation of transcription from RNA polymerase II promoter involved in smooth muscle cell differentiation(GO:2000820) |
| 0.0 | 0.1 | GO:0006682 | galactosylceramide biosynthetic process(GO:0006682) galactolipid biosynthetic process(GO:0019375) |
| 0.0 | 0.2 | GO:0060024 | rhythmic synaptic transmission(GO:0060024) |
| 0.0 | 0.1 | GO:1903999 | negative regulation of eating behavior(GO:1903999) regulation of locomotor rhythm(GO:1904059) |
| 0.0 | 0.1 | GO:0036135 | Schwann cell migration(GO:0036135) regulation of Schwann cell migration(GO:1900147) |
| 0.0 | 0.1 | GO:0061002 | sperm ejaculation(GO:0042713) negative regulation of dendritic spine morphogenesis(GO:0061002) neurotransmitter receptor internalization(GO:0099590) |
| 0.0 | 0.1 | GO:0032713 | negative regulation of interleukin-4 production(GO:0032713) |
| 0.0 | 0.1 | GO:0030200 | heparan sulfate proteoglycan catabolic process(GO:0030200) |
| 0.0 | 0.1 | GO:0061727 | methylglyoxal catabolic process to D-lactate via S-lactoyl-glutathione(GO:0019243) methylglyoxal catabolic process(GO:0051596) methylglyoxal catabolic process to lactate(GO:0061727) |
| 0.0 | 0.2 | GO:0034144 | negative regulation of toll-like receptor 4 signaling pathway(GO:0034144) |
| 0.0 | 0.2 | GO:0016584 | nucleosome positioning(GO:0016584) |
| 0.0 | 0.1 | GO:0030240 | skeletal muscle thin filament assembly(GO:0030240) |
| 0.0 | 0.2 | GO:0060012 | synaptic transmission, glycinergic(GO:0060012) |
| 0.0 | 0.1 | GO:0097069 | cellular response to thyroxine stimulus(GO:0097069) |
| 0.0 | 0.1 | GO:0035772 | interleukin-13-mediated signaling pathway(GO:0035772) |
| 0.0 | 0.0 | GO:0002426 | immunoglobulin production in mucosal tissue(GO:0002426) |
| 0.0 | 0.2 | GO:0045647 | negative regulation of erythrocyte differentiation(GO:0045647) |
| 0.0 | 0.0 | GO:0006438 | valyl-tRNA aminoacylation(GO:0006438) |
| 0.0 | 0.0 | GO:0015015 | heparan sulfate proteoglycan biosynthetic process, enzymatic modification(GO:0015015) |
| 0.0 | 0.0 | GO:0000294 | nuclear-transcribed mRNA catabolic process, endonucleolytic cleavage-dependent decay(GO:0000294) |
| 0.0 | 0.1 | GO:0000056 | ribosomal small subunit export from nucleus(GO:0000056) |
| 0.0 | 0.4 | GO:0010738 | regulation of protein kinase A signaling(GO:0010738) |
Gene overrepresentation in cellular component category:
| Log-likelihood per target | Total log-likelihood | Term | Description |
|---|---|---|---|
| 0.0 | 1.1 | GO:0042629 | mast cell granule(GO:0042629) |
| 0.0 | 0.2 | GO:0033269 | internode region of axon(GO:0033269) |
| 0.0 | 0.1 | GO:0097513 | myosin II filament(GO:0097513) |
| 0.0 | 0.1 | GO:0045098 | type III intermediate filament(GO:0045098) |
| 0.0 | 0.1 | GO:0030478 | actin cap(GO:0030478) |
| 0.0 | 0.1 | GO:0044327 | dendritic spine head(GO:0044327) |
| 0.0 | 0.2 | GO:0097449 | astrocyte projection(GO:0097449) |
| 0.0 | 0.1 | GO:0005610 | laminin-5 complex(GO:0005610) |
| 0.0 | 0.1 | GO:0005952 | cAMP-dependent protein kinase complex(GO:0005952) |
Gene overrepresentation in molecular function category:
| Log-likelihood per target | Total log-likelihood | Term | Description |
|---|---|---|---|
| 0.1 | 0.2 | GO:0015350 | methotrexate transporter activity(GO:0015350) |
| 0.1 | 0.2 | GO:0015272 | ATP-activated inward rectifier potassium channel activity(GO:0015272) |
| 0.1 | 0.1 | GO:0001515 | opioid peptide activity(GO:0001515) |
| 0.0 | 0.3 | GO:0000155 | phosphorelay sensor kinase activity(GO:0000155) |
| 0.0 | 0.2 | GO:0008508 | bile acid:sodium symporter activity(GO:0008508) |
| 0.0 | 0.4 | GO:0008191 | metalloendopeptidase inhibitor activity(GO:0008191) |
| 0.0 | 0.1 | GO:0031798 | type 1 metabotropic glutamate receptor binding(GO:0031798) |
| 0.0 | 0.2 | GO:0072345 | NAADP-sensitive calcium-release channel activity(GO:0072345) |
| 0.0 | 0.1 | GO:0035939 | microsatellite binding(GO:0035939) |
| 0.0 | 1.1 | GO:0004623 | phospholipase A2 activity(GO:0004623) |
| 0.0 | 0.1 | GO:0001733 | galactosylceramide sulfotransferase activity(GO:0001733) |
| 0.0 | 0.1 | GO:0042284 | sphingolipid delta-4 desaturase activity(GO:0042284) |
| 0.0 | 0.6 | GO:0005184 | neuropeptide hormone activity(GO:0005184) |
| 0.0 | 0.4 | GO:0015643 | toxic substance binding(GO:0015643) |
| 0.0 | 0.2 | GO:0019911 | structural constituent of myelin sheath(GO:0019911) |
| 0.0 | 0.1 | GO:0004416 | hydroxyacylglutathione hydrolase activity(GO:0004416) |
| 0.0 | 0.1 | GO:1990254 | keratin filament binding(GO:1990254) |
| 0.0 | 0.1 | GO:0050429 | calcium-dependent phospholipase C activity(GO:0050429) |
| 0.0 | 0.2 | GO:0047555 | 3',5'-cyclic-GMP phosphodiesterase activity(GO:0047555) |
| 0.0 | 0.1 | GO:0071253 | connexin binding(GO:0071253) |
| 0.0 | 0.1 | GO:0004999 | vasoactive intestinal polypeptide receptor activity(GO:0004999) |
| 0.0 | 0.4 | GO:0034237 | protein kinase A regulatory subunit binding(GO:0034237) |
| 0.0 | 0.2 | GO:0015187 | glycine transmembrane transporter activity(GO:0015187) |
| 0.0 | 0.1 | GO:0004332 | fructose-bisphosphate aldolase activity(GO:0004332) |
| 0.0 | 0.0 | GO:0004832 | valine-tRNA ligase activity(GO:0004832) |
| 0.0 | 0.0 | GO:0050656 | aryl sulfotransferase activity(GO:0004062) steroid sulfotransferase activity(GO:0050294) 3'-phosphoadenosine 5'-phosphosulfate binding(GO:0050656) |
| 0.0 | 0.1 | GO:0004653 | polypeptide N-acetylgalactosaminyltransferase activity(GO:0004653) |
Gene overrepresentation in curated gene sets: canonical pathways category:
| Log-likelihood per target | Total log-likelihood | Term | Description |
|---|---|---|---|
| 0.0 | 0.5 | SA REG CASCADE OF CYCLIN EXPR | Expression of cyclins regulates progression through the cell cycle by activating cyclin-dependent kinases. |
| 0.0 | 0.9 | PID IL4 2PATHWAY | IL4-mediated signaling events |
Gene overrepresentation in curated gene sets: REACTOME pathways category:
| Log-likelihood per target | Total log-likelihood | Term | Description |
|---|---|---|---|
| 0.1 | 1.1 | REACTOME ACYL CHAIN REMODELLING OF PG | Genes involved in Acyl chain remodelling of PG |
| 0.0 | 0.5 | REACTOME CDC6 ASSOCIATION WITH THE ORC ORIGIN COMPLEX | Genes involved in CDC6 association with the ORC:origin complex |
| 0.0 | 0.3 | REACTOME TETRAHYDROBIOPTERIN BH4 SYNTHESIS RECYCLING SALVAGE AND REGULATION | Genes involved in Tetrahydrobiopterin (BH4) synthesis, recycling, salvage and regulation |
| 0.0 | 0.6 | REACTOME ADHERENS JUNCTIONS INTERACTIONS | Genes involved in Adherens junctions interactions |
| 0.0 | 0.1 | REACTOME RECYCLING OF BILE ACIDS AND SALTS | Genes involved in Recycling of bile acids and salts |
| 0.0 | 0.1 | REACTOME APOPTOSIS INDUCED DNA FRAGMENTATION | Genes involved in Apoptosis induced DNA fragmentation |