Project
GSE49485: Hypoxia transcriptome sequencing of rat brain.
Navigation
Downloads
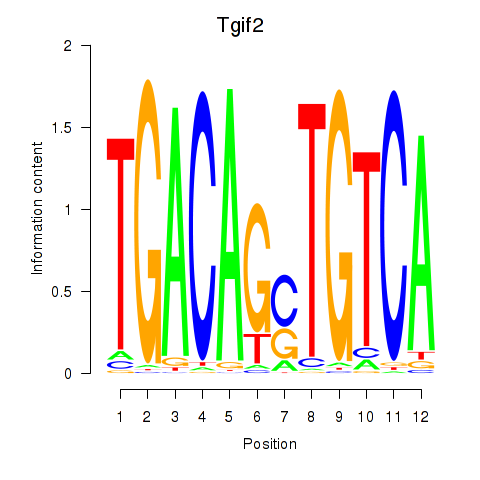
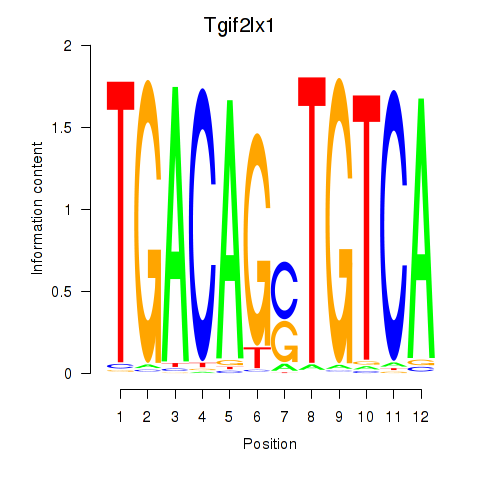
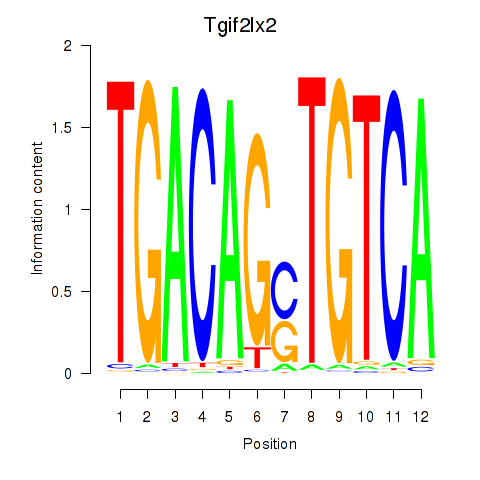
Results for Tgif2_Tgif2lx1_Tgif2lx2
Z-value: 0.73
Motif logo
Transcription factors associated with Tgif2_Tgif2lx1_Tgif2lx2
| Gene Symbol | Gene ID | Gene Info |
|---|---|---|
|
Tgif2
|
ENSRNOG00000042374 | TGFB-induced factor homeobox 2 |
|
Tgif2lx2
|
ENSRNOG00000029850 | TGFB-induced factor homeobox 2-like, X-linked 2 |
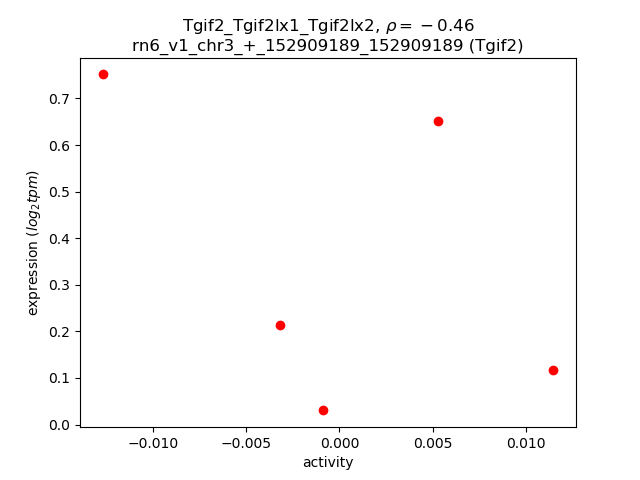
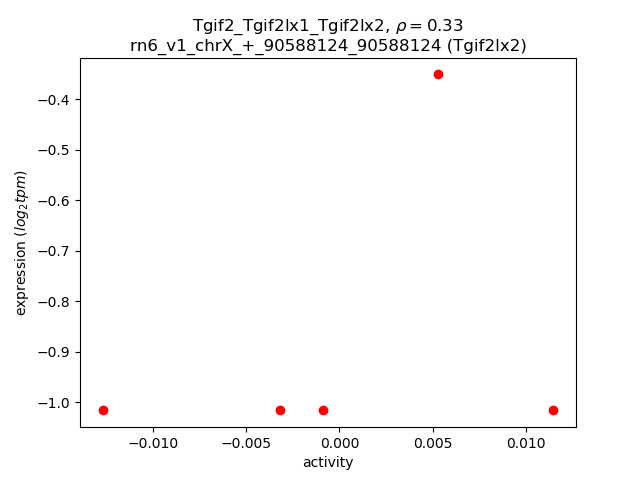
Activity-expression correlation:
| Gene | Promoter | Pearson corr. coef. | P-value | Plot |
|---|---|---|---|---|
| Tgif2 | rn6_v1_chr3_+_152909189_152909189 | -0.46 | 4.4e-01 | Click! |
| Tgif2lx2 | rn6_v1_chrX_+_90588124_90588124 | 0.33 | 5.9e-01 | Click! |
Activity profile of Tgif2_Tgif2lx1_Tgif2lx2 motif
Sorted Z-values of Tgif2_Tgif2lx1_Tgif2lx2 motif
| Promoter | Log-likelihood | Transcript | Gene | Gene Info |
|---|---|---|---|---|
| chr10_+_59529785 | 1.11 |
ENSRNOT00000064840
ENSRNOT00000065181 |
Atp2a3
|
ATPase sarcoplasmic/endoplasmic reticulum Ca2+ transporting 3 |
| chrX_+_136460215 | 0.88 |
ENSRNOT00000093538
|
Arhgap36
|
Rho GTPase activating protein 36 |
| chr2_+_204427608 | 0.74 |
ENSRNOT00000083374
|
Nhlh2
|
nescient helix loop helix 2 |
| chr5_+_154522119 | 0.62 |
ENSRNOT00000072618
|
E2f2
|
E2F transcription factor 2 |
| chr1_-_145870912 | 0.50 |
ENSRNOT00000016289
|
Il16
|
interleukin 16 |
| chr6_-_124876710 | 0.48 |
ENSRNOT00000073530
|
Gpr68
|
G protein-coupled receptor 68 |
| chr16_-_20888907 | 0.43 |
ENSRNOT00000027428
|
Homer3
|
homer scaffolding protein 3 |
| chr8_+_116776494 | 0.41 |
ENSRNOT00000050702
|
Cdhr4
|
cadherin-related family member 4 |
| chr4_-_130659697 | 0.37 |
ENSRNOT00000072374
|
LOC100363436
|
rCG56280-like |
| chr10_-_59883839 | 0.33 |
ENSRNOT00000093579
|
Aspa
|
aspartoacylase |
| chr4_+_144382945 | 0.27 |
ENSRNOT00000007601
|
Cav3
|
caveolin 3 |
| chr10_+_86303727 | 0.26 |
ENSRNOT00000037752
|
Ppp1r1b
|
protein phosphatase 1, regulatory (inhibitor) subunit 1B |
| chr10_+_58342393 | 0.25 |
ENSRNOT00000010358
|
Wscd1
|
WSC domain containing 1 |
| chr19_+_39357791 | 0.22 |
ENSRNOT00000086435
ENSRNOT00000015006 |
Cyb5b
|
cytochrome b5 type B |
| chr8_-_47494982 | 0.20 |
ENSRNOT00000012170
|
Pou2f3
|
POU class 2 homeobox 3 |
| chr9_-_43116521 | 0.19 |
ENSRNOT00000039437
|
Ankrd23
|
ankyrin repeat domain 23 |
| chr3_+_95707386 | 0.16 |
ENSRNOT00000005882
|
Pax6
|
paired box 6 |
| chr18_+_3565166 | 0.16 |
ENSRNOT00000039377
|
Riok3
|
RIO kinase 3 |
| chr15_+_24141651 | 0.15 |
ENSRNOT00000082304
|
Lgals3
|
galectin 3 |
| chr11_+_64472072 | 0.15 |
ENSRNOT00000042756
|
RGD1563835
|
similar to ribosomal protein L27 |
| chrX_+_63520991 | 0.14 |
ENSRNOT00000071590
|
Apoo
|
apolipoprotein O |
| chr10_-_103590607 | 0.14 |
ENSRNOT00000034741
|
Cd300le
|
Cd300 molecule-like family member E |
| chr10_+_74413989 | 0.14 |
ENSRNOT00000036098
|
Ska2
|
spindle and kinetochore associated complex subunit 2 |
| chr7_-_29152442 | 0.14 |
ENSRNOT00000079774
|
Mybpc1
|
myosin binding protein C, slow type |
| chr19_+_55423350 | 0.13 |
ENSRNOT00000019740
|
Trappc2l
|
trafficking protein particle complex 2-like |
| chr6_-_125317593 | 0.13 |
ENSRNOT00000074142
|
LOC102553138
|
ovarian cancer G-protein coupled receptor 1-like |
| chrX_-_23187341 | 0.13 |
ENSRNOT00000000180
|
Alas2
|
5'-aminolevulinate synthase 2 |
| chrX_+_123404518 | 0.12 |
ENSRNOT00000015085
|
Slc25a5
|
solute carrier family 25 member 5 |
| chr1_-_48070536 | 0.12 |
ENSRNOT00000020070
|
Mas1l
|
MAS1 proto-oncogene like, G protein-coupled receptor |
| chr1_-_266862842 | 0.12 |
ENSRNOT00000027496
|
LOC103693430
|
up-regulated during skeletal muscle growth protein 5 |
| chr2_+_22000106 | 0.11 |
ENSRNOT00000061812
|
Ankrd34b
|
ankyrin repeat domain 34B |
| chr4_+_79868442 | 0.11 |
ENSRNOT00000089973
|
Mpp6
|
membrane palmitoylated protein 6 |
| chr14_-_21709084 | 0.11 |
ENSRNOT00000087477
|
Smr3b
|
submaxillary gland androgen regulated protein 3B |
| chr1_+_171592797 | 0.11 |
ENSRNOT00000026607
|
Syt9
|
synaptotagmin 9 |
| chr3_-_121822436 | 0.11 |
ENSRNOT00000039794
|
Ckap2l
|
cytoskeleton associated protein 2-like |
| chr14_-_37763712 | 0.11 |
ENSRNOT00000030610
|
Zar1
|
zygote arrest 1 |
| chr3_+_103945329 | 0.11 |
ENSRNOT00000008364
|
Emc7
|
ER membrane protein complex subunit 7 |
| chr17_+_66548818 | 0.11 |
ENSRNOT00000024361
|
Anlnl1
|
anillin, actin binding protein-like 1 |
| chr3_-_72219246 | 0.11 |
ENSRNOT00000009903
|
Smtnl1
|
smoothelin-like 1 |
| chr1_-_80783898 | 0.10 |
ENSRNOT00000045306
|
Ceacam16
|
carcinoembryonic antigen-related cell adhesion molecule 16 |
| chr10_+_31813814 | 0.10 |
ENSRNOT00000009573
|
Havcr1
|
hepatitis A virus cellular receptor 1 |
| chr7_-_27136652 | 0.10 |
ENSRNOT00000086905
|
Hcfc2
|
host cell factor C2 |
| chr1_+_79727597 | 0.10 |
ENSRNOT00000034790
|
AC093995.1
|
|
| chr4_+_180123905 | 0.09 |
ENSRNOT00000083173
|
Rassf8
|
Ras association domain family member 8 |
| chr5_-_172809353 | 0.09 |
ENSRNOT00000022246
|
Gabrd
|
gamma-aminobutyric acid type A receptor delta subunit |
| chr2_-_259382765 | 0.08 |
ENSRNOT00000091407
|
St6galnac3
|
ST6 N-acetylgalactosaminide alpha-2,6-sialyltransferase 3 |
| chr20_-_46215120 | 0.08 |
ENSRNOT00000000336
|
Smpd2
|
sphingomyelin phosphodiesterase 2 |
| chr14_+_107767392 | 0.07 |
ENSRNOT00000012847
|
Cct4
|
chaperonin containing TCP1 subunit 4 |
| chr12_-_23592774 | 0.07 |
ENSRNOT00000001941
|
Polr2j
|
RNA polymerase II subunit J |
| chr9_-_21338582 | 0.07 |
ENSRNOT00000016940
|
Ptchd4
|
patched domain containing 4 |
| chr3_+_172195844 | 0.07 |
ENSRNOT00000034915
|
Npepl1
|
aminopeptidase-like 1 |
| chr14_+_39368530 | 0.07 |
ENSRNOT00000084367
|
Cox7b2
|
cytochrome c oxidase subunit 7B2 |
| chr10_+_95642640 | 0.07 |
ENSRNOT00000029782
|
RGD1359290
|
Ribosomal_L22 domain containing protein RGD1359290 |
| chr3_-_162147393 | 0.06 |
ENSRNOT00000025843
|
Slc13a3
|
solute carrier family 13 member 3 |
| chr6_+_10306405 | 0.06 |
ENSRNOT00000090420
ENSRNOT00000080507 |
Epas1
|
endothelial PAS domain protein 1 |
| chr10_-_74413745 | 0.06 |
ENSRNOT00000038296
|
Prr11
|
proline rich 11 |
| chr4_-_60358562 | 0.06 |
ENSRNOT00000018001
|
Chchd3
|
coiled-coil-helix-coiled-coil-helix domain containing 3 |
| chr18_+_57516347 | 0.06 |
ENSRNOT00000082215
|
Gm9949
|
predicted gene 9949 |
| chr16_-_26633796 | 0.06 |
ENSRNOT00000042181
|
Tmem192
|
transmembrane protein 192 |
| chr8_+_80662762 | 0.06 |
ENSRNOT00000057689
|
LOC100912027
|
60S ribosomal protein L27-like |
| chr15_-_33537146 | 0.06 |
ENSRNOT00000019992
|
Ppp1r3e
|
protein phosphatase 1, regulatory subunit 3E |
| chr8_-_105088401 | 0.06 |
ENSRNOT00000073068
|
LOC100365810
|
40S ribosomal protein S17-like |
| chr9_+_42871950 | 0.06 |
ENSRNOT00000089673
|
Arid5a
|
AT-rich interaction domain 5A |
| chr4_-_176679815 | 0.06 |
ENSRNOT00000090122
|
Gys2
|
glycogen synthase 2 |
| chr6_+_8669722 | 0.06 |
ENSRNOT00000048550
|
Camkmt
|
calmodulin-lysine N-methyltransferase |
| chr3_+_33641616 | 0.05 |
ENSRNOT00000051953
|
Epc2
|
enhancer of polycomb homolog 2 |
| chr3_+_11756384 | 0.05 |
ENSRNOT00000087762
|
Sh2d3c
|
SH2 domain containing 3C |
| chr5_-_58106706 | 0.05 |
ENSRNOT00000019561
|
Dctn3
|
dynactin subunit 3 |
| chrX_-_123980357 | 0.05 |
ENSRNOT00000049435
|
Rhox8
|
reproductive homeobox 8 |
| chr13_-_89668473 | 0.05 |
ENSRNOT00000004938
|
Ufc1
|
ubiquitin-fold modifier conjugating enzyme 1 |
| chr17_+_25228437 | 0.05 |
ENSRNOT00000072904
|
AABR07027342.1
|
|
| chrX_+_31984612 | 0.05 |
ENSRNOT00000005181
|
Bmx
|
BMX non-receptor tyrosine kinase |
| chr8_-_132027006 | 0.05 |
ENSRNOT00000050963
|
LOC367195
|
similar to 60S RIBOSOMAL PROTEIN L7 |
| chr3_+_149466770 | 0.05 |
ENSRNOT00000065104
|
Bpifa6
|
BPI fold containing family A, member 6 |
| chr12_+_37211316 | 0.05 |
ENSRNOT00000032739
|
Ccdc92
|
coiled-coil domain containing 92 |
| chr2_+_188543137 | 0.05 |
ENSRNOT00000027850
|
Muc1
|
mucin 1, cell surface associated |
| chr10_+_43224269 | 0.05 |
ENSRNOT00000003473
|
Sap30l
|
SAP30-like |
| chr10_-_108196217 | 0.05 |
ENSRNOT00000075440
|
Cbx4
|
chromobox 4 |
| chr3_+_117416345 | 0.05 |
ENSRNOT00000056054
|
Ctxn2
|
cortexin 2 |
| chr17_+_10537365 | 0.05 |
ENSRNOT00000023651
|
Cltb
|
clathrin, light chain B |
| chr3_-_13933658 | 0.05 |
ENSRNOT00000025433
|
Psmd5
|
proteasome 26S subunit, non-ATPase 5 |
| chr4_-_165026414 | 0.05 |
ENSRNOT00000071421
|
Klra1
|
killer cell lectin-like receptor, subfamily A, member 1 |
| chr6_+_10594122 | 0.05 |
ENSRNOT00000020534
|
Cript
|
CXXC repeat containing interactor of PDZ3 domain |
| chr7_-_25743537 | 0.05 |
ENSRNOT00000083450
|
LOC100910996
|
uncharacterized LOC100910996 |
| chr19_-_23554594 | 0.05 |
ENSRNOT00000004590
|
Il15
|
interleukin 15 |
| chr19_-_37216572 | 0.05 |
ENSRNOT00000020405
|
Tradd
|
TNFRSF1A-associated via death domain |
| chr12_-_30314519 | 0.05 |
ENSRNOT00000001220
|
Zbed5
|
zinc finger, BED-type containing 5 |
| chr16_+_74534130 | 0.05 |
ENSRNOT00000050637
|
Slc25a15
|
solute carrier family 25 member 15 |
| chrX_+_158351156 | 0.04 |
ENSRNOT00000080538
|
LOC100909732
|
protein FAM122B-like |
| chr9_-_89193821 | 0.04 |
ENSRNOT00000090881
|
Sphkap
|
SPHK1 interactor, AKAP domain containing |
| chr14_-_85982794 | 0.04 |
ENSRNOT00000076874
|
Urgcp
|
upregulator of cell proliferation |
| chr14_-_60276794 | 0.04 |
ENSRNOT00000048509
|
Slc34a2
|
solute carrier family 34 member 2 |
| chr7_-_74938663 | 0.04 |
ENSRNOT00000014333
|
Fbxo43
|
F-box protein 43 |
| chr4_-_179700130 | 0.04 |
ENSRNOT00000021306
|
Lmntd1
|
lamin tail domain containing 1 |
| chr12_+_40619377 | 0.04 |
ENSRNOT00000001822
ENSRNOT00000081016 |
Erp29
|
endoplasmic reticulum protein 29 |
| chr1_-_124803363 | 0.04 |
ENSRNOT00000066380
|
Klf13
|
Kruppel-like factor 13 |
| chr7_+_143810892 | 0.04 |
ENSRNOT00000016240
|
Znf740
|
zinc finger protein 740 |
| chr5_-_2803855 | 0.04 |
ENSRNOT00000009490
|
LOC297756
|
ribosomal protein S8-like |
| chr19_+_25123724 | 0.04 |
ENSRNOT00000007407
|
LOC686013
|
hypothetical protein LOC686013 |
| chr19_+_29320701 | 0.04 |
ENSRNOT00000049600
|
Polr2m
|
polymerase (RNA) II (DNA directed) polypeptide M |
| chr15_+_5319916 | 0.04 |
ENSRNOT00000046644
|
LOC102546495
|
disks large homolog 5-like |
| chr5_+_126511350 | 0.04 |
ENSRNOT00000011408
|
Ssbp3
|
single stranded DNA binding protein 3 |
| chr1_+_82089922 | 0.03 |
ENSRNOT00000071251
|
Zfp526
|
zinc finger protein 526 |
| chr2_-_202470399 | 0.03 |
ENSRNOT00000026726
|
Wdr3
|
WD repeat domain 3 |
| chr5_+_169364306 | 0.03 |
ENSRNOT00000014213
|
Acot7
|
acyl-CoA thioesterase 7 |
| chr11_-_47122095 | 0.03 |
ENSRNOT00000002194
|
Rpl24
|
ribosomal protein L24 |
| chrX_-_1848904 | 0.03 |
ENSRNOT00000010984
|
Rgn
|
regucalcin |
| chr17_-_42127678 | 0.03 |
ENSRNOT00000024196
|
Gpld1
|
glycosylphosphatidylinositol specific phospholipase D1 |
| chr9_+_10885560 | 0.03 |
ENSRNOT00000072870
|
Mydgf
|
myeloid-derived growth factor |
| chr14_-_18704059 | 0.03 |
ENSRNOT00000081455
|
Mthfd2l
|
methylenetetrahydrofolate dehydrogenase (NADP+ dependent) 2-like |
| chr5_-_136721379 | 0.03 |
ENSRNOT00000026704
|
Atp6v0b
|
ATPase H+ transporting V0 subunit B |
| chr9_+_118332517 | 0.03 |
ENSRNOT00000031943
|
LOC103690198
|
taste receptor type 2 member 143 |
| chr10_-_71837851 | 0.03 |
ENSRNOT00000000258
|
Aatf
|
apoptosis antagonizing transcription factor |
| chr17_+_28504623 | 0.03 |
ENSRNOT00000021568
|
F13a1
|
coagulation factor XIII A1 chain |
| chr6_-_108120579 | 0.03 |
ENSRNOT00000041163
|
Entpd5
|
ectonucleoside triphosphate diphosphohydrolase 5 |
| chr12_-_11783232 | 0.03 |
ENSRNOT00000075888
|
Zfp498
|
zinc finger protein 498 |
| chr14_+_82867946 | 0.03 |
ENSRNOT00000075130
|
Spon2
|
spondin 2 |
| chr15_-_27855999 | 0.03 |
ENSRNOT00000013225
|
Tmem55b
|
transmembrane protein 55B |
| chr14_-_14390699 | 0.03 |
ENSRNOT00000046639
|
Anxa3
|
annexin A3 |
| chr3_+_149144795 | 0.03 |
ENSRNOT00000015482
|
Dnmt3b
|
DNA methyltransferase 3 beta |
| chr16_+_9907598 | 0.03 |
ENSRNOT00000027352
|
Ptpn20
|
protein tyrosine phosphatase, non-receptor type 20 |
| chr4_+_71790701 | 0.03 |
ENSRNOT00000085902
|
Tas2r143
|
taste receptor, type 2, member 143 |
| chr5_-_14367898 | 0.03 |
ENSRNOT00000065402
|
Atp6v1h
|
ATPase H+ transporting V1 subunit H |
| chr10_-_45726524 | 0.03 |
ENSRNOT00000050370
|
Prss38
|
protease, serine, 38 |
| chr2_+_74360622 | 0.03 |
ENSRNOT00000014013
|
Cdh18
|
cadherin 18 |
| chrX_-_77675487 | 0.03 |
ENSRNOT00000042799
|
Cysltr1
|
cysteinyl leukotriene receptor 1 |
| chr5_+_78267248 | 0.03 |
ENSRNOT00000019910
|
Prpf4
|
pre-mRNA processing factor 4 |
| chr10_+_4945911 | 0.02 |
ENSRNOT00000003420
|
Prm1
|
protamine 1 |
| chr16_+_68586235 | 0.02 |
ENSRNOT00000039592
|
LOC103693984
|
uncharacterized LOC103693984 |
| chr2_-_80293181 | 0.02 |
ENSRNOT00000016111
|
Otulin
|
OTU deubiquitinase with linear linkage specificity |
| chr10_+_56591292 | 0.02 |
ENSRNOT00000023379
|
Ctdnep1
|
CTD nuclear envelope phosphatase 1 |
| chr12_-_41224254 | 0.02 |
ENSRNOT00000085747
|
Oas1h
|
2 ' -5 ' oligoadenylate synthetase 1H |
| chr10_+_43067299 | 0.02 |
ENSRNOT00000003447
|
Galnt10
|
polypeptide N-acetylgalactosaminyltransferase 10 |
| chr9_+_25304876 | 0.02 |
ENSRNOT00000065053
|
Tfap2d
|
transcription factor AP-2 delta |
| chr7_+_142397371 | 0.02 |
ENSRNOT00000040890
ENSRNOT00000065379 |
Slc4a8
|
solute carrier family 4 member 8 |
| chr13_+_51218468 | 0.02 |
ENSRNOT00000033636
|
LOC289035
|
similar to UDP-N-acetylglucosamine:a-1,3-D-mannoside beta-1,4-N-acetylgluco |
| chr7_+_70612103 | 0.02 |
ENSRNOT00000057833
|
Arhgap9
|
Rho GTPase activating protein 9 |
| chr12_-_38916237 | 0.02 |
ENSRNOT00000074517
|
Tmem120b
|
transmembrane protein 120B |
| chr7_-_140342727 | 0.02 |
ENSRNOT00000089612
|
Ddx23
|
DEAD-box helicase 23 |
| chr10_-_18574909 | 0.02 |
ENSRNOT00000083090
|
Kcnip1
|
potassium voltage-gated channel interacting protein 1 |
| chr5_+_173318479 | 0.02 |
ENSRNOT00000026725
|
Ints11
|
integrator complex subunit 11 |
| chr10_+_110445797 | 0.02 |
ENSRNOT00000054920
|
Narf
|
nuclear prelamin A recognition factor |
| chr6_+_10151729 | 0.02 |
ENSRNOT00000005786
|
Eif3h
|
eukaryotic translation initiation factor 3, subunit H |
| chr1_-_66645214 | 0.02 |
ENSRNOT00000084168
|
LOC100365062
|
eukaryotic translation initiation factor 3, subunit 6 48kDa-like |
| chr11_-_31805728 | 0.02 |
ENSRNOT00000032162
|
Gart
|
phosphoribosylglycinamide formyltransferase |
| chr1_+_63263722 | 0.02 |
ENSRNOT00000088203
|
LOC100911184
|
vomeronasal type-1 receptor 4-like |
| chr14_+_22517774 | 0.02 |
ENSRNOT00000047655
|
Ugt2b37
|
UDP-glucuronosyltransferase 2 family, member 37 |
| chr13_+_77940454 | 0.02 |
ENSRNOT00000003460
|
Mrps14
|
mitochondrial ribosomal protein S14 |
| chr9_+_53440272 | 0.02 |
ENSRNOT00000059159
|
LOC685203
|
hypothetical protein LOC685203 |
| chr20_-_7208292 | 0.02 |
ENSRNOT00000083169
|
Nudt3
|
nudix hydrolase 3 |
| chr6_+_125876109 | 0.02 |
ENSRNOT00000091300
|
Cpsf2
|
cleavage and polyadenylation specific factor 2 |
| chr3_-_72895740 | 0.02 |
ENSRNOT00000012568
|
Fads2l1
|
fatty acid desaturase 2-like 1 |
| chr20_+_55594676 | 0.02 |
ENSRNOT00000057010
|
Sim1
|
single-minded family bHLH transcription factor 1 |
| chr1_+_228317412 | 0.02 |
ENSRNOT00000028575
|
Olr319
|
olfactory receptor 319 |
| chr1_-_99135977 | 0.02 |
ENSRNOT00000056515
|
Vom2r38
|
vomeronasal 2 receptor, 38 |
| chr8_-_76239995 | 0.02 |
ENSRNOT00000071321
|
LOC100912027
|
60S ribosomal protein L27-like |
| chr5_+_33097654 | 0.02 |
ENSRNOT00000008087
|
Cngb3
|
cyclic nucleotide gated channel beta 3 |
| chr16_+_6035926 | 0.02 |
ENSRNOT00000020284
|
Selenok
|
selenoprotein K |
| chr10_+_15485905 | 0.02 |
ENSRNOT00000027609
|
Tmem8a
|
transmembrane protein 8A |
| chr1_-_100537377 | 0.02 |
ENSRNOT00000026599
|
Spib
|
Spi-B transcription factor |
| chr9_+_53626592 | 0.02 |
ENSRNOT00000031267
|
Mfsd6
|
major facilitator superfamily domain containing 6 |
| chr13_-_80862963 | 0.02 |
ENSRNOT00000004864
|
Fmo3
|
flavin containing monooxygenase 3 |
| chr1_+_31702485 | 0.02 |
ENSRNOT00000077740
|
Exoc3
|
exocyst complex component 3 |
| chr1_-_100671074 | 0.02 |
ENSRNOT00000027132
|
Myh14
|
myosin heavy chain 14 |
| chr1_+_88766872 | 0.02 |
ENSRNOT00000051259
|
Alkbh6
|
alkB homolog 6 |
| chr20_+_10981998 | 0.02 |
ENSRNOT00000001597
|
Rrp1
|
ribosomal RNA processing 1 |
| chr2_+_198797159 | 0.02 |
ENSRNOT00000056225
|
Ankrd35
|
ankyrin repeat domain 35 |
| chr6_+_129399468 | 0.02 |
ENSRNOT00000071735
ENSRNOT00000074621 |
Bdkrb2
|
bradykinin receptor B2 |
| chr8_+_115150514 | 0.02 |
ENSRNOT00000016504
|
Abhd14b
|
abhydrolase domain containing 14b |
| chr3_+_122928964 | 0.01 |
ENSRNOT00000074724
|
LOC100365450
|
rCG26795-like |
| chr9_-_100306194 | 0.01 |
ENSRNOT00000087584
|
RGD1563692
|
similar to hypothetical protein FLJ22671 |
| chr10_+_54156649 | 0.01 |
ENSRNOT00000074718
|
Gas7
|
growth arrest specific 7 |
| chr10_+_86599220 | 0.01 |
ENSRNOT00000039836
|
Psmd3
|
proteasome 26S subunit, non-ATPase 3 |
| chr19_-_20508711 | 0.01 |
ENSRNOT00000032408
|
LOC680913
|
hypothetical protein LOC680913 |
| chr1_+_282568287 | 0.01 |
ENSRNOT00000015997
|
Ces2i
|
carboxylesterase 2I |
| chr1_-_141470380 | 0.01 |
ENSRNOT00000065759
|
Plin1
|
perilipin 1 |
| chr1_-_142197182 | 0.01 |
ENSRNOT00000015521
|
Furin
|
furin (paired basic amino acid cleaving enzyme) |
| chr1_-_173528943 | 0.01 |
ENSRNOT00000020393
|
Nlrp10
|
NLR family, pyrin domain containing 10 |
| chr7_-_76780817 | 0.01 |
ENSRNOT00000033704
|
Rrm2b
|
ribonucleotide reductase regulatory TP53 inducible subunit M2B |
| chr9_+_95285592 | 0.01 |
ENSRNOT00000063853
|
Ugt1a5
|
UDP glucuronosyltransferase family 1 member A5 |
| chr3_-_7203420 | 0.01 |
ENSRNOT00000015236
|
Gfi1b
|
growth factor independent 1B transcriptional repressor |
| chrX_-_107405564 | 0.01 |
ENSRNOT00000003247
|
Morf4l2
|
mortality factor 4 like 2 |
| chr15_+_57221292 | 0.01 |
ENSRNOT00000014502
|
Lcp1
|
lymphocyte cytosolic protein 1 |
| chr8_-_127912860 | 0.01 |
ENSRNOT00000040498
|
LOC685081
|
similar to solute carrier family 22 (organic cation transporter), member 13 |
| chr14_+_16924960 | 0.01 |
ENSRNOT00000003009
|
Ccdc158
|
coiled-coil domain containing 158 |
| chrX_+_143097525 | 0.01 |
ENSRNOT00000004559
|
F9
|
coagulation factor IX |
| chr2_+_155076464 | 0.01 |
ENSRNOT00000057619
|
LOC691033
|
similar to GTPase activating protein testicular GAP1 |
| chr6_-_127630734 | 0.01 |
ENSRNOT00000089931
|
Serpina1
|
serpin family A member 1 |
| chr8_-_109621408 | 0.01 |
ENSRNOT00000087398
|
Ppp2r3a
|
protein phosphatase 2, regulatory subunit B'', alpha |
| chr7_-_12274803 | 0.01 |
ENSRNOT00000049146
|
Apc2
|
APC2, WNT signaling pathway regulator |
| chr1_+_167538744 | 0.01 |
ENSRNOT00000093070
|
Rrm1
|
ribonucleotide reductase catalytic subunit M1 |
| chr8_-_48850671 | 0.01 |
ENSRNOT00000016580
|
Cxcr5
|
C-X-C motif chemokine receptor 5 |
| chr8_-_130550388 | 0.01 |
ENSRNOT00000026355
|
Cyp8b1
|
cytochrome P450, family 8, subfamily b, polypeptide 1 |
| chr8_-_52814188 | 0.01 |
ENSRNOT00000087265
ENSRNOT00000047633 |
Rexo2
|
RNA exonuclease 2 |
| chr19_-_43391828 | 0.01 |
ENSRNOT00000023927
|
Cog4
|
component of oligomeric golgi complex 4 |
| chr6_+_52265930 | 0.01 |
ENSRNOT00000087513
ENSRNOT00000067849 |
Sypl1
|
synaptophysin-like 1 |
| chr19_-_39646693 | 0.01 |
ENSRNOT00000019104
|
Psmd7
|
proteasome 26S subunit, non-ATPase 7 |
| chr6_-_12554439 | 0.01 |
ENSRNOT00000022481
|
Lhcgr
|
luteinizing hormone/choriogonadotropin receptor |
| chr4_-_161743847 | 0.01 |
ENSRNOT00000064174
ENSRNOT00000084173 ENSRNOT00000064215 |
Itfg2
|
integrin alpha FG-GAP repeat containing 2 |
| chr8_-_48762342 | 0.01 |
ENSRNOT00000049125
|
Foxr1
|
forkhead box R1 |
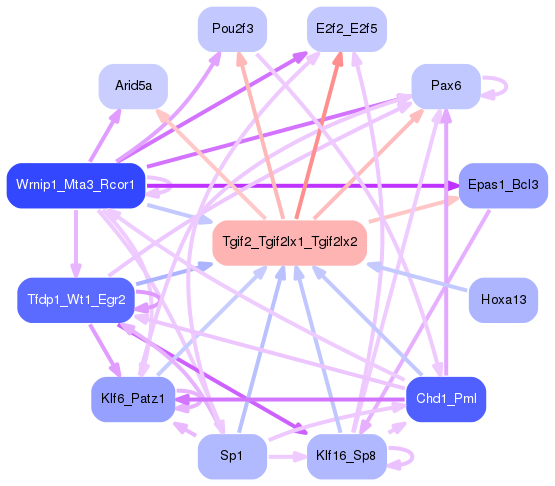
Network of associatons between targets according to the STRING database.

First level regulatory network of Tgif2_Tgif2lx1_Tgif2lx2
Gene Ontology Analysis
Gene overrepresentation in biological process category:
| Log-likelihood per target | Total log-likelihood | Term | Description |
|---|---|---|---|
| 0.1 | 0.5 | GO:2001206 | positive regulation of osteoclast development(GO:2001206) |
| 0.1 | 0.6 | GO:1990086 | lens fiber cell apoptotic process(GO:1990086) |
| 0.1 | 0.3 | GO:0035995 | detection of muscle stretch(GO:0035995) |
| 0.1 | 0.2 | GO:1904937 | pancreatic A cell development(GO:0003322) forebrain-midbrain boundary formation(GO:0021905) somatic motor neuron fate commitment(GO:0021917) regulation of transcription from RNA polymerase II promoter involved in somatic motor neuron fate commitment(GO:0021918) sensory neuron migration(GO:1904937) |
| 0.1 | 0.2 | GO:1903769 | negative regulation of cell proliferation in bone marrow(GO:1903769) |
| 0.0 | 0.2 | GO:0039534 | negative regulation of MDA-5 signaling pathway(GO:0039534) |
| 0.0 | 0.3 | GO:0007621 | negative regulation of female receptivity(GO:0007621) |
| 0.0 | 0.1 | GO:1901423 | response to benzene(GO:1901423) |
| 0.0 | 0.5 | GO:0050930 | induction of positive chemotaxis(GO:0050930) |
| 0.0 | 0.7 | GO:0044705 | mating behavior(GO:0007617) multi-organism reproductive behavior(GO:0044705) |
| 0.0 | 0.1 | GO:0015744 | succinate transport(GO:0015744) succinate transmembrane transport(GO:0071422) |
| 0.0 | 0.2 | GO:0060297 | regulation of sarcomere organization(GO:0060297) |
| 0.0 | 0.1 | GO:0090666 | scaRNA localization to Cajal body(GO:0090666) |
| 0.0 | 0.1 | GO:0034334 | adherens junction maintenance(GO:0034334) |
| 0.0 | 0.0 | GO:0070682 | proteasome regulatory particle assembly(GO:0070682) |
| 0.0 | 0.0 | GO:0071350 | interleukin-15-mediated signaling pathway(GO:0035723) cellular response to interleukin-15(GO:0071350) regulation of protein O-linked glycosylation(GO:1904098) positive regulation of protein O-linked glycosylation(GO:1904100) |
| 0.0 | 0.3 | GO:0032291 | central nervous system myelination(GO:0022010) axon ensheathment in central nervous system(GO:0032291) |
| 0.0 | 0.2 | GO:0043922 | negative regulation by host of viral transcription(GO:0043922) |
| 0.0 | 0.1 | GO:0015866 | ADP transport(GO:0015866) |
| 0.0 | 0.1 | GO:0071688 | striated muscle myosin thick filament assembly(GO:0071688) |
| 0.0 | 0.2 | GO:0042407 | cristae formation(GO:0042407) |
| 0.0 | 0.1 | GO:0048625 | myoblast fate commitment(GO:0048625) |
| 0.0 | 0.0 | GO:0036115 | medium-chain fatty-acyl-CoA metabolic process(GO:0036112) fatty-acyl-CoA catabolic process(GO:0036115) |
| 0.0 | 0.0 | GO:1903630 | regulation of aminoacyl-tRNA ligase activity(GO:1903630) |
| 0.0 | 0.0 | GO:0010982 | regulation of high-density lipoprotein particle clearance(GO:0010982) positive regulation of lipoprotein particle clearance(GO:0010986) cellular response to iron(II) ion(GO:0071282) |
| 0.0 | 0.0 | GO:0000105 | histidine biosynthetic process(GO:0000105) |
| 0.0 | 0.1 | GO:1990564 | protein polyufmylation(GO:1990564) protein K69-linked ufmylation(GO:1990592) |
Gene overrepresentation in cellular component category:
| Log-likelihood per target | Total log-likelihood | Term | Description |
|---|---|---|---|
| 0.0 | 1.1 | GO:0033017 | sarcoplasmic reticulum membrane(GO:0033017) |
| 0.0 | 0.2 | GO:0061617 | MICOS complex(GO:0061617) |
| 0.0 | 0.1 | GO:0071817 | MMXD complex(GO:0071817) |
| 0.0 | 0.2 | GO:0030688 | preribosome, small subunit precursor(GO:0030688) |
| 0.0 | 0.3 | GO:0090665 | dystrophin-associated glycoprotein complex(GO:0016010) glycoprotein complex(GO:0090665) |
| 0.0 | 0.1 | GO:0032777 | Piccolo NuA4 histone acetyltransferase complex(GO:0032777) |
| 0.0 | 0.1 | GO:0005859 | muscle myosin complex(GO:0005859) |
| 0.0 | 0.1 | GO:0030008 | TRAPP complex(GO:0030008) |
Gene overrepresentation in molecular function category:
| Log-likelihood per target | Total log-likelihood | Term | Description |
|---|---|---|---|
| 0.1 | 0.3 | GO:0019807 | aspartoacylase activity(GO:0019807) |
| 0.1 | 0.3 | GO:0031752 | D5 dopamine receptor binding(GO:0031752) |
| 0.1 | 1.1 | GO:0005388 | calcium-transporting ATPase activity(GO:0005388) |
| 0.0 | 0.1 | GO:0016748 | succinyltransferase activity(GO:0016748) |
| 0.0 | 0.5 | GO:0042609 | CD4 receptor binding(GO:0042609) |
| 0.0 | 0.3 | GO:0071253 | connexin binding(GO:0071253) |
| 0.0 | 0.2 | GO:0089720 | caspase binding(GO:0089720) |
| 0.0 | 0.2 | GO:0019863 | IgE binding(GO:0019863) advanced glycation end-product receptor activity(GO:0050785) |
| 0.0 | 0.1 | GO:0015141 | succinate transmembrane transporter activity(GO:0015141) |
| 0.0 | 0.2 | GO:0003680 | AT DNA binding(GO:0003680) |
| 0.0 | 0.1 | GO:0001665 | alpha-N-acetylgalactosaminide alpha-2,6-sialyltransferase activity(GO:0001665) |
| 0.0 | 0.7 | GO:0001102 | RNA polymerase II activating transcription factor binding(GO:0001102) |
| 0.0 | 0.1 | GO:0015217 | ATP transmembrane transporter activity(GO:0005347) ADP transmembrane transporter activity(GO:0015217) |
| 0.0 | 0.2 | GO:0031432 | titin binding(GO:0031432) |
| 0.0 | 0.0 | GO:0044378 | non-sequence-specific DNA binding, bending(GO:0044378) |
| 0.0 | 0.1 | GO:0004767 | sphingomyelin phosphodiesterase activity(GO:0004767) |
| 0.0 | 0.1 | GO:0097493 | structural molecule activity conferring elasticity(GO:0097493) |
Gene overrepresentation in curated gene sets: canonical pathways category:
| Log-likelihood per target | Total log-likelihood | Term | Description |
|---|---|---|---|
| 0.0 | 0.6 | SA REG CASCADE OF CYCLIN EXPR | Expression of cyclins regulates progression through the cell cycle by activating cyclin-dependent kinases. |
| 0.0 | 0.3 | PID PDGFRA PATHWAY | PDGFR-alpha signaling pathway |
Gene overrepresentation in curated gene sets: REACTOME pathways category:
| Log-likelihood per target | Total log-likelihood | Term | Description |
|---|---|---|---|
| 0.1 | 1.1 | REACTOME PRE NOTCH PROCESSING IN GOLGI | Genes involved in Pre-NOTCH Processing in Golgi |
| 0.0 | 0.6 | REACTOME CDC6 ASSOCIATION WITH THE ORC ORIGIN COMPLEX | Genes involved in CDC6 association with the ORC:origin complex |
| 0.0 | 0.2 | REACTOME SYNTHESIS SECRETION AND INACTIVATION OF GIP | Genes involved in Synthesis, Secretion, and Inactivation of Glucose-dependent Insulinotropic Polypeptide (GIP) |
| 0.0 | 0.2 | REACTOME ADVANCED GLYCOSYLATION ENDPRODUCT RECEPTOR SIGNALING | Genes involved in Advanced glycosylation endproduct receptor signaling |