Project
GSE49485: Hypoxia transcriptome sequencing of rat brain.
Navigation
Downloads
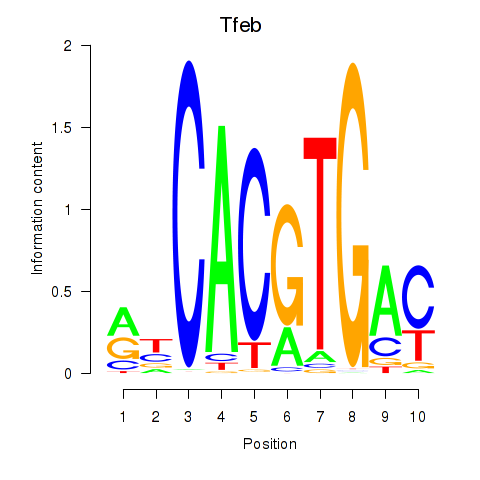
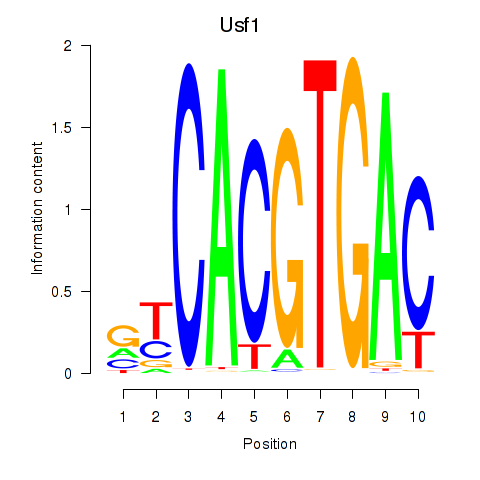
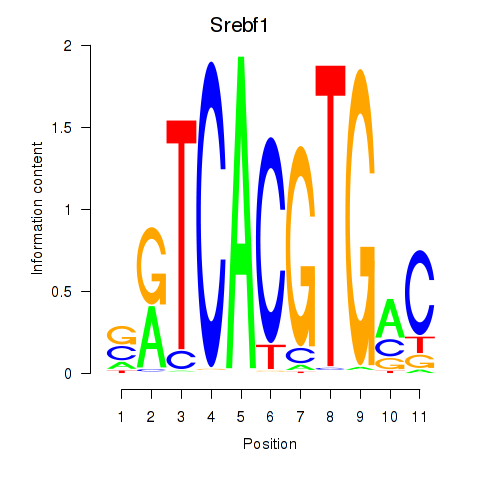
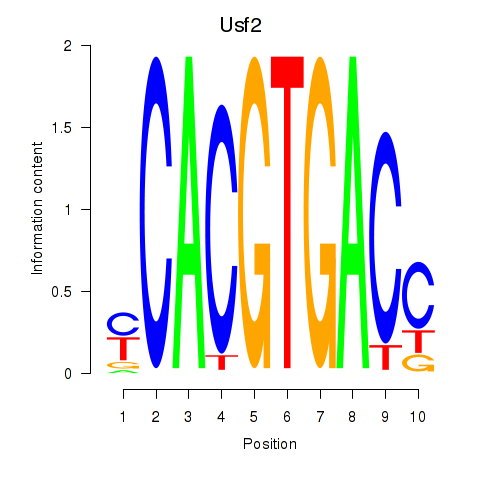
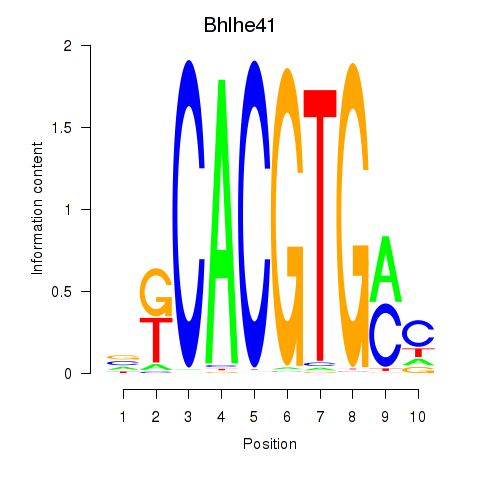
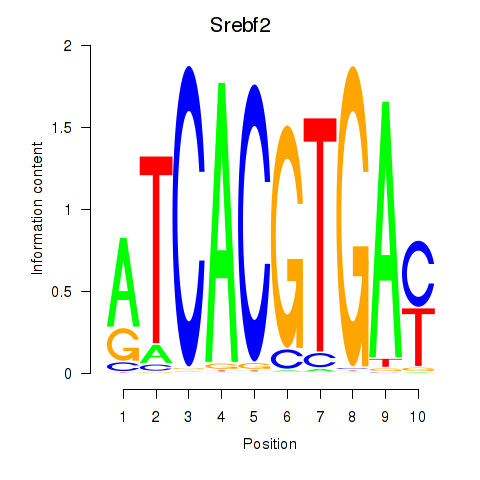
Results for Tfeb_Usf1_Srebf1_Usf2_Bhlhe41_Srebf2
Z-value: 1.01
Motif logo
Transcription factors associated with Tfeb_Usf1_Srebf1_Usf2_Bhlhe41_Srebf2
| Gene Symbol | Gene ID | Gene Info |
|---|---|---|
|
Tfeb
|
ENSRNOG00000014666 | transcription factor EB |
|
Usf1
|
ENSRNOG00000004255 | upstream transcription factor 1 |
|
Srebf1
|
ENSRNOG00000003463 | sterol regulatory element binding transcription factor 1 |
|
Usf2
|
ENSRNOG00000053725 | upstream transcription factor 2, c-fos interacting |
|
Bhlhe41
|
ENSRNOG00000048961 | basic helix-loop-helix family, member e41 |
|
Srebf2
|
ENSRNOG00000007400 | sterol regulatory element binding transcription factor 2 |
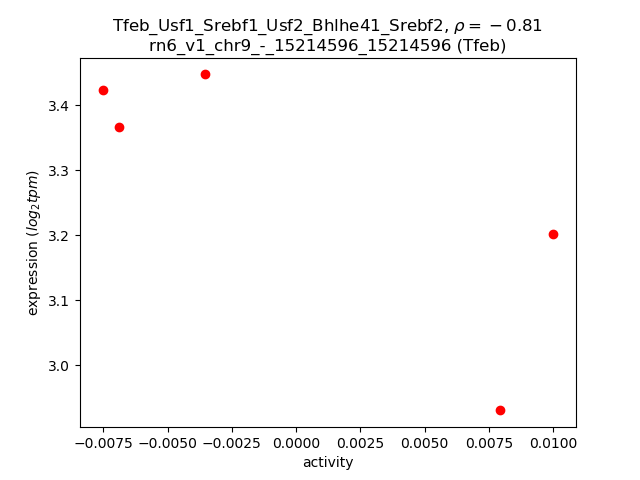
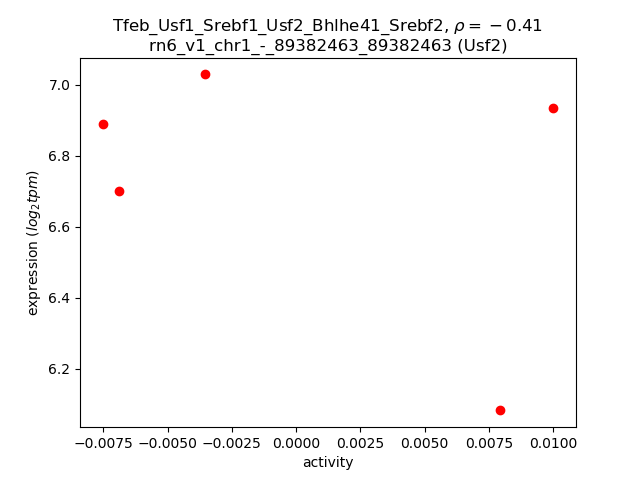
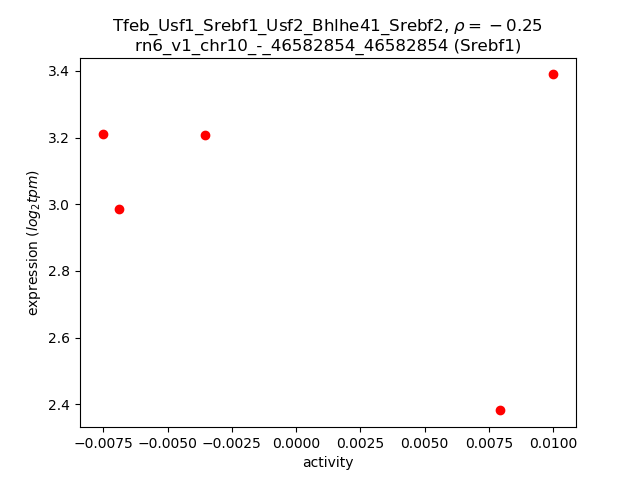
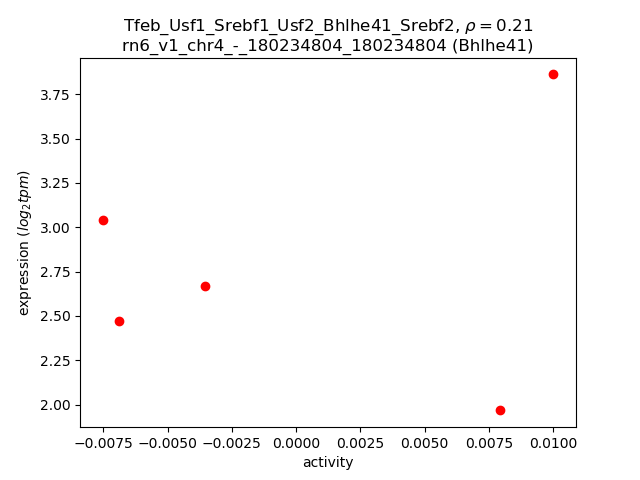
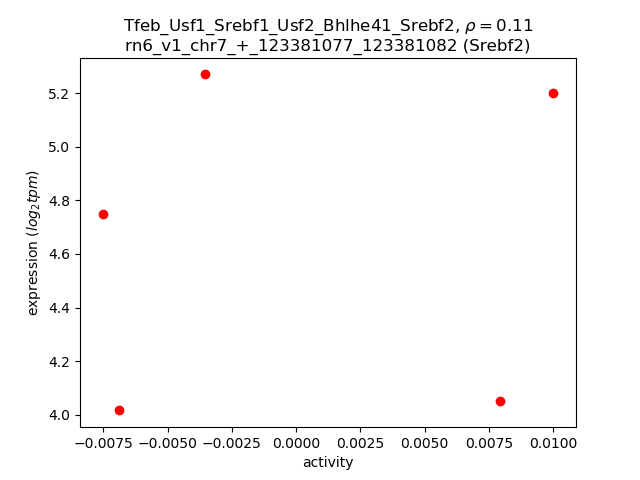
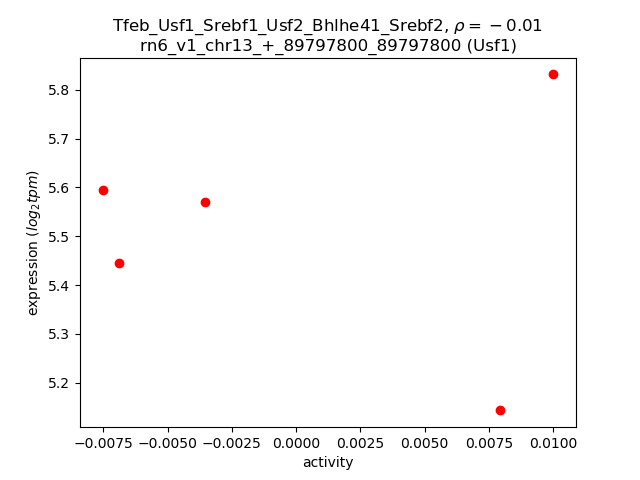
Activity-expression correlation:
| Gene | Promoter | Pearson corr. coef. | P-value | Plot |
|---|---|---|---|---|
| Tfeb | rn6_v1_chr9_-_15214596_15214596 | -0.81 | 9.6e-02 | Click! |
| Usf2 | rn6_v1_chr1_-_89382463_89382463 | -0.41 | 5.0e-01 | Click! |
| Srebf1 | rn6_v1_chr10_-_46582854_46582854 | -0.25 | 6.9e-01 | Click! |
| Bhlhe41 | rn6_v1_chr4_-_180234804_180234804 | 0.21 | 7.4e-01 | Click! |
| Srebf2 | rn6_v1_chr7_+_123381077_123381082 | 0.11 | 8.6e-01 | Click! |
| Usf1 | rn6_v1_chr13_+_89797800_89797800 | -0.01 | 9.8e-01 | Click! |
Activity profile of Tfeb_Usf1_Srebf1_Usf2_Bhlhe41_Srebf2 motif
Sorted Z-values of Tfeb_Usf1_Srebf1_Usf2_Bhlhe41_Srebf2 motif
| Promoter | Log-likelihood | Transcript | Gene | Gene Info |
|---|---|---|---|---|
| chr11_+_61531416 | 0.89 |
ENSRNOT00000093263
|
Atp6v1a
|
ATPase H+ transporting V1 subunit A |
| chr10_+_71278650 | 0.65 |
ENSRNOT00000092020
|
Synrg
|
synergin, gamma |
| chr1_+_154377447 | 0.63 |
ENSRNOT00000084268
ENSRNOT00000092086 ENSRNOT00000091470 ENSRNOT00000025415 |
Picalm
|
phosphatidylinositol binding clathrin assembly protein |
| chr6_-_3794489 | 0.61 |
ENSRNOT00000087891
ENSRNOT00000011000 ENSRNOT00000084499 |
Thumpd2
|
THUMP domain containing 2 |
| chr10_+_56610051 | 0.57 |
ENSRNOT00000024348
|
Dvl2
|
dishevelled segment polarity protein 2 |
| chr5_+_90800082 | 0.55 |
ENSRNOT00000093696
ENSRNOT00000093206 |
Kdm4c
|
lysine demethylase 4C |
| chr3_-_66417741 | 0.54 |
ENSRNOT00000007662
|
Neurod1
|
neuronal differentiation 1 |
| chr6_-_102472926 | 0.53 |
ENSRNOT00000079351
|
Zfyve26
|
zinc finger FYVE-type containing 26 |
| chr1_-_219450451 | 0.53 |
ENSRNOT00000025317
|
Rad9a
|
RAD9 checkpoint clamp component A |
| chr6_-_125853461 | 0.49 |
ENSRNOT00000007505
|
Atxn3
|
ataxin 3 |
| chr18_+_14756684 | 0.49 |
ENSRNOT00000076085
ENSRNOT00000076129 |
Mapre2
|
microtubule-associated protein, RP/EB family, member 2 |
| chr1_-_92119951 | 0.49 |
ENSRNOT00000018153
ENSRNOT00000092121 |
Zfp507
|
zinc finger protein 507 |
| chr5_-_86696388 | 0.48 |
ENSRNOT00000007812
|
Megf9
|
multiple EGF-like-domains 9 |
| chr6_+_86785771 | 0.46 |
ENSRNOT00000066702
|
Prpf39
|
pre-mRNA processing factor 39 |
| chr10_+_40543288 | 0.45 |
ENSRNOT00000016755
|
Slc36a1
|
solute carrier family 36 member 1 |
| chr10_-_74298599 | 0.45 |
ENSRNOT00000007379
|
Ypel2
|
yippee-like 2 |
| chr9_+_94425252 | 0.44 |
ENSRNOT00000064965
ENSRNOT00000076099 |
Gigyf2
|
GRB10 interacting GYF protein 2 |
| chr8_-_94922017 | 0.44 |
ENSRNOT00000083934
|
Cep162
|
centrosomal protein 162 |
| chr8_-_36467627 | 0.43 |
ENSRNOT00000082346
|
Fam118b
|
family with sequence similarity 118, member B |
| chr10_-_16752205 | 0.43 |
ENSRNOT00000079462
|
Crebrf
|
CREB3 regulatory factor |
| chr7_+_53878610 | 0.42 |
ENSRNOT00000091910
|
Osbpl8
|
oxysterol binding protein-like 8 |
| chr3_+_155297566 | 0.39 |
ENSRNOT00000021435
ENSRNOT00000084866 |
Dhx35
|
DEAH-box helicase 35 |
| chr3_-_61494778 | 0.39 |
ENSRNOT00000068018
|
Lnpk
|
lunapark, ER junction formation factor |
| chr18_+_74299931 | 0.38 |
ENSRNOT00000078403
|
Epg5
|
ectopic P-granules autophagy protein 5 homolog |
| chrX_-_105417323 | 0.37 |
ENSRNOT00000015494
|
Gla
|
galactosidase, alpha |
| chr18_+_55797198 | 0.37 |
ENSRNOT00000026334
ENSRNOT00000026394 |
Dctn4
|
dynactin subunit 4 |
| chrX_-_4945944 | 0.35 |
ENSRNOT00000077238
|
Kdm6a
|
lysine demethylase 6A |
| chr2_-_53827175 | 0.35 |
ENSRNOT00000078158
|
RGD1305938
|
similar to expressed sequence AW549877 |
| chr10_+_11373346 | 0.34 |
ENSRNOT00000044624
|
LOC108348151
|
coronin-7-like |
| chrX_-_54303729 | 0.34 |
ENSRNOT00000087919
ENSRNOT00000064340 ENSRNOT00000051249 ENSRNOT00000087547 |
Gk
|
glycerol kinase |
| chr1_+_48176106 | 0.34 |
ENSRNOT00000021840
|
Igf2r
|
insulin-like growth factor 2 receptor |
| chr8_-_104995725 | 0.34 |
ENSRNOT00000037120
|
Slc25a36
|
solute carrier family 25 member 36 |
| chr1_-_174289647 | 0.34 |
ENSRNOT00000064902
|
St5
|
suppression of tumorigenicity 5 |
| chr1_-_144601327 | 0.33 |
ENSRNOT00000029244
ENSRNOT00000078144 |
Saxo2
|
stabilizer of axonemal microtubules 2 |
| chr14_-_2056762 | 0.33 |
ENSRNOT00000000048
|
Idua
|
iduronidase, alpha-L- |
| chr10_-_46720907 | 0.33 |
ENSRNOT00000083093
ENSRNOT00000067866 |
Tom1l2
|
target of myb1 like 2 membrane trafficking protein |
| chr6_+_109617355 | 0.33 |
ENSRNOT00000011599
|
Flvcr2
|
feline leukemia virus subgroup C cellular receptor family, member 2 |
| chr12_+_38459832 | 0.32 |
ENSRNOT00000090343
|
Vps33a
|
VPS33A CORVET/HOPS core subunit |
| chr14_-_44767120 | 0.31 |
ENSRNOT00000003991
|
Wdr19
|
WD repeat domain 19 |
| chr4_-_82141385 | 0.31 |
ENSRNOT00000008447
|
Hoxa3
|
homeobox A3 |
| chr13_+_99136871 | 0.31 |
ENSRNOT00000078263
ENSRNOT00000004350 |
Sde2
|
SDE2 telomere maintenance homolog |
| chr8_-_46750898 | 0.31 |
ENSRNOT00000059951
|
Tbcel
|
tubulin folding cofactor E-like |
| chr17_-_67904674 | 0.30 |
ENSRNOT00000078532
|
Klf6
|
Kruppel-like factor 6 |
| chr3_+_61658245 | 0.30 |
ENSRNOT00000033511
|
Hoxd3
|
homeo box D3 |
| chr3_-_60795951 | 0.29 |
ENSRNOT00000002174
|
Atf2
|
activating transcription factor 2 |
| chr5_-_160352927 | 0.29 |
ENSRNOT00000017247
|
Dnajc16
|
DnaJ heat shock protein family (Hsp40) member C16 |
| chr3_+_163570532 | 0.29 |
ENSRNOT00000010054
|
Arfgef2
|
ADP ribosylation factor guanine nucleotide exchange factor 2 |
| chr7_-_12673659 | 0.29 |
ENSRNOT00000091650
ENSRNOT00000041277 ENSRNOT00000044865 |
Ptbp1
|
polypyrimidine tract binding protein 1 |
| chr10_+_94988362 | 0.29 |
ENSRNOT00000066525
|
Cep95
|
centrosomal protein 95 |
| chr10_-_6870011 | 0.29 |
ENSRNOT00000003439
|
RGD1309748
|
similar to CG4768-PA |
| chr7_+_144503534 | 0.29 |
ENSRNOT00000021543
|
Tbca
|
tubulin folding cofactor A |
| chr11_-_68197772 | 0.28 |
ENSRNOT00000003060
ENSRNOT00000081875 |
Hspbap1
|
Hspb associated protein 1 |
| chr10_-_47018537 | 0.28 |
ENSRNOT00000068351
ENSRNOT00000080083 |
Top3a
|
topoisomerase (DNA) III alpha |
| chr14_+_63095720 | 0.28 |
ENSRNOT00000006071
|
Ppargc1a
|
PPARG coactivator 1 alpha |
| chr2_+_184600721 | 0.28 |
ENSRNOT00000075823
|
Gatb
|
glutamyl-tRNA amidotransferase subunit B |
| chr16_+_2278701 | 0.28 |
ENSRNOT00000016233
|
Dennd6a
|
DENN domain containing 6A |
| chr7_-_26361221 | 0.27 |
ENSRNOT00000011326
|
RGD1309995
|
similar to CG13957-PA |
| chr16_-_74023005 | 0.27 |
ENSRNOT00000078743
|
Kat6a
|
lysine acetyltransferase 6A |
| chr17_+_1936163 | 0.26 |
ENSRNOT00000024466
|
Cdk20
|
cyclin-dependent kinase 20 |
| chr7_-_143863186 | 0.26 |
ENSRNOT00000017096
|
Rarg
|
retinoic acid receptor, gamma |
| chr10_+_14492844 | 0.26 |
ENSRNOT00000023615
|
Clcn7
|
chloride voltage-gated channel 7 |
| chr8_+_22446661 | 0.26 |
ENSRNOT00000010030
|
Qtrt1
|
queuine tRNA-ribosyltransferase catalytic subunit 1 |
| chrX_+_74200972 | 0.26 |
ENSRNOT00000076956
|
Chic1
|
cysteine-rich hydrophobic domain 1 |
| chr8_+_77107536 | 0.26 |
ENSRNOT00000083255
|
Adam10
|
ADAM metallopeptidase domain 10 |
| chr18_+_15298978 | 0.25 |
ENSRNOT00000021263
|
Trappc8
|
trafficking protein particle complex 8 |
| chr1_-_143278485 | 0.25 |
ENSRNOT00000026009
|
Cpeb1
|
cytoplasmic polyadenylation element binding protein 1 |
| chr3_-_111037425 | 0.24 |
ENSRNOT00000085628
|
Ppp1r14d
|
protein phosphatase 1, regulatory (inhibitor) subunit 14D |
| chr14_-_17616170 | 0.24 |
ENSRNOT00000090938
|
Thap6
|
THAP domain containing 6 |
| chrX_+_158835811 | 0.24 |
ENSRNOT00000071888
ENSRNOT00000080110 |
Ints6l
|
integrator complex subunit 6 like |
| chr1_-_102849430 | 0.24 |
ENSRNOT00000086856
|
Saa4
|
serum amyloid A4 |
| chr19_-_10826895 | 0.24 |
ENSRNOT00000090217
|
Rspry1
|
ring finger and SPRY domain containing 1 |
| chr8_-_12355091 | 0.24 |
ENSRNOT00000009318
|
Cep57
|
centrosomal protein 57 |
| chr10_-_62287189 | 0.24 |
ENSRNOT00000004365
|
Wdr81
|
WD repeat domain 81 |
| chr19_+_14392423 | 0.23 |
ENSRNOT00000018880
|
Tom1
|
target of myb1 membrane trafficking protein |
| chr16_-_19791832 | 0.23 |
ENSRNOT00000040393
|
Ushbp1
|
USH1 protein network component harmonin binding protein 1 |
| chr7_+_23960378 | 0.23 |
ENSRNOT00000006886
|
Prdm4
|
PR/SET domain 4 |
| chr1_-_261229046 | 0.23 |
ENSRNOT00000075531
|
Mms19
|
MMS19 homolog, cytosolic iron-sulfur assembly component |
| chr19_-_601469 | 0.23 |
ENSRNOT00000016462
|
Pdp2
|
pyruvate dehyrogenase phosphatase catalytic subunit 2 |
| chr6_-_55001464 | 0.22 |
ENSRNOT00000006618
|
Ahr
|
aryl hydrocarbon receptor |
| chr10_-_84881190 | 0.22 |
ENSRNOT00000073746
|
Pnpo
|
pyridoxamine 5'-phosphate oxidase |
| chr15_-_45927804 | 0.22 |
ENSRNOT00000086271
|
Ints6
|
integrator complex subunit 6 |
| chr5_+_128215711 | 0.22 |
ENSRNOT00000011670
|
Cc2d1b
|
coiled-coil and C2 domain containing 1B |
| chr8_-_58253688 | 0.22 |
ENSRNOT00000010956
|
Cul5
|
cullin 5 |
| chr7_-_67116980 | 0.21 |
ENSRNOT00000005798
|
Ppm1h
|
protein phosphatase, Mg2+/Mn2+ dependent, 1H |
| chr16_+_59077574 | 0.21 |
ENSRNOT00000090477
|
Dlc1
|
DLC1 Rho GTPase activating protein |
| chr8_-_132790778 | 0.21 |
ENSRNOT00000008255
ENSRNOT00000091431 |
Lztfl1
|
leucine zipper transcription factor-like 1 |
| chr8_+_408001 | 0.20 |
ENSRNOT00000046058
|
Gucy1a2
|
guanylate cyclase 1 soluble subunit alpha 2 |
| chr8_-_112807598 | 0.20 |
ENSRNOT00000015344
|
Dnajc13
|
DnaJ heat shock protein family (Hsp40) member C13 |
| chr10_+_76343847 | 0.20 |
ENSRNOT00000055674
|
Trim25
|
tripartite motif-containing 25 |
| chrX_+_28072826 | 0.20 |
ENSRNOT00000039796
|
Frmpd4
|
FERM and PDZ domain containing 4 |
| chr1_-_222495382 | 0.20 |
ENSRNOT00000028759
|
Naa40
|
N(alpha)-acetyltransferase 40, NatD catalytic subunit |
| chr7_-_99677268 | 0.20 |
ENSRNOT00000013315
|
RGD1564420
|
similar to Hypothetical protein MGC31278 |
| chr9_+_10963723 | 0.20 |
ENSRNOT00000075424
|
Plin4
|
perilipin 4 |
| chrX_+_77076106 | 0.20 |
ENSRNOT00000091527
ENSRNOT00000089381 |
Atp7a
|
ATPase copper transporting alpha |
| chr6_+_86713803 | 0.20 |
ENSRNOT00000005861
|
Fam179b
|
family with sequence similarity 179, member B |
| chr16_-_54137660 | 0.19 |
ENSRNOT00000085435
|
Pcm1
|
pericentriolar material 1 |
| chr11_+_73936750 | 0.19 |
ENSRNOT00000002350
|
Atp13a3
|
ATPase 13A3 |
| chr7_+_141702038 | 0.19 |
ENSRNOT00000086577
|
Dip2b
|
disco-interacting protein 2 homolog B |
| chr11_-_65759581 | 0.19 |
ENSRNOT00000034334
|
Lrrc58
|
leucine rich repeat containing 58 |
| chr4_+_161685258 | 0.19 |
ENSRNOT00000008012
ENSRNOT00000008003 |
Foxm1
|
forkhead box M1 |
| chr2_-_210088949 | 0.19 |
ENSRNOT00000070994
|
Rbm15
|
RNA binding motif protein 15 |
| chr2_-_21698937 | 0.19 |
ENSRNOT00000080165
|
AABR07007642.1
|
|
| chr10_-_10725655 | 0.18 |
ENSRNOT00000061236
|
Ubn1
|
ubinuclein 1 |
| chr12_-_48365784 | 0.18 |
ENSRNOT00000077317
|
Dao
|
D-amino-acid oxidase |
| chr15_-_60766579 | 0.18 |
ENSRNOT00000079978
|
Akap11
|
A-kinase anchoring protein 11 |
| chr2_+_87018305 | 0.18 |
ENSRNOT00000079449
|
Rsl1
|
regulator of sex limited protein 1 |
| chrX_-_84821775 | 0.18 |
ENSRNOT00000000174
|
Chm
|
CHM, Rab escort protein 1 |
| chr10_+_90984227 | 0.18 |
ENSRNOT00000003890
ENSRNOT00000093707 |
Ccdc103
|
coiled-coil domain containing 103 |
| chr2_+_164747677 | 0.18 |
ENSRNOT00000018489
|
Mfsd1
|
major facilitator superfamily domain containing 1 |
| chr17_+_86408151 | 0.18 |
ENSRNOT00000022734
|
Otud1
|
OTU deubiquitinase 1 |
| chr10_+_47019326 | 0.17 |
ENSRNOT00000006984
|
Smcr8
|
Smith-Magenis syndrome chromosome region, candidate 8 |
| chr13_+_110511668 | 0.17 |
ENSRNOT00000006235
|
Nek2
|
NIMA-related kinase 2 |
| chr8_-_64572850 | 0.17 |
ENSRNOT00000015415
|
Senp8
|
SUMO/sentrin peptidase family member, NEDD8 specific |
| chr20_-_32115310 | 0.17 |
ENSRNOT00000067883
ENSRNOT00000081916 |
Vps26a
|
VPS26 retromer complex component A |
| chr11_-_72378895 | 0.17 |
ENSRNOT00000058885
|
Dlg1
|
discs large MAGUK scaffold protein 1 |
| chr10_+_84152152 | 0.17 |
ENSRNOT00000010724
|
Hoxb5
|
homeo box B5 |
| chr1_-_54748763 | 0.17 |
ENSRNOT00000074549
|
LOC100911027
|
protein MAL2-like |
| chr3_+_55094637 | 0.17 |
ENSRNOT00000058763
|
Cers6
|
ceramide synthase 6 |
| chr16_+_49185560 | 0.16 |
ENSRNOT00000014360
|
Helt
|
helt bHLH transcription factor |
| chr11_-_38457373 | 0.16 |
ENSRNOT00000041177
|
Zfp295
|
zinc finger protein 295 |
| chr3_-_33075685 | 0.16 |
ENSRNOT00000006937
|
Orc4
|
origin recognition complex, subunit 4 |
| chr8_-_47339343 | 0.16 |
ENSRNOT00000081007
|
Arhgef12
|
Rho guanine nucleotide exchange factor 12 |
| chr3_+_161298962 | 0.16 |
ENSRNOT00000066028
|
Ctsa
|
cathepsin A |
| chr16_-_24788740 | 0.16 |
ENSRNOT00000018952
|
Npy1r
|
neuropeptide Y receptor Y1 |
| chr3_-_3691972 | 0.16 |
ENSRNOT00000061735
|
Qsox2
|
quiescin sulfhydryl oxidase 2 |
| chr11_+_60613882 | 0.16 |
ENSRNOT00000002853
|
Slc35a5
|
solute carrier family 35, member A5 |
| chr5_-_79691258 | 0.16 |
ENSRNOT00000072920
|
Tnfsf8
|
tumor necrosis factor superfamily member 8 |
| chr7_+_141249044 | 0.16 |
ENSRNOT00000084911
|
Aqp5
|
aquaporin 5 |
| chr11_+_61531571 | 0.16 |
ENSRNOT00000093467
ENSRNOT00000002727 |
Atp6v1a
|
ATPase H+ transporting V1 subunit A |
| chr9_-_11027506 | 0.16 |
ENSRNOT00000071107
|
Chaf1a
|
chromatin assembly factor 1 subunit A |
| chr8_+_64573358 | 0.15 |
ENSRNOT00000083558
|
Myo9a
|
myosin IXA |
| chr2_+_104416972 | 0.15 |
ENSRNOT00000017125
|
Trim55
|
tripartite motif-containing 55 |
| chr4_+_87026530 | 0.15 |
ENSRNOT00000018425
|
Avl9
|
AVL9 cell migration associated |
| chr6_+_108167716 | 0.15 |
ENSRNOT00000064426
|
Lin52
|
lin-52 DREAM MuvB core complex component |
| chrX_+_25016401 | 0.15 |
ENSRNOT00000059270
|
Clcn4
|
chloride voltage-gated channel 4 |
| chr12_+_47590154 | 0.15 |
ENSRNOT00000045946
|
Git2
|
GIT ArfGAP 2 |
| chr17_-_1093873 | 0.15 |
ENSRNOT00000086130
|
Ptch1
|
patched 1 |
| chr1_-_250951697 | 0.15 |
ENSRNOT00000054761
|
Sgms1
|
sphingomyelin synthase 1 |
| chr12_+_19314251 | 0.15 |
ENSRNOT00000001827
|
Ap4m1
|
adaptor-related protein complex 4, mu 1 subunit |
| chr15_-_24374753 | 0.15 |
ENSRNOT00000016274
|
Atg14
|
autophagy related 14 |
| chr1_+_47162394 | 0.15 |
ENSRNOT00000068457
|
Tmem181
|
transmembrane protein 181 |
| chr10_+_10725819 | 0.15 |
ENSRNOT00000004159
|
Glyr1
|
glyoxylate reductase 1 homolog |
| chr20_+_28027054 | 0.15 |
ENSRNOT00000071386
ENSRNOT00000001044 |
Ranbp2
|
RAN binding protein 2 |
| chr10_-_94988461 | 0.15 |
ENSRNOT00000048490
|
Ddx5
|
DEAD-box helicase 5 |
| chr10_+_74436208 | 0.15 |
ENSRNOT00000090921
ENSRNOT00000091163 |
Trim37
|
tripartite motif-containing 37 |
| chr6_-_86713370 | 0.15 |
ENSRNOT00000005821
|
Klhl28
|
kelch-like family member 28 |
| chr12_-_14175945 | 0.15 |
ENSRNOT00000001469
|
Ap5z1
|
adaptor-related protein complex 5, zeta 1 subunit |
| chr18_+_24397369 | 0.14 |
ENSRNOT00000022761
|
Sap130
|
Sin3A associated protein 130 |
| chr19_+_26151900 | 0.14 |
ENSRNOT00000005571
|
Tnpo2
|
transportin 2 |
| chr2_+_207108552 | 0.14 |
ENSRNOT00000027234
|
Slc16a1
|
solute carrier family 16 member 1 |
| chr2_-_189400323 | 0.14 |
ENSRNOT00000024364
|
Ubap2l
|
ubiquitin associated protein 2-like |
| chr7_-_143793970 | 0.14 |
ENSRNOT00000016205
|
Csad
|
cysteine sulfinic acid decarboxylase |
| chr2_-_142686577 | 0.14 |
ENSRNOT00000014562
|
Nhlrc3
|
NHL repeat containing 3 |
| chr9_+_16427589 | 0.14 |
ENSRNOT00000091809
|
Gltscr1l
|
GLTSCR1-like |
| chr1_+_84361736 | 0.14 |
ENSRNOT00000077968
|
RGD1307554
|
similar to CG16812-PA |
| chr1_-_281874456 | 0.14 |
ENSRNOT00000084760
ENSRNOT00000050617 |
Cacul1
|
CDK2-associated, cullin domain 1 |
| chr15_-_28611946 | 0.14 |
ENSRNOT00000016288
|
Supt16h
|
SPT16 homolog, facilitates chromatin remodeling subunit |
| chr1_-_228194977 | 0.14 |
ENSRNOT00000028535
|
Stx3
|
syntaxin 3 |
| chr7_+_142239035 | 0.14 |
ENSRNOT00000006239
|
Dazap2
|
DAZ associated protein 2 |
| chr19_-_37210412 | 0.13 |
ENSRNOT00000083097
|
B3gnt9
|
UDP-GlcNAc:betaGal beta-1,3-N-acetylglucosaminyltransferase 9 |
| chr16_-_24788456 | 0.13 |
ENSRNOT00000079412
|
Npy1r
|
neuropeptide Y receptor Y1 |
| chr10_+_20591432 | 0.13 |
ENSRNOT00000059780
|
Pank3
|
pantothenate kinase 3 |
| chr18_+_63203063 | 0.13 |
ENSRNOT00000024144
|
Prelid3a
|
PRELI domain containing 3A |
| chrX_-_10413984 | 0.13 |
ENSRNOT00000039551
ENSRNOT00000091448 |
Ddx3x
|
DEAD-box helicase 3, X-linked |
| chr19_-_55510460 | 0.13 |
ENSRNOT00000019820
|
Cbfa2t3
|
CBFA2/RUNX1 translocation partner 3 |
| chr9_-_88086488 | 0.13 |
ENSRNOT00000019579
|
Irs1
|
insulin receptor substrate 1 |
| chr10_-_39054142 | 0.13 |
ENSRNOT00000063772
|
Rad50
|
RAD50 double strand break repair protein |
| chr5_-_166259069 | 0.13 |
ENSRNOT00000055572
|
Ube4b
|
ubiquitination factor E4B |
| chr2_+_122690278 | 0.13 |
ENSRNOT00000086831
|
AABR07010085.1
|
|
| chr16_+_53998560 | 0.13 |
ENSRNOT00000077188
ENSRNOT00000013463 |
Asah1
|
N-acylsphingosine amidohydrolase 1 |
| chr1_-_239265997 | 0.13 |
ENSRNOT00000037500
|
RGD1359158
|
similar to RIKEN cDNA 1110059E24 |
| chr10_+_74436534 | 0.13 |
ENSRNOT00000008298
|
Trim37
|
tripartite motif-containing 37 |
| chr5_+_141572536 | 0.13 |
ENSRNOT00000023514
|
Rragc
|
Ras-related GTP binding C |
| chr10_+_11090314 | 0.13 |
ENSRNOT00000086305
|
Coro7
|
coronin 7 |
| chr7_+_65616177 | 0.13 |
ENSRNOT00000006566
|
Gns
|
glucosamine (N-acetyl)-6-sulfatase |
| chr6_-_100011226 | 0.13 |
ENSRNOT00000083286
ENSRNOT00000041442 |
Max
|
MYC associated factor X |
| chr10_-_89916400 | 0.13 |
ENSRNOT00000055194
|
Dusp3
|
dual specificity phosphatase 3 |
| chr12_-_43940798 | 0.13 |
ENSRNOT00000001485
|
RGD1562310
|
similar to hypothetical protein FLJ21415 |
| chr3_-_1924827 | 0.13 |
ENSRNOT00000006162
|
Cacna1b
|
calcium voltage-gated channel subunit alpha1 B |
| chr2_+_188516582 | 0.13 |
ENSRNOT00000074727
|
Gba
|
glucosylceramidase beta |
| chr1_+_171820423 | 0.13 |
ENSRNOT00000047831
|
Ppfibp2
|
PPFIA binding protein 2 |
| chr14_+_9226125 | 0.12 |
ENSRNOT00000088047
|
Wdfy3
|
WD repeat and FYVE domain containing 3 |
| chr5_-_173425611 | 0.12 |
ENSRNOT00000027060
|
B3galt6
|
Beta-1,3-galactosyltransferase 6 |
| chr17_+_10463303 | 0.12 |
ENSRNOT00000060822
|
Rnf44
|
ring finger protein 44 |
| chr2_-_187786700 | 0.12 |
ENSRNOT00000092257
ENSRNOT00000092612 ENSRNOT00000068360 |
Slc25a44
|
solute carrier family 25, member 44 |
| chr1_+_85112834 | 0.12 |
ENSRNOT00000026107
|
Dyrk1b
|
dual specificity tyrosine phosphorylation regulated kinase 1B |
| chr10_+_90731148 | 0.12 |
ENSRNOT00000093604
|
Adam11
|
ADAM metallopeptidase domain 11 |
| chr2_-_196270826 | 0.12 |
ENSRNOT00000028609
|
Pip5k1a
|
phosphatidylinositol-4-phosphate 5-kinase, type 1, alpha |
| chr3_+_103773459 | 0.12 |
ENSRNOT00000079727
|
Slc12a6
|
solute carrier family 12, member 6 |
| chr7_-_78004975 | 0.12 |
ENSRNOT00000006029
|
Slc25a32
|
solute carrier family 25 member 32 |
| chr5_-_62001196 | 0.12 |
ENSRNOT00000012602
|
Trmo
|
tRNA methyltransferase O |
| chr16_-_54137485 | 0.12 |
ENSRNOT00000014202
|
Pcm1
|
pericentriolar material 1 |
| chr4_+_28441301 | 0.12 |
ENSRNOT00000067087
|
Vps50
|
VPS50 EARP/GARPII complex subunit |
| chr4_+_71675383 | 0.12 |
ENSRNOT00000051265
|
Clcn1
|
chloride voltage-gated channel 1 |
| chr6_-_64170122 | 0.12 |
ENSRNOT00000093248
ENSRNOT00000005363 |
Dnajb9
|
DnaJ heat shock protein family (Hsp40) member B9 |
| chr5_+_151796814 | 0.12 |
ENSRNOT00000009394
|
Gpatch3
|
G patch domain containing 3 |
| chrX_+_122938009 | 0.12 |
ENSRNOT00000089266
ENSRNOT00000017550 |
Lonrf3
|
LON peptidase N-terminal domain and ring finger 3 |
| chr6_+_86713604 | 0.12 |
ENSRNOT00000059271
|
Fam179b
|
family with sequence similarity 179, member B |
| chr8_+_57964988 | 0.12 |
ENSRNOT00000009497
|
Kdelc2
|
KDEL motif containing 2 |
| chr5_+_145138697 | 0.12 |
ENSRNOT00000019135
|
Zmym6
|
zinc finger MYM-type containing 6 |
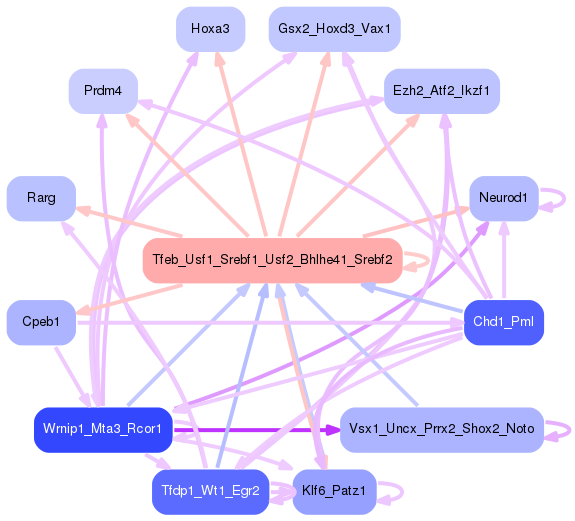
Network of associatons between targets according to the STRING database.

First level regulatory network of Tfeb_Usf1_Srebf1_Usf2_Bhlhe41_Srebf2
Gene Ontology Analysis
Gene overrepresentation in biological process category:
| Log-likelihood per target | Total log-likelihood | Term | Description |
|---|---|---|---|
| 0.2 | 0.6 | GO:1902963 | regulation of aspartic-type endopeptidase activity involved in amyloid precursor protein catabolic process(GO:1902959) positive regulation of aspartic-type endopeptidase activity involved in amyloid precursor protein catabolic process(GO:1902961) regulation of metalloendopeptidase activity involved in amyloid precursor protein catabolic process(GO:1902962) negative regulation of metalloendopeptidase activity involved in amyloid precursor protein catabolic process(GO:1902963) regulation of aspartic-type peptidase activity(GO:1905245) positive regulation of aspartic-type peptidase activity(GO:1905247) |
| 0.2 | 0.6 | GO:0021615 | glossopharyngeal nerve morphogenesis(GO:0021615) |
| 0.1 | 0.4 | GO:1902211 | regulation of prolactin signaling pathway(GO:1902211) |
| 0.1 | 0.6 | GO:0044340 | canonical Wnt signaling pathway involved in regulation of cell proliferation(GO:0044340) |
| 0.1 | 0.5 | GO:0060729 | intestinal epithelial structure maintenance(GO:0060729) |
| 0.1 | 0.4 | GO:0030576 | Cajal body organization(GO:0030576) |
| 0.1 | 0.4 | GO:0090204 | protein localization to nuclear pore(GO:0090204) |
| 0.1 | 0.3 | GO:0032915 | positive regulation of transforming growth factor beta2 production(GO:0032915) |
| 0.1 | 0.3 | GO:0080033 | cellular response to nitrite(GO:0071250) response to nitrite(GO:0080033) response to resveratrol(GO:1904638) regulation of progesterone biosynthetic process(GO:2000182) |
| 0.1 | 0.3 | GO:0070681 | glutaminyl-tRNAGln biosynthesis via transamidation(GO:0070681) |
| 0.1 | 0.3 | GO:2000049 | positive regulation of cell-cell adhesion mediated by cadherin(GO:2000049) |
| 0.1 | 0.3 | GO:0003430 | growth plate cartilage chondrocyte growth(GO:0003430) |
| 0.1 | 0.2 | GO:0030997 | regulation of centriole-centriole cohesion(GO:0030997) |
| 0.1 | 0.3 | GO:0051088 | PMA-inducible membrane protein ectodomain proteolysis(GO:0051088) |
| 0.1 | 0.3 | GO:0061055 | ciliary receptor clustering involved in smoothened signaling pathway(GO:0060830) myotome development(GO:0061055) |
| 0.1 | 0.2 | GO:0042822 | pyridoxal phosphate metabolic process(GO:0042822) |
| 0.1 | 0.4 | GO:0071557 | histone H3-K27 demethylation(GO:0071557) |
| 0.1 | 0.6 | GO:1900113 | negative regulation of histone H3-K9 trimethylation(GO:1900113) |
| 0.1 | 0.3 | GO:0036353 | histone H2A-K119 monoubiquitination(GO:0036353) |
| 0.1 | 0.3 | GO:0019563 | glycerol catabolic process(GO:0019563) |
| 0.1 | 0.3 | GO:0030205 | dermatan sulfate metabolic process(GO:0030205) |
| 0.1 | 0.5 | GO:0046477 | glycosylceramide catabolic process(GO:0046477) |
| 0.1 | 0.2 | GO:1903760 | regulation of voltage-gated potassium channel activity involved in ventricular cardiac muscle cell action potential repolarization(GO:1903760) |
| 0.1 | 0.3 | GO:0030242 | pexophagy(GO:0030242) |
| 0.1 | 0.2 | GO:0009080 | alanine catabolic process(GO:0006524) pyruvate family amino acid catabolic process(GO:0009080) D-amino acid metabolic process(GO:0046416) |
| 0.1 | 0.4 | GO:0015808 | L-alanine transport(GO:0015808) |
| 0.1 | 0.5 | GO:0000395 | mRNA 5'-splice site recognition(GO:0000395) |
| 0.1 | 0.2 | GO:0040009 | regulation of growth rate(GO:0040009) |
| 0.1 | 0.4 | GO:0071787 | endoplasmic reticulum tubular network assembly(GO:0071787) |
| 0.1 | 0.2 | GO:1903564 | regulation of protein localization to cilium(GO:1903564) |
| 0.1 | 0.2 | GO:0021997 | epidermal cell fate specification(GO:0009957) response to chlorate(GO:0010157) neural plate axis specification(GO:0021997) |
| 0.0 | 0.2 | GO:0034757 | negative regulation of iron ion transport(GO:0034757) negative regulation of iron ion transmembrane transport(GO:0034760) elastin biosynthetic process(GO:0051542) regulation of cytochrome-c oxidase activity(GO:1904959) |
| 0.0 | 0.2 | GO:0007221 | positive regulation of transcription of Notch receptor target(GO:0007221) |
| 0.0 | 0.3 | GO:0035735 | intraciliary transport involved in cilium morphogenesis(GO:0035735) |
| 0.0 | 0.2 | GO:0009758 | carbohydrate utilization(GO:0009758) |
| 0.0 | 0.1 | GO:0070563 | negative regulation of vitamin D receptor signaling pathway(GO:0070563) negative regulation of response to alcohol(GO:1901420) |
| 0.0 | 0.3 | GO:1901098 | positive regulation of autophagosome maturation(GO:1901098) |
| 0.0 | 0.1 | GO:0060764 | cell-cell signaling involved in mammary gland development(GO:0060764) |
| 0.0 | 0.3 | GO:0071409 | cellular response to cycloheximide(GO:0071409) |
| 0.0 | 0.1 | GO:0046604 | positive regulation of mitotic centrosome separation(GO:0046604) |
| 0.0 | 0.5 | GO:0035520 | monoubiquitinated protein deubiquitination(GO:0035520) |
| 0.0 | 0.2 | GO:0070094 | positive regulation of glucagon secretion(GO:0070094) |
| 0.0 | 0.1 | GO:0006552 | leucine catabolic process(GO:0006552) |
| 0.0 | 0.1 | GO:0033540 | fatty acid beta-oxidation using acyl-CoA oxidase(GO:0033540) |
| 0.0 | 0.1 | GO:0042412 | taurine biosynthetic process(GO:0042412) |
| 0.0 | 0.3 | GO:0007021 | tubulin complex assembly(GO:0007021) |
| 0.0 | 0.1 | GO:0031860 | telomeric 3' overhang formation(GO:0031860) |
| 0.0 | 0.5 | GO:0031573 | intra-S DNA damage checkpoint(GO:0031573) |
| 0.0 | 0.1 | GO:1900453 | negative regulation of long term synaptic depression(GO:1900453) |
| 0.0 | 0.1 | GO:0097010 | eukaryotic translation initiation factor 4F complex assembly(GO:0097010) |
| 0.0 | 0.0 | GO:0019405 | alditol catabolic process(GO:0019405) |
| 0.0 | 0.3 | GO:0008616 | queuosine biosynthetic process(GO:0008616) queuosine metabolic process(GO:0046116) |
| 0.0 | 0.2 | GO:0002636 | positive regulation of germinal center formation(GO:0002636) B cell costimulation(GO:0031296) |
| 0.0 | 0.2 | GO:0006868 | glutamine transport(GO:0006868) |
| 0.0 | 0.1 | GO:0042339 | keratan sulfate metabolic process(GO:0042339) |
| 0.0 | 0.1 | GO:0015811 | L-cystine transport(GO:0015811) |
| 0.0 | 0.1 | GO:0035973 | aggrephagy(GO:0035973) |
| 0.0 | 0.2 | GO:0051182 | coenzyme transport(GO:0051182) |
| 0.0 | 0.1 | GO:0000957 | mitochondrial RNA catabolic process(GO:0000957) regulation of mitochondrial RNA catabolic process(GO:0000960) |
| 0.0 | 0.3 | GO:0018344 | protein geranylgeranylation(GO:0018344) |
| 0.0 | 0.2 | GO:0042256 | mature ribosome assembly(GO:0042256) |
| 0.0 | 0.1 | GO:0061357 | positive regulation of Wnt protein secretion(GO:0061357) |
| 0.0 | 0.2 | GO:2000766 | negative regulation of cytoplasmic translation(GO:2000766) |
| 0.0 | 0.2 | GO:0075522 | IRES-dependent viral translational initiation(GO:0075522) |
| 0.0 | 0.2 | GO:1904714 | regulation of chaperone-mediated autophagy(GO:1904714) |
| 0.0 | 0.1 | GO:0048549 | positive regulation of pinocytosis(GO:0048549) |
| 0.0 | 0.4 | GO:0007097 | nuclear migration(GO:0007097) |
| 0.0 | 0.3 | GO:0006265 | DNA topological change(GO:0006265) |
| 0.0 | 0.1 | GO:1902683 | regulation of receptor localization to synapse(GO:1902683) |
| 0.0 | 0.1 | GO:0044725 | chromatin reprogramming in the zygote(GO:0044725) |
| 0.0 | 0.1 | GO:0009405 | pathogenesis(GO:0009405) |
| 0.0 | 0.1 | GO:0090149 | mitochondrial membrane fission(GO:0090149) |
| 0.0 | 0.2 | GO:0021942 | radial glia guided migration of Purkinje cell(GO:0021942) |
| 0.0 | 0.2 | GO:0015886 | heme transport(GO:0015886) |
| 0.0 | 0.1 | GO:0046340 | diacylglycerol catabolic process(GO:0046340) |
| 0.0 | 0.0 | GO:1903691 | positive regulation of wound healing, spreading of epidermal cells(GO:1903691) |
| 0.0 | 0.2 | GO:0001766 | membrane raft polarization(GO:0001766) membrane raft distribution(GO:0031580) |
| 0.0 | 0.2 | GO:0015670 | carbon dioxide transport(GO:0015670) |
| 0.0 | 0.1 | GO:1903715 | regulation of aerobic respiration(GO:1903715) |
| 0.0 | 0.1 | GO:0002634 | regulation of germinal center formation(GO:0002634) |
| 0.0 | 0.2 | GO:0006686 | sphingomyelin biosynthetic process(GO:0006686) |
| 0.0 | 0.3 | GO:0030432 | peristalsis(GO:0030432) |
| 0.0 | 0.0 | GO:0043132 | NAD transport(GO:0043132) |
| 0.0 | 0.1 | GO:2000813 | negative regulation of barbed-end actin filament capping(GO:2000813) |
| 0.0 | 0.1 | GO:0006610 | ribosomal protein import into nucleus(GO:0006610) |
| 0.0 | 0.1 | GO:0035879 | plasma membrane lactate transport(GO:0035879) |
| 0.0 | 0.2 | GO:1901679 | nucleotide transmembrane transport(GO:1901679) |
| 0.0 | 0.0 | GO:0001915 | negative regulation of T cell mediated cytotoxicity(GO:0001915) |
| 0.0 | 0.1 | GO:0098881 | exocytic insertion of neurotransmitter receptor to plasma membrane(GO:0098881) exocytic insertion of neurotransmitter receptor to postsynaptic membrane(GO:0098967) |
| 0.0 | 0.4 | GO:0061157 | mRNA destabilization(GO:0061157) |
| 0.0 | 0.2 | GO:0016926 | protein desumoylation(GO:0016926) |
| 0.0 | 0.1 | GO:0072076 | nephrogenic mesenchyme development(GO:0072076) pattern specification involved in metanephros development(GO:0072268) |
| 0.0 | 0.1 | GO:0061484 | hematopoietic stem cell homeostasis(GO:0061484) |
| 0.0 | 0.1 | GO:0097498 | endothelial tube lumen extension(GO:0097498) |
| 0.0 | 0.1 | GO:0009227 | nucleotide-sugar catabolic process(GO:0009227) |
| 0.0 | 0.1 | GO:0060849 | ventricular cardiac myofibril assembly(GO:0055005) lymphatic endothelial cell fate commitment(GO:0060838) regulation of transcription involved in lymphatic endothelial cell fate commitment(GO:0060849) |
| 0.0 | 0.0 | GO:0003431 | growth plate cartilage chondrocyte development(GO:0003431) |
| 0.0 | 0.1 | GO:2000051 | negative regulation of non-canonical Wnt signaling pathway(GO:2000051) |
| 0.0 | 0.1 | GO:0042539 | hypotonic salinity response(GO:0042539) cellular hypotonic salinity response(GO:0071477) |
| 0.0 | 0.1 | GO:0060112 | generation of ovulation cycle rhythm(GO:0060112) |
| 0.0 | 0.1 | GO:0097680 | double-strand break repair via classical nonhomologous end joining(GO:0097680) |
| 0.0 | 0.3 | GO:2000781 | positive regulation of double-strand break repair(GO:2000781) |
| 0.0 | 0.5 | GO:0015991 | ATP hydrolysis coupled proton transport(GO:0015991) |
| 0.0 | 0.1 | GO:0043686 | co-translational protein modification(GO:0043686) |
| 0.0 | 0.1 | GO:0051612 | negative regulation of neurotransmitter uptake(GO:0051581) regulation of serotonin uptake(GO:0051611) negative regulation of serotonin uptake(GO:0051612) |
| 0.0 | 0.1 | GO:0008626 | granzyme-mediated apoptotic signaling pathway(GO:0008626) |
| 0.0 | 0.0 | GO:1904373 | response to kainic acid(GO:1904373) |
| 0.0 | 0.1 | GO:0046959 | habituation(GO:0046959) |
| 0.0 | 0.1 | GO:0032876 | negative regulation of DNA endoreduplication(GO:0032876) |
| 0.0 | 0.0 | GO:0007181 | transforming growth factor beta receptor complex assembly(GO:0007181) |
| 0.0 | 0.3 | GO:0006895 | Golgi to endosome transport(GO:0006895) |
| 0.0 | 0.0 | GO:0006543 | glutamine catabolic process(GO:0006543) |
| 0.0 | 0.0 | GO:0060154 | cellular process regulating host cell cycle in response to virus(GO:0060154) |
| 0.0 | 0.2 | GO:0019372 | lipoxygenase pathway(GO:0019372) |
| 0.0 | 0.1 | GO:1904263 | positive regulation of TORC1 signaling(GO:1904263) |
| 0.0 | 0.0 | GO:0019389 | glucuronoside metabolic process(GO:0019389) |
| 0.0 | 0.1 | GO:1990481 | mRNA pseudouridine synthesis(GO:1990481) |
| 0.0 | 0.0 | GO:0060003 | copper ion export(GO:0060003) |
| 0.0 | 0.0 | GO:1904694 | negative regulation of vascular smooth muscle contraction(GO:1904694) |
| 0.0 | 0.1 | GO:0048539 | bone marrow development(GO:0048539) |
| 0.0 | 0.1 | GO:1903800 | positive regulation of production of miRNAs involved in gene silencing by miRNA(GO:1903800) |
| 0.0 | 0.0 | GO:0033364 | mast cell secretory granule organization(GO:0033364) |
| 0.0 | 0.0 | GO:2000312 | regulation of kainate selective glutamate receptor activity(GO:2000312) |
| 0.0 | 0.3 | GO:0032012 | regulation of ARF protein signal transduction(GO:0032012) |
| 0.0 | 0.1 | GO:0033668 | negative regulation by symbiont of host apoptotic process(GO:0033668) negative regulation by symbiont of host programmed cell death(GO:0052041) negative regulation by organism of programmed cell death in other organism involved in symbiotic interaction(GO:0052490) |
| 0.0 | 0.3 | GO:0032400 | melanosome localization(GO:0032400) |
| 0.0 | 0.2 | GO:0043374 | CD8-positive, alpha-beta T cell differentiation(GO:0043374) |
| 0.0 | 0.6 | GO:1903959 | regulation of anion transmembrane transport(GO:1903959) |
| 0.0 | 0.1 | GO:0034497 | protein localization to pre-autophagosomal structure(GO:0034497) |
| 0.0 | 0.1 | GO:0071352 | cellular response to interleukin-2(GO:0071352) |
| 0.0 | 0.0 | GO:0015755 | fructose transport(GO:0015755) |
| 0.0 | 0.0 | GO:1902544 | regulation of DNA N-glycosylase activity(GO:1902544) |
| 0.0 | 0.2 | GO:0030828 | positive regulation of cGMP biosynthetic process(GO:0030828) |
| 0.0 | 0.2 | GO:0046597 | negative regulation of viral entry into host cell(GO:0046597) |
| 0.0 | 0.0 | GO:0016240 | autophagosome docking(GO:0016240) |
| 0.0 | 0.0 | GO:0045716 | positive regulation of low-density lipoprotein particle receptor biosynthetic process(GO:0045716) |
| 0.0 | 0.2 | GO:0051895 | negative regulation of focal adhesion assembly(GO:0051895) |
| 0.0 | 0.1 | GO:1903232 | melanosome assembly(GO:1903232) |
| 0.0 | 0.1 | GO:0016024 | CDP-diacylglycerol biosynthetic process(GO:0016024) |
| 0.0 | 0.1 | GO:0034058 | endosomal vesicle fusion(GO:0034058) |
| 0.0 | 0.2 | GO:0043968 | histone H2A acetylation(GO:0043968) |
| 0.0 | 0.1 | GO:0019532 | oxalate transport(GO:0019532) |
| 0.0 | 0.0 | GO:0010587 | miRNA catabolic process(GO:0010587) |
| 0.0 | 0.1 | GO:0006269 | DNA replication, synthesis of RNA primer(GO:0006269) |
| 0.0 | 0.0 | GO:0044337 | canonical Wnt signaling pathway involved in positive regulation of apoptotic process(GO:0044337) cellular response to iron(II) ion(GO:0071282) negative regulation of dopaminergic neuron differentiation(GO:1904339) |
Gene overrepresentation in cellular component category:
| Log-likelihood per target | Total log-likelihood | Term | Description |
|---|---|---|---|
| 0.1 | 0.7 | GO:0005879 | axonemal microtubule(GO:0005879) |
| 0.1 | 0.5 | GO:0030896 | checkpoint clamp complex(GO:0030896) |
| 0.1 | 0.3 | GO:0030956 | glutamyl-tRNA(Gln) amidotransferase complex(GO:0030956) |
| 0.1 | 1.0 | GO:0033180 | proton-transporting V-type ATPase, V1 domain(GO:0033180) |
| 0.1 | 0.6 | GO:0097418 | neurofibrillary tangle(GO:0097418) |
| 0.1 | 0.5 | GO:0000243 | commitment complex(GO:0000243) |
| 0.1 | 0.7 | GO:0030130 | clathrin coat of trans-Golgi network vesicle(GO:0030130) |
| 0.0 | 0.1 | GO:0097629 | extrinsic component of omegasome membrane(GO:0097629) |
| 0.0 | 0.1 | GO:1990723 | cytoplasmic periphery of the nuclear pore complex(GO:1990723) |
| 0.0 | 0.3 | GO:1990316 | ATG1/ULK1 kinase complex(GO:1990316) |
| 0.0 | 0.2 | GO:0097025 | MPP7-DLG1-LIN7 complex(GO:0097025) |
| 0.0 | 0.5 | GO:1990635 | proximal dendrite(GO:1990635) |
| 0.0 | 0.4 | GO:0005869 | dynactin complex(GO:0005869) |
| 0.0 | 0.2 | GO:0097361 | CIA complex(GO:0097361) |
| 0.0 | 0.1 | GO:0035101 | FACT complex(GO:0035101) |
| 0.0 | 0.1 | GO:1990796 | photoreceptor cell terminal bouton(GO:1990796) |
| 0.0 | 0.2 | GO:0005968 | Rab-protein geranylgeranyltransferase complex(GO:0005968) |
| 0.0 | 0.2 | GO:0034751 | aryl hydrocarbon receptor complex(GO:0034751) |
| 0.0 | 0.3 | GO:0030991 | intraciliary transport particle A(GO:0030991) |
| 0.0 | 0.1 | GO:0005899 | insulin receptor complex(GO:0005899) |
| 0.0 | 0.3 | GO:0071439 | clathrin complex(GO:0071439) |
| 0.0 | 0.3 | GO:0071203 | WASH complex(GO:0071203) |
| 0.0 | 0.4 | GO:0032541 | cortical endoplasmic reticulum(GO:0032541) |
| 0.0 | 0.4 | GO:0042405 | nuclear inclusion body(GO:0042405) |
| 0.0 | 0.3 | GO:0005641 | nuclear envelope lumen(GO:0005641) |
| 0.0 | 0.3 | GO:0097197 | tetraspanin-enriched microdomain(GO:0097197) |
| 0.0 | 0.1 | GO:0034274 | Atg12-Atg5-Atg16 complex(GO:0034274) |
| 0.0 | 0.1 | GO:1990745 | EARP complex(GO:1990745) |
| 0.0 | 0.2 | GO:0097422 | tubular endosome(GO:0097422) |
| 0.0 | 0.3 | GO:0070775 | H3 histone acetyltransferase complex(GO:0070775) MOZ/MORF histone acetyltransferase complex(GO:0070776) |
| 0.0 | 0.3 | GO:0044666 | MLL3/4 complex(GO:0044666) |
| 0.0 | 0.1 | GO:0005797 | Golgi medial cisterna(GO:0005797) |
| 0.0 | 1.0 | GO:0016235 | aggresome(GO:0016235) |
| 0.0 | 0.2 | GO:0034991 | nuclear meiotic cohesin complex(GO:0034991) |
| 0.0 | 0.1 | GO:0030870 | Mre11 complex(GO:0030870) |
| 0.0 | 0.6 | GO:0005721 | pericentric heterochromatin(GO:0005721) |
| 0.0 | 0.2 | GO:0000808 | origin recognition complex(GO:0000808) nuclear origin of replication recognition complex(GO:0005664) |
| 0.0 | 0.1 | GO:0090571 | RNA polymerase II transcription repressor complex(GO:0090571) |
| 0.0 | 0.1 | GO:0031085 | BLOC-3 complex(GO:0031085) |
| 0.0 | 0.2 | GO:0072687 | meiotic spindle(GO:0072687) |
| 0.0 | 0.0 | GO:0045025 | mitochondrial degradosome(GO:0045025) |
| 0.0 | 0.1 | GO:0000138 | Golgi trans cisterna(GO:0000138) |
| 0.0 | 0.0 | GO:0034457 | Mpp10 complex(GO:0034457) |
| 0.0 | 0.4 | GO:0035861 | site of double-strand break(GO:0035861) |
| 0.0 | 0.2 | GO:0044294 | dendritic growth cone(GO:0044294) |
| 0.0 | 0.3 | GO:0034364 | high-density lipoprotein particle(GO:0034364) |
| 0.0 | 0.0 | GO:0031230 | intrinsic component of cell outer membrane(GO:0031230) integral component of cell outer membrane(GO:0045203) |
| 0.0 | 0.1 | GO:0044352 | pinosome(GO:0044352) macropinosome(GO:0044354) |
| 0.0 | 0.1 | GO:0005927 | muscle tendon junction(GO:0005927) |
| 0.0 | 0.2 | GO:0032039 | integrator complex(GO:0032039) |
| 0.0 | 0.4 | GO:0035371 | microtubule plus-end(GO:0035371) |
| 0.0 | 0.1 | GO:0042555 | MCM complex(GO:0042555) |
| 0.0 | 0.3 | GO:0000242 | pericentriolar material(GO:0000242) |
| 0.0 | 0.1 | GO:0072669 | tRNA-splicing ligase complex(GO:0072669) |
| 0.0 | 0.1 | GO:0071141 | SMAD protein complex(GO:0071141) |
| 0.0 | 0.3 | GO:0097440 | apical dendrite(GO:0097440) |
| 0.0 | 0.2 | GO:0000407 | pre-autophagosomal structure(GO:0000407) |
| 0.0 | 0.2 | GO:0030140 | trans-Golgi network transport vesicle(GO:0030140) |
| 0.0 | 0.1 | GO:0000800 | lateral element(GO:0000800) |
Gene overrepresentation in molecular function category:
| Log-likelihood per target | Total log-likelihood | Term | Description |
|---|---|---|---|
| 0.2 | 0.5 | GO:0005302 | L-tyrosine transmembrane transporter activity(GO:0005302) |
| 0.1 | 0.3 | GO:0001069 | regulatory region RNA binding(GO:0001069) |
| 0.1 | 0.3 | GO:0050567 | glutaminyl-tRNA synthase (glutamine-hydrolyzing) activity(GO:0050567) |
| 0.1 | 0.4 | GO:0071558 | histone demethylase activity (H3-K27 specific)(GO:0071558) |
| 0.1 | 0.3 | GO:0019912 | cyclin-dependent protein kinase activating kinase activity(GO:0019912) |
| 0.1 | 0.3 | GO:0001601 | peptide YY receptor activity(GO:0001601) |
| 0.1 | 0.5 | GO:0061578 | Lys63-specific deubiquitinase activity(GO:0061578) |
| 0.1 | 0.2 | GO:0004724 | magnesium-dependent protein serine/threonine phosphatase activity(GO:0004724) |
| 0.1 | 0.2 | GO:0004874 | aryl hydrocarbon receptor activity(GO:0004874) |
| 0.1 | 0.6 | GO:0032050 | clathrin heavy chain binding(GO:0032050) |
| 0.1 | 0.2 | GO:0016971 | flavin-linked sulfhydryl oxidase activity(GO:0016971) |
| 0.1 | 0.4 | GO:0016936 | galactoside binding(GO:0016936) |
| 0.1 | 0.3 | GO:0003917 | DNA topoisomerase type I activity(GO:0003917) |
| 0.1 | 0.2 | GO:0005119 | smoothened binding(GO:0005119) |
| 0.1 | 0.2 | GO:1990189 | peptide-serine-N-acetyltransferase activity(GO:1990189) |
| 0.0 | 0.2 | GO:0004008 | copper-exporting ATPase activity(GO:0004008) copper-transporting ATPase activity(GO:0043682) |
| 0.0 | 0.3 | GO:0033592 | RNA strand annealing activity(GO:0033592) |
| 0.0 | 0.2 | GO:0008499 | UDP-galactose:beta-N-acetylglucosamine beta-1,3-galactosyltransferase activity(GO:0008499) |
| 0.0 | 0.2 | GO:0097016 | L27 domain binding(GO:0097016) |
| 0.0 | 0.1 | GO:2001070 | starch binding(GO:2001070) |
| 0.0 | 0.3 | GO:1990226 | histone methyltransferase binding(GO:1990226) |
| 0.0 | 0.7 | GO:0046961 | proton-transporting ATPase activity, rotational mechanism(GO:0046961) |
| 0.0 | 0.7 | GO:0005247 | voltage-gated chloride channel activity(GO:0005247) |
| 0.0 | 0.3 | GO:0031995 | insulin-like growth factor II binding(GO:0031995) |
| 0.0 | 0.1 | GO:0004594 | pantothenate kinase activity(GO:0004594) |
| 0.0 | 0.1 | GO:0015186 | L-glutamine transmembrane transporter activity(GO:0015186) |
| 0.0 | 0.3 | GO:0008479 | queuine tRNA-ribosyltransferase activity(GO:0008479) |
| 0.0 | 0.1 | GO:0008449 | N-acetylglucosamine-6-sulfatase activity(GO:0008449) |
| 0.0 | 0.1 | GO:0004185 | serine-type carboxypeptidase activity(GO:0004185) |
| 0.0 | 0.1 | GO:0003831 | beta-N-acetylglucosaminylglycopeptide beta-1,4-galactosyltransferase activity(GO:0003831) |
| 0.0 | 0.6 | GO:0032454 | histone demethylase activity (H3-K9 specific)(GO:0032454) |
| 0.0 | 0.1 | GO:0035827 | rubidium ion transmembrane transporter activity(GO:0035827) |
| 0.0 | 0.2 | GO:0033188 | sphingomyelin synthase activity(GO:0033188) ceramide cholinephosphotransferase activity(GO:0047493) |
| 0.0 | 0.1 | GO:0016426 | tRNA (adenine) methyltransferase activity(GO:0016426) |
| 0.0 | 0.3 | GO:0008140 | cAMP response element binding protein binding(GO:0008140) |
| 0.0 | 0.1 | GO:0004591 | oxoglutarate dehydrogenase (succinyl-transferring) activity(GO:0004591) |
| 0.0 | 0.1 | GO:0036033 | mediator complex binding(GO:0036033) |
| 0.0 | 0.1 | GO:0004616 | phosphogluconate dehydrogenase (decarboxylating) activity(GO:0004616) |
| 0.0 | 0.2 | GO:0051880 | G-quadruplex DNA binding(GO:0051880) |
| 0.0 | 0.1 | GO:0051185 | coenzyme transporter activity(GO:0051185) |
| 0.0 | 0.5 | GO:0032266 | phosphatidylinositol-3-phosphate binding(GO:0032266) |
| 0.0 | 0.0 | GO:0001602 | pancreatic polypeptide receptor activity(GO:0001602) |
| 0.0 | 0.2 | GO:0015232 | heme transporter activity(GO:0015232) |
| 0.0 | 0.1 | GO:0015184 | L-cystine transmembrane transporter activity(GO:0015184) |
| 0.0 | 0.2 | GO:0050291 | sphingosine N-acyltransferase activity(GO:0050291) |
| 0.0 | 0.1 | GO:0003997 | acyl-CoA oxidase activity(GO:0003997) |
| 0.0 | 0.1 | GO:0102390 | mycophenolic acid acyl-glucuronide esterase activity(GO:0102390) |
| 0.0 | 0.2 | GO:0070087 | chromo shadow domain binding(GO:0070087) |
| 0.0 | 0.3 | GO:0003708 | retinoic acid receptor activity(GO:0003708) |
| 0.0 | 0.1 | GO:0017040 | ceramidase activity(GO:0017040) |
| 0.0 | 0.1 | GO:0004661 | protein geranylgeranyltransferase activity(GO:0004661) |
| 0.0 | 0.1 | GO:0005105 | type 1 fibroblast growth factor receptor binding(GO:0005105) |
| 0.0 | 0.1 | GO:0050294 | steroid sulfotransferase activity(GO:0050294) |
| 0.0 | 0.2 | GO:0005000 | vasopressin receptor activity(GO:0005000) |
| 0.0 | 0.1 | GO:0031752 | D5 dopamine receptor binding(GO:0031752) |
| 0.0 | 0.2 | GO:0016308 | 1-phosphatidylinositol-4-phosphate 5-kinase activity(GO:0016308) |
| 0.0 | 0.1 | GO:0070579 | methylcytosine dioxygenase activity(GO:0070579) |
| 0.0 | 0.8 | GO:0017112 | Rab guanyl-nucleotide exchange factor activity(GO:0017112) |
| 0.0 | 0.2 | GO:0019911 | structural constituent of myelin sheath(GO:0019911) |
| 0.0 | 0.6 | GO:0036002 | pre-mRNA binding(GO:0036002) |
| 0.0 | 0.1 | GO:0005534 | galactose binding(GO:0005534) |
| 0.0 | 0.4 | GO:0016641 | oxidoreductase activity, acting on the CH-NH2 group of donors, oxygen as acceptor(GO:0016641) |
| 0.0 | 0.1 | GO:0015129 | lactate transmembrane transporter activity(GO:0015129) |
| 0.0 | 0.5 | GO:0070273 | phosphatidylinositol-4-phosphate binding(GO:0070273) |
| 0.0 | 0.1 | GO:0008517 | folic acid transporter activity(GO:0008517) |
| 0.0 | 0.2 | GO:0016929 | SUMO-specific protease activity(GO:0016929) |
| 0.0 | 0.4 | GO:0034237 | protein kinase A regulatory subunit binding(GO:0034237) |
| 0.0 | 0.2 | GO:0015379 | potassium:chloride symporter activity(GO:0015379) potassium ion symporter activity(GO:0022820) |
| 0.0 | 0.5 | GO:0070064 | proline-rich region binding(GO:0070064) |
| 0.0 | 0.2 | GO:0035925 | mRNA 3'-UTR AU-rich region binding(GO:0035925) |
| 0.0 | 0.3 | GO:0016922 | ligand-dependent nuclear receptor binding(GO:0016922) |
| 0.0 | 0.1 | GO:0010340 | carboxyl-O-methyltransferase activity(GO:0010340) protein carboxyl O-methyltransferase activity(GO:0051998) |
| 0.0 | 0.1 | GO:0050544 | arachidonic acid binding(GO:0050544) |
| 0.0 | 0.1 | GO:0016421 | CoA carboxylase activity(GO:0016421) |
| 0.0 | 0.0 | GO:0070653 | high-density lipoprotein particle receptor binding(GO:0070653) |
| 0.0 | 0.1 | GO:0042134 | rRNA primary transcript binding(GO:0042134) |
| 0.0 | 0.6 | GO:0005109 | frizzled binding(GO:0005109) |
| 0.0 | 0.6 | GO:0005164 | tumor necrosis factor receptor binding(GO:0005164) |
| 0.0 | 0.1 | GO:0072345 | NAADP-sensitive calcium-release channel activity(GO:0072345) |
| 0.0 | 0.1 | GO:0001665 | alpha-N-acetylgalactosaminide alpha-2,6-sialyltransferase activity(GO:0001665) |
| 0.0 | 0.0 | GO:0004507 | steroid 11-beta-monooxygenase activity(GO:0004507) corticosterone 18-monooxygenase activity(GO:0047783) |
| 0.0 | 0.0 | GO:0004075 | biotin carboxylase activity(GO:0004075) |
| 0.0 | 0.0 | GO:0008263 | pyrimidine-specific mismatch base pair DNA N-glycosylase activity(GO:0008263) |
| 0.0 | 0.1 | GO:0004366 | glycerol-3-phosphate O-acyltransferase activity(GO:0004366) |
| 0.0 | 0.1 | GO:0031852 | mu-type opioid receptor binding(GO:0031852) |
| 0.0 | 0.1 | GO:0003688 | DNA replication origin binding(GO:0003688) |
| 0.0 | 0.1 | GO:0015250 | water channel activity(GO:0015250) |
| 0.0 | 0.2 | GO:0005092 | GDP-dissociation inhibitor activity(GO:0005092) |
| 0.0 | 0.2 | GO:0009982 | pseudouridine synthase activity(GO:0009982) |
| 0.0 | 0.1 | GO:0001155 | TFIIIA-class transcription factor binding(GO:0001155) |
| 0.0 | 0.2 | GO:0005351 | sugar:proton symporter activity(GO:0005351) |
| 0.0 | 0.2 | GO:0017166 | vinculin binding(GO:0017166) |
| 0.0 | 0.1 | GO:0043141 | ATP-dependent 5'-3' DNA helicase activity(GO:0043141) |
| 0.0 | 0.1 | GO:0035184 | histone threonine kinase activity(GO:0035184) |
| 0.0 | 0.2 | GO:0015215 | nucleotide transmembrane transporter activity(GO:0015215) |
Gene overrepresentation in curated gene sets: canonical pathways category:
| Log-likelihood per target | Total log-likelihood | Term | Description |
|---|---|---|---|
| 0.0 | 0.6 | PID BETA CATENIN DEG PATHWAY | Degradation of beta catenin |
| 0.0 | 1.1 | PID ATM PATHWAY | ATM pathway |
| 0.0 | 0.1 | ST PAC1 RECEPTOR PATHWAY | PAC1 Receptor Pathway |
| 0.0 | 0.5 | PID FOXM1 PATHWAY | FOXM1 transcription factor network |
| 0.0 | 0.2 | PID S1P S1P4 PATHWAY | S1P4 pathway |
| 0.0 | 0.5 | PID P38 ALPHA BETA DOWNSTREAM PATHWAY | Signaling mediated by p38-alpha and p38-beta |
Gene overrepresentation in curated gene sets: REACTOME pathways category:
| Log-likelihood per target | Total log-likelihood | Term | Description |
|---|---|---|---|
| 0.0 | 0.3 | REACTOME CS DS DEGRADATION | Genes involved in CS/DS degradation |
| 0.0 | 0.1 | REACTOME THROMBOXANE SIGNALLING THROUGH TP RECEPTOR | Genes involved in Thromboxane signalling through TP receptor |
| 0.0 | 0.6 | REACTOME SIGNALING BY HIPPO | Genes involved in Signaling by Hippo |
| 0.0 | 0.6 | REACTOME REGULATION OF GENE EXPRESSION IN BETA CELLS | Genes involved in Regulation of gene expression in beta cells |
| 0.0 | 0.8 | REACTOME ACTIVATION OF ATR IN RESPONSE TO REPLICATION STRESS | Genes involved in Activation of ATR in response to replication stress |
| 0.0 | 0.3 | REACTOME RECEPTOR LIGAND BINDING INITIATES THE SECOND PROTEOLYTIC CLEAVAGE OF NOTCH RECEPTOR | Genes involved in Receptor-ligand binding initiates the second proteolytic cleavage of Notch receptor |
| 0.0 | 0.3 | REACTOME ACTIVATION OF THE AP1 FAMILY OF TRANSCRIPTION FACTORS | Genes involved in Activation of the AP-1 family of transcription factors |
| 0.0 | 0.2 | REACTOME NFKB ACTIVATION THROUGH FADD RIP1 PATHWAY MEDIATED BY CASPASE 8 AND10 | Genes involved in NF-kB activation through FADD/RIP-1 pathway mediated by caspase-8 and -10 |
| 0.0 | 0.7 | REACTOME GLYCOSPHINGOLIPID METABOLISM | Genes involved in Glycosphingolipid metabolism |
| 0.0 | 0.3 | REACTOME REGULATION OF PYRUVATE DEHYDROGENASE PDH COMPLEX | Genes involved in Regulation of pyruvate dehydrogenase (PDH) complex |
| 0.0 | 0.6 | REACTOME AMINO ACID TRANSPORT ACROSS THE PLASMA MEMBRANE | Genes involved in Amino acid transport across the plasma membrane |
| 0.0 | 0.1 | REACTOME KERATAN SULFATE DEGRADATION | Genes involved in Keratan sulfate degradation |
| 0.0 | 0.1 | REACTOME PASSIVE TRANSPORT BY AQUAPORINS | Genes involved in Passive Transport by Aquaporins |
| 0.0 | 0.1 | REACTOME ALPHA LINOLENIC ACID ALA METABOLISM | Genes involved in alpha-linolenic acid (ALA) metabolism |
| 0.0 | 0.3 | REACTOME CIRCADIAN REPRESSION OF EXPRESSION BY REV ERBA | Genes involved in Circadian Repression of Expression by REV-ERBA |
| 0.0 | 0.1 | REACTOME BILE SALT AND ORGANIC ANION SLC TRANSPORTERS | Genes involved in Bile salt and organic anion SLC transporters |
| 0.0 | 0.1 | REACTOME ERKS ARE INACTIVATED | Genes involved in ERKs are inactivated |
| 0.0 | 0.3 | REACTOME TRANSFERRIN ENDOCYTOSIS AND RECYCLING | Genes involved in Transferrin endocytosis and recycling |
| 0.0 | 0.2 | REACTOME INITIAL TRIGGERING OF COMPLEMENT | Genes involved in Initial triggering of complement |
| 0.0 | 0.4 | REACTOME MEIOTIC RECOMBINATION | Genes involved in Meiotic Recombination |