Project
GSE49485: Hypoxia transcriptome sequencing of rat brain.
Navigation
Downloads
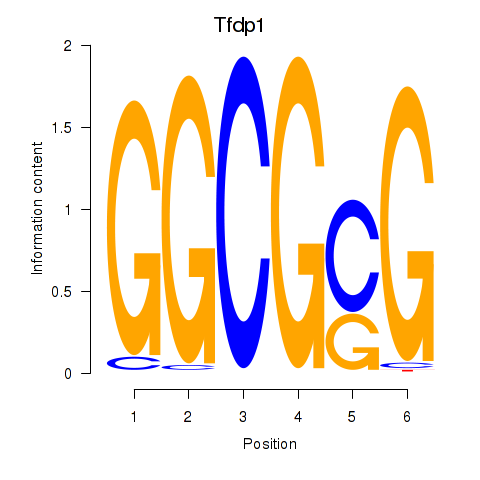
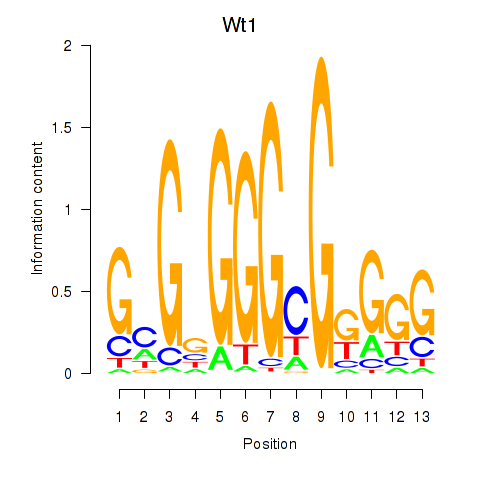
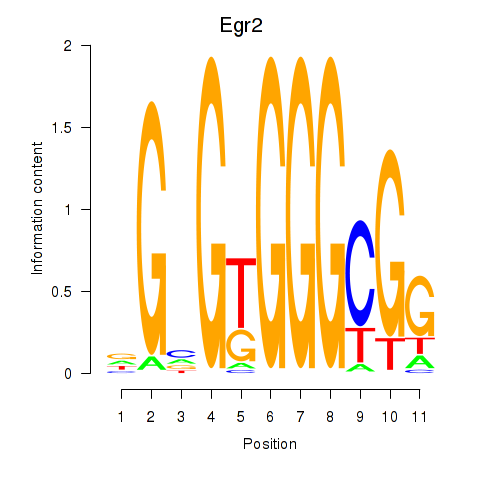
Results for Tfdp1_Wt1_Egr2
Z-value: 3.42
Motif logo
Transcription factors associated with Tfdp1_Wt1_Egr2
| Gene Symbol | Gene ID | Gene Info |
|---|---|---|
|
Tfdp1
|
ENSRNOG00000019222 | transcription factor Dp-1 |
|
Wt1
|
ENSRNOG00000013074 | Wilms tumor 1 |
|
Egr2
|
ENSRNOG00000000640 | early growth response 2 |
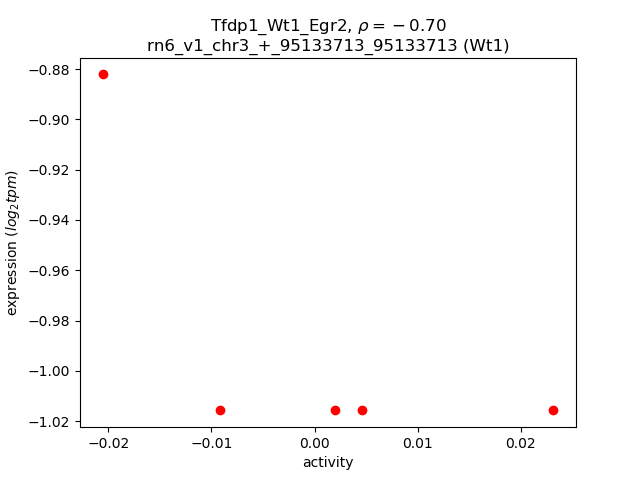
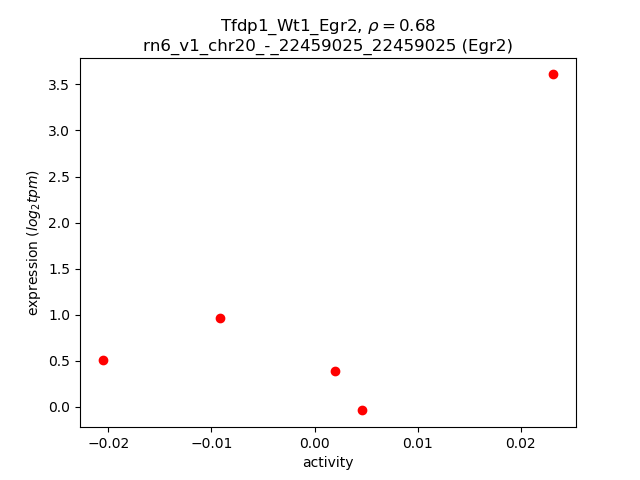
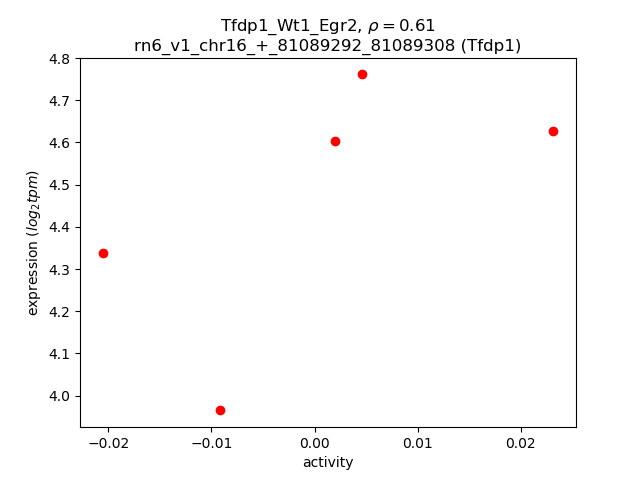
Activity-expression correlation:
| Gene | Promoter | Pearson corr. coef. | P-value | Plot |
|---|---|---|---|---|
| Wt1 | rn6_v1_chr3_+_95133713_95133713 | -0.70 | 1.8e-01 | Click! |
| Egr2 | rn6_v1_chr20_-_22459025_22459025 | 0.68 | 2.1e-01 | Click! |
| Tfdp1 | rn6_v1_chr16_+_81089292_81089308 | 0.61 | 2.8e-01 | Click! |
Activity profile of Tfdp1_Wt1_Egr2 motif
Sorted Z-values of Tfdp1_Wt1_Egr2 motif
| Promoter | Log-likelihood | Transcript | Gene | Gene Info |
|---|---|---|---|---|
| chr7_+_70364813 | 4.78 |
ENSRNOT00000084012
ENSRNOT00000031230 |
Agap2
|
ArfGAP with GTPase domain, ankyrin repeat and PH domain 2 |
| chr7_+_130474279 | 4.65 |
ENSRNOT00000092388
|
Shank3
|
SH3 and multiple ankyrin repeat domains 3 |
| chr7_+_130474508 | 4.27 |
ENSRNOT00000085191
|
Shank3
|
SH3 and multiple ankyrin repeat domains 3 |
| chr3_-_164095878 | 3.73 |
ENSRNOT00000079414
|
B4galt5
|
beta-1,4-galactosyltransferase 5 |
| chr20_+_5535432 | 2.94 |
ENSRNOT00000040859
|
Syngap1
|
synaptic Ras GTPase activating protein 1 |
| chr1_+_266953139 | 2.92 |
ENSRNOT00000054696
|
Neurl1
|
neuralized E3 ubiquitin protein ligase 1 |
| chr5_-_172623899 | 2.86 |
ENSRNOT00000080591
|
Ski
|
SKI proto-oncogene |
| chr10_+_62674561 | 2.77 |
ENSRNOT00000019946
ENSRNOT00000056110 |
Ankrd13b
|
ankyrin repeat domain 13B |
| chr1_-_125967756 | 2.74 |
ENSRNOT00000031488
|
Fam189a1
|
family with sequence similarity 189, member A1 |
| chr16_+_19051965 | 2.66 |
ENSRNOT00000016399
|
Slc35e1
|
solute carrier family 35, member E1 |
| chr1_+_226435979 | 2.52 |
ENSRNOT00000048704
ENSRNOT00000036232 ENSRNOT00000035576 ENSRNOT00000036180 ENSRNOT00000036168 ENSRNOT00000047964 ENSRNOT00000036283 ENSRNOT00000007429 |
Syt7
|
synaptotagmin 7 |
| chr8_-_6203515 | 2.52 |
ENSRNOT00000087278
ENSRNOT00000031189 ENSRNOT00000008074 ENSRNOT00000085285 ENSRNOT00000007866 |
Yap1
|
yes-associated protein 1 |
| chr10_-_56444847 | 2.43 |
ENSRNOT00000056872
ENSRNOT00000092662 |
Nlgn2
|
neuroligin 2 |
| chr14_+_87312203 | 2.37 |
ENSRNOT00000088032
|
Adcy1
|
adenylate cyclase 1 |
| chr1_+_282134981 | 2.23 |
ENSRNOT00000036203
|
Nanos1
|
nanos C2HC-type zinc finger 1 |
| chr10_+_67862054 | 2.22 |
ENSRNOT00000031746
|
Cdk5r1
|
cyclin-dependent kinase 5 regulatory subunit 1 |
| chr14_+_81819799 | 2.22 |
ENSRNOT00000076840
|
Mxd4
|
Max dimerization protein 4 |
| chr16_-_9709347 | 2.18 |
ENSRNOT00000083933
|
Mapk8
|
mitogen-activated protein kinase 8 |
| chr19_-_55490426 | 2.17 |
ENSRNOT00000081800
|
Cbfa2t3
|
CBFA2/RUNX1 translocation partner 3 |
| chr3_-_147865393 | 2.16 |
ENSRNOT00000009852
|
Sox12
|
SRY box 12 |
| chr6_-_132183434 | 2.15 |
ENSRNOT00000079807
|
AABR07065498.1
|
|
| chr10_+_85301875 | 2.11 |
ENSRNOT00000080935
|
Socs7
|
suppressor of cytokine signaling 7 |
| chr1_-_165967069 | 2.07 |
ENSRNOT00000089359
|
Arhgef17
|
Rho guanine nucleotide exchange factor (GEF) 17 |
| chr10_-_17075139 | 2.06 |
ENSRNOT00000039398
|
Neurl1b
|
neuralized E3 ubiquitin protein ligase 1B |
| chr6_-_135829953 | 2.04 |
ENSRNOT00000080623
ENSRNOT00000039059 |
Cdc42bpb
|
CDC42 binding protein kinase beta |
| chr20_-_19825150 | 2.04 |
ENSRNOT00000032159
|
Ccdc6
|
coiled-coil domain containing 6 |
| chr18_+_53727209 | 2.03 |
ENSRNOT00000026706
|
Isoc1
|
isochorismatase domain containing 1 |
| chr3_+_161433410 | 2.00 |
ENSRNOT00000024657
|
Slc12a5
|
solute carrier family 12 member 5 |
| chr6_-_132972511 | 1.92 |
ENSRNOT00000082216
|
Begain
|
brain-enriched guanylate kinase-associated |
| chr10_-_88754829 | 1.91 |
ENSRNOT00000026354
|
Stat5b
|
signal transducer and activator of transcription 5B |
| chr14_-_78902063 | 1.89 |
ENSRNOT00000088469
|
Ppp2r2c
|
protein phosphatase 2, regulatory subunit B, gamma |
| chr17_-_55709740 | 1.88 |
ENSRNOT00000033359
|
RGD1562037
|
similar to OTTHUMP00000046255 |
| chr10_-_85684138 | 1.86 |
ENSRNOT00000017989
|
Pip4k2b
|
phosphatidylinositol-5-phosphate 4-kinase type 2 beta |
| chr12_-_2555164 | 1.86 |
ENSRNOT00000084460
ENSRNOT00000061821 |
Map2k7
|
mitogen activated protein kinase kinase 7 |
| chr6_+_132702448 | 1.85 |
ENSRNOT00000005743
|
Yy1
|
YY1 transcription factor |
| chr4_-_145147397 | 1.82 |
ENSRNOT00000010347
|
Lhfpl4
|
lipoma HMGIC fusion partner-like 4 |
| chr8_-_115981910 | 1.76 |
ENSRNOT00000019867
|
Dock3
|
dedicator of cyto-kinesis 3 |
| chr10_-_74679858 | 1.76 |
ENSRNOT00000003859
|
Ppm1e
|
protein phosphatase, Mg2+/Mn2+ dependent, 1E |
| chr6_-_25616995 | 1.75 |
ENSRNOT00000077894
|
Fosl2
|
FOS like 2, AP-1 transcription factor subunit |
| chr1_-_126227469 | 1.74 |
ENSRNOT00000087332
|
Tjp1
|
tight junction protein 1 |
| chr9_-_41337498 | 1.72 |
ENSRNOT00000039480
|
Fam168b
|
family with sequence similarity 168, member B |
| chr1_+_233382708 | 1.72 |
ENSRNOT00000019174
|
Gnaq
|
G protein subunit alpha q |
| chr7_-_115910522 | 1.71 |
ENSRNOT00000076998
ENSRNOT00000067442 |
Arc
|
activity-regulated cytoskeleton-associated protein |
| chr10_-_61744976 | 1.67 |
ENSRNOT00000079926
ENSRNOT00000092314 ENSRNOT00000034298 |
Sgsm2
|
small G protein signaling modulator 2 |
| chr14_-_2032593 | 1.65 |
ENSRNOT00000000037
|
Fgfrl1
|
fibroblast growth factor receptor-like 1 |
| chr11_-_65759581 | 1.64 |
ENSRNOT00000034334
|
Lrrc58
|
leucine rich repeat containing 58 |
| chr19_-_53688597 | 1.64 |
ENSRNOT00000074448
|
Zcchc14
|
zinc finger CCHC-type containing 14 |
| chr4_-_147893992 | 1.64 |
ENSRNOT00000032158
|
Plxnd1
|
plexin D1 |
| chr10_-_37645802 | 1.63 |
ENSRNOT00000008022
|
Tcf7
|
transcription factor 7 (T-cell specific, HMG-box) |
| chr11_+_86512797 | 1.62 |
ENSRNOT00000051680
|
Gp1bb
|
glycoprotein Ib platelet beta subunit |
| chr1_+_100297152 | 1.61 |
ENSRNOT00000026100
|
Shank1
|
SH3 and multiple ankyrin repeat domains 1 |
| chr3_+_6211789 | 1.61 |
ENSRNOT00000012892
|
Rxra
|
retinoid X receptor alpha |
| chr7_-_126465723 | 1.60 |
ENSRNOT00000021196
|
Wnt7b
|
wingless-type MMTV integration site family, member 7B |
| chr17_+_16106137 | 1.60 |
ENSRNOT00000060568
|
Fam120a
|
family with sequence similarity 120A |
| chr6_+_9483594 | 1.58 |
ENSRNOT00000089272
|
AABR07062799.2
|
|
| chr1_+_241594565 | 1.57 |
ENSRNOT00000020123
|
Apba1
|
amyloid beta precursor protein binding family A member 1 |
| chr7_-_12393266 | 1.55 |
ENSRNOT00000021709
|
Efna2
|
ephrin A2 |
| chr7_-_119071712 | 1.55 |
ENSRNOT00000037611
|
Myh9l1
|
myosin heavy chain 9-like 1 |
| chr1_+_144831523 | 1.55 |
ENSRNOT00000039748
|
Mex3b
|
mex-3 RNA binding family member B |
| chr5_-_36683356 | 1.54 |
ENSRNOT00000009043
|
Pou3f2
|
POU class 3 homeobox 2 |
| chr7_+_142877086 | 1.54 |
ENSRNOT00000088730
|
Grasp
|
general receptor for phosphoinositides 1 associated scaffold protein |
| chr1_-_80544825 | 1.53 |
ENSRNOT00000057802
ENSRNOT00000040060 ENSRNOT00000067049 ENSRNOT00000052387 ENSRNOT00000073352 |
Relb
|
RELB proto-oncogene, NF-kB subunit |
| chr10_+_103737162 | 1.53 |
ENSRNOT00000055037
|
Tmem104
|
transmembrane protein 104 |
| chr10_-_105552986 | 1.51 |
ENSRNOT00000014699
|
Ube2o
|
ubiquitin-conjugating enzyme E2O |
| chr1_+_173607101 | 1.50 |
ENSRNOT00000074636
|
Tub
|
tubby bipartite transcription factor |
| chr3_+_59981959 | 1.50 |
ENSRNOT00000030460
|
Sp9
|
Sp9 transcription factor |
| chr3_-_13435979 | 1.50 |
ENSRNOT00000029600
|
Pbx3
|
PBX homeobox 3 |
| chr10_-_13619935 | 1.49 |
ENSRNOT00000064392
|
Ccnf
|
cyclin F |
| chr3_-_11885311 | 1.49 |
ENSRNOT00000021189
ENSRNOT00000021178 |
Stxbp1
|
syntaxin binding protein 1 |
| chr9_+_49479023 | 1.49 |
ENSRNOT00000050922
ENSRNOT00000077111 |
Pou3f3
|
POU class 3 homeobox 3 |
| chr20_+_4572100 | 1.47 |
ENSRNOT00000000476
|
Zbtb12
|
zinc finger and BTB domain containing 12 |
| chr3_+_175426752 | 1.46 |
ENSRNOT00000085718
|
Ss18l1
|
SS18L1, nBAF chromatin remodeling complex subunit |
| chr18_+_27657628 | 1.45 |
ENSRNOT00000026303
|
Egr1
|
early growth response 1 |
| chr3_-_163477715 | 1.45 |
ENSRNOT00000009517
|
Prex1
|
phosphatidylinositol-3,4,5-trisphosphate-dependent Rac exchange factor 1 |
| chr20_+_13940877 | 1.44 |
ENSRNOT00000093587
|
Cabin1
|
calcineurin binding protein 1 |
| chr9_+_10013854 | 1.43 |
ENSRNOT00000077653
ENSRNOT00000072033 |
Khsrp
|
KH-type splicing regulatory protein |
| chr3_+_122114108 | 1.43 |
ENSRNOT00000091935
|
Sirpa
|
signal-regulatory protein alpha |
| chr8_+_22189600 | 1.43 |
ENSRNOT00000061100
|
Pde4a
|
phosphodiesterase 4A |
| chr10_+_61685645 | 1.43 |
ENSRNOT00000003933
|
Mnt
|
MAX network transcriptional repressor |
| chr7_-_118396728 | 1.43 |
ENSRNOT00000066431
|
Rbfox2
|
RNA binding protein, fox-1 homolog 2 |
| chr8_+_119566509 | 1.42 |
ENSRNOT00000028633
|
Trank1
|
tetratricopeptide repeat and ankyrin repeat containing 1 |
| chr10_-_85049331 | 1.40 |
ENSRNOT00000012538
|
Tbx21
|
T-box 21 |
| chr16_-_6404957 | 1.40 |
ENSRNOT00000048459
|
Cacna1d
|
calcium voltage-gated channel subunit alpha1 D |
| chr9_-_28973246 | 1.39 |
ENSRNOT00000091865
ENSRNOT00000015453 |
Rims1
|
regulating synaptic membrane exocytosis 1 |
| chr17_-_9721542 | 1.38 |
ENSRNOT00000047958
ENSRNOT00000079063 |
Grk6
|
G protein-coupled receptor kinase 6 |
| chr15_+_24078280 | 1.38 |
ENSRNOT00000015511
ENSRNOT00000063807 |
Mapk1ip1l
|
mitogen-activated protein kinase 1 interacting protein 1-like |
| chr1_+_263186235 | 1.37 |
ENSRNOT00000021876
|
Cnnm1
|
cyclin and CBS domain divalent metal cation transport mediator 1 |
| chr5_+_63781801 | 1.36 |
ENSRNOT00000008302
|
Nr4a3
|
nuclear receptor subfamily 4, group A, member 3 |
| chr19_+_23389375 | 1.36 |
ENSRNOT00000018629
|
Sall1
|
spalt-like transcription factor 1 |
| chr1_-_261446570 | 1.34 |
ENSRNOT00000020182
|
Sfrp5
|
secreted frizzled-related protein 5 |
| chr9_-_28972835 | 1.34 |
ENSRNOT00000086967
ENSRNOT00000079684 |
Rims1
|
regulating synaptic membrane exocytosis 1 |
| chr5_+_172364421 | 1.34 |
ENSRNOT00000018769
|
Hes5
|
hes family bHLH transcription factor 5 |
| chr16_+_20395845 | 1.33 |
ENSRNOT00000078108
|
Mast3
|
microtubule associated serine/threonine kinase 3 |
| chr10_-_55642681 | 1.33 |
ENSRNOT00000057157
|
AC129753.1
|
|
| chr13_+_52976507 | 1.32 |
ENSRNOT00000090599
ENSRNOT00000011324 |
Kif21b
|
kinesin family member 21B |
| chr7_+_142912316 | 1.32 |
ENSRNOT00000010171
|
Nr4a1
|
nuclear receptor subfamily 4, group A, member 1 |
| chr16_-_19225037 | 1.32 |
ENSRNOT00000019052
|
Klf2
|
Kruppel-like factor 2 |
| chr3_-_176144531 | 1.30 |
ENSRNOT00000082266
|
Tcfl5
|
transcription factor like 5 |
| chr5_+_139783951 | 1.28 |
ENSRNOT00000081333
|
Rims3
|
regulating synaptic membrane exocytosis 3 |
| chr20_+_12429315 | 1.28 |
ENSRNOT00000001675
|
Pcbp3
|
poly(rC) binding protein 3 |
| chr1_-_166911694 | 1.28 |
ENSRNOT00000066915
|
Inppl1
|
inositol polyphosphate phosphatase-like 1 |
| chr19_-_56633633 | 1.27 |
ENSRNOT00000023911
|
Ccsap
|
centriole, cilia and spindle-associated protein |
| chr3_-_176644951 | 1.27 |
ENSRNOT00000049961
|
Kcnq2
|
potassium voltage-gated channel subfamily Q member 2 |
| chr15_+_19547871 | 1.27 |
ENSRNOT00000036235
|
Gpr137c
|
G protein-coupled receptor 137C |
| chr8_+_78858570 | 1.26 |
ENSRNOT00000089335
|
Zfp280d
|
zinc finger protein 280D |
| chr19_+_10119253 | 1.25 |
ENSRNOT00000017971
|
Zfp319
|
zinc finger protein 319 |
| chr12_-_37574750 | 1.24 |
ENSRNOT00000066253
|
Kmt5a
|
lysine methyltransferase 5A |
| chr6_-_92760018 | 1.23 |
ENSRNOT00000009560
|
Trim9
|
tripartite motif-containing 9 |
| chr4_+_84597323 | 1.23 |
ENSRNOT00000074054
ENSRNOT00000012755 |
Wipf3
|
WAS/WASL interacting protein family, member 3 |
| chr7_+_73588163 | 1.23 |
ENSRNOT00000015707
|
Kcns2
|
potassium voltage-gated channel, modifier subfamily S, member 2 |
| chr6_-_99783047 | 1.22 |
ENSRNOT00000009028
|
Sptb
|
spectrin, beta, erythrocytic |
| chr8_+_53295222 | 1.22 |
ENSRNOT00000009724
ENSRNOT00000067420 |
Usp28
|
ubiquitin specific peptidase 28 |
| chr15_+_51756978 | 1.22 |
ENSRNOT00000024067
|
Egr3
|
early growth response 3 |
| chr7_-_70552897 | 1.21 |
ENSRNOT00000080594
|
Kif5a
|
kinesin family member 5A |
| chr20_+_6205903 | 1.20 |
ENSRNOT00000092333
ENSRNOT00000092655 |
Kctd20
|
potassium channel tetramerization domain containing 20 |
| chr2_-_115891097 | 1.19 |
ENSRNOT00000013191
|
Skil
|
SKI-like proto-oncogene |
| chr18_-_399242 | 1.19 |
ENSRNOT00000045926
|
F8
|
coagulation factor VIII |
| chr10_-_54967585 | 1.17 |
ENSRNOT00000005255
|
Ntn1
|
netrin 1 |
| chr10_-_14788617 | 1.17 |
ENSRNOT00000043626
|
Cacna1h
|
calcium voltage-gated channel subunit alpha1 H |
| chr10_-_65963932 | 1.17 |
ENSRNOT00000011726
|
Nlk
|
nemo like kinase |
| chr9_+_53906073 | 1.17 |
ENSRNOT00000017813
|
Nab1
|
Ngfi-A binding protein 1 |
| chr1_-_57815038 | 1.16 |
ENSRNOT00000075401
|
Rgmb
|
repulsive guidance molecule family member B |
| chr2_+_34186091 | 1.16 |
ENSRNOT00000016129
|
Sgtb
|
small glutamine rich tetratricopeptide repeat containing beta |
| chr8_+_128577345 | 1.16 |
ENSRNOT00000082356
|
Wdr48
|
WD repeat domain 48 |
| chr1_+_113034227 | 1.16 |
ENSRNOT00000081831
ENSRNOT00000077877 ENSRNOT00000077594 |
Gabrb3
|
gamma-aminobutyric acid type A receptor beta 3 subunit |
| chr10_-_90393317 | 1.16 |
ENSRNOT00000028563
|
Fam171a2
|
family with sequence similarity 171, member A2 |
| chr10_-_56530842 | 1.15 |
ENSRNOT00000077451
|
AABR07029863.3
|
|
| chr6_+_54488038 | 1.15 |
ENSRNOT00000084661
ENSRNOT00000005637 |
Snx13
|
sorting nexin 13 |
| chr1_-_92119951 | 1.14 |
ENSRNOT00000018153
ENSRNOT00000092121 |
Zfp507
|
zinc finger protein 507 |
| chr4_+_2505909 | 1.14 |
ENSRNOT00000092756
|
Ube3c
|
ubiquitin protein ligase E3C |
| chr9_+_100932932 | 1.14 |
ENSRNOT00000065058
|
Ing5
|
inhibitor of growth family, member 5 |
| chr10_+_56546710 | 1.14 |
ENSRNOT00000023003
|
Ybx2
|
Y box binding protein 2 |
| chr10_+_92191718 | 1.14 |
ENSRNOT00000006764
ENSRNOT00000032941 |
Crhr1
|
corticotropin releasing hormone receptor 1 |
| chr4_+_146106386 | 1.13 |
ENSRNOT00000008342
|
Slc6a11
|
solute carrier family 6 member 11 |
| chr9_+_94980409 | 1.13 |
ENSRNOT00000035338
|
Dgkd
|
diacylglycerol kinase, delta |
| chr2_-_183031214 | 1.13 |
ENSRNOT00000013260
|
LOC679811
|
similar to RIKEN cDNA D930015E06 |
| chr1_-_64147251 | 1.12 |
ENSRNOT00000088502
|
Cnot3
|
CCR4-NOT transcription complex, subunit 3 |
| chr1_+_221792221 | 1.11 |
ENSRNOT00000054828
|
Nrxn2
|
neurexin 2 |
| chr1_-_164590562 | 1.11 |
ENSRNOT00000024157
|
Tpbgl
|
trophoblast glycoprotein-like |
| chr18_-_55891710 | 1.11 |
ENSRNOT00000064686
|
Synpo
|
synaptopodin |
| chr8_+_116154736 | 1.11 |
ENSRNOT00000021218
|
Cacna2d2
|
calcium voltage-gated channel auxiliary subunit alpha2delta 2 |
| chr3_+_175408629 | 1.11 |
ENSRNOT00000081344
|
Lsm14b
|
LSM family member 14B |
| chr7_+_125649688 | 1.10 |
ENSRNOT00000017906
|
Phf21b
|
PHD finger protein 21B |
| chr2_+_95320283 | 1.09 |
ENSRNOT00000015537
|
Hey1
|
hes-related family bHLH transcription factor with YRPW motif 1 |
| chr7_-_36000906 | 1.08 |
ENSRNOT00000011178
|
Plxnc1
|
plexin C1 |
| chr12_-_38691075 | 1.08 |
ENSRNOT00000084192
|
Bcl7a
|
BCL tumor suppressor 7A |
| chr6_+_146784915 | 1.07 |
ENSRNOT00000008362
|
Sp8
|
Sp8 transcription factor |
| chr1_-_80221710 | 1.06 |
ENSRNOT00000091687
|
Fosb
|
FosB proto-oncogene, AP-1 transcription factor subunit |
| chr1_-_220644636 | 1.06 |
ENSRNOT00000027632
|
Pacs1
|
phosphofurin acidic cluster sorting protein 1 |
| chr1_-_198460126 | 1.06 |
ENSRNOT00000082940
ENSRNOT00000086019 |
Maz
|
MYC associated zinc finger protein |
| chr5_-_153790157 | 1.06 |
ENSRNOT00000025051
|
Rcan3
|
RCAN family member 3 |
| chr6_+_110624856 | 1.06 |
ENSRNOT00000014017
|
Vash1
|
vasohibin 1 |
| chr1_+_266952561 | 1.05 |
ENSRNOT00000076452
|
Neurl1
|
neuralized E3 ubiquitin protein ligase 1 |
| chr8_+_61659445 | 1.05 |
ENSRNOT00000023831
|
Ptpn9
|
protein tyrosine phosphatase, non-receptor type 9 |
| chr7_+_2875909 | 1.05 |
ENSRNOT00000028244
|
Smarcc2
|
SWI/SNF related, matrix associated, actin dependent regulator of chromatin, subfamily c, member 2 |
| chr5_-_154363329 | 1.04 |
ENSRNOT00000064596
|
Eloa
|
elongin A |
| chr3_+_11317183 | 1.04 |
ENSRNOT00000091171
ENSRNOT00000016341 |
Golga2
|
golgin A2 |
| chr7_+_27309966 | 1.04 |
ENSRNOT00000031871
|
Nt5dc3
|
5'-nucleotidase domain containing 3 |
| chr1_-_164977633 | 1.04 |
ENSRNOT00000029629
|
Rnf169
|
ring finger protein 169 |
| chr12_-_38869346 | 1.04 |
ENSRNOT00000001807
|
Setd1b
|
SET domain containing 1B |
| chr10_+_13854339 | 1.03 |
ENSRNOT00000004486
ENSRNOT00000043951 |
Caskin1
|
CASK interacting protein 1 |
| chr3_+_170550314 | 1.03 |
ENSRNOT00000006991
|
Tfap2c
|
transcription factor AP-2 gamma |
| chr1_-_220067123 | 1.03 |
ENSRNOT00000071020
ENSRNOT00000072373 |
Rbm14
|
RNA binding motif protein 14 |
| chr3_-_153893847 | 1.03 |
ENSRNOT00000085938
|
LOC100911769
|
band 4.1-like protein 1-like |
| chr7_+_123381077 | 1.02 |
ENSRNOT00000082603
ENSRNOT00000056041 |
Srebf2
|
sterol regulatory element binding transcription factor 2 |
| chr9_+_54212767 | 1.02 |
ENSRNOT00000078073
ENSRNOT00000090026 |
Gls
|
glutaminase |
| chr5_-_169658875 | 1.02 |
ENSRNOT00000015840
|
Kcnab2
|
potassium voltage-gated channel subfamily A regulatory beta subunit 2 |
| chr7_+_12974169 | 1.02 |
ENSRNOT00000010555
|
C2cd4c
|
C2 calcium-dependent domain containing 4C |
| chr10_+_14547172 | 1.01 |
ENSRNOT00000092043
|
Unkl
|
unkempt family like zinc finger |
| chr6_+_137824213 | 1.01 |
ENSRNOT00000056880
|
Pacs2
|
phosphofurin acidic cluster sorting protein 2 |
| chr10_+_70627401 | 1.01 |
ENSRNOT00000076897
|
Rasl10b
|
RAS-like, family 10, member B |
| chr11_-_30428073 | 1.01 |
ENSRNOT00000047741
|
Scaf4
|
SR-related CTD-associated factor 4 |
| chr19_-_40925660 | 1.01 |
ENSRNOT00000023645
|
Mtss1l
|
MTSS1L, I-BAR domain containing |
| chr3_+_62648447 | 1.00 |
ENSRNOT00000002111
|
Agps
|
alkylglycerone phosphate synthase |
| chr2_-_24923128 | 0.99 |
ENSRNOT00000044087
|
Pde8b
|
phosphodiesterase 8B |
| chr10_-_5196892 | 0.99 |
ENSRNOT00000083982
|
Clec16a
|
C-type lectin domain family 16, member A |
| chr8_-_61290240 | 0.99 |
ENSRNOT00000023084
|
Lingo1
|
leucine rich repeat and Ig domain containing 1 |
| chr9_+_70133969 | 0.99 |
ENSRNOT00000040525
|
Adam23
|
ADAM metallopeptidase domain 23 |
| chr2_-_77632628 | 0.99 |
ENSRNOT00000073915
|
Basp1
|
brain abundant, membrane attached signal protein 1 |
| chr18_+_76559811 | 0.98 |
ENSRNOT00000084621
|
Pard6g
|
par-6 family cell polarity regulator gamma |
| chr18_-_57245666 | 0.98 |
ENSRNOT00000080365
|
Ablim3
|
actin binding LIM protein family, member 3 |
| chr16_-_81434038 | 0.98 |
ENSRNOT00000067508
|
Rasa3
|
RAS p21 protein activator 3 |
| chr10_-_85574889 | 0.98 |
ENSRNOT00000072274
|
LOC691153
|
hypothetical protein LOC691153 |
| chr11_+_83048636 | 0.97 |
ENSRNOT00000002408
|
RGD1562339
|
RGD1562339 |
| chr8_+_48925604 | 0.97 |
ENSRNOT00000077445
|
Ddx6
|
DEAD-box helicase 6 |
| chr10_-_74298599 | 0.97 |
ENSRNOT00000007379
|
Ypel2
|
yippee-like 2 |
| chrX_+_104882704 | 0.96 |
ENSRNOT00000079572
ENSRNOT00000074330 ENSRNOT00000082983 |
Cstf2
|
cleavage stimulation factor subunit 2 |
| chr5_-_153625869 | 0.95 |
ENSRNOT00000024464
|
Clic4
|
chloride intracellular channel 4 |
| chr7_+_130498199 | 0.95 |
ENSRNOT00000092684
ENSRNOT00000092431 |
Shank3
|
SH3 and multiple ankyrin repeat domains 3 |
| chr3_+_134413170 | 0.95 |
ENSRNOT00000074338
|
AABR07054000.1
|
|
| chr2_+_216863428 | 0.95 |
ENSRNOT00000068413
|
Col11a1
|
collagen type XI alpha 1 chain |
| chr11_+_71796282 | 0.95 |
ENSRNOT00000087489
|
Fbxo45
|
F-box protein 45 |
| chr16_+_17538855 | 0.95 |
ENSRNOT00000014772
|
Tspan14
|
tetraspanin 14 |
| chr3_-_1924827 | 0.94 |
ENSRNOT00000006162
|
Cacna1b
|
calcium voltage-gated channel subunit alpha1 B |
| chr3_-_160301552 | 0.94 |
ENSRNOT00000014498
|
Rims4
|
regulating synaptic membrane exocytosis 4 |
| chr10_-_47453442 | 0.94 |
ENSRNOT00000050061
|
Usp22
|
ubiquitin specific peptidase 22 |
| chr1_-_222628596 | 0.94 |
ENSRNOT00000083157
ENSRNOT00000034477 |
RGD1308106
|
LOC361719 |
| chr3_+_147585947 | 0.94 |
ENSRNOT00000006833
|
Scrt2
|
scratch family transcriptional repressor 2 |
| chr19_-_57192095 | 0.94 |
ENSRNOT00000058080
|
Pgbd5
|
piggyBac transposable element derived 5 |
| chrX_-_34794589 | 0.93 |
ENSRNOT00000008703
|
Rai2
|
retinoic acid induced 2 |
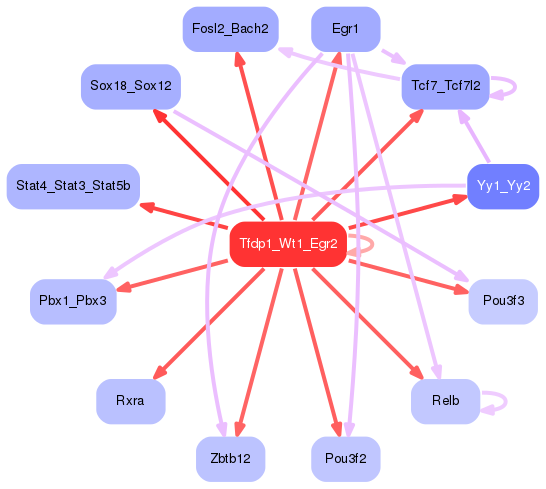
Network of associatons between targets according to the STRING database.

First level regulatory network of Tfdp1_Wt1_Egr2
Gene Ontology Analysis
Gene overrepresentation in biological process category:
| Log-likelihood per target | Total log-likelihood | Term | Description |
|---|---|---|---|
| 2.0 | 10.1 | GO:1904717 | regulation of AMPA glutamate receptor clustering(GO:1904717) |
| 1.0 | 3.0 | GO:0035544 | negative regulation of SNARE complex assembly(GO:0035544) |
| 0.9 | 2.7 | GO:0031632 | positive regulation of synaptic vesicle fusion to presynaptic membrane(GO:0031632) |
| 0.9 | 2.7 | GO:0098749 | cerebellar neuron development(GO:0098749) |
| 0.8 | 2.5 | GO:1990926 | short-term synaptic potentiation(GO:1990926) |
| 0.8 | 2.3 | GO:0001966 | thigmotaxis(GO:0001966) |
| 0.7 | 2.8 | GO:2000969 | positive regulation of alpha-amino-3-hydroxy-5-methyl-4-isoxazole propionate selective glutamate receptor activity(GO:2000969) |
| 0.7 | 4.1 | GO:0071376 | response to corticotropin-releasing hormone(GO:0043435) cellular response to corticotropin-releasing hormone stimulus(GO:0071376) |
| 0.7 | 2.1 | GO:0021882 | regulation of transcription from RNA polymerase II promoter involved in forebrain neuron fate commitment(GO:0021882) commitment of multipotent stem cells to neuronal lineage in forebrain(GO:0021898) |
| 0.7 | 2.7 | GO:0021586 | pons maturation(GO:0021586) |
| 0.7 | 2.7 | GO:0061642 | chemoattraction of axon(GO:0061642) |
| 0.7 | 2.6 | GO:0050893 | sensory processing(GO:0050893) |
| 0.6 | 1.9 | GO:2000041 | regulation of planar cell polarity pathway involved in axis elongation(GO:2000040) negative regulation of planar cell polarity pathway involved in axis elongation(GO:2000041) |
| 0.6 | 1.9 | GO:1902595 | regulation of DNA replication origin binding(GO:1902595) |
| 0.6 | 1.8 | GO:0048619 | embryonic hindgut morphogenesis(GO:0048619) |
| 0.6 | 1.8 | GO:0034499 | late endosome to Golgi transport(GO:0034499) |
| 0.6 | 2.2 | GO:0072218 | ascending thin limb development(GO:0072021) metanephric ascending thin limb development(GO:0072218) |
| 0.5 | 2.2 | GO:2000981 | negative regulation of mechanoreceptor differentiation(GO:0045632) negative regulation of inner ear receptor cell differentiation(GO:2000981) |
| 0.5 | 2.0 | GO:0098886 | modification of dendritic spine(GO:0098886) |
| 0.5 | 1.5 | GO:2000182 | regulation of progesterone biosynthetic process(GO:2000182) |
| 0.5 | 1.0 | GO:0060750 | epithelial cell proliferation involved in mammary gland duct elongation(GO:0060750) |
| 0.5 | 1.9 | GO:0070086 | ubiquitin-dependent endocytosis(GO:0070086) |
| 0.5 | 1.9 | GO:0072709 | cellular response to sorbitol(GO:0072709) |
| 0.5 | 1.4 | GO:0098971 | anterograde dendritic transport of neurotransmitter receptor complex(GO:0098971) |
| 0.5 | 5.6 | GO:0033601 | positive regulation of mammary gland epithelial cell proliferation(GO:0033601) |
| 0.5 | 1.8 | GO:0046544 | development of secondary male sexual characteristics(GO:0046544) |
| 0.5 | 1.4 | GO:0051935 | amino acid neurotransmitter reuptake(GO:0051933) glutamate reuptake(GO:0051935) |
| 0.5 | 1.4 | GO:0001560 | regulation of cell growth by extracellular stimulus(GO:0001560) |
| 0.5 | 1.4 | GO:2000820 | negative regulation of transcription from RNA polymerase II promoter involved in smooth muscle cell differentiation(GO:2000820) |
| 0.4 | 1.8 | GO:0034696 | response to prostaglandin F(GO:0034696) |
| 0.4 | 1.3 | GO:0090370 | negative regulation of cholesterol efflux(GO:0090370) |
| 0.4 | 2.1 | GO:0010626 | negative regulation of Schwann cell proliferation(GO:0010626) |
| 0.4 | 1.2 | GO:0021816 | lamellipodium assembly involved in ameboidal cell migration(GO:0003363) extension of a leading process involved in cell motility in cerebral cortex radial glia guided migration(GO:0021816) |
| 0.4 | 1.2 | GO:0006438 | valyl-tRNA aminoacylation(GO:0006438) |
| 0.4 | 1.2 | GO:0070649 | formin-nucleated actin cable assembly(GO:0070649) |
| 0.4 | 1.2 | GO:0007597 | blood coagulation, intrinsic pathway(GO:0007597) |
| 0.4 | 3.5 | GO:0021942 | radial glia guided migration of Purkinje cell(GO:0021942) |
| 0.4 | 2.6 | GO:0060449 | bud elongation involved in lung branching(GO:0060449) |
| 0.4 | 1.9 | GO:0072697 | protein localization to cell cortex(GO:0072697) |
| 0.4 | 0.7 | GO:0072708 | response to sorbitol(GO:0072708) |
| 0.4 | 1.1 | GO:0006543 | glutamine catabolic process(GO:0006543) |
| 0.4 | 0.7 | GO:0003192 | mitral valve formation(GO:0003192) |
| 0.3 | 1.4 | GO:0010424 | DNA methylation on cytosine within a CG sequence(GO:0010424) |
| 0.3 | 1.0 | GO:0021849 | neuroblast division in subventricular zone(GO:0021849) |
| 0.3 | 2.1 | GO:0021869 | forebrain ventricular zone progenitor cell division(GO:0021869) |
| 0.3 | 2.1 | GO:0010360 | negative regulation of anion channel activity(GO:0010360) |
| 0.3 | 1.0 | GO:1904722 | positive regulation of mRNA cleavage(GO:0031439) positive regulation of endoribonuclease activity(GO:1902380) positive regulation of mRNA endonucleolytic cleavage involved in unfolded protein response(GO:1904722) |
| 0.3 | 1.0 | GO:0051964 | negative regulation of synapse assembly(GO:0051964) |
| 0.3 | 1.0 | GO:0003050 | regulation of systemic arterial blood pressure by atrial natriuretic peptide(GO:0003050) |
| 0.3 | 1.0 | GO:2000384 | regulation of ectoderm development(GO:2000383) negative regulation of ectoderm development(GO:2000384) |
| 0.3 | 2.0 | GO:0060666 | dichotomous subdivision of terminal units involved in salivary gland branching(GO:0060666) |
| 0.3 | 3.4 | GO:0010826 | negative regulation of centrosome duplication(GO:0010826) negative regulation of centrosome cycle(GO:0046606) |
| 0.3 | 3.0 | GO:0086046 | membrane depolarization during SA node cell action potential(GO:0086046) |
| 0.3 | 1.0 | GO:0043314 | negative regulation of neutrophil degranulation(GO:0043314) |
| 0.3 | 1.6 | GO:0060687 | regulation of branching involved in prostate gland morphogenesis(GO:0060687) |
| 0.3 | 1.9 | GO:0001661 | conditioned taste aversion(GO:0001661) |
| 0.3 | 0.3 | GO:1901220 | regulation of cardiac chamber morphogenesis(GO:1901219) negative regulation of cardiac chamber morphogenesis(GO:1901220) |
| 0.3 | 0.3 | GO:0010908 | regulation of heparan sulfate proteoglycan biosynthetic process(GO:0010908) positive regulation of heparan sulfate proteoglycan biosynthetic process(GO:0010909) |
| 0.3 | 0.9 | GO:0021997 | neural plate axis specification(GO:0021997) |
| 0.3 | 0.9 | GO:0070212 | protein poly-ADP-ribosylation(GO:0070212) |
| 0.3 | 0.9 | GO:0090210 | regulation of establishment of blood-brain barrier(GO:0090210) |
| 0.3 | 1.5 | GO:0045218 | zonula adherens maintenance(GO:0045218) |
| 0.3 | 1.2 | GO:0007084 | mitotic nuclear envelope reassembly(GO:0007084) |
| 0.3 | 0.3 | GO:0021812 | neuronal-glial interaction involved in cerebral cortex radial glia guided migration(GO:0021812) |
| 0.3 | 4.7 | GO:0090129 | positive regulation of synapse maturation(GO:0090129) |
| 0.3 | 0.9 | GO:1902303 | negative regulation of potassium ion export(GO:1902303) |
| 0.3 | 1.1 | GO:0002337 | B-1a B cell differentiation(GO:0002337) |
| 0.3 | 2.5 | GO:0030644 | cellular chloride ion homeostasis(GO:0030644) |
| 0.3 | 0.8 | GO:1900748 | positive regulation of vascular endothelial growth factor signaling pathway(GO:1900748) |
| 0.3 | 0.8 | GO:0090271 | positive regulation of fibroblast growth factor production(GO:0090271) |
| 0.3 | 1.4 | GO:0010701 | positive regulation of norepinephrine secretion(GO:0010701) |
| 0.3 | 0.5 | GO:0060849 | lymphatic endothelial cell fate commitment(GO:0060838) regulation of transcription involved in lymphatic endothelial cell fate commitment(GO:0060849) |
| 0.3 | 1.1 | GO:0000414 | regulation of histone H3-K36 methylation(GO:0000414) |
| 0.3 | 0.8 | GO:1903847 | regulation of aorta morphogenesis(GO:1903847) positive regulation of aorta morphogenesis(GO:1903849) |
| 0.3 | 0.8 | GO:1903406 | regulation of sodium:potassium-exchanging ATPase activity(GO:1903406) |
| 0.3 | 0.8 | GO:0051088 | PMA-inducible membrane protein ectodomain proteolysis(GO:0051088) |
| 0.3 | 0.8 | GO:1903936 | cellular response to sodium arsenite(GO:1903936) |
| 0.3 | 0.8 | GO:0044778 | meiotic DNA integrity checkpoint(GO:0044778) |
| 0.3 | 0.5 | GO:0045575 | basophil activation(GO:0045575) |
| 0.3 | 2.9 | GO:0045634 | regulation of melanocyte differentiation(GO:0045634) |
| 0.3 | 0.8 | GO:0044725 | chromatin reprogramming in the zygote(GO:0044725) |
| 0.3 | 0.3 | GO:0001982 | baroreceptor response to decreased systemic arterial blood pressure(GO:0001982) |
| 0.3 | 1.5 | GO:0033564 | anterior/posterior axon guidance(GO:0033564) |
| 0.3 | 0.8 | GO:0055005 | ventricular cardiac myofibril assembly(GO:0055005) |
| 0.3 | 1.8 | GO:0071000 | response to magnetism(GO:0071000) |
| 0.3 | 0.3 | GO:1902460 | regulation of mesenchymal stem cell proliferation(GO:1902460) positive regulation of mesenchymal stem cell proliferation(GO:1902462) |
| 0.3 | 0.8 | GO:0015966 | diadenosine polyphosphate biosynthetic process(GO:0015960) diadenosine tetraphosphate metabolic process(GO:0015965) diadenosine tetraphosphate biosynthetic process(GO:0015966) |
| 0.3 | 0.3 | GO:0072720 | response to dithiothreitol(GO:0072720) |
| 0.3 | 3.5 | GO:0032957 | inositol trisphosphate metabolic process(GO:0032957) |
| 0.3 | 0.3 | GO:2000812 | regulation of barbed-end actin filament capping(GO:2000812) |
| 0.3 | 0.8 | GO:0014045 | establishment of endothelial blood-brain barrier(GO:0014045) central nervous system vasculogenesis(GO:0022009) |
| 0.3 | 1.5 | GO:0097500 | receptor localization to nonmotile primary cilium(GO:0097500) |
| 0.3 | 0.8 | GO:0071579 | regulation of zinc ion transport(GO:0071579) |
| 0.2 | 0.2 | GO:0002572 | pro-T cell differentiation(GO:0002572) |
| 0.2 | 1.0 | GO:0035106 | operant conditioning(GO:0035106) |
| 0.2 | 0.7 | GO:1900135 | positive regulation of renin secretion into blood stream(GO:1900135) |
| 0.2 | 0.7 | GO:0007199 | G-protein coupled receptor signaling pathway coupled to cGMP nucleotide second messenger(GO:0007199) |
| 0.2 | 1.0 | GO:2001013 | epithelial cell proliferation involved in renal tubule morphogenesis(GO:2001013) |
| 0.2 | 1.2 | GO:1904684 | negative regulation of metalloendopeptidase activity(GO:1904684) |
| 0.2 | 0.5 | GO:0072134 | nephrogenic mesenchyme morphogenesis(GO:0072134) |
| 0.2 | 1.7 | GO:0035989 | tendon development(GO:0035989) |
| 0.2 | 0.9 | GO:0032911 | negative regulation of transforming growth factor beta1 production(GO:0032911) |
| 0.2 | 0.9 | GO:0033088 | negative regulation of immature T cell proliferation in thymus(GO:0033088) |
| 0.2 | 0.2 | GO:0061034 | olfactory bulb mitral cell layer development(GO:0061034) |
| 0.2 | 1.2 | GO:0060023 | soft palate development(GO:0060023) |
| 0.2 | 0.7 | GO:0030505 | inorganic diphosphate transport(GO:0030505) |
| 0.2 | 0.9 | GO:0006369 | termination of RNA polymerase II transcription(GO:0006369) |
| 0.2 | 0.9 | GO:0021960 | anterior commissure morphogenesis(GO:0021960) |
| 0.2 | 0.7 | GO:0097116 | gephyrin clustering involved in postsynaptic density assembly(GO:0097116) |
| 0.2 | 0.7 | GO:0000294 | nuclear-transcribed mRNA catabolic process, endonucleolytic cleavage-dependent decay(GO:0000294) |
| 0.2 | 0.7 | GO:0044340 | canonical Wnt signaling pathway involved in regulation of cell proliferation(GO:0044340) |
| 0.2 | 1.6 | GO:0046504 | ether lipid biosynthetic process(GO:0008611) glycerol ether biosynthetic process(GO:0046504) ether biosynthetic process(GO:1901503) |
| 0.2 | 0.9 | GO:0021564 | vagus nerve development(GO:0021564) |
| 0.2 | 0.2 | GO:0097114 | NMDA glutamate receptor clustering(GO:0097114) |
| 0.2 | 1.6 | GO:0030050 | vesicle transport along actin filament(GO:0030050) |
| 0.2 | 0.7 | GO:0060478 | acrosomal vesicle exocytosis(GO:0060478) |
| 0.2 | 1.1 | GO:0035279 | mRNA cleavage involved in gene silencing by miRNA(GO:0035279) mRNA cleavage involved in gene silencing(GO:0098795) |
| 0.2 | 1.1 | GO:1901621 | negative regulation of smoothened signaling pathway involved in dorsal/ventral neural tube patterning(GO:1901621) |
| 0.2 | 0.2 | GO:0045054 | constitutive secretory pathway(GO:0045054) |
| 0.2 | 0.9 | GO:0034729 | histone H3-K79 methylation(GO:0034729) |
| 0.2 | 1.1 | GO:1902525 | regulation of protein monoubiquitination(GO:1902525) |
| 0.2 | 2.2 | GO:0071420 | cellular response to histamine(GO:0071420) |
| 0.2 | 0.6 | GO:0033566 | gamma-tubulin complex localization(GO:0033566) |
| 0.2 | 0.4 | GO:0003415 | chondrocyte hypertrophy(GO:0003415) |
| 0.2 | 0.8 | GO:0006272 | leading strand elongation(GO:0006272) |
| 0.2 | 0.6 | GO:0003343 | proepicardium development(GO:0003342) septum transversum development(GO:0003343) |
| 0.2 | 1.3 | GO:0060024 | rhythmic synaptic transmission(GO:0060024) |
| 0.2 | 0.2 | GO:0035986 | senescence-associated heterochromatin focus assembly(GO:0035986) |
| 0.2 | 0.8 | GO:0019072 | viral genome packaging(GO:0019072) viral RNA genome packaging(GO:0019074) |
| 0.2 | 0.2 | GO:0048341 | paraxial mesoderm formation(GO:0048341) |
| 0.2 | 0.6 | GO:0032066 | nucleolus to nucleoplasm transport(GO:0032066) |
| 0.2 | 0.8 | GO:1990839 | response to endothelin(GO:1990839) cellular response to endothelin(GO:1990859) |
| 0.2 | 0.8 | GO:0031179 | peptide modification(GO:0031179) |
| 0.2 | 1.4 | GO:1990785 | response to water-immersion restraint stress(GO:1990785) |
| 0.2 | 0.6 | GO:0021629 | muscle attachment(GO:0016203) olfactory nerve morphogenesis(GO:0021627) olfactory nerve structural organization(GO:0021629) |
| 0.2 | 1.0 | GO:1903977 | positive regulation of glial cell migration(GO:1903977) |
| 0.2 | 0.4 | GO:1902534 | single-organism membrane invagination(GO:1902534) |
| 0.2 | 1.2 | GO:2000344 | positive regulation of acrosome reaction(GO:2000344) |
| 0.2 | 0.2 | GO:0072076 | nephrogenic mesenchyme development(GO:0072076) |
| 0.2 | 0.6 | GO:0090669 | telomerase RNA stabilization(GO:0090669) |
| 0.2 | 0.8 | GO:0035616 | histone H2B conserved C-terminal lysine deubiquitination(GO:0035616) |
| 0.2 | 1.3 | GO:2000628 | regulation of miRNA metabolic process(GO:2000628) |
| 0.2 | 2.8 | GO:0060509 | Type I pneumocyte differentiation(GO:0060509) |
| 0.2 | 1.3 | GO:0090166 | Golgi disassembly(GO:0090166) |
| 0.2 | 0.2 | GO:0009957 | epidermal cell fate specification(GO:0009957) |
| 0.2 | 1.1 | GO:0051045 | negative regulation of membrane protein ectodomain proteolysis(GO:0051045) |
| 0.2 | 0.6 | GO:1902953 | positive regulation of ER to Golgi vesicle-mediated transport(GO:1902953) |
| 0.2 | 0.7 | GO:0090219 | negative regulation of lipid kinase activity(GO:0090219) |
| 0.2 | 0.7 | GO:2000124 | regulation of endocannabinoid signaling pathway(GO:2000124) |
| 0.2 | 0.4 | GO:0035408 | histone H3-T6 phosphorylation(GO:0035408) |
| 0.2 | 0.7 | GO:1901491 | negative regulation of lymphangiogenesis(GO:1901491) |
| 0.2 | 0.2 | GO:0060994 | regulation of transcription from RNA polymerase II promoter involved in kidney development(GO:0060994) |
| 0.2 | 2.0 | GO:0010603 | regulation of cytoplasmic mRNA processing body assembly(GO:0010603) |
| 0.2 | 0.5 | GO:0021747 | cochlear nucleus development(GO:0021747) |
| 0.2 | 1.8 | GO:0007256 | activation of JNKK activity(GO:0007256) |
| 0.2 | 0.4 | GO:0072199 | mesenchymal cell proliferation involved in ureter development(GO:0072198) regulation of mesenchymal cell proliferation involved in ureter development(GO:0072199) positive regulation of mesenchymal cell proliferation involved in ureter development(GO:2000729) |
| 0.2 | 0.5 | GO:0032915 | positive regulation of transforming growth factor beta2 production(GO:0032915) |
| 0.2 | 1.8 | GO:0036444 | calcium ion transmembrane import into mitochondrion(GO:0036444) |
| 0.2 | 0.9 | GO:0019520 | aldonic acid metabolic process(GO:0019520) D-gluconate metabolic process(GO:0019521) |
| 0.2 | 1.4 | GO:0098789 | pre-mRNA cleavage required for polyadenylation(GO:0098789) |
| 0.2 | 0.3 | GO:0030908 | intein-mediated protein splicing(GO:0016539) protein splicing(GO:0030908) |
| 0.2 | 0.7 | GO:0043570 | maintenance of DNA repeat elements(GO:0043570) |
| 0.2 | 0.8 | GO:0006556 | S-adenosylmethionine biosynthetic process(GO:0006556) |
| 0.2 | 0.5 | GO:0042489 | negative regulation of odontogenesis of dentin-containing tooth(GO:0042489) |
| 0.2 | 1.2 | GO:0043686 | co-translational protein modification(GO:0043686) |
| 0.2 | 0.7 | GO:1903758 | regulation of transcription from RNA polymerase II promoter by histone modification(GO:1903756) negative regulation of transcription from RNA polymerase II promoter by histone modification(GO:1903758) |
| 0.2 | 0.7 | GO:1900736 | regulation of phospholipase C-activating G-protein coupled receptor signaling pathway(GO:1900736) |
| 0.2 | 2.0 | GO:0045820 | negative regulation of glycolytic process(GO:0045820) |
| 0.2 | 0.7 | GO:0045658 | regulation of neutrophil differentiation(GO:0045658) |
| 0.2 | 0.6 | GO:0034773 | histone H4-K20 trimethylation(GO:0034773) |
| 0.2 | 1.1 | GO:0034497 | protein localization to pre-autophagosomal structure(GO:0034497) |
| 0.2 | 0.8 | GO:0035093 | spermatogenesis, exchange of chromosomal proteins(GO:0035093) |
| 0.2 | 0.2 | GO:0034971 | histone H3-R17 methylation(GO:0034971) |
| 0.2 | 0.6 | GO:1902202 | regulation of hepatocyte growth factor receptor signaling pathway(GO:1902202) |
| 0.2 | 0.6 | GO:0036394 | amylase secretion(GO:0036394) |
| 0.2 | 0.5 | GO:0090309 | positive regulation of methylation-dependent chromatin silencing(GO:0090309) |
| 0.2 | 0.5 | GO:0060744 | thelarche(GO:0042695) mammary gland branching involved in thelarche(GO:0060744) |
| 0.2 | 1.4 | GO:0045586 | regulation of gamma-delta T cell differentiation(GO:0045586) regulation of gamma-delta T cell activation(GO:0046643) |
| 0.2 | 0.5 | GO:0070563 | negative regulation of vitamin D receptor signaling pathway(GO:0070563) |
| 0.2 | 0.5 | GO:0019355 | nicotinamide nucleotide biosynthetic process from aspartate(GO:0019355) 'de novo' NAD biosynthetic process from aspartate(GO:0034628) |
| 0.2 | 0.6 | GO:0035441 | cell migration involved in vasculogenesis(GO:0035441) |
| 0.2 | 0.5 | GO:2000525 | regulation of T cell costimulation(GO:2000523) positive regulation of T cell costimulation(GO:2000525) |
| 0.2 | 0.5 | GO:1902732 | positive regulation of chondrocyte proliferation(GO:1902732) |
| 0.2 | 0.3 | GO:0000448 | cleavage in ITS2 between 5.8S rRNA and LSU-rRNA of tricistronic rRNA transcript (SSU-rRNA, 5.8S rRNA, LSU-rRNA)(GO:0000448) |
| 0.2 | 0.5 | GO:0055118 | negative regulation of cardiac muscle contraction(GO:0055118) |
| 0.2 | 0.5 | GO:2000328 | regulation of T-helper 17 cell lineage commitment(GO:2000328) |
| 0.2 | 2.0 | GO:0048712 | negative regulation of astrocyte differentiation(GO:0048712) |
| 0.2 | 0.9 | GO:0038096 | immune response-regulating cell surface receptor signaling pathway involved in phagocytosis(GO:0002433) Fc-gamma receptor signaling pathway involved in phagocytosis(GO:0038096) |
| 0.2 | 0.3 | GO:0021530 | spinal cord oligodendrocyte cell differentiation(GO:0021529) spinal cord oligodendrocyte cell fate specification(GO:0021530) |
| 0.2 | 0.5 | GO:1902263 | apoptotic process involved in embryonic digit morphogenesis(GO:1902263) |
| 0.2 | 0.5 | GO:0072344 | rescue of stalled ribosome(GO:0072344) |
| 0.2 | 0.2 | GO:0021764 | amygdala development(GO:0021764) |
| 0.2 | 0.6 | GO:0010748 | negative regulation of plasma membrane long-chain fatty acid transport(GO:0010748) |
| 0.2 | 0.3 | GO:1904204 | regulation of skeletal muscle hypertrophy(GO:1904204) |
| 0.2 | 1.8 | GO:0051292 | nuclear pore complex assembly(GO:0051292) |
| 0.2 | 0.2 | GO:0061734 | parkin-mediated mitophagy in response to mitochondrial depolarization(GO:0061734) |
| 0.2 | 0.5 | GO:0060816 | random inactivation of X chromosome(GO:0060816) regulation of dosage compensation by inactivation of X chromosome(GO:1900095) |
| 0.1 | 0.3 | GO:0097694 | establishment of RNA localization to telomere(GO:0097694) |
| 0.1 | 0.7 | GO:0003431 | growth plate cartilage chondrocyte development(GO:0003431) |
| 0.1 | 0.4 | GO:0097676 | histone H3-K36 dimethylation(GO:0097676) |
| 0.1 | 0.7 | GO:0038169 | somatostatin receptor signaling pathway(GO:0038169) somatostatin signaling pathway(GO:0038170) |
| 0.1 | 0.7 | GO:0048669 | collateral sprouting in absence of injury(GO:0048669) |
| 0.1 | 1.5 | GO:0048304 | positive regulation of isotype switching to IgG isotypes(GO:0048304) |
| 0.1 | 0.3 | GO:0033092 | positive regulation of immature T cell proliferation in thymus(GO:0033092) |
| 0.1 | 1.5 | GO:0018026 | peptidyl-lysine monomethylation(GO:0018026) |
| 0.1 | 0.1 | GO:0018171 | peptidyl-cysteine oxidation(GO:0018171) |
| 0.1 | 0.3 | GO:1900222 | negative regulation of beta-amyloid clearance(GO:1900222) |
| 0.1 | 0.6 | GO:0042998 | positive regulation of Golgi to plasma membrane protein transport(GO:0042998) |
| 0.1 | 0.3 | GO:0071929 | alpha-tubulin acetylation(GO:0071929) |
| 0.1 | 0.4 | GO:0015827 | tryptophan transport(GO:0015827) |
| 0.1 | 1.9 | GO:0032688 | negative regulation of interferon-beta production(GO:0032688) |
| 0.1 | 1.0 | GO:0033152 | immunoglobulin V(D)J recombination(GO:0033152) |
| 0.1 | 0.7 | GO:0046959 | habituation(GO:0046959) |
| 0.1 | 1.6 | GO:2000786 | positive regulation of autophagosome assembly(GO:2000786) |
| 0.1 | 1.5 | GO:0031340 | positive regulation of vesicle fusion(GO:0031340) |
| 0.1 | 1.8 | GO:0022027 | interkinetic nuclear migration(GO:0022027) |
| 0.1 | 0.8 | GO:0034454 | microtubule anchoring at centrosome(GO:0034454) |
| 0.1 | 0.6 | GO:1900377 | negative regulation of melanin biosynthetic process(GO:0048022) negative regulation of secondary metabolite biosynthetic process(GO:1900377) |
| 0.1 | 0.3 | GO:0016480 | negative regulation of transcription from RNA polymerase III promoter(GO:0016480) |
| 0.1 | 0.3 | GO:1902809 | regulation of skeletal muscle fiber differentiation(GO:1902809) |
| 0.1 | 0.3 | GO:0060355 | positive regulation of cell adhesion molecule production(GO:0060355) |
| 0.1 | 1.0 | GO:0060019 | radial glial cell differentiation(GO:0060019) |
| 0.1 | 0.4 | GO:0046416 | D-amino acid metabolic process(GO:0046416) |
| 0.1 | 0.1 | GO:0036166 | phenotypic switching(GO:0036166) |
| 0.1 | 0.6 | GO:0048861 | leukemia inhibitory factor signaling pathway(GO:0048861) |
| 0.1 | 0.8 | GO:0033227 | dsRNA transport(GO:0033227) |
| 0.1 | 0.1 | GO:0021873 | forebrain neuroblast division(GO:0021873) |
| 0.1 | 0.6 | GO:2000860 | positive regulation of mineralocorticoid secretion(GO:2000857) positive regulation of aldosterone secretion(GO:2000860) |
| 0.1 | 0.4 | GO:0038158 | granulocyte colony-stimulating factor signaling pathway(GO:0038158) |
| 0.1 | 0.5 | GO:0006999 | nuclear pore organization(GO:0006999) |
| 0.1 | 0.1 | GO:0032097 | positive regulation of response to food(GO:0032097) positive regulation of appetite(GO:0032100) |
| 0.1 | 1.6 | GO:0035970 | peptidyl-threonine dephosphorylation(GO:0035970) |
| 0.1 | 0.5 | GO:0021593 | rhombomere morphogenesis(GO:0021593) |
| 0.1 | 1.1 | GO:0003374 | dynamin polymerization involved in membrane fission(GO:0003373) dynamin polymerization involved in mitochondrial fission(GO:0003374) |
| 0.1 | 0.4 | GO:0038031 | non-canonical Wnt signaling pathway via JNK cascade(GO:0038031) |
| 0.1 | 0.1 | GO:0061643 | chemorepulsion of axon(GO:0061643) |
| 0.1 | 0.5 | GO:0046338 | phosphatidylethanolamine catabolic process(GO:0046338) |
| 0.1 | 0.4 | GO:2000620 | positive regulation of histone H4-K16 acetylation(GO:2000620) |
| 0.1 | 0.3 | GO:2000301 | negative regulation of synaptic vesicle exocytosis(GO:2000301) |
| 0.1 | 0.3 | GO:0045900 | negative regulation of translational elongation(GO:0045900) |
| 0.1 | 0.5 | GO:1903575 | cornified envelope assembly(GO:1903575) |
| 0.1 | 1.1 | GO:0008063 | Toll signaling pathway(GO:0008063) |
| 0.1 | 0.4 | GO:0043316 | cytotoxic T cell degranulation(GO:0043316) |
| 0.1 | 0.1 | GO:0099515 | actin filament-based transport(GO:0099515) |
| 0.1 | 0.3 | GO:1901079 | positive regulation of relaxation of muscle(GO:1901079) |
| 0.1 | 0.3 | GO:0019065 | receptor-mediated endocytosis of virus by host cell(GO:0019065) endocytosis involved in viral entry into host cell(GO:0075509) |
| 0.1 | 1.2 | GO:0035947 | regulation of gluconeogenesis by regulation of transcription from RNA polymerase II promoter(GO:0035947) |
| 0.1 | 0.7 | GO:0010519 | negative regulation of phospholipase activity(GO:0010519) |
| 0.1 | 0.7 | GO:0008354 | germ cell migration(GO:0008354) |
| 0.1 | 1.4 | GO:1990416 | cellular response to brain-derived neurotrophic factor stimulus(GO:1990416) |
| 0.1 | 1.0 | GO:1901525 | negative regulation of macromitophagy(GO:1901525) |
| 0.1 | 0.5 | GO:0045136 | development of secondary sexual characteristics(GO:0045136) |
| 0.1 | 2.3 | GO:0072600 | establishment of protein localization to Golgi(GO:0072600) |
| 0.1 | 2.2 | GO:0006607 | NLS-bearing protein import into nucleus(GO:0006607) |
| 0.1 | 0.3 | GO:0071895 | odontoblast differentiation(GO:0071895) |
| 0.1 | 0.5 | GO:0070375 | ERK5 cascade(GO:0070375) |
| 0.1 | 0.1 | GO:0007066 | female meiosis sister chromatid cohesion(GO:0007066) |
| 0.1 | 0.5 | GO:0061484 | hematopoietic stem cell homeostasis(GO:0061484) |
| 0.1 | 0.4 | GO:0051562 | negative regulation of mitochondrial calcium ion concentration(GO:0051562) |
| 0.1 | 0.5 | GO:0048207 | vesicle targeting, rough ER to cis-Golgi(GO:0048207) COPII vesicle coating(GO:0048208) |
| 0.1 | 0.8 | GO:0000301 | retrograde transport, vesicle recycling within Golgi(GO:0000301) |
| 0.1 | 0.6 | GO:0035507 | regulation of myosin-light-chain-phosphatase activity(GO:0035507) |
| 0.1 | 0.6 | GO:0016081 | synaptic vesicle docking(GO:0016081) |
| 0.1 | 0.1 | GO:2000137 | negative regulation of cell proliferation involved in heart morphogenesis(GO:2000137) |
| 0.1 | 0.8 | GO:0046125 | pyrimidine deoxyribonucleoside metabolic process(GO:0046125) |
| 0.1 | 0.8 | GO:0042796 | snRNA transcription from RNA polymerase III promoter(GO:0042796) |
| 0.1 | 0.4 | GO:0007228 | positive regulation of hh target transcription factor activity(GO:0007228) |
| 0.1 | 2.0 | GO:0080182 | histone H3-K4 trimethylation(GO:0080182) |
| 0.1 | 0.2 | GO:1900126 | negative regulation of hyaluronan biosynthetic process(GO:1900126) |
| 0.1 | 0.4 | GO:0071691 | cardiac muscle thin filament assembly(GO:0071691) |
| 0.1 | 0.1 | GO:2000793 | cell proliferation involved in heart valve development(GO:2000793) |
| 0.1 | 0.9 | GO:2000323 | negative regulation of glucocorticoid receptor signaling pathway(GO:2000323) |
| 0.1 | 0.1 | GO:0090367 | negative regulation of mRNA modification(GO:0090367) |
| 0.1 | 0.7 | GO:0038027 | apolipoprotein A-I-mediated signaling pathway(GO:0038027) |
| 0.1 | 0.4 | GO:0061188 | negative regulation of chromatin silencing at rDNA(GO:0061188) |
| 0.1 | 0.6 | GO:0035542 | regulation of SNARE complex assembly(GO:0035542) |
| 0.1 | 0.8 | GO:0002002 | regulation of angiotensin levels in blood(GO:0002002) |
| 0.1 | 0.1 | GO:2000173 | negative regulation of branching morphogenesis of a nerve(GO:2000173) |
| 0.1 | 0.7 | GO:0006987 | activation of signaling protein activity involved in unfolded protein response(GO:0006987) |
| 0.1 | 0.6 | GO:0048715 | negative regulation of oligodendrocyte differentiation(GO:0048715) |
| 0.1 | 0.4 | GO:0042492 | gamma-delta T cell differentiation(GO:0042492) |
| 0.1 | 0.3 | GO:0042939 | glutathione transport(GO:0034635) tripeptide transport(GO:0042939) |
| 0.1 | 0.5 | GO:1904009 | cellular response to monosodium glutamate(GO:1904009) |
| 0.1 | 0.7 | GO:0099525 | presynaptic dense core granule exocytosis(GO:0099525) |
| 0.1 | 0.3 | GO:1901421 | positive regulation of response to alcohol(GO:1901421) |
| 0.1 | 0.1 | GO:0060373 | regulation of ventricular cardiac muscle cell membrane depolarization(GO:0060373) |
| 0.1 | 0.7 | GO:0010735 | positive regulation of transcription via serum response element binding(GO:0010735) |
| 0.1 | 0.1 | GO:0060488 | orthogonal dichotomous subdivision of terminal units involved in lung branching morphogenesis(GO:0060488) planar dichotomous subdivision of terminal units involved in lung branching morphogenesis(GO:0060489) lateral sprouting involved in lung morphogenesis(GO:0060490) |
| 0.1 | 1.4 | GO:1901409 | positive regulation of phosphorylation of RNA polymerase II C-terminal domain(GO:1901409) |
| 0.1 | 0.5 | GO:1903999 | negative regulation of eating behavior(GO:1903999) |
| 0.1 | 0.6 | GO:0030070 | insulin processing(GO:0030070) |
| 0.1 | 0.7 | GO:0072675 | osteoclast fusion(GO:0072675) |
| 0.1 | 0.2 | GO:2001181 | positive regulation of interleukin-10 secretion(GO:2001181) |
| 0.1 | 0.6 | GO:0001957 | intramembranous ossification(GO:0001957) direct ossification(GO:0036072) |
| 0.1 | 0.3 | GO:1990166 | protein localization to site of double-strand break(GO:1990166) |
| 0.1 | 0.3 | GO:0001994 | norepinephrine-epinephrine vasoconstriction involved in regulation of systemic arterial blood pressure(GO:0001994) |
| 0.1 | 0.2 | GO:0038001 | paracrine signaling(GO:0038001) |
| 0.1 | 0.2 | GO:1901844 | regulation of cell communication by electrical coupling involved in cardiac conduction(GO:1901844) |
| 0.1 | 0.1 | GO:0017055 | negative regulation of RNA polymerase II transcriptional preinitiation complex assembly(GO:0017055) |
| 0.1 | 0.4 | GO:0045200 | establishment or maintenance of neuroblast polarity(GO:0045196) establishment of neuroblast polarity(GO:0045200) |
| 0.1 | 0.7 | GO:0048227 | plasma membrane to endosome transport(GO:0048227) |
| 0.1 | 0.8 | GO:0070934 | CRD-mediated mRNA stabilization(GO:0070934) |
| 0.1 | 0.7 | GO:0014029 | neural crest formation(GO:0014029) |
| 0.1 | 0.2 | GO:0042769 | DNA damage response, detection of DNA damage(GO:0042769) |
| 0.1 | 0.5 | GO:1902302 | regulation of potassium ion export(GO:1902302) |
| 0.1 | 0.3 | GO:0060821 | inactivation of X chromosome by DNA methylation(GO:0060821) |
| 0.1 | 0.3 | GO:1902287 | trigeminal nerve morphogenesis(GO:0021636) trigeminal nerve structural organization(GO:0021637) semaphorin-plexin signaling pathway involved in axon guidance(GO:1902287) |
| 0.1 | 0.4 | GO:1903911 | positive regulation of receptor clustering(GO:1903911) positive regulation of skeletal muscle acetylcholine-gated channel clustering(GO:1904395) positive regulation of neuromuscular junction development(GO:1904398) |
| 0.1 | 0.3 | GO:0035470 | positive regulation of vascular wound healing(GO:0035470) |
| 0.1 | 0.1 | GO:0021943 | formation of radial glial scaffolds(GO:0021943) |
| 0.1 | 0.3 | GO:0036451 | cap mRNA methylation(GO:0036451) |
| 0.1 | 0.3 | GO:1900368 | regulation of RNA interference(GO:1900368) |
| 0.1 | 0.1 | GO:0033326 | cerebrospinal fluid secretion(GO:0033326) |
| 0.1 | 0.3 | GO:0030327 | prenylated protein catabolic process(GO:0030327) |
| 0.1 | 0.8 | GO:0043981 | histone H4-K5 acetylation(GO:0043981) histone H4-K8 acetylation(GO:0043982) |
| 0.1 | 1.5 | GO:1902231 | positive regulation of intrinsic apoptotic signaling pathway in response to DNA damage(GO:1902231) |
| 0.1 | 0.4 | GO:0031394 | positive regulation of prostaglandin biosynthetic process(GO:0031394) positive regulation of unsaturated fatty acid biosynthetic process(GO:2001280) |
| 0.1 | 0.4 | GO:0090073 | positive regulation of protein homodimerization activity(GO:0090073) |
| 0.1 | 0.3 | GO:1902488 | cholangiocyte apoptotic process(GO:1902488) regulation of cholangiocyte apoptotic process(GO:1904192) negative regulation of cholangiocyte apoptotic process(GO:1904193) |
| 0.1 | 0.6 | GO:0010216 | maintenance of DNA methylation(GO:0010216) |
| 0.1 | 0.4 | GO:0030210 | heparin biosynthetic process(GO:0030210) |
| 0.1 | 0.9 | GO:0043374 | CD8-positive, alpha-beta T cell differentiation(GO:0043374) |
| 0.1 | 0.1 | GO:0001923 | B-1 B cell differentiation(GO:0001923) |
| 0.1 | 0.7 | GO:0001927 | exocyst assembly(GO:0001927) |
| 0.1 | 1.1 | GO:0032486 | Rap protein signal transduction(GO:0032486) |
| 0.1 | 0.4 | GO:0033625 | positive regulation of integrin activation(GO:0033625) |
| 0.1 | 1.1 | GO:0006013 | mannose metabolic process(GO:0006013) |
| 0.1 | 0.2 | GO:0032289 | central nervous system myelin formation(GO:0032289) |
| 0.1 | 0.5 | GO:0035735 | intraciliary transport involved in cilium morphogenesis(GO:0035735) |
| 0.1 | 0.4 | GO:0006041 | glucosamine metabolic process(GO:0006041) |
| 0.1 | 0.1 | GO:0033084 | regulation of immature T cell proliferation in thymus(GO:0033084) |
| 0.1 | 1.6 | GO:0006910 | phagocytosis, recognition(GO:0006910) |
| 0.1 | 0.2 | GO:0021932 | hindbrain radial glia guided cell migration(GO:0021932) |
| 0.1 | 0.2 | GO:0051987 | positive regulation of attachment of spindle microtubules to kinetochore(GO:0051987) |
| 0.1 | 0.4 | GO:0060800 | regulation of cell differentiation involved in embryonic placenta development(GO:0060800) |
| 0.1 | 0.4 | GO:0031442 | positive regulation of mRNA 3'-end processing(GO:0031442) |
| 0.1 | 0.4 | GO:0061439 | renal system vasculature morphogenesis(GO:0061438) kidney vasculature morphogenesis(GO:0061439) |
| 0.1 | 0.4 | GO:2000813 | negative regulation of barbed-end actin filament capping(GO:2000813) |
| 0.1 | 1.6 | GO:0060236 | regulation of mitotic spindle organization(GO:0060236) |
| 0.1 | 0.2 | GO:0097151 | positive regulation of inhibitory postsynaptic potential(GO:0097151) |
| 0.1 | 0.4 | GO:0060762 | regulation of branching involved in mammary gland duct morphogenesis(GO:0060762) |
| 0.1 | 0.1 | GO:0010533 | regulation of activation of Janus kinase activity(GO:0010533) |
| 0.1 | 1.8 | GO:0031581 | hemidesmosome assembly(GO:0031581) |
| 0.1 | 1.0 | GO:0006655 | phosphatidylglycerol biosynthetic process(GO:0006655) |
| 0.1 | 0.2 | GO:1903774 | positive regulation of viral budding via host ESCRT complex(GO:1903774) |
| 0.1 | 0.9 | GO:1903690 | negative regulation of wound healing, spreading of epidermal cells(GO:1903690) |
| 0.1 | 1.8 | GO:0048172 | regulation of short-term neuronal synaptic plasticity(GO:0048172) |
| 0.1 | 0.9 | GO:0002087 | regulation of respiratory gaseous exchange by neurological system process(GO:0002087) |
| 0.1 | 0.6 | GO:0035414 | negative regulation of catenin import into nucleus(GO:0035414) |
| 0.1 | 0.7 | GO:0010668 | ectodermal cell differentiation(GO:0010668) |
| 0.1 | 0.4 | GO:0007221 | positive regulation of transcription of Notch receptor target(GO:0007221) |
| 0.1 | 0.2 | GO:0032905 | transforming growth factor beta1 production(GO:0032905) regulation of transforming growth factor beta1 production(GO:0032908) |
| 0.1 | 1.5 | GO:0021860 | pyramidal neuron development(GO:0021860) |
| 0.1 | 0.5 | GO:0001555 | oocyte growth(GO:0001555) |
| 0.1 | 0.2 | GO:0098989 | NMDA selective glutamate receptor signaling pathway(GO:0098989) |
| 0.1 | 0.3 | GO:2000468 | regulation of peroxidase activity(GO:2000468) |
| 0.1 | 0.3 | GO:1904457 | positive regulation of neuronal action potential(GO:1904457) |
| 0.1 | 0.4 | GO:0070346 | positive regulation of fat cell proliferation(GO:0070346) |
| 0.1 | 0.9 | GO:1900026 | positive regulation of substrate adhesion-dependent cell spreading(GO:1900026) |
| 0.1 | 0.3 | GO:0033540 | fatty acid beta-oxidation using acyl-CoA oxidase(GO:0033540) |
| 0.1 | 0.7 | GO:0010457 | centriole-centriole cohesion(GO:0010457) |
| 0.1 | 1.2 | GO:0070935 | 3'-UTR-mediated mRNA stabilization(GO:0070935) |
| 0.1 | 0.5 | GO:0030579 | ubiquitin-dependent SMAD protein catabolic process(GO:0030579) |
| 0.1 | 0.1 | GO:0021859 | pyramidal neuron differentiation(GO:0021859) |
| 0.1 | 0.8 | GO:2000052 | positive regulation of non-canonical Wnt signaling pathway(GO:2000052) |
| 0.1 | 1.3 | GO:1903830 | magnesium ion transmembrane transport(GO:1903830) |
| 0.1 | 0.4 | GO:0045085 | negative regulation of interleukin-2 biosynthetic process(GO:0045085) |
| 0.1 | 0.7 | GO:0035330 | regulation of hippo signaling(GO:0035330) |
| 0.1 | 0.4 | GO:0036466 | synaptic vesicle recycling via endosome(GO:0036466) |
| 0.1 | 0.3 | GO:0010730 | negative regulation of hydrogen peroxide biosynthetic process(GO:0010730) |
| 0.1 | 0.2 | GO:2000327 | positive regulation of ligand-dependent nuclear receptor transcription coactivator activity(GO:2000327) |
| 0.1 | 3.0 | GO:0030866 | cortical actin cytoskeleton organization(GO:0030866) |
| 0.1 | 0.3 | GO:0060060 | post-embryonic retina morphogenesis in camera-type eye(GO:0060060) |
| 0.1 | 1.8 | GO:0000188 | inactivation of MAPK activity(GO:0000188) |
| 0.1 | 0.8 | GO:0070995 | NADPH oxidation(GO:0070995) |
| 0.1 | 0.6 | GO:2001184 | positive regulation of interleukin-12 secretion(GO:2001184) |
| 0.1 | 1.2 | GO:0000289 | nuclear-transcribed mRNA poly(A) tail shortening(GO:0000289) |
| 0.1 | 0.4 | GO:2000586 | regulation of platelet-derived growth factor receptor-beta signaling pathway(GO:2000586) |
| 0.1 | 0.7 | GO:0007512 | adult heart development(GO:0007512) |
| 0.1 | 1.1 | GO:0007076 | mitotic chromosome condensation(GO:0007076) |
| 0.1 | 0.3 | GO:0089718 | amino acid import across plasma membrane(GO:0089718) |
| 0.1 | 1.1 | GO:0090161 | Golgi ribbon formation(GO:0090161) |
| 0.1 | 0.4 | GO:0033132 | negative regulation of glucokinase activity(GO:0033132) negative regulation of hexokinase activity(GO:1903300) |
| 0.1 | 1.1 | GO:1903861 | positive regulation of dendrite extension(GO:1903861) |
| 0.1 | 0.6 | GO:0010359 | regulation of anion channel activity(GO:0010359) |
| 0.1 | 0.2 | GO:0044341 | sodium-dependent phosphate transport(GO:0044341) |
| 0.1 | 0.3 | GO:0045404 | positive regulation of interleukin-4 biosynthetic process(GO:0045404) |
| 0.1 | 0.3 | GO:1990573 | potassium ion import across plasma membrane(GO:1990573) |
| 0.1 | 0.4 | GO:0007197 | adenylate cyclase-inhibiting G-protein coupled acetylcholine receptor signaling pathway(GO:0007197) phospholipase C-activating G-protein coupled acetylcholine receptor signaling pathway(GO:0007207) |
| 0.1 | 0.2 | GO:1904637 | response to ionomycin(GO:1904636) cellular response to ionomycin(GO:1904637) |
| 0.1 | 0.3 | GO:0071896 | protein localization to adherens junction(GO:0071896) |
| 0.1 | 1.5 | GO:0016578 | histone deubiquitination(GO:0016578) |
| 0.1 | 0.3 | GO:1990770 | eye blink reflex(GO:0060082) negative regulation of gastro-intestinal system smooth muscle contraction(GO:1904305) regulation of small intestine smooth muscle contraction(GO:1904347) negative regulation of small intestine smooth muscle contraction(GO:1904348) small intestine smooth muscle contraction(GO:1990770) |
| 0.1 | 0.3 | GO:0090038 | negative regulation of protein kinase C signaling(GO:0090038) |
| 0.1 | 0.3 | GO:0010643 | cell communication by chemical coupling(GO:0010643) |
| 0.1 | 0.3 | GO:1903348 | positive regulation of bicellular tight junction assembly(GO:1903348) |
| 0.1 | 0.3 | GO:0051697 | protein delipidation(GO:0051697) |
| 0.1 | 0.1 | GO:1900740 | regulation of protein insertion into mitochondrial membrane involved in apoptotic signaling pathway(GO:1900739) positive regulation of protein insertion into mitochondrial membrane involved in apoptotic signaling pathway(GO:1900740) |
| 0.1 | 1.3 | GO:0036092 | phosphatidylinositol-3-phosphate biosynthetic process(GO:0036092) |
| 0.1 | 0.3 | GO:1905150 | regulation of voltage-gated sodium channel activity(GO:1905150) |
| 0.1 | 0.2 | GO:0060689 | cell differentiation involved in salivary gland development(GO:0060689) |
| 0.1 | 0.2 | GO:0038163 | thrombopoietin-mediated signaling pathway(GO:0038163) |
| 0.1 | 0.7 | GO:0071108 | protein K48-linked deubiquitination(GO:0071108) |
| 0.1 | 0.3 | GO:1900034 | regulation of cellular response to heat(GO:1900034) |
| 0.1 | 0.2 | GO:1901143 | insulin catabolic process(GO:1901143) |
| 0.1 | 1.2 | GO:0048311 | mitochondrion distribution(GO:0048311) |
| 0.1 | 1.1 | GO:0051764 | actin crosslink formation(GO:0051764) |
| 0.1 | 0.7 | GO:1901897 | regulation of relaxation of cardiac muscle(GO:1901897) |
| 0.1 | 0.3 | GO:0006287 | base-excision repair, gap-filling(GO:0006287) |
| 0.1 | 0.3 | GO:0038203 | TORC2 signaling(GO:0038203) |
| 0.1 | 1.6 | GO:0070536 | protein K63-linked deubiquitination(GO:0070536) |
| 0.1 | 0.2 | GO:0060066 | oviduct development(GO:0060066) |
| 0.1 | 0.2 | GO:0070560 | protein secretion by platelet(GO:0070560) |
| 0.1 | 0.6 | GO:1900113 | negative regulation of histone H3-K9 trimethylation(GO:1900113) |
| 0.1 | 0.4 | GO:0015074 | DNA integration(GO:0015074) |
| 0.1 | 1.3 | GO:0007216 | G-protein coupled glutamate receptor signaling pathway(GO:0007216) |
| 0.1 | 0.1 | GO:0010032 | meiotic chromosome condensation(GO:0010032) |
| 0.1 | 0.2 | GO:1902659 | regulation of glucose mediated signaling pathway(GO:1902659) |
| 0.1 | 0.2 | GO:2000973 | regulation of pro-B cell differentiation(GO:2000973) |
| 0.1 | 3.7 | GO:0046580 | negative regulation of Ras protein signal transduction(GO:0046580) |
| 0.1 | 0.7 | GO:0061299 | retina vasculature morphogenesis in camera-type eye(GO:0061299) |
| 0.1 | 0.2 | GO:1900063 | regulation of peroxisome organization(GO:1900063) |
| 0.1 | 1.3 | GO:0015812 | gamma-aminobutyric acid transport(GO:0015812) |
| 0.1 | 1.0 | GO:0001829 | trophectodermal cell differentiation(GO:0001829) |
| 0.1 | 0.1 | GO:0071630 | nucleus-associated proteasomal ubiquitin-dependent protein catabolic process(GO:0071630) |
| 0.1 | 0.5 | GO:1902083 | negative regulation of peptidyl-cysteine S-nitrosylation(GO:1902083) |
| 0.1 | 0.2 | GO:1901097 | negative regulation of autophagosome maturation(GO:1901097) |
| 0.1 | 0.2 | GO:0090187 | positive regulation of pancreatic juice secretion(GO:0090187) |
| 0.1 | 0.6 | GO:0035524 | proline transmembrane transport(GO:0035524) |
| 0.1 | 0.9 | GO:0060907 | positive regulation of macrophage cytokine production(GO:0060907) |
| 0.1 | 0.3 | GO:0097338 | response to clozapine(GO:0097338) |
| 0.1 | 0.3 | GO:0044857 | plasma membrane raft assembly(GO:0044854) plasma membrane raft organization(GO:0044857) caveola assembly(GO:0070836) |
| 0.1 | 0.2 | GO:0097118 | neuroligin clustering involved in postsynaptic membrane assembly(GO:0097118) |
| 0.1 | 0.4 | GO:0090168 | Golgi reassembly(GO:0090168) |
| 0.1 | 0.2 | GO:0031587 | positive regulation of inositol 1,4,5-trisphosphate-sensitive calcium-release channel activity(GO:0031587) |
| 0.1 | 0.2 | GO:0072102 | glomerulus morphogenesis(GO:0072102) |
| 0.1 | 0.3 | GO:0070544 | histone H3-K36 demethylation(GO:0070544) |
| 0.1 | 0.2 | GO:0007079 | mitotic chromosome movement towards spindle pole(GO:0007079) |
| 0.1 | 0.5 | GO:1901223 | negative regulation of NIK/NF-kappaB signaling(GO:1901223) |
| 0.1 | 0.4 | GO:0060368 | regulation of Fc receptor mediated stimulatory signaling pathway(GO:0060368) |
| 0.1 | 0.4 | GO:0042780 | tRNA 3'-end processing(GO:0042780) |
| 0.1 | 0.4 | GO:0031953 | negative regulation of protein autophosphorylation(GO:0031953) |
| 0.1 | 0.2 | GO:0072034 | renal vesicle induction(GO:0072034) |
| 0.1 | 0.5 | GO:0006145 | purine nucleobase catabolic process(GO:0006145) |
| 0.1 | 0.2 | GO:2000312 | regulation of kainate selective glutamate receptor activity(GO:2000312) |
| 0.1 | 0.2 | GO:0038089 | positive regulation of endothelial cell chemotaxis by VEGF-activated vascular endothelial growth factor receptor signaling pathway(GO:0038033) positive regulation of cell migration by vascular endothelial growth factor signaling pathway(GO:0038089) |
| 0.1 | 0.7 | GO:0060074 | synapse maturation(GO:0060074) |
| 0.1 | 0.6 | GO:0033962 | cytoplasmic mRNA processing body assembly(GO:0033962) |
| 0.1 | 1.4 | GO:2000300 | regulation of synaptic vesicle exocytosis(GO:2000300) |
| 0.1 | 0.3 | GO:0072423 | response to cell cycle checkpoint signaling(GO:0072396) response to DNA integrity checkpoint signaling(GO:0072402) response to DNA damage checkpoint signaling(GO:0072423) |
| 0.1 | 0.3 | GO:0050717 | positive regulation of interleukin-1 alpha secretion(GO:0050717) |
| 0.1 | 0.3 | GO:0097155 | fasciculation of sensory neuron axon(GO:0097155) |
| 0.1 | 0.7 | GO:0016266 | O-glycan processing(GO:0016266) |
| 0.1 | 0.1 | GO:0036334 | epidermal stem cell homeostasis(GO:0036334) |
| 0.1 | 0.7 | GO:0071578 | zinc II ion transmembrane import(GO:0071578) |
| 0.1 | 0.2 | GO:0035234 | ectopic germ cell programmed cell death(GO:0035234) |
| 0.1 | 0.1 | GO:2001274 | negative regulation of glucose import in response to insulin stimulus(GO:2001274) |
| 0.1 | 0.1 | GO:0035722 | positive regulation of skeletal muscle cell proliferation(GO:0014858) mineralocorticoid receptor signaling pathway(GO:0031959) interleukin-12-mediated signaling pathway(GO:0035722) cellular response to interleukin-12(GO:0071349) |
| 0.1 | 0.2 | GO:0071529 | cementum mineralization(GO:0071529) |
| 0.1 | 0.2 | GO:0001828 | inner cell mass cellular morphogenesis(GO:0001828) |
| 0.1 | 0.3 | GO:0034134 | toll-like receptor 2 signaling pathway(GO:0034134) |
| 0.1 | 0.3 | GO:1902177 | positive regulation of oxidative stress-induced intrinsic apoptotic signaling pathway(GO:1902177) |
| 0.1 | 0.4 | GO:1904754 | positive regulation of vascular associated smooth muscle cell migration(GO:1904754) |
| 0.1 | 0.8 | GO:0071468 | cellular response to acidic pH(GO:0071468) |
| 0.1 | 0.4 | GO:0090649 | response to oxygen-glucose deprivation(GO:0090649) cellular response to oxygen-glucose deprivation(GO:0090650) |
| 0.1 | 0.7 | GO:1904321 | response to forskolin(GO:1904321) cellular response to forskolin(GO:1904322) |
| 0.1 | 0.3 | GO:1904179 | positive regulation of adipose tissue development(GO:1904179) |
| 0.1 | 0.1 | GO:0071963 | establishment or maintenance of cell polarity regulating cell shape(GO:0071963) |
| 0.1 | 0.3 | GO:0032485 | regulation of Ral protein signal transduction(GO:0032485) |
| 0.1 | 0.2 | GO:0036066 | protein O-linked fucosylation(GO:0036066) |
| 0.1 | 0.1 | GO:0021678 | third ventricle development(GO:0021678) |
| 0.1 | 0.3 | GO:0019371 | cyclooxygenase pathway(GO:0019371) |
| 0.1 | 0.1 | GO:1904354 | negative regulation of telomere capping(GO:1904354) |
| 0.1 | 0.2 | GO:0006436 | tryptophanyl-tRNA aminoacylation(GO:0006436) |
| 0.1 | 0.1 | GO:0002585 | positive regulation of antigen processing and presentation of peptide antigen(GO:0002585) |
| 0.1 | 0.1 | GO:0060174 | limb bud formation(GO:0060174) |
| 0.1 | 0.1 | GO:0060372 | regulation of atrial cardiac muscle cell membrane repolarization(GO:0060372) |
| 0.1 | 0.1 | GO:0019541 | propionate metabolic process(GO:0019541) |
| 0.1 | 0.3 | GO:0000727 | double-strand break repair via break-induced replication(GO:0000727) |
| 0.1 | 0.1 | GO:2000320 | negative regulation of T-helper 17 type immune response(GO:2000317) negative regulation of T-helper 17 cell differentiation(GO:2000320) |
| 0.1 | 0.3 | GO:0000160 | phosphorelay signal transduction system(GO:0000160) |
| 0.1 | 0.2 | GO:0071557 | histone H3-K27 demethylation(GO:0071557) |
| 0.1 | 0.2 | GO:0045988 | negative regulation of striated muscle contraction(GO:0045988) |
| 0.1 | 0.2 | GO:0001920 | negative regulation of receptor recycling(GO:0001920) |
| 0.1 | 0.1 | GO:0002424 | T cell mediated immune response to tumor cell(GO:0002424) regulation of T cell mediated immune response to tumor cell(GO:0002840) |
| 0.1 | 0.1 | GO:0045653 | negative regulation of megakaryocyte differentiation(GO:0045653) |
| 0.1 | 0.1 | GO:0006526 | arginine biosynthetic process(GO:0006526) |
| 0.1 | 0.7 | GO:0097150 | neuronal stem cell population maintenance(GO:0097150) |
| 0.1 | 0.2 | GO:0046154 | eye pigment metabolic process(GO:0042441) pigment metabolic process involved in developmental pigmentation(GO:0043324) pigment metabolic process involved in pigmentation(GO:0043474) rhodopsin metabolic process(GO:0046154) |
| 0.1 | 0.1 | GO:0051305 | chromosome movement towards spindle pole(GO:0051305) |
| 0.1 | 0.1 | GO:0036353 | histone H2A-K119 monoubiquitination(GO:0036353) |
| 0.1 | 0.2 | GO:0060316 | positive regulation of ryanodine-sensitive calcium-release channel activity(GO:0060316) |
| 0.1 | 0.3 | GO:1990928 | response to amino acid starvation(GO:1990928) |
| 0.1 | 0.3 | GO:0006546 | glycine catabolic process(GO:0006546) glycine decarboxylation via glycine cleavage system(GO:0019464) |
| 0.1 | 0.1 | GO:0010182 | carbohydrate mediated signaling(GO:0009756) hexose mediated signaling(GO:0009757) sugar mediated signaling pathway(GO:0010182) glucose mediated signaling pathway(GO:0010255) |
| 0.1 | 2.5 | GO:0006182 | cGMP biosynthetic process(GO:0006182) |
| 0.1 | 0.2 | GO:0097503 | sialylation(GO:0097503) |
| 0.1 | 0.3 | GO:0009449 | gamma-aminobutyric acid biosynthetic process(GO:0009449) |
| 0.1 | 0.2 | GO:0046462 | monoacylglycerol metabolic process(GO:0046462) monoacylglycerol catabolic process(GO:0052651) |
| 0.1 | 0.6 | GO:0032793 | positive regulation of CREB transcription factor activity(GO:0032793) |
| 0.1 | 0.7 | GO:0000185 | activation of MAPKKK activity(GO:0000185) |
| 0.1 | 0.4 | GO:0051775 | response to redox state(GO:0051775) |
| 0.1 | 0.3 | GO:0090267 | positive regulation of spindle checkpoint(GO:0090232) positive regulation of mitotic cell cycle spindle assembly checkpoint(GO:0090267) |
| 0.1 | 0.2 | GO:0044691 | tooth eruption(GO:0044691) |
| 0.1 | 0.6 | GO:0045647 | negative regulation of erythrocyte differentiation(GO:0045647) |
| 0.1 | 0.1 | GO:0000720 | pyrimidine dimer repair by nucleotide-excision repair(GO:0000720) |
| 0.1 | 0.9 | GO:0072311 | renal filtration cell differentiation(GO:0061318) glomerular visceral epithelial cell differentiation(GO:0072112) glomerular epithelial cell differentiation(GO:0072311) |
| 0.1 | 0.2 | GO:0090172 | microtubule cytoskeleton organization involved in homologous chromosome segregation(GO:0090172) |
| 0.1 | 0.1 | GO:0098908 | regulation of neuronal action potential(GO:0098908) |
| 0.1 | 0.4 | GO:0097012 | cellular response to granulocyte macrophage colony-stimulating factor stimulus(GO:0097011) response to granulocyte macrophage colony-stimulating factor(GO:0097012) |
| 0.1 | 0.2 | GO:0030576 | Cajal body organization(GO:0030576) |
| 0.1 | 0.2 | GO:0001302 | replicative cell aging(GO:0001302) |
| 0.1 | 0.2 | GO:0071313 | cellular response to caffeine(GO:0071313) |
| 0.1 | 0.5 | GO:0097106 | postsynaptic density organization(GO:0097106) |
| 0.1 | 0.1 | GO:0061738 | late endosomal microautophagy(GO:0061738) |
| 0.1 | 0.3 | GO:0051534 | negative regulation of NFAT protein import into nucleus(GO:0051534) |
| 0.1 | 0.4 | GO:0060088 | auditory receptor cell stereocilium organization(GO:0060088) |
| 0.1 | 0.4 | GO:0033234 | negative regulation of protein sumoylation(GO:0033234) |
| 0.1 | 0.4 | GO:0090435 | protein localization to nuclear envelope(GO:0090435) |
| 0.1 | 0.2 | GO:1904707 | positive regulation of vascular smooth muscle cell proliferation(GO:1904707) |
| 0.1 | 0.6 | GO:0000722 | telomere maintenance via recombination(GO:0000722) |
| 0.1 | 0.2 | GO:0009227 | nucleotide-sugar catabolic process(GO:0009227) |
| 0.1 | 0.1 | GO:1904000 | positive regulation of eating behavior(GO:1904000) |
| 0.1 | 0.2 | GO:0006353 | DNA-templated transcription, termination(GO:0006353) |
| 0.1 | 0.3 | GO:0070827 | chromatin maintenance(GO:0070827) |
| 0.1 | 0.2 | GO:0033512 | L-lysine catabolic process to acetyl-CoA via saccharopine(GO:0033512) |
| 0.1 | 0.2 | GO:0090274 | positive regulation of somatostatin secretion(GO:0090274) |
| 0.1 | 0.5 | GO:0035562 | negative regulation of chromatin binding(GO:0035562) |
| 0.1 | 0.1 | GO:2001245 | regulation of phosphatidylcholine biosynthetic process(GO:2001245) |
| 0.1 | 0.1 | GO:1902414 | protein localization to cell junction(GO:1902414) |
| 0.1 | 0.2 | GO:0030718 | germ-line stem cell population maintenance(GO:0030718) |
| 0.1 | 0.3 | GO:0001574 | ganglioside biosynthetic process(GO:0001574) |
| 0.1 | 0.2 | GO:0072386 | plus-end-directed vesicle transport along microtubule(GO:0072383) plus-end-directed organelle transport along microtubule(GO:0072386) |
| 0.1 | 0.2 | GO:0006421 | asparaginyl-tRNA aminoacylation(GO:0006421) |
| 0.1 | 0.5 | GO:0035721 | intraciliary retrograde transport(GO:0035721) |
| 0.1 | 0.3 | GO:0030382 | sperm mitochondrion organization(GO:0030382) |
| 0.1 | 0.1 | GO:1903895 | negative regulation of IRE1-mediated unfolded protein response(GO:1903895) |
| 0.1 | 0.2 | GO:0043615 | astrocyte cell migration(GO:0043615) |
| 0.1 | 0.1 | GO:1900151 | regulation of nuclear-transcribed mRNA catabolic process, deadenylation-dependent decay(GO:1900151) positive regulation of nuclear-transcribed mRNA catabolic process, deadenylation-dependent decay(GO:1900153) |
| 0.1 | 0.5 | GO:0060539 | diaphragm development(GO:0060539) |
| 0.1 | 0.1 | GO:1904569 | regulation of selenocysteine incorporation(GO:1904569) |
| 0.1 | 0.8 | GO:0034349 | glial cell apoptotic process(GO:0034349) |
| 0.1 | 0.3 | GO:0031087 | nuclear-transcribed mRNA catabolic process, deadenylation-independent decay(GO:0031086) deadenylation-independent decapping of nuclear-transcribed mRNA(GO:0031087) |
| 0.1 | 0.1 | GO:0044800 | fusion of virus membrane with host plasma membrane(GO:0019064) membrane fusion involved in viral entry into host cell(GO:0039663) multi-organism membrane fusion(GO:0044800) |
| 0.1 | 0.4 | GO:1902065 | response to L-glutamate(GO:1902065) |
| 0.1 | 0.1 | GO:0098909 | regulation of cardiac muscle cell action potential involved in regulation of contraction(GO:0098909) |
| 0.1 | 0.3 | GO:0045955 | negative regulation of calcium ion-dependent exocytosis(GO:0045955) |
| 0.1 | 0.3 | GO:0006477 | protein sulfation(GO:0006477) |
| 0.1 | 0.2 | GO:0044339 | canonical Wnt signaling pathway involved in osteoblast differentiation(GO:0044339) |
| 0.1 | 1.3 | GO:0032011 | ARF protein signal transduction(GO:0032011) |
| 0.1 | 0.5 | GO:0072502 | cellular phosphate ion homeostasis(GO:0030643) cellular trivalent inorganic anion homeostasis(GO:0072502) |
| 0.1 | 0.3 | GO:2000811 | negative regulation of anoikis(GO:2000811) |
| 0.1 | 0.1 | GO:0042631 | cellular response to water deprivation(GO:0042631) |
| 0.1 | 0.3 | GO:0033314 | mitotic DNA replication checkpoint(GO:0033314) |
| 0.1 | 0.2 | GO:0016103 | diterpenoid catabolic process(GO:0016103) retinoic acid catabolic process(GO:0034653) |
| 0.1 | 0.2 | GO:0006435 | threonyl-tRNA aminoacylation(GO:0006435) |
| 0.1 | 0.3 | GO:0006177 | GMP biosynthetic process(GO:0006177) |
| 0.1 | 0.4 | GO:0051574 | positive regulation of histone H3-K9 methylation(GO:0051574) |
| 0.1 | 0.1 | GO:1901896 | positive regulation of calcium-transporting ATPase activity(GO:1901896) |
| 0.1 | 0.2 | GO:0071298 | cellular response to L-ascorbic acid(GO:0071298) |
| 0.1 | 0.3 | GO:0043090 | amino acid import(GO:0043090) |
| 0.1 | 0.2 | GO:0048702 | embryonic neurocranium morphogenesis(GO:0048702) |
| 0.1 | 0.1 | GO:1903334 | positive regulation of protein folding(GO:1903334) |
| 0.1 | 0.2 | GO:0097298 | regulation of nucleus size(GO:0097298) |
| 0.1 | 0.2 | GO:0015959 | diadenosine polyphosphate metabolic process(GO:0015959) |
| 0.0 | 0.1 | GO:0002725 | negative regulation of T cell cytokine production(GO:0002725) |
| 0.0 | 0.4 | GO:1900017 | positive regulation of cytokine production involved in inflammatory response(GO:1900017) |
| 0.0 | 0.2 | GO:0070828 | heterochromatin organization(GO:0070828) |
| 0.0 | 0.1 | GO:0071494 | cellular response to UV-C(GO:0071494) |
| 0.0 | 0.3 | GO:2000819 | regulation of nucleotide-excision repair(GO:2000819) |
| 0.0 | 0.1 | GO:1904217 | regulation of CDP-diacylglycerol-serine O-phosphatidyltransferase activity(GO:1904217) positive regulation of CDP-diacylglycerol-serine O-phosphatidyltransferase activity(GO:1904219) positive regulation of serine C-palmitoyltransferase activity(GO:1904222) |
| 0.0 | 0.1 | GO:0060214 | endocardium formation(GO:0060214) |
| 0.0 | 0.1 | GO:2000427 | positive regulation of apoptotic cell clearance(GO:2000427) |
| 0.0 | 0.0 | GO:0051454 | pH elevation(GO:0045852) intracellular pH elevation(GO:0051454) |
| 0.0 | 0.1 | GO:1901165 | positive regulation of trophoblast cell migration(GO:1901165) |
| 0.0 | 1.1 | GO:0033120 | positive regulation of RNA splicing(GO:0033120) |
| 0.0 | 0.4 | GO:0032494 | response to peptidoglycan(GO:0032494) |
| 0.0 | 0.6 | GO:0070072 | vacuolar proton-transporting V-type ATPase complex assembly(GO:0070072) |
| 0.0 | 0.8 | GO:0043968 | histone H2A acetylation(GO:0043968) |
| 0.0 | 0.6 | GO:0060081 | membrane hyperpolarization(GO:0060081) |
| 0.0 | 1.0 | GO:0035235 | ionotropic glutamate receptor signaling pathway(GO:0035235) |
| 0.0 | 0.2 | GO:0071763 | nuclear membrane organization(GO:0071763) |
| 0.0 | 0.2 | GO:0071364 | cellular response to epidermal growth factor stimulus(GO:0071364) |
| 0.0 | 0.2 | GO:0035627 | ceramide transport(GO:0035627) |
| 0.0 | 1.5 | GO:0018345 | protein palmitoylation(GO:0018345) |
| 0.0 | 0.2 | GO:0019087 | transformation of host cell by virus(GO:0019087) |
| 0.0 | 0.0 | GO:1905244 | regulation of modification of synaptic structure(GO:1905244) |
| 0.0 | 0.1 | GO:1990167 | protein K27-linked deubiquitination(GO:1990167) |
| 0.0 | 0.3 | GO:0000244 | spliceosomal tri-snRNP complex assembly(GO:0000244) |
| 0.0 | 4.9 | GO:0035023 | regulation of Rho protein signal transduction(GO:0035023) |
| 0.0 | 0.1 | GO:0018992 | germ-line sex determination(GO:0018992) |
| 0.0 | 0.3 | GO:0021800 | cerebral cortex tangential migration(GO:0021800) |
| 0.0 | 0.2 | GO:0007406 | negative regulation of neuroblast proliferation(GO:0007406) |
| 0.0 | 0.0 | GO:0060982 | coronary artery morphogenesis(GO:0060982) |
| 0.0 | 0.6 | GO:1902259 | regulation of delayed rectifier potassium channel activity(GO:1902259) |
| 0.0 | 0.2 | GO:0002327 | immature B cell differentiation(GO:0002327) pre-B cell differentiation(GO:0002329) |
| 0.0 | 0.2 | GO:0014807 | regulation of somitogenesis(GO:0014807) |
| 0.0 | 0.2 | GO:0046477 | glycosylceramide catabolic process(GO:0046477) |
| 0.0 | 0.1 | GO:0090169 | regulation of spindle assembly(GO:0090169) |
| 0.0 | 0.6 | GO:0089711 | L-glutamate transmembrane transport(GO:0089711) |
| 0.0 | 0.7 | GO:0045943 | positive regulation of transcription from RNA polymerase I promoter(GO:0045943) |
| 0.0 | 0.5 | GO:0006491 | N-glycan processing(GO:0006491) |
| 0.0 | 0.2 | GO:0051418 | interphase microtubule nucleation by interphase microtubule organizing center(GO:0051415) microtubule nucleation by microtubule organizing center(GO:0051418) |
| 0.0 | 0.3 | GO:0021902 | commitment of neuronal cell to specific neuron type in forebrain(GO:0021902) |
| 0.0 | 1.5 | GO:0046834 | lipid phosphorylation(GO:0046834) |
| 0.0 | 0.1 | GO:0036500 | ATF6-mediated unfolded protein response(GO:0036500) |
| 0.0 | 0.2 | GO:0046602 | regulation of mitotic centrosome separation(GO:0046602) |
| 0.0 | 0.2 | GO:0070839 | divalent metal ion export(GO:0070839) |
| 0.0 | 0.1 | GO:1903445 | intermembrane transport(GO:0046909) protein transport from ciliary membrane to plasma membrane(GO:1903445) |
| 0.0 | 0.8 | GO:0030149 | sphingolipid catabolic process(GO:0030149) |
| 0.0 | 0.1 | GO:0007037 | vacuolar phosphate transport(GO:0007037) positive regulation of parathyroid hormone secretion(GO:2000830) |
| 0.0 | 0.2 | GO:0006868 | glutamine transport(GO:0006868) |
| 0.0 | 0.0 | GO:0006116 | NADH oxidation(GO:0006116) |
| 0.0 | 0.1 | GO:0070127 | tRNA aminoacylation for mitochondrial protein translation(GO:0070127) |
| 0.0 | 0.1 | GO:1901026 | ripoptosome assembly(GO:0097343) ripoptosome assembly involved in necroptotic process(GO:1901026) |
| 0.0 | 0.1 | GO:0030242 | pexophagy(GO:0030242) |
| 0.0 | 0.1 | GO:1902336 | positive regulation of retinal ganglion cell axon guidance(GO:1902336) |
| 0.0 | 0.9 | GO:0006891 | intra-Golgi vesicle-mediated transport(GO:0006891) |
| 0.0 | 0.1 | GO:0043984 | histone H4-K16 acetylation(GO:0043984) |
| 0.0 | 0.5 | GO:0007257 | activation of JUN kinase activity(GO:0007257) |
| 0.0 | 0.6 | GO:0010248 | establishment or maintenance of transmembrane electrochemical gradient(GO:0010248) |
| 0.0 | 0.1 | GO:0042795 | snRNA transcription from RNA polymerase II promoter(GO:0042795) |
| 0.0 | 0.3 | GO:1904587 | response to glycoprotein(GO:1904587) |
| 0.0 | 0.2 | GO:0045821 | positive regulation of glycolytic process(GO:0045821) |
| 0.0 | 0.1 | GO:0031053 | primary miRNA processing(GO:0031053) |
| 0.0 | 0.1 | GO:0060939 | cardiac fibroblast cell differentiation(GO:0060935) cardiac fibroblast cell development(GO:0060936) epicardium-derived cardiac fibroblast cell differentiation(GO:0060938) epicardium-derived cardiac fibroblast cell development(GO:0060939) |
| 0.0 | 0.5 | GO:0071044 | histone mRNA catabolic process(GO:0071044) |
| 0.0 | 0.2 | GO:0060279 | positive regulation of ovulation(GO:0060279) |
| 0.0 | 0.3 | GO:0033572 | transferrin transport(GO:0033572) |
| 0.0 | 0.1 | GO:0002380 | immunoglobulin secretion involved in immune response(GO:0002380) |
| 0.0 | 0.1 | GO:0070634 | transepithelial ammonium transport(GO:0070634) |
| 0.0 | 0.1 | GO:0014878 | response to electrical stimulus involved in regulation of muscle adaptation(GO:0014878) |
| 0.0 | 0.1 | GO:0048703 | embryonic viscerocranium morphogenesis(GO:0048703) |
| 0.0 | 0.2 | GO:0038003 | opioid receptor signaling pathway(GO:0038003) |
| 0.0 | 0.1 | GO:0061355 | Wnt protein secretion(GO:0061355) regulation of Wnt protein secretion(GO:0061356) positive regulation of Wnt protein secretion(GO:0061357) |
| 0.0 | 0.2 | GO:0009078 | alanine metabolic process(GO:0006522) pyruvate family amino acid metabolic process(GO:0009078) L-alanine metabolic process(GO:0042851) |
| 0.0 | 0.1 | GO:0045347 | negative regulation of MHC class II biosynthetic process(GO:0045347) |
| 0.0 | 0.6 | GO:0006198 | cAMP catabolic process(GO:0006198) |
| 0.0 | 0.1 | GO:0010571 | positive regulation of nuclear cell cycle DNA replication(GO:0010571) |
| 0.0 | 0.5 | GO:0050765 | negative regulation of phagocytosis(GO:0050765) |
| 0.0 | 0.2 | GO:0060014 | granulosa cell differentiation(GO:0060014) |
| 0.0 | 0.4 | GO:0016973 | poly(A)+ mRNA export from nucleus(GO:0016973) |
| 0.0 | 0.4 | GO:1902018 | negative regulation of cilium assembly(GO:1902018) |
| 0.0 | 0.4 | GO:0035608 | protein deglutamylation(GO:0035608) |
| 0.0 | 0.5 | GO:0070584 | mitochondrion morphogenesis(GO:0070584) |
| 0.0 | 0.1 | GO:0032776 | DNA methylation on cytosine(GO:0032776) |
| 0.0 | 0.1 | GO:0032484 | Ral protein signal transduction(GO:0032484) regulation of exocyst localization(GO:0060178) |
| 0.0 | 0.4 | GO:0016339 | calcium-dependent cell-cell adhesion via plasma membrane cell adhesion molecules(GO:0016339) |
| 0.0 | 0.1 | GO:0006431 | methionyl-tRNA aminoacylation(GO:0006431) |
| 0.0 | 0.0 | GO:1903721 | regulation of I-kappaB phosphorylation(GO:1903719) positive regulation of I-kappaB phosphorylation(GO:1903721) |
| 0.0 | 0.3 | GO:0043504 | mitochondrial DNA repair(GO:0043504) |
| 0.0 | 0.1 | GO:0045869 | negative regulation of single stranded viral RNA replication via double stranded DNA intermediate(GO:0045869) |
| 0.0 | 0.2 | GO:0010820 | positive regulation of T cell chemotaxis(GO:0010820) |
| 0.0 | 1.0 | GO:0018279 | protein N-linked glycosylation via asparagine(GO:0018279) |
| 0.0 | 0.1 | GO:0002035 | brain renin-angiotensin system(GO:0002035) |
| 0.0 | 0.1 | GO:0044565 | dendritic cell proliferation(GO:0044565) |
| 0.0 | 0.1 | GO:0003419 | growth plate cartilage chondrocyte proliferation(GO:0003419) |
| 0.0 | 0.4 | GO:0036336 | dendritic cell migration(GO:0036336) |
| 0.0 | 0.1 | GO:0070493 | thrombin receptor signaling pathway(GO:0070493) |
| 0.0 | 0.1 | GO:0006545 | glycine biosynthetic process(GO:0006545) |
| 0.0 | 0.1 | GO:0060319 | regulation of primitive erythrocyte differentiation(GO:0010725) primitive erythrocyte differentiation(GO:0060319) |
| 0.0 | 0.1 | GO:0071409 | cellular response to cycloheximide(GO:0071409) |
| 0.0 | 0.2 | GO:0042760 | very long-chain fatty acid catabolic process(GO:0042760) |
| 0.0 | 0.1 | GO:0010499 | proteasomal ubiquitin-independent protein catabolic process(GO:0010499) |
| 0.0 | 0.0 | GO:1904616 | regulation of actin filament binding(GO:1904529) regulation of actin binding(GO:1904616) |
| 0.0 | 0.2 | GO:0051388 | positive regulation of neurotrophin TRK receptor signaling pathway(GO:0051388) |
| 0.0 | 0.5 | GO:0097352 | autophagosome maturation(GO:0097352) |
| 0.0 | 0.1 | GO:1901750 | leukotriene D4 metabolic process(GO:1901748) leukotriene D4 biosynthetic process(GO:1901750) |
| 0.0 | 0.1 | GO:1902044 | regulation of Fas signaling pathway(GO:1902044) |
| 0.0 | 0.3 | GO:0008340 | determination of adult lifespan(GO:0008340) |
| 0.0 | 0.5 | GO:0051457 | maintenance of protein location in nucleus(GO:0051457) |
| 0.0 | 0.2 | GO:0031119 | tRNA pseudouridine synthesis(GO:0031119) |
| 0.0 | 0.0 | GO:0032298 | positive regulation of DNA-dependent DNA replication initiation(GO:0032298) |
| 0.0 | 0.6 | GO:0046847 | filopodium assembly(GO:0046847) |
| 0.0 | 0.7 | GO:0021591 | ventricular system development(GO:0021591) |
| 0.0 | 0.1 | GO:0071205 | protein localization to juxtaparanode region of axon(GO:0071205) |
| 0.0 | 0.6 | GO:2000059 | negative regulation of protein ubiquitination involved in ubiquitin-dependent protein catabolic process(GO:2000059) |
| 0.0 | 0.2 | GO:0019240 | citrulline biosynthetic process(GO:0019240) |
| 0.0 | 0.2 | GO:0051151 | negative regulation of smooth muscle cell differentiation(GO:0051151) |
| 0.0 | 0.2 | GO:2000310 | regulation of N-methyl-D-aspartate selective glutamate receptor activity(GO:2000310) |
| 0.0 | 1.6 | GO:0043966 | histone H3 acetylation(GO:0043966) |
| 0.0 | 1.4 | GO:0000245 | spliceosomal complex assembly(GO:0000245) |
| 0.0 | 0.6 | GO:0070884 | regulation of calcineurin-NFAT signaling cascade(GO:0070884) |
| 0.0 | 0.2 | GO:0051531 | NFAT protein import into nucleus(GO:0051531) regulation of NFAT protein import into nucleus(GO:0051532) positive regulation of NFAT protein import into nucleus(GO:0051533) |
| 0.0 | 0.1 | GO:0072156 | distal tubule morphogenesis(GO:0072156) |
| 0.0 | 0.1 | GO:0060447 | bud outgrowth involved in lung branching(GO:0060447) |
| 0.0 | 0.0 | GO:0019676 | ammonia assimilation cycle(GO:0019676) |
| 0.0 | 0.3 | GO:1903779 | regulation of cardiac conduction(GO:1903779) |
| 0.0 | 0.1 | GO:0003100 | regulation of systemic arterial blood pressure by endothelin(GO:0003100) |
| 0.0 | 0.2 | GO:0003062 | regulation of heart rate by chemical signal(GO:0003062) |
| 0.0 | 0.2 | GO:1904491 | protein localization to ciliary transition zone(GO:1904491) |
| 0.0 | 0.2 | GO:0000012 | single strand break repair(GO:0000012) |
| 0.0 | 0.1 | GO:0090383 | phagosome acidification(GO:0090383) |
| 0.0 | 0.2 | GO:0032464 | positive regulation of protein homooligomerization(GO:0032464) |
| 0.0 | 0.1 | GO:0002158 | osteoclast proliferation(GO:0002158) |
| 0.0 | 0.1 | GO:0097499 | protein localization to nonmotile primary cilium(GO:0097499) |
| 0.0 | 0.4 | GO:0006003 | fructose 2,6-bisphosphate metabolic process(GO:0006003) |
| 0.0 | 0.2 | GO:0042866 | pyruvate biosynthetic process(GO:0042866) |
| 0.0 | 1.1 | GO:0071277 | cellular response to calcium ion(GO:0071277) |
| 0.0 | 0.2 | GO:0080009 | mRNA methylation(GO:0080009) |
| 0.0 | 0.1 | GO:0071374 | cellular response to parathyroid hormone stimulus(GO:0071374) |
| 0.0 | 0.2 | GO:0046826 | negative regulation of protein export from nucleus(GO:0046826) |
| 0.0 | 0.2 | GO:2000210 | positive regulation of anoikis(GO:2000210) |
| 0.0 | 0.0 | GO:0034141 | positive regulation of toll-like receptor 3 signaling pathway(GO:0034141) |
| 0.0 | 0.5 | GO:0030033 | microvillus assembly(GO:0030033) |
| 0.0 | 0.1 | GO:0060766 | negative regulation of androgen receptor signaling pathway(GO:0060766) |
| 0.0 | 0.1 | GO:0080144 | amino acid homeostasis(GO:0080144) |
| 0.0 | 0.2 | GO:0014857 | skeletal muscle satellite cell proliferation(GO:0014841) regulation of skeletal muscle satellite cell proliferation(GO:0014842) skeletal muscle cell proliferation(GO:0014856) regulation of skeletal muscle cell proliferation(GO:0014857) |
| 0.0 | 0.2 | GO:1904424 | regulation of GTP binding(GO:1904424) |
| 0.0 | 0.0 | GO:1902474 | positive regulation of protein localization to synapse(GO:1902474) |
| 0.0 | 0.2 | GO:0090344 | negative regulation of cell aging(GO:0090344) |
| 0.0 | 0.8 | GO:0030199 | collagen fibril organization(GO:0030199) |
| 0.0 | 0.2 | GO:0016576 | histone dephosphorylation(GO:0016576) |
| 0.0 | 0.1 | GO:2000189 | positive regulation of cholesterol homeostasis(GO:2000189) |
| 0.0 | 0.1 | GO:0006428 | isoleucyl-tRNA aminoacylation(GO:0006428) |
| 0.0 | 0.0 | GO:0036337 | Fas signaling pathway(GO:0036337) |
| 0.0 | 0.1 | GO:0031547 | brain-derived neurotrophic factor receptor signaling pathway(GO:0031547) |
| 0.0 | 0.1 | GO:0010832 | negative regulation of myotube differentiation(GO:0010832) |
| 0.0 | 0.2 | GO:0016198 | axon choice point recognition(GO:0016198) |
| 0.0 | 0.0 | GO:0051695 | actin filament uncapping(GO:0051695) |
| 0.0 | 0.9 | GO:0034724 | DNA replication-independent nucleosome organization(GO:0034724) |
| 0.0 | 0.2 | GO:0097264 | self proteolysis(GO:0097264) |
| 0.0 | 0.1 | GO:0050651 | dermatan sulfate proteoglycan biosynthetic process(GO:0050651) |
| 0.0 | 0.2 | GO:0016926 | protein desumoylation(GO:0016926) |
| 0.0 | 0.1 | GO:0008300 | isoprenoid catabolic process(GO:0008300) |
| 0.0 | 0.1 | GO:0043951 | negative regulation of cAMP-mediated signaling(GO:0043951) |
| 0.0 | 0.3 | GO:0035457 | cellular response to interferon-alpha(GO:0035457) |
| 0.0 | 0.2 | GO:1902036 | regulation of hematopoietic stem cell differentiation(GO:1902036) |
| 0.0 | 0.2 | GO:0051383 | kinetochore assembly(GO:0051382) kinetochore organization(GO:0051383) |
| 0.0 | 0.0 | GO:1903059 | regulation of protein lipidation(GO:1903059) positive regulation of protein lipidation(GO:1903061) |
| 0.0 | 0.1 | GO:0003365 | establishment of cell polarity involved in ameboidal cell migration(GO:0003365) |
| 0.0 | 0.1 | GO:1903421 | regulation of synaptic vesicle recycling(GO:1903421) |
| 0.0 | 0.3 | GO:1901099 | negative regulation of signal transduction in absence of ligand(GO:1901099) negative regulation of extrinsic apoptotic signaling pathway in absence of ligand(GO:2001240) |
| 0.0 | 0.2 | GO:2001256 | regulation of store-operated calcium entry(GO:2001256) |
| 0.0 | 0.1 | GO:2000051 | negative regulation of non-canonical Wnt signaling pathway(GO:2000051) |
| 0.0 | 0.1 | GO:0048254 | snoRNA localization(GO:0048254) |
| 0.0 | 0.2 | GO:0019800 | peptide cross-linking via chondroitin 4-sulfate glycosaminoglycan(GO:0019800) |
| 0.0 | 0.1 | GO:0001682 | tRNA 5'-leader removal(GO:0001682) |
| 0.0 | 0.1 | GO:0031665 | negative regulation of lipopolysaccharide-mediated signaling pathway(GO:0031665) |
| 0.0 | 0.1 | GO:0097210 | response to gonadotropin-releasing hormone(GO:0097210) cellular response to gonadotropin-releasing hormone(GO:0097211) |
| 0.0 | 0.1 | GO:0071397 | cellular response to cholesterol(GO:0071397) |
| 0.0 | 0.1 | GO:1904058 | positive regulation of sensory perception of pain(GO:1904058) |
| 0.0 | 0.2 | GO:0043928 | exonucleolytic nuclear-transcribed mRNA catabolic process involved in deadenylation-dependent decay(GO:0043928) |
| 0.0 | 0.3 | GO:0006699 | bile acid biosynthetic process(GO:0006699) |
| 0.0 | 0.1 | GO:0002669 | positive regulation of T cell anergy(GO:0002669) positive regulation of lymphocyte anergy(GO:0002913) |
| 0.0 | 0.1 | GO:0097084 | vascular smooth muscle cell development(GO:0097084) |
| 0.0 | 0.2 | GO:0032780 | negative regulation of ATPase activity(GO:0032780) |
| 0.0 | 0.2 | GO:0016560 | protein import into peroxisome matrix, docking(GO:0016560) |
| 0.0 | 0.1 | GO:1901073 | N-acetylglucosamine biosynthetic process(GO:0006045) N-acetylneuraminate biosynthetic process(GO:0046380) glucosamine-containing compound biosynthetic process(GO:1901073) |
| 0.0 | 1.5 | GO:0016579 | protein deubiquitination(GO:0016579) |
| 0.0 | 0.1 | GO:0031915 | positive regulation of synaptic plasticity(GO:0031915) |
| 0.0 | 0.4 | GO:0060259 | regulation of feeding behavior(GO:0060259) |
| 0.0 | 0.3 | GO:0001887 | selenium compound metabolic process(GO:0001887) |
| 0.0 | 0.3 | GO:0034260 | negative regulation of GTPase activity(GO:0034260) |
| 0.0 | 0.1 | GO:0006667 | sphinganine metabolic process(GO:0006667) |
| 0.0 | 0.1 | GO:0044861 | protein transport into plasma membrane raft(GO:0044861) |
| 0.0 | 0.0 | GO:0032714 | negative regulation of interleukin-5 production(GO:0032714) |
| 0.0 | 0.4 | GO:0045947 | negative regulation of translational initiation(GO:0045947) |
| 0.0 | 0.3 | GO:0043011 | myeloid dendritic cell differentiation(GO:0043011) |
| 0.0 | 0.1 | GO:0006283 | transcription-coupled nucleotide-excision repair(GO:0006283) |
| 0.0 | 0.1 | GO:0060903 | positive regulation of meiosis I(GO:0060903) |
| 0.0 | 0.0 | GO:0031937 | positive regulation of chromatin silencing(GO:0031937) |
| 0.0 | 0.1 | GO:0042148 | strand invasion(GO:0042148) |
| 0.0 | 0.0 | GO:0035696 | monocyte extravasation(GO:0035696) |
| 0.0 | 0.1 | GO:0039689 | negative stranded viral RNA replication(GO:0039689) multi-organism biosynthetic process(GO:0044034) |
| 0.0 | 0.2 | GO:0043162 | ubiquitin-dependent protein catabolic process via the multivesicular body sorting pathway(GO:0043162) |
| 0.0 | 0.1 | GO:0032788 | saturated monocarboxylic acid metabolic process(GO:0032788) unsaturated monocarboxylic acid metabolic process(GO:0032789) |
| 0.0 | 0.0 | GO:0006701 | progesterone biosynthetic process(GO:0006701) |
| 0.0 | 0.1 | GO:0045210 | FasL biosynthetic process(GO:0045210) |
| 0.0 | 0.1 | GO:0072643 | interferon-gamma secretion(GO:0072643) |
| 0.0 | 0.2 | GO:0071352 | cellular response to interleukin-2(GO:0071352) |
| 0.0 | 0.0 | GO:0000290 | deadenylation-dependent decapping of nuclear-transcribed mRNA(GO:0000290) |
| 0.0 | 0.0 | GO:0071073 | positive regulation of phospholipid biosynthetic process(GO:0071073) |
| 0.0 | 0.1 | GO:1990523 | bone regeneration(GO:1990523) |
| 0.0 | 0.0 | GO:0002084 | protein depalmitoylation(GO:0002084) |
| 0.0 | 0.1 | GO:0006072 | glycerol-3-phosphate metabolic process(GO:0006072) |
| 0.0 | 0.1 | GO:1990414 | replication-born double-strand break repair via sister chromatid exchange(GO:1990414) |
| 0.0 | 0.1 | GO:0034379 | very-low-density lipoprotein particle assembly(GO:0034379) |
| 0.0 | 0.1 | GO:0098928 | presynaptic signal transduction(GO:0098928) presynapse to nucleus signaling pathway(GO:0099526) |
| 0.0 | 0.7 | GO:0045494 | photoreceptor cell maintenance(GO:0045494) |
| 0.0 | 0.2 | GO:1902916 | positive regulation of protein polyubiquitination(GO:1902916) |
| 0.0 | 0.0 | GO:0060697 | positive regulation of phospholipid catabolic process(GO:0060697) |
| 0.0 | 0.1 | GO:0045956 | positive regulation of calcium ion-dependent exocytosis(GO:0045956) |
| 0.0 | 0.1 | GO:0035188 | blastocyst hatching(GO:0001835) hatching(GO:0035188) organism emergence from protective structure(GO:0071684) |
| 0.0 | 0.2 | GO:2000780 | negative regulation of DNA repair(GO:0045738) negative regulation of double-strand break repair(GO:2000780) |
| 0.0 | 0.7 | GO:0008333 | endosome to lysosome transport(GO:0008333) |
| 0.0 | 0.0 | GO:0097113 | AMPA glutamate receptor clustering(GO:0097113) |
| 0.0 | 0.0 | GO:0035412 | catenin import into nucleus(GO:0035411) regulation of catenin import into nucleus(GO:0035412) |
| 0.0 | 0.1 | GO:0043418 | homocysteine catabolic process(GO:0043418) |
| 0.0 | 0.1 | GO:0046102 | inosine metabolic process(GO:0046102) |
| 0.0 | 0.1 | GO:0035405 | histone-threonine phosphorylation(GO:0035405) |
| 0.0 | 0.2 | GO:0090005 | negative regulation of establishment of protein localization to plasma membrane(GO:0090005) |
| 0.0 | 0.1 | GO:0007252 | I-kappaB phosphorylation(GO:0007252) |
| 0.0 | 0.6 | GO:0035019 | somatic stem cell population maintenance(GO:0035019) |
| 0.0 | 1.0 | GO:0042147 | retrograde transport, endosome to Golgi(GO:0042147) |
| 0.0 | 0.1 | GO:0008655 | pyrimidine-containing compound salvage(GO:0008655) pyrimidine nucleoside salvage(GO:0043097) |
| 0.0 | 0.2 | GO:0019511 | peptidyl-proline hydroxylation(GO:0019511) |
| 0.0 | 0.2 | GO:0032836 | glomerular basement membrane development(GO:0032836) |
| 0.0 | 0.1 | GO:0051597 | response to methylmercury(GO:0051597) |
| 0.0 | 0.1 | GO:0002149 | hypochlorous acid metabolic process(GO:0002148) hypochlorous acid biosynthetic process(GO:0002149) response to gold nanoparticle(GO:1990268) |
| 0.0 | 0.0 | GO:0016240 | autophagosome docking(GO:0016240) |
| 0.0 | 0.1 | GO:1903527 | positive regulation of membrane tubulation(GO:1903527) |
| 0.0 | 0.1 | GO:0046061 | dATP catabolic process(GO:0046061) |
| 0.0 | 0.6 | GO:0006779 | porphyrin-containing compound biosynthetic process(GO:0006779) |
| 0.0 | 0.1 | GO:0046349 | UDP-N-acetylglucosamine biosynthetic process(GO:0006048) amino sugar biosynthetic process(GO:0046349) |
| 0.0 | 0.1 | GO:0042723 | thiamine metabolic process(GO:0006772) thiamine diphosphate metabolic process(GO:0042357) thiamine-containing compound metabolic process(GO:0042723) |
| 0.0 | 0.1 | GO:0090141 | positive regulation of mitochondrial fission(GO:0090141) |
| 0.0 | 0.1 | GO:0042159 | lipoprotein catabolic process(GO:0042159) |
| 0.0 | 0.1 | GO:0006686 | sphingomyelin biosynthetic process(GO:0006686) |
| 0.0 | 0.1 | GO:0097369 | sodium ion import(GO:0097369) sodium ion import across plasma membrane(GO:0098719) sodium ion import into cell(GO:1990118) |
| 0.0 | 0.0 | GO:0099624 | atrial cardiac muscle cell membrane repolarization(GO:0099624) |
| 0.0 | 0.1 | GO:0032693 | negative regulation of interleukin-10 production(GO:0032693) |
| 0.0 | 0.1 | GO:0032119 | sequestering of zinc ion(GO:0032119) regulation of sequestering of zinc ion(GO:0061088) |
| 0.0 | 0.0 | GO:0036378 | calcitriol biosynthetic process from calciol(GO:0036378) |
| 0.0 | 0.2 | GO:0032682 | negative regulation of chemokine production(GO:0032682) |
| 0.0 | 0.0 | GO:0006409 | tRNA export from nucleus(GO:0006409) tRNA-containing ribonucleoprotein complex export from nucleus(GO:0071431) |
| 0.0 | 0.1 | GO:0006311 | meiotic gene conversion(GO:0006311) gene conversion(GO:0035822) |
| 0.0 | 0.0 | GO:2000209 | regulation of anoikis(GO:2000209) |
| 0.0 | 0.1 | GO:0006268 | DNA unwinding involved in DNA replication(GO:0006268) |
| 0.0 | 0.1 | GO:1990035 | calcium ion import across plasma membrane(GO:0098703) calcium ion import into cell(GO:1990035) |
| 0.0 | 0.1 | GO:0051182 | coenzyme transport(GO:0051182) |
| 0.0 | 0.1 | GO:0007171 | activation of transmembrane receptor protein tyrosine kinase activity(GO:0007171) |
| 0.0 | 0.3 | GO:0071526 | semaphorin-plexin signaling pathway(GO:0071526) |
| 0.0 | 0.1 | GO:0007296 | vitellogenesis(GO:0007296) |
| 0.0 | 0.3 | GO:0001522 | pseudouridine synthesis(GO:0001522) |
| 0.0 | 0.0 | GO:0042117 | monocyte activation(GO:0042117) |
| 0.0 | 0.0 | GO:1902299 | pre-replicative complex assembly involved in nuclear cell cycle DNA replication(GO:0006267) pre-replicative complex assembly(GO:0036388) pre-replicative complex assembly involved in cell cycle DNA replication(GO:1902299) |
| 0.0 | 0.0 | GO:0061588 | calcium activated phospholipid scrambling(GO:0061588) calcium activated phosphatidylcholine scrambling(GO:0061590) calcium activated galactosylceramide scrambling(GO:0061591) |
| 0.0 | 0.0 | GO:0018125 | peptidyl-cysteine methylation(GO:0018125) |
| 0.0 | 0.1 | GO:0075525 | viral translational termination-reinitiation(GO:0075525) |
| 0.0 | 0.1 | GO:0070125 | mitochondrial translational elongation(GO:0070125) |
| 0.0 | 0.4 | GO:0048791 | calcium ion-regulated exocytosis of neurotransmitter(GO:0048791) |
| 0.0 | 0.0 | GO:0010265 | SCF complex assembly(GO:0010265) |
| 0.0 | 1.2 | GO:1902476 | chloride transmembrane transport(GO:1902476) |
| 0.0 | 0.1 | GO:0045657 | positive regulation of monocyte differentiation(GO:0045657) |
| 0.0 | 0.1 | GO:0034315 | regulation of Arp2/3 complex-mediated actin nucleation(GO:0034315) |
| 0.0 | 0.4 | GO:0072348 | sulfur compound transport(GO:0072348) |
| 0.0 | 0.0 | GO:0061724 | lipophagy(GO:0061724) |
| 0.0 | 0.2 | GO:0098661 | inorganic anion transmembrane transport(GO:0098661) |
| 0.0 | 0.1 | GO:0090140 | regulation of mitochondrial fission(GO:0090140) |
| 0.0 | 0.0 | GO:0010070 | zygote asymmetric cell division(GO:0010070) |
| 0.0 | 0.0 | GO:0071028 | nuclear RNA surveillance(GO:0071027) nuclear mRNA surveillance(GO:0071028) |
| 0.0 | 0.0 | GO:0050861 | positive regulation of B cell receptor signaling pathway(GO:0050861) |
| 0.0 | 0.0 | GO:0046501 | protoporphyrinogen IX metabolic process(GO:0046501) |
| 0.0 | 0.0 | GO:1904640 | response to methionine(GO:1904640) |
| 0.0 | 0.1 | GO:0070535 | histone H2A K63-linked ubiquitination(GO:0070535) |
| 0.0 | 0.4 | GO:0001893 | maternal placenta development(GO:0001893) |
| 0.0 | 0.1 | GO:0050908 | detection of light stimulus involved in visual perception(GO:0050908) detection of light stimulus involved in sensory perception(GO:0050962) |
| 0.0 | 0.1 | GO:0009052 | pentose-phosphate shunt, non-oxidative branch(GO:0009052) |
| 0.0 | 0.1 | GO:0006983 | ER overload response(GO:0006983) |
| 0.0 | 0.0 | GO:0071603 | endothelial cell-cell adhesion(GO:0071603) |
| 0.0 | 0.1 | GO:0034380 | high-density lipoprotein particle assembly(GO:0034380) |
| 0.0 | 0.0 | GO:0002071 | glandular epithelial cell maturation(GO:0002071) |
| 0.0 | 0.0 | GO:2000564 | antigen processing and presentation of endogenous peptide antigen via MHC class Ib via ER pathway(GO:0002488) antigen processing and presentation of endogenous peptide antigen via MHC class Ib via ER pathway, TAP-dependent(GO:0002489) regulation of CD8-positive, alpha-beta T cell proliferation(GO:2000564) |
| 0.0 | 0.0 | GO:0071492 | cellular response to UV-A(GO:0071492) |
| 0.0 | 0.1 | GO:0032808 | lacrimal gland development(GO:0032808) |
| 0.0 | 0.1 | GO:2000346 | negative regulation of hepatocyte proliferation(GO:2000346) |
| 0.0 | 0.1 | GO:0046549 | retinal cone cell development(GO:0046549) |
| 0.0 | 0.0 | GO:1904953 | Wnt signaling pathway involved in midbrain dopaminergic neuron differentiation(GO:1904953) |
| 0.0 | 0.6 | GO:0006986 | response to unfolded protein(GO:0006986) |
| 0.0 | 0.1 | GO:0006451 | selenocysteine incorporation(GO:0001514) translational readthrough(GO:0006451) |
| 0.0 | 0.0 | GO:1903826 | arginine transmembrane transport(GO:1903826) |
| 0.0 | 0.0 | GO:0051684 | maintenance of Golgi location(GO:0051684) |
| 0.0 | 0.1 | GO:1901550 | regulation of endothelial cell development(GO:1901550) regulation of establishment of endothelial barrier(GO:1903140) |
| 0.0 | 0.0 | GO:0001180 | transcription initiation from RNA polymerase I promoter for nuclear large rRNA transcript(GO:0001180) |
| 0.0 | 0.1 | GO:0006968 | cellular defense response(GO:0006968) |
| 0.0 | 0.0 | GO:0044336 | canonical Wnt signaling pathway involved in negative regulation of apoptotic process(GO:0044336) |
| 0.0 | 0.0 | GO:0060468 | negative regulation of fertilization(GO:0060467) prevention of polyspermy(GO:0060468) |
| 0.0 | 0.1 | GO:1902857 | positive regulation of nonmotile primary cilium assembly(GO:1902857) |
| 0.0 | 0.0 | GO:0002397 | MHC class I protein complex assembly(GO:0002397) |
| 0.0 | 0.0 | GO:0045541 | negative regulation of cholesterol biosynthetic process(GO:0045541) negative regulation of cholesterol metabolic process(GO:0090206) |
| 0.0 | 0.1 | GO:0019919 | peptidyl-arginine methylation, to asymmetrical-dimethyl arginine(GO:0019919) |
| 0.0 | 0.1 | GO:0006741 | NADP biosynthetic process(GO:0006741) |
| 0.0 | 0.1 | GO:0006108 | malate metabolic process(GO:0006108) |
| 0.0 | 0.0 | GO:0007525 | somatic muscle development(GO:0007525) |
| 0.0 | 0.0 | GO:2001137 | positive regulation of endocytic recycling(GO:2001137) |
| 0.0 | 0.0 | GO:0006517 | protein deglycosylation(GO:0006517) |
| 0.0 | 0.1 | GO:0043306 | positive regulation of mast cell activation involved in immune response(GO:0033008) positive regulation of mast cell degranulation(GO:0043306) |
| 0.0 | 0.1 | GO:0016558 | protein import into peroxisome matrix(GO:0016558) |
| 0.0 | 0.0 | GO:0015781 | pyrimidine nucleotide-sugar transport(GO:0015781) |
| 0.0 | 0.1 | GO:0060770 | negative regulation of epithelial cell proliferation involved in prostate gland development(GO:0060770) |
| 0.0 | 0.6 | GO:0097581 | lamellipodium organization(GO:0097581) |
| 0.0 | 0.1 | GO:0045199 | maintenance of epithelial cell apical/basal polarity(GO:0045199) |
| 0.0 | 0.1 | GO:0035329 | hippo signaling(GO:0035329) |
| 0.0 | 0.1 | GO:0051694 | pointed-end actin filament capping(GO:0051694) |
| 0.0 | 0.0 | GO:0070673 | response to interleukin-18(GO:0070673) |
| 0.0 | 0.2 | GO:0006471 | protein ADP-ribosylation(GO:0006471) |
| 0.0 | 0.2 | GO:0042462 | eye photoreceptor cell development(GO:0042462) |
| 0.0 | 0.0 | GO:1990009 | retinal cell apoptotic process(GO:1990009) |
| 0.0 | 0.1 | GO:0055003 | cardiac myofibril assembly(GO:0055003) |
Gene overrepresentation in cellular component category:
| Log-likelihood per target | Total log-likelihood | Term | Description |
|---|---|---|---|
| 0.9 | 2.8 | GO:0071149 | TEAD-2-YAP complex(GO:0071149) |
| 0.8 | 2.5 | GO:0016533 | cyclin-dependent protein kinase 5 holoenzyme complex(GO:0016533) |
| 0.6 | 0.6 | GO:0044317 | rod spherule(GO:0044317) |
| 0.5 | 1.6 | GO:0097444 | spine apparatus(GO:0097444) |
| 0.5 | 1.4 | GO:0005592 | collagen type XI trimer(GO:0005592) |
| 0.4 | 1.3 | GO:0061673 | mitotic spindle astral microtubule(GO:0061673) |
| 0.4 | 0.8 | GO:0044316 | cone cell pedicle(GO:0044316) |
| 0.4 | 2.8 | GO:0098831 | presynaptic active zone cytoplasmic component(GO:0098831) |
| 0.3 | 0.3 | GO:0002945 | cyclin K-CDK13 complex(GO:0002945) |
| 0.3 | 0.9 | GO:0002944 | cyclin K-CDK12 complex(GO:0002944) |
| 0.3 | 1.2 | GO:0043259 | laminin-10 complex(GO:0043259) |
| 0.3 | 1.4 | GO:0030015 | CCR4-NOT core complex(GO:0030015) |
| 0.3 | 4.8 | GO:0031235 | intrinsic component of the cytoplasmic side of the plasma membrane(GO:0031235) |
| 0.3 | 0.8 | GO:0032937 | SREBP-SCAP-Insig complex(GO:0032937) |
| 0.3 | 0.8 | GO:0048269 | methionine adenosyltransferase complex(GO:0048269) |
| 0.3 | 1.0 | GO:0005588 | collagen type V trimer(GO:0005588) |
| 0.2 | 2.7 | GO:0032009 | early phagosome(GO:0032009) |
| 0.2 | 0.7 | GO:0031045 | dense core granule(GO:0031045) |
| 0.2 | 0.7 | GO:0000931 | gamma-tubulin large complex(GO:0000931) gamma-tubulin ring complex(GO:0008274) |
| 0.2 | 1.4 | GO:1990246 | uniplex complex(GO:1990246) |
| 0.2 | 0.7 | GO:0005760 | gamma DNA polymerase complex(GO:0005760) |
| 0.2 | 1.1 | GO:0043293 | apoptosome(GO:0043293) |
| 0.2 | 1.4 | GO:0000137 | Golgi cis cisterna(GO:0000137) |
| 0.2 | 1.8 | GO:0048787 | presynaptic active zone membrane(GO:0048787) |
| 0.2 | 1.6 | GO:0097443 | sorting endosome(GO:0097443) |
| 0.2 | 5.9 | GO:0060077 | inhibitory synapse(GO:0060077) |
| 0.2 | 0.6 | GO:0035838 | growing cell tip(GO:0035838) |
| 0.2 | 0.6 | GO:1990682 | CSF1-CSF1R complex(GO:1990682) |
| 0.2 | 0.6 | GO:1990589 | ATF4-CREB1 transcription factor complex(GO:1990589) |
| 0.2 | 0.6 | GO:0002193 | MAML1-RBP-Jkappa- ICN1 complex(GO:0002193) |
| 0.2 | 2.8 | GO:0017146 | NMDA selective glutamate receptor complex(GO:0017146) |
| 0.2 | 3.2 | GO:0048188 | Set1C/COMPASS complex(GO:0048188) |
| 0.2 | 1.5 | GO:0044327 | dendritic spine head(GO:0044327) |
| 0.2 | 6.7 | GO:0032590 | dendrite membrane(GO:0032590) |
| 0.2 | 0.9 | GO:0070695 | FHF complex(GO:0070695) |
| 0.2 | 0.5 | GO:0005594 | collagen type IX trimer(GO:0005594) |
| 0.2 | 5.0 | GO:0097440 | apical dendrite(GO:0097440) |
| 0.2 | 1.2 | GO:0036449 | microtubule minus-end(GO:0036449) |
| 0.2 | 1.7 | GO:0014731 | spectrin-associated cytoskeleton(GO:0014731) |
| 0.2 | 8.9 | GO:0060170 | ciliary membrane(GO:0060170) |
| 0.2 | 0.2 | GO:0098855 | HCN channel complex(GO:0098855) |
| 0.2 | 1.5 | GO:0005826 | actomyosin contractile ring(GO:0005826) |
| 0.2 | 1.1 | GO:0070937 | CRD-mediated mRNA stability complex(GO:0070937) |
| 0.2 | 2.4 | GO:0071565 | nBAF complex(GO:0071565) |
| 0.2 | 1.3 | GO:0097197 | tetraspanin-enriched microdomain(GO:0097197) |
| 0.2 | 0.5 | GO:0000839 | Hrd1p ubiquitin ligase ERAD-L complex(GO:0000839) |
| 0.2 | 1.6 | GO:0070775 | H3 histone acetyltransferase complex(GO:0070775) MOZ/MORF histone acetyltransferase complex(GO:0070776) |
| 0.2 | 0.6 | GO:0035363 | histone locus body(GO:0035363) |
| 0.1 | 1.2 | GO:0044615 | nuclear pore nuclear basket(GO:0044615) |
| 0.1 | 0.7 | GO:0035061 | interchromatin granule(GO:0035061) |
| 0.1 | 0.4 | GO:0098592 | cytoplasmic side of apical plasma membrane(GO:0098592) |
| 0.1 | 0.7 | GO:0044530 | supraspliceosomal complex(GO:0044530) |
| 0.1 | 0.7 | GO:0035976 | AP1 complex(GO:0035976) |
| 0.1 | 0.7 | GO:0035867 | alphav-beta3 integrin-IGF-1-IGF1R complex(GO:0035867) |
| 0.1 | 1.8 | GO:0000124 | SAGA complex(GO:0000124) |
| 0.1 | 0.3 | GO:0001739 | sex chromatin(GO:0001739) |
| 0.1 | 0.5 | GO:0098888 | extrinsic component of presynaptic membrane(GO:0098888) |
| 0.1 | 0.3 | GO:0044302 | dentate gyrus mossy fiber(GO:0044302) |
| 0.1 | 0.5 | GO:0070876 | SOSS complex(GO:0070876) |
| 0.1 | 2.2 | GO:0031011 | Ino80 complex(GO:0031011) DNA helicase complex(GO:0033202) |
| 0.1 | 1.2 | GO:0044294 | dendritic growth cone(GO:0044294) |
| 0.1 | 3.1 | GO:0008074 | guanylate cyclase complex, soluble(GO:0008074) |
| 0.1 | 3.4 | GO:0032839 | dendrite cytoplasm(GO:0032839) |
| 0.1 | 0.6 | GO:0030896 | checkpoint clamp complex(GO:0030896) |
| 0.1 | 0.5 | GO:0070022 | transforming growth factor beta receptor homodimeric complex(GO:0070022) |
| 0.1 | 0.5 | GO:0097025 | MPP7-DLG1-LIN7 complex(GO:0097025) |
| 0.1 | 1.9 | GO:0032045 | guanyl-nucleotide exchange factor complex(GO:0032045) |
| 0.1 | 1.1 | GO:0005952 | cAMP-dependent protein kinase complex(GO:0005952) |
| 0.1 | 0.8 | GO:0090571 | RNA polymerase II transcription repressor complex(GO:0090571) |
| 0.1 | 0.5 | GO:0097427 | microtubule bundle(GO:0097427) |
| 0.1 | 1.6 | GO:0016442 | RISC complex(GO:0016442) RNAi effector complex(GO:0031332) |
| 0.1 | 0.2 | GO:0071564 | npBAF complex(GO:0071564) |
| 0.1 | 0.8 | GO:0030981 | cortical microtubule cytoskeleton(GO:0030981) |
| 0.1 | 0.1 | GO:0005593 | FACIT collagen trimer(GO:0005593) |
| 0.1 | 0.8 | GO:0000243 | commitment complex(GO:0000243) |
| 0.1 | 1.6 | GO:0005847 | mRNA cleavage and polyadenylation specificity factor complex(GO:0005847) |
| 0.1 | 1.4 | GO:0046581 | intercellular canaliculus(GO:0046581) |
| 0.1 | 0.1 | GO:0098830 | presynaptic endosome(GO:0098830) |
| 0.1 | 0.5 | GO:0098643 | fibrillar collagen trimer(GO:0005583) banded collagen fibril(GO:0098643) |
| 0.1 | 0.4 | GO:0032044 | DSIF complex(GO:0032044) |
| 0.1 | 0.7 | GO:0097136 | Bcl-2 family protein complex(GO:0097136) |
| 0.1 | 0.8 | GO:0016600 | flotillin complex(GO:0016600) |
| 0.1 | 0.7 | GO:0016593 | Cdc73/Paf1 complex(GO:0016593) |
| 0.1 | 0.5 | GO:0044300 | cerebellar mossy fiber(GO:0044300) |
| 0.1 | 0.9 | GO:0033256 | I-kappaB/NF-kappaB complex(GO:0033256) |
| 0.1 | 2.4 | GO:0000145 | exocyst(GO:0000145) |
| 0.1 | 0.9 | GO:0071821 | FANCM-MHF complex(GO:0071821) |
| 0.1 | 2.3 | GO:0043194 | axon initial segment(GO:0043194) |
| 0.1 | 2.6 | GO:0000159 | protein phosphatase type 2A complex(GO:0000159) |
| 0.1 | 0.1 | GO:0044614 | nuclear pore cytoplasmic filaments(GO:0044614) |
| 0.1 | 0.3 | GO:0014701 | junctional sarcoplasmic reticulum membrane(GO:0014701) |
| 0.1 | 0.5 | GO:0090661 | box H/ACA telomerase RNP complex(GO:0090661) |
| 0.1 | 1.4 | GO:0035102 | PRC1 complex(GO:0035102) |
| 0.1 | 0.6 | GO:0071203 | WASH complex(GO:0071203) |
| 0.1 | 0.3 | GO:0035253 | ciliary rootlet(GO:0035253) |
| 0.1 | 0.5 | GO:0072534 | perineuronal net(GO:0072534) |
| 0.1 | 0.5 | GO:0030289 | protein phosphatase 4 complex(GO:0030289) |
| 0.1 | 0.9 | GO:0032300 | mismatch repair complex(GO:0032300) |
| 0.1 | 0.3 | GO:0030690 | Noc1p-Noc2p complex(GO:0030690) |
| 0.1 | 3.8 | GO:0016235 | aggresome(GO:0016235) |
| 0.1 | 0.3 | GO:0097513 | myosin II filament(GO:0097513) |
| 0.1 | 0.6 | GO:0005862 | muscle thin filament tropomyosin(GO:0005862) |
| 0.1 | 0.7 | GO:0005658 | alpha DNA polymerase:primase complex(GO:0005658) |
| 0.1 | 0.8 | GO:0000813 | ESCRT I complex(GO:0000813) |
| 0.1 | 0.6 | GO:0000127 | transcription factor TFIIIC complex(GO:0000127) |
| 0.1 | 0.3 | GO:0005960 | glycine cleavage complex(GO:0005960) |
| 0.1 | 0.5 | GO:0032444 | activin responsive factor complex(GO:0032444) |
| 0.1 | 0.3 | GO:0033503 | HULC complex(GO:0033503) |
| 0.1 | 0.5 | GO:0002142 | stereocilia ankle link complex(GO:0002142) |
| 0.1 | 1.0 | GO:0044224 | juxtaparanode region of axon(GO:0044224) |
| 0.1 | 0.6 | GO:0032279 | asymmetric synapse(GO:0032279) |
| 0.1 | 0.2 | GO:0034750 | Scrib-APC-beta-catenin complex(GO:0034750) |
| 0.1 | 0.1 | GO:0044326 | dendritic spine neck(GO:0044326) |
| 0.1 | 0.2 | GO:0030877 | beta-catenin destruction complex(GO:0030877) |
| 0.1 | 0.2 | GO:0033165 | interphotoreceptor matrix(GO:0033165) |
| 0.1 | 0.6 | GO:0031931 | TORC1 complex(GO:0031931) |
| 0.1 | 0.1 | GO:1990257 | piccolo-bassoon transport vesicle(GO:1990257) |
| 0.1 | 2.9 | GO:0005891 | voltage-gated calcium channel complex(GO:0005891) |
| 0.1 | 0.2 | GO:0005943 | phosphatidylinositol 3-kinase complex, class IA(GO:0005943) |
| 0.1 | 0.4 | GO:1990316 | ATG1/ULK1 kinase complex(GO:1990316) |
| 0.1 | 0.3 | GO:0031264 | death-inducing signaling complex(GO:0031264) |
| 0.1 | 0.7 | GO:0031080 | nuclear pore outer ring(GO:0031080) |
| 0.1 | 0.4 | GO:0030485 | smooth muscle contractile fiber(GO:0030485) |
| 0.1 | 0.6 | GO:0044666 | MLL3/4 complex(GO:0044666) |
| 0.1 | 0.4 | GO:0031315 | extrinsic component of mitochondrial outer membrane(GO:0031315) |
| 0.1 | 0.4 | GO:0016012 | sarcoglycan complex(GO:0016012) |
| 0.1 | 1.5 | GO:0030056 | hemidesmosome(GO:0030056) |
| 0.1 | 0.9 | GO:0097449 | astrocyte projection(GO:0097449) |
| 0.1 | 0.2 | GO:0031074 | nucleocytoplasmic shuttling complex(GO:0031074) |
| 0.1 | 0.2 | GO:1990851 | Wnt-Frizzled-LRP5/6 complex(GO:1990851) |
| 0.1 | 0.9 | GO:0030127 | COPII vesicle coat(GO:0030127) |
| 0.1 | 5.2 | GO:0017053 | transcriptional repressor complex(GO:0017053) |
| 0.1 | 2.0 | GO:0035869 | ciliary transition zone(GO:0035869) |
| 0.1 | 0.3 | GO:0042405 | nuclear inclusion body(GO:0042405) |
| 0.1 | 0.3 | GO:0044308 | axonal spine(GO:0044308) |
| 0.1 | 1.2 | GO:0005892 | acetylcholine-gated channel complex(GO:0005892) |
| 0.1 | 0.7 | GO:0031258 | lamellipodium membrane(GO:0031258) |
| 0.1 | 0.5 | GO:0034464 | BBSome(GO:0034464) |
| 0.1 | 2.0 | GO:0031941 | filamentous actin(GO:0031941) |
| 0.1 | 1.4 | GO:0005721 | pericentric heterochromatin(GO:0005721) |
| 0.1 | 0.2 | GO:0042585 | germinal vesicle(GO:0042585) |
| 0.1 | 0.4 | GO:0070847 | core mediator complex(GO:0070847) |
| 0.1 | 0.2 | GO:0097165 | nuclear stress granule(GO:0097165) |
| 0.1 | 1.1 | GO:0042734 | presynaptic membrane(GO:0042734) |
| 0.1 | 0.2 | GO:0033647 | host intracellular organelle(GO:0033647) host intracellular membrane-bounded organelle(GO:0033648) |
| 0.1 | 0.8 | GO:0016010 | dystrophin-associated glycoprotein complex(GO:0016010) glycoprotein complex(GO:0090665) |
| 0.1 | 0.3 | GO:0032059 | bleb(GO:0032059) |
| 0.1 | 0.2 | GO:0030478 | actin cap(GO:0030478) |
| 0.1 | 0.2 | GO:0000811 | GINS complex(GO:0000811) |
| 0.1 | 0.5 | GO:0070461 | SAGA-type complex(GO:0070461) |
| 0.1 | 0.2 | GO:0043511 | inhibin complex(GO:0043511) |
| 0.1 | 0.2 | GO:0043203 | axon hillock(GO:0043203) |
| 0.1 | 0.2 | GO:1990812 | growth cone filopodium(GO:1990812) |
| 0.1 | 0.7 | GO:0012507 | ER to Golgi transport vesicle membrane(GO:0012507) |
| 0.1 | 0.4 | GO:0001940 | male pronucleus(GO:0001940) |
| 0.1 | 0.4 | GO:0031314 | extrinsic component of mitochondrial inner membrane(GO:0031314) |
| 0.1 | 0.3 | GO:0097598 | sperm cytoplasmic droplet(GO:0097598) |
| 0.1 | 0.1 | GO:0044307 | dendritic branch(GO:0044307) |
| 0.1 | 0.2 | GO:0098837 | postsynaptic recycling endosome(GO:0098837) |
| 0.1 | 0.4 | GO:0005915 | zonula adherens(GO:0005915) |
| 0.1 | 0.2 | GO:0008091 | spectrin(GO:0008091) |
| 0.1 | 0.2 | GO:0042571 | immunoglobulin complex, circulating(GO:0042571) |
| 0.1 | 1.7 | GO:0035861 | site of double-strand break(GO:0035861) |
| 0.1 | 0.2 | GO:0042567 | insulin-like growth factor ternary complex(GO:0042567) |
| 0.1 | 0.3 | GO:0043527 | tRNA methyltransferase complex(GO:0043527) |
| 0.1 | 0.4 | GO:0030314 | junctional membrane complex(GO:0030314) |
| 0.1 | 0.1 | GO:0070044 | synaptobrevin 2-SNAP-25-syntaxin-1a complex(GO:0070044) |
| 0.1 | 0.4 | GO:0042382 | paraspeckles(GO:0042382) |
| 0.1 | 0.2 | GO:0000444 | MIS12/MIND type complex(GO:0000444) |
| 0.0 | 0.2 | GO:1990130 | Iml1 complex(GO:1990130) |
| 0.0 | 0.2 | GO:0016939 | kinesin II complex(GO:0016939) |
| 0.0 | 0.2 | GO:0070522 | ERCC4-ERCC1 complex(GO:0070522) |
| 0.0 | 1.9 | GO:0043198 | dendritic shaft(GO:0043198) |
| 0.0 | 2.1 | GO:0046658 | anchored component of plasma membrane(GO:0046658) |
| 0.0 | 0.1 | GO:0035101 | FACT complex(GO:0035101) |
| 0.0 | 1.8 | GO:0035097 | histone methyltransferase complex(GO:0035097) |
| 0.0 | 0.3 | GO:0033093 | Weibel-Palade body(GO:0033093) |
| 0.0 | 0.2 | GO:0032584 | growth cone membrane(GO:0032584) |
| 0.0 | 1.4 | GO:0031594 | neuromuscular junction(GO:0031594) |
| 0.0 | 0.4 | GO:0005638 | lamin filament(GO:0005638) |
| 0.0 | 0.3 | GO:1990635 | proximal dendrite(GO:1990635) |
| 0.0 | 0.5 | GO:0070652 | HAUS complex(GO:0070652) |
| 0.0 | 0.3 | GO:0071598 | neuronal ribonucleoprotein granule(GO:0071598) |
| 0.0 | 0.4 | GO:0036056 | filtration diaphragm(GO:0036056) slit diaphragm(GO:0036057) |
| 0.0 | 0.2 | GO:0048476 | Holliday junction resolvase complex(GO:0048476) |
| 0.0 | 0.1 | GO:0005899 | insulin receptor complex(GO:0005899) |
| 0.0 | 0.7 | GO:0005671 | Ada2/Gcn5/Ada3 transcription activator complex(GO:0005671) |
| 0.0 | 0.1 | GO:1990796 | photoreceptor cell terminal bouton(GO:1990796) |
| 0.0 | 1.6 | GO:0002102 | podosome(GO:0002102) |
| 0.0 | 0.7 | GO:0043196 | varicosity(GO:0043196) |
| 0.0 | 0.1 | GO:0000923 | equatorial microtubule organizing center(GO:0000923) |
| 0.0 | 3.5 | GO:0042641 | actomyosin(GO:0042641) |
| 0.0 | 0.1 | GO:0071148 | TEAD-1-YAP complex(GO:0071148) |
| 0.0 | 1.2 | GO:0042629 | mast cell granule(GO:0042629) |
| 0.0 | 2.1 | GO:0005871 | kinesin complex(GO:0005871) |
| 0.0 | 0.1 | GO:0072487 | MSL complex(GO:0072487) |
| 0.0 | 5.6 | GO:0030027 | lamellipodium(GO:0030027) |
| 0.0 | 0.3 | GO:0034098 | VCP-NPL4-UFD1 AAA ATPase complex(GO:0034098) |
| 0.0 | 0.2 | GO:0005958 | DNA-dependent protein kinase-DNA ligase 4 complex(GO:0005958) |
| 0.0 | 0.5 | GO:0001741 | XY body(GO:0001741) |
| 0.0 | 0.3 | GO:0030991 | intraciliary transport particle A(GO:0030991) |
| 0.0 | 0.2 | GO:0070436 | Grb2-EGFR complex(GO:0070436) |
| 0.0 | 0.2 | GO:1990909 | Wnt signalosome(GO:1990909) |
| 0.0 | 0.1 | GO:1990423 | RZZ complex(GO:1990423) |
| 0.0 | 0.5 | GO:0030014 | CCR4-NOT complex(GO:0030014) |
| 0.0 | 0.9 | GO:0032589 | neuron projection membrane(GO:0032589) |
| 0.0 | 0.1 | GO:0044611 | nuclear pore inner ring(GO:0044611) |
| 0.0 | 0.6 | GO:0001673 | male germ cell nucleus(GO:0001673) |
| 0.0 | 0.7 | GO:0005942 | phosphatidylinositol 3-kinase complex(GO:0005942) |
| 0.0 | 0.9 | GO:0048786 | presynaptic active zone(GO:0048786) |
| 0.0 | 0.4 | GO:0005796 | Golgi lumen(GO:0005796) |
| 0.0 | 0.9 | GO:0055038 | recycling endosome membrane(GO:0055038) |
| 0.0 | 0.2 | GO:0008024 | cyclin/CDK positive transcription elongation factor complex(GO:0008024) |
| 0.0 | 0.1 | GO:0034657 | GID complex(GO:0034657) |
| 0.0 | 0.2 | GO:0038201 | TOR complex(GO:0038201) |
| 0.0 | 0.4 | GO:0031588 | nucleotide-activated protein kinase complex(GO:0031588) |
| 0.0 | 0.2 | GO:0031436 | BRCA1-BARD1 complex(GO:0031436) |
| 0.0 | 0.1 | GO:0065010 | extracellular membrane-bounded organelle(GO:0065010) |
| 0.0 | 0.0 | GO:0005642 | annulate lamellae(GO:0005642) |
| 0.0 | 0.2 | GO:0044194 | cytolytic granule(GO:0044194) |
| 0.0 | 0.3 | GO:1990124 | messenger ribonucleoprotein complex(GO:1990124) |
| 0.0 | 0.1 | GO:0000938 | GARP complex(GO:0000938) |
| 0.0 | 0.4 | GO:0036513 | Derlin-1 retrotranslocation complex(GO:0036513) |
| 0.0 | 1.3 | GO:0010494 | cytoplasmic stress granule(GO:0010494) |
| 0.0 | 0.3 | GO:0072669 | tRNA-splicing ligase complex(GO:0072669) |
| 0.0 | 7.2 | GO:0060076 | excitatory synapse(GO:0060076) |
| 0.0 | 0.1 | GO:0031233 | intrinsic component of external side of plasma membrane(GO:0031233) |
| 0.0 | 0.2 | GO:0030430 | host cell cytoplasm(GO:0030430) host cell cytoplasm part(GO:0033655) |
| 0.0 | 0.2 | GO:0000220 | vacuolar proton-transporting V-type ATPase, V0 domain(GO:0000220) |
| 0.0 | 0.0 | GO:0097124 | cyclin A2-CDK2 complex(GO:0097124) |
| 0.0 | 0.2 | GO:0045252 | oxoglutarate dehydrogenase complex(GO:0045252) |
| 0.0 | 0.1 | GO:0043190 | ATP-binding cassette (ABC) transporter complex(GO:0043190) |
| 0.0 | 0.4 | GO:0000242 | pericentriolar material(GO:0000242) |
| 0.0 | 0.1 | GO:0016342 | catenin complex(GO:0016342) |
| 0.0 | 0.3 | GO:0044232 | organelle membrane contact site(GO:0044232) |
| 0.0 | 0.4 | GO:0043205 | microfibril(GO:0001527) fibril(GO:0043205) |
| 0.0 | 0.1 | GO:0090576 | RNA polymerase III transcription factor complex(GO:0090576) |
| 0.0 | 0.1 | GO:0005896 | interleukin-6 receptor complex(GO:0005896) |
| 0.0 | 0.1 | GO:0005745 | m-AAA complex(GO:0005745) |
| 0.0 | 0.2 | GO:0036396 | MIS complex(GO:0036396) |
| 0.0 | 0.1 | GO:0055087 | Ski complex(GO:0055087) |
| 0.0 | 0.1 | GO:0044354 | pinosome(GO:0044352) macropinosome(GO:0044354) |
| 0.0 | 0.2 | GO:0042824 | MHC class I peptide loading complex(GO:0042824) |
| 0.0 | 0.3 | GO:0032426 | stereocilium tip(GO:0032426) |
| 0.0 | 0.7 | GO:0000788 | nuclear nucleosome(GO:0000788) |
| 0.0 | 2.4 | GO:0030658 | transport vesicle membrane(GO:0030658) |
| 0.0 | 0.5 | GO:0035371 | microtubule plus-end(GO:0035371) |
| 0.0 | 0.4 | GO:0008278 | cohesin complex(GO:0008278) |
| 0.0 | 0.2 | GO:0000138 | Golgi trans cisterna(GO:0000138) |
| 0.0 | 0.1 | GO:0097422 | tubular endosome(GO:0097422) |
| 0.0 | 0.7 | GO:0008023 | transcription elongation factor complex(GO:0008023) |
| 0.0 | 1.4 | GO:0034707 | chloride channel complex(GO:0034707) |
| 0.0 | 0.3 | GO:0070187 | telosome(GO:0070187) |
| 0.0 | 0.1 | GO:1990604 | IRE1-TRAF2-ASK1 complex(GO:1990604) |
| 0.0 | 0.3 | GO:0032541 | cortical endoplasmic reticulum(GO:0032541) |
| 0.0 | 0.1 | GO:0005846 | nuclear cap binding complex(GO:0005846) |
| 0.0 | 0.1 | GO:0005672 | transcription factor TFIIA complex(GO:0005672) |
| 0.0 | 0.0 | GO:0031680 | G-protein beta/gamma-subunit complex(GO:0031680) |
| 0.0 | 0.4 | GO:0005640 | nuclear outer membrane(GO:0005640) |
| 0.0 | 0.1 | GO:0000172 | ribonuclease MRP complex(GO:0000172) |
| 0.0 | 1.4 | GO:0030118 | clathrin coat(GO:0030118) |
| 0.0 | 0.1 | GO:0031092 | platelet alpha granule membrane(GO:0031092) |
| 0.0 | 7.9 | GO:0005578 | proteinaceous extracellular matrix(GO:0005578) |
| 0.0 | 0.7 | GO:0005801 | cis-Golgi network(GO:0005801) |
| 0.0 | 0.3 | GO:0034663 | endoplasmic reticulum chaperone complex(GO:0034663) |
| 0.0 | 0.2 | GO:0060091 | kinocilium(GO:0060091) |
| 0.0 | 0.1 | GO:0016222 | procollagen-proline 4-dioxygenase complex(GO:0016222) |
| 0.0 | 0.3 | GO:0043202 | lysosomal lumen(GO:0043202) |
| 0.0 | 0.3 | GO:0000177 | cytoplasmic exosome (RNase complex)(GO:0000177) |
| 0.0 | 0.1 | GO:1990005 | granular vesicle(GO:1990005) |
| 0.0 | 0.4 | GO:0032039 | integrator complex(GO:0032039) |
| 0.0 | 0.0 | GO:1990075 | periciliary membrane compartment(GO:1990075) |
| 0.0 | 0.3 | GO:0071010 | prespliceosome(GO:0071010) |
| 0.0 | 0.6 | GO:0031201 | SNARE complex(GO:0031201) |
| 0.0 | 0.1 | GO:0031309 | intrinsic component of nuclear outer membrane(GO:0031308) integral component of nuclear outer membrane(GO:0031309) |
| 0.0 | 0.2 | GO:0030119 | AP-type membrane coat adaptor complex(GO:0030119) |
| 0.0 | 0.1 | GO:0031261 | DNA replication preinitiation complex(GO:0031261) |
| 0.0 | 0.4 | GO:0008250 | oligosaccharyltransferase complex(GO:0008250) |
| 0.0 | 0.8 | GO:0005581 | collagen trimer(GO:0005581) |
| 0.0 | 0.1 | GO:0033263 | CORVET complex(GO:0033263) |
| 0.0 | 0.0 | GO:0005818 | astral microtubule(GO:0000235) aster(GO:0005818) |
| 0.0 | 0.3 | GO:0030061 | mitochondrial crista(GO:0030061) |
| 0.0 | 1.0 | GO:0031256 | leading edge membrane(GO:0031256) |
| 0.0 | 0.0 | GO:0000836 | ER ubiquitin ligase complex(GO:0000835) Hrd1p ubiquitin ligase complex(GO:0000836) |
| 0.0 | 0.0 | GO:0033596 | TSC1-TSC2 complex(GO:0033596) |
| 0.0 | 0.6 | GO:0008180 | COP9 signalosome(GO:0008180) |
| 0.0 | 0.1 | GO:0017071 | intracellular cyclic nucleotide activated cation channel complex(GO:0017071) |
| 0.0 | 0.1 | GO:1990393 | 3M complex(GO:1990393) |
| 0.0 | 0.1 | GO:0031429 | box H/ACA snoRNP complex(GO:0031429) box H/ACA RNP complex(GO:0072588) |
| 0.0 | 0.4 | GO:0005697 | telomerase holoenzyme complex(GO:0005697) |
| 0.0 | 0.2 | GO:0017119 | Golgi transport complex(GO:0017119) |
| 0.0 | 0.7 | GO:0005643 | nuclear pore(GO:0005643) |
| 0.0 | 0.3 | GO:0005639 | integral component of nuclear inner membrane(GO:0005639) intrinsic component of nuclear inner membrane(GO:0031229) |
| 0.0 | 1.3 | GO:0031985 | Golgi cisterna(GO:0031985) |
| 0.0 | 0.1 | GO:0000120 | RNA polymerase I transcription factor complex(GO:0000120) |
| 0.0 | 0.1 | GO:0000796 | condensin complex(GO:0000796) |
| 0.0 | 0.7 | GO:0005834 | heterotrimeric G-protein complex(GO:0005834) |
| 0.0 | 0.2 | GO:0030688 | preribosome, small subunit precursor(GO:0030688) |
| 0.0 | 0.1 | GO:0035985 | senescence-associated heterochromatin focus(GO:0035985) |
| 0.0 | 2.4 | GO:0005802 | trans-Golgi network(GO:0005802) |
| 0.0 | 0.1 | GO:0031313 | extrinsic component of endosome membrane(GO:0031313) |
| 0.0 | 0.1 | GO:0033063 | Rad51B-Rad51C-Rad51D-XRCC2 complex(GO:0033063) |
| 0.0 | 1.3 | GO:0070382 | exocytic vesicle(GO:0070382) |
| 0.0 | 0.1 | GO:0005964 | phosphorylase kinase complex(GO:0005964) |
| 0.0 | 0.1 | GO:0071008 | U2-type post-mRNA release spliceosomal complex(GO:0071008) |
| 0.0 | 0.0 | GO:0070939 | Dsl1p complex(GO:0070939) |
| 0.0 | 0.6 | GO:0000123 | histone acetyltransferase complex(GO:0000123) |
| 0.0 | 1.6 | GO:0009898 | cytoplasmic side of plasma membrane(GO:0009898) |
| 0.0 | 0.1 | GO:0005766 | primary lysosome(GO:0005766) azurophil granule(GO:0042582) |
| 0.0 | 0.5 | GO:0045211 | postsynaptic membrane(GO:0045211) |
| 0.0 | 0.0 | GO:0097386 | glial cell projection(GO:0097386) |
| 0.0 | 0.0 | GO:0009328 | phenylalanine-tRNA ligase complex(GO:0009328) |
| 0.0 | 1.1 | GO:0019005 | SCF ubiquitin ligase complex(GO:0019005) |
| 0.0 | 0.4 | GO:0030136 | clathrin-coated vesicle(GO:0030136) |
| 0.0 | 0.1 | GO:0005968 | Rab-protein geranylgeranyltransferase complex(GO:0005968) |
| 0.0 | 0.1 | GO:0001891 | phagocytic cup(GO:0001891) |
| 0.0 | 0.1 | GO:0005845 | mRNA cap binding complex(GO:0005845) RNA cap binding complex(GO:0034518) |
| 0.0 | 0.1 | GO:0000942 | condensed nuclear chromosome outer kinetochore(GO:0000942) |
| 0.0 | 0.1 | GO:0072687 | meiotic spindle(GO:0072687) |
| 0.0 | 0.1 | GO:1990712 | HFE-transferrin receptor complex(GO:1990712) |
| 0.0 | 2.0 | GO:0042579 | peroxisome(GO:0005777) microbody(GO:0042579) |
| 0.0 | 0.0 | GO:0005849 | mRNA cleavage factor complex(GO:0005849) |
| 0.0 | 0.0 | GO:0033643 | host cell part(GO:0033643) |
| 0.0 | 0.1 | GO:0045254 | pyruvate dehydrogenase complex(GO:0045254) |
| 0.0 | 0.1 | GO:0000439 | core TFIIH complex(GO:0000439) |
| 0.0 | 0.1 | GO:0000176 | nuclear exosome (RNase complex)(GO:0000176) |
| 0.0 | 0.1 | GO:0005684 | U2-type spliceosomal complex(GO:0005684) |
| 0.0 | 0.1 | GO:0000408 | EKC/KEOPS complex(GO:0000408) |
| 0.0 | 0.1 | GO:0034388 | Pwp2p-containing subcomplex of 90S preribosome(GO:0034388) |
| 0.0 | 0.0 | GO:0031088 | platelet dense granule membrane(GO:0031088) |
| 0.0 | 0.0 | GO:0097232 | lamellar body membrane(GO:0097232) alveolar lamellar body membrane(GO:0097233) |
| 0.0 | 0.0 | GO:1990826 | nucleoplasmic periphery of the nuclear pore complex(GO:1990826) |
| 0.0 | 0.7 | GO:0016605 | PML body(GO:0016605) |
| 0.0 | 0.1 | GO:0097524 | sperm plasma membrane(GO:0097524) |
Gene overrepresentation in molecular function category:
| Log-likelihood per target | Total log-likelihood | Term | Description |
|---|---|---|---|
| 1.7 | 11.8 | GO:0030160 | GKAP/Homer scaffold activity(GO:0030160) |
| 0.9 | 2.6 | GO:0031826 | type 2A serotonin receptor binding(GO:0031826) |
| 0.8 | 2.4 | GO:1902379 | chemoattractant activity involved in axon guidance(GO:1902379) |
| 0.7 | 2.0 | GO:0016309 | 1-phosphatidylinositol-5-phosphate 4-kinase activity(GO:0016309) |
| 0.6 | 4.8 | GO:0035033 | histone deacetylase regulator activity(GO:0035033) |
| 0.6 | 3.5 | GO:0086059 | voltage-gated calcium channel activity involved SA node cell action potential(GO:0086059) |
| 0.5 | 2.0 | GO:0001225 | RNA polymerase II transcription coactivator binding(GO:0001225) |
| 0.5 | 3.0 | GO:0008294 | calcium- and calmodulin-responsive adenylate cyclase activity(GO:0008294) |
| 0.5 | 1.5 | GO:0035939 | microsatellite binding(GO:0035939) |
| 0.5 | 1.9 | GO:0070644 | vitamin D response element binding(GO:0070644) |
| 0.5 | 1.4 | GO:0015292 | uniporter activity(GO:0015292) |
| 0.4 | 1.2 | GO:0004832 | valine-tRNA ligase activity(GO:0004832) |
| 0.4 | 3.2 | GO:0005007 | fibroblast growth factor-activated receptor activity(GO:0005007) |
| 0.4 | 1.2 | GO:0008332 | low voltage-gated calcium channel activity(GO:0008332) |
| 0.4 | 1.1 | GO:0060002 | plus-end directed microfilament motor activity(GO:0060002) |
| 0.3 | 0.7 | GO:0004999 | vasoactive intestinal polypeptide receptor activity(GO:0004999) |
| 0.3 | 1.0 | GO:0031249 | denatured protein binding(GO:0031249) |
| 0.3 | 1.0 | GO:0004359 | glutaminase activity(GO:0004359) |
| 0.3 | 1.3 | GO:0000822 | inositol hexakisphosphate binding(GO:0000822) |
| 0.3 | 2.7 | GO:0071253 | connexin binding(GO:0071253) |
| 0.3 | 1.0 | GO:0035403 | histone kinase activity (H3-T6 specific)(GO:0035403) |
| 0.3 | 1.8 | GO:0047696 | beta-adrenergic receptor kinase activity(GO:0047696) |
| 0.3 | 0.9 | GO:0004605 | phosphatidate cytidylyltransferase activity(GO:0004605) |
| 0.3 | 1.1 | GO:0031821 | G-protein coupled serotonin receptor binding(GO:0031821) |
| 0.3 | 3.1 | GO:0030306 | ADP-ribosylation factor binding(GO:0030306) |
| 0.3 | 2.0 | GO:0005173 | stem cell factor receptor binding(GO:0005173) |
| 0.3 | 0.8 | GO:0004478 | methionine adenosyltransferase activity(GO:0004478) |
| 0.3 | 1.1 | GO:0015056 | corticotrophin-releasing factor receptor activity(GO:0015056) corticotropin-releasing hormone receptor activity(GO:0043404) |
| 0.3 | 3.7 | GO:0017154 | semaphorin receptor activity(GO:0017154) |
| 0.2 | 2.9 | GO:0015379 | potassium:chloride symporter activity(GO:0015379) potassium ion symporter activity(GO:0022820) |
| 0.2 | 0.7 | GO:0042799 | histone methyltransferase activity (H4-K20 specific)(GO:0042799) |
| 0.2 | 1.2 | GO:0038132 | neuregulin binding(GO:0038132) |
| 0.2 | 0.7 | GO:0001069 | regulatory region RNA binding(GO:0001069) |
| 0.2 | 0.9 | GO:0008597 | calcium-dependent protein serine/threonine phosphatase regulator activity(GO:0008597) |
| 0.2 | 0.9 | GO:0019136 | deoxynucleoside kinase activity(GO:0019136) |
| 0.2 | 0.9 | GO:0044729 | hemi-methylated DNA-binding(GO:0044729) |
| 0.2 | 0.7 | GO:0008396 | oxysterol 7-alpha-hydroxylase activity(GO:0008396) |
| 0.2 | 0.7 | GO:0061628 | H3K27me3 modified histone binding(GO:0061628) |
| 0.2 | 0.7 | GO:0016316 | phosphatidylinositol-3,4-bisphosphate 4-phosphatase activity(GO:0016316) |
| 0.2 | 0.9 | GO:0015272 | ATP-activated inward rectifier potassium channel activity(GO:0015272) |
| 0.2 | 0.9 | GO:0016715 | oxidoreductase activity, acting on paired donors, with incorporation or reduction of molecular oxygen, reduced ascorbate as one donor, and incorporation of one atom of oxygen(GO:0016715) |
| 0.2 | 0.9 | GO:0070579 | methylcytosine dioxygenase activity(GO:0070579) |
| 0.2 | 0.6 | GO:0004937 | alpha1-adrenergic receptor activity(GO:0004937) |
| 0.2 | 0.2 | GO:0034452 | dynactin binding(GO:0034452) |
| 0.2 | 1.4 | GO:0022851 | GABA-gated chloride ion channel activity(GO:0022851) |
| 0.2 | 1.0 | GO:0046976 | histone methyltransferase activity (H3-K27 specific)(GO:0046976) |
| 0.2 | 0.6 | GO:0005119 | smoothened binding(GO:0005119) |
| 0.2 | 0.2 | GO:0035650 | AP-1 adaptor complex binding(GO:0035650) |
| 0.2 | 1.0 | GO:1990829 | C-rich single-stranded DNA binding(GO:1990829) |
| 0.2 | 2.7 | GO:0042043 | neurexin family protein binding(GO:0042043) |
| 0.2 | 0.6 | GO:0005157 | macrophage colony-stimulating factor receptor binding(GO:0005157) |
| 0.2 | 1.5 | GO:0035374 | chondroitin sulfate binding(GO:0035374) |
| 0.2 | 1.0 | GO:0008093 | cytoskeletal adaptor activity(GO:0008093) |
| 0.2 | 0.6 | GO:0008427 | calcium-dependent protein kinase inhibitor activity(GO:0008427) calcium-dependent protein kinase regulator activity(GO:0010858) |
| 0.2 | 0.8 | GO:0019237 | centromeric DNA binding(GO:0019237) |
| 0.2 | 1.1 | GO:0005332 | gamma-aminobutyric acid:sodium symporter activity(GO:0005332) |
| 0.2 | 0.6 | GO:0004939 | beta-adrenergic receptor activity(GO:0004939) |
| 0.2 | 0.6 | GO:0004924 | oncostatin-M receptor activity(GO:0004924) |
| 0.2 | 7.0 | GO:0046875 | ephrin receptor binding(GO:0046875) |
| 0.2 | 2.2 | GO:0004708 | MAP kinase kinase activity(GO:0004708) |
| 0.2 | 2.9 | GO:0032794 | GTPase activating protein binding(GO:0032794) |
| 0.2 | 0.9 | GO:0051032 | nucleic acid transmembrane transporter activity(GO:0051032) RNA transmembrane transporter activity(GO:0051033) |
| 0.2 | 0.4 | GO:0070878 | primary miRNA binding(GO:0070878) |
| 0.2 | 0.5 | GO:0035651 | AP-3 adaptor complex binding(GO:0035651) |
| 0.2 | 1.6 | GO:0004445 | inositol-polyphosphate 5-phosphatase activity(GO:0004445) |
| 0.2 | 0.9 | GO:0038085 | vascular endothelial growth factor binding(GO:0038085) |
| 0.2 | 1.2 | GO:0000155 | phosphorelay sensor kinase activity(GO:0000155) |
| 0.2 | 2.2 | GO:0004143 | diacylglycerol kinase activity(GO:0004143) |
| 0.2 | 0.8 | GO:0005168 | neurotrophin TRKA receptor binding(GO:0005168) |
| 0.2 | 4.0 | GO:0042800 | histone methyltransferase activity (H3-K4 specific)(GO:0042800) |
| 0.2 | 2.0 | GO:0050321 | tau-protein kinase activity(GO:0050321) |
| 0.2 | 2.0 | GO:0016004 | phospholipase activator activity(GO:0016004) |
| 0.2 | 1.1 | GO:0035252 | UDP-xylosyltransferase activity(GO:0035252) |
| 0.2 | 0.5 | GO:0004515 | nicotinamide-nucleotide adenylyltransferase activity(GO:0000309) nicotinate-nucleotide adenylyltransferase activity(GO:0004515) |
| 0.2 | 0.8 | GO:0031697 | beta-1 adrenergic receptor binding(GO:0031697) |
| 0.2 | 0.3 | GO:0045322 | unmethylated CpG binding(GO:0045322) |
| 0.2 | 0.5 | GO:0070548 | L-glutamine aminotransferase activity(GO:0070548) |
| 0.1 | 0.7 | GO:0004994 | somatostatin receptor activity(GO:0004994) |
| 0.1 | 1.9 | GO:0035497 | cAMP response element binding(GO:0035497) |
| 0.1 | 0.7 | GO:0005314 | high-affinity glutamate transmembrane transporter activity(GO:0005314) |
| 0.1 | 0.4 | GO:0004704 | NF-kappaB-inducing kinase activity(GO:0004704) |
| 0.1 | 0.7 | GO:0097016 | L27 domain binding(GO:0097016) |
| 0.1 | 0.3 | GO:0008330 | protein tyrosine/threonine phosphatase activity(GO:0008330) |
| 0.1 | 2.6 | GO:0004115 | 3',5'-cyclic-AMP phosphodiesterase activity(GO:0004115) |
| 0.1 | 1.0 | GO:0097109 | neuroligin family protein binding(GO:0097109) |
| 0.1 | 0.9 | GO:0034647 | histone demethylase activity (H3-trimethyl-K4 specific)(GO:0034647) |
| 0.1 | 1.3 | GO:0043208 | glycosphingolipid binding(GO:0043208) |
| 0.1 | 0.7 | GO:0001042 | RNA polymerase I core binding(GO:0001042) |
| 0.1 | 0.4 | GO:0004040 | amidase activity(GO:0004040) |
| 0.1 | 0.4 | GO:0003941 | L-serine ammonia-lyase activity(GO:0003941) |
| 0.1 | 0.4 | GO:0003945 | N-acetyllactosamine synthase activity(GO:0003945) |
| 0.1 | 0.4 | GO:0051916 | granulocyte colony-stimulating factor binding(GO:0051916) |
| 0.1 | 0.4 | GO:0030977 | taurine binding(GO:0030977) |
| 0.1 | 3.8 | GO:0008139 | nuclear localization sequence binding(GO:0008139) |
| 0.1 | 0.9 | GO:0005078 | MAP-kinase scaffold activity(GO:0005078) |
| 0.1 | 0.5 | GO:0061578 | Lys63-specific deubiquitinase activity(GO:0061578) |
| 0.1 | 2.2 | GO:0000400 | four-way junction DNA binding(GO:0000400) |
| 0.1 | 0.6 | GO:0004920 | interleukin-10 receptor activity(GO:0004920) |
| 0.1 | 0.8 | GO:0008467 | [heparan sulfate]-glucosamine 3-sulfotransferase 1 activity(GO:0008467) |
| 0.1 | 1.1 | GO:0015193 | L-proline transmembrane transporter activity(GO:0015193) |
| 0.1 | 0.8 | GO:0005522 | profilin binding(GO:0005522) |
| 0.1 | 3.7 | GO:0070064 | proline-rich region binding(GO:0070064) |
| 0.1 | 0.7 | GO:0005113 | patched binding(GO:0005113) |
| 0.1 | 2.2 | GO:0018024 | histone-lysine N-methyltransferase activity(GO:0018024) |
| 0.1 | 0.4 | GO:0001847 | opsonin receptor activity(GO:0001847) |
| 0.1 | 0.1 | GO:0005072 | transforming growth factor beta receptor, cytoplasmic mediator activity(GO:0005072) |
| 0.1 | 0.4 | GO:0004706 | JUN kinase kinase kinase activity(GO:0004706) |
| 0.1 | 2.9 | GO:0035259 | glucocorticoid receptor binding(GO:0035259) |
| 0.1 | 0.3 | GO:0003828 | alpha-N-acetylneuraminate alpha-2,8-sialyltransferase activity(GO:0003828) |
| 0.1 | 0.9 | GO:0032184 | SUMO polymer binding(GO:0032184) |
| 0.1 | 0.7 | GO:0004616 | phosphogluconate dehydrogenase (decarboxylating) activity(GO:0004616) |
| 0.1 | 0.6 | GO:0061676 | importin-alpha family protein binding(GO:0061676) |
| 0.1 | 13.9 | GO:0017124 | SH3 domain binding(GO:0017124) |
| 0.1 | 6.5 | GO:0005544 | calcium-dependent phospholipid binding(GO:0005544) |
| 0.1 | 1.1 | GO:0016176 | superoxide-generating NADPH oxidase activator activity(GO:0016176) |
| 0.1 | 0.6 | GO:0015252 | hydrogen ion channel activity(GO:0015252) |
| 0.1 | 0.4 | GO:1904288 | BAT3 complex binding(GO:1904288) |
| 0.1 | 1.1 | GO:0070097 | delta-catenin binding(GO:0070097) |
| 0.1 | 0.9 | GO:0043495 | protein anchor(GO:0043495) |
| 0.1 | 0.4 | GO:0030144 | alpha-1,6-mannosylglycoprotein 6-beta-N-acetylglucosaminyltransferase activity(GO:0030144) |
| 0.1 | 0.9 | GO:0030375 | thyroid hormone receptor coactivator activity(GO:0030375) |
| 0.1 | 0.3 | GO:0004483 | mRNA (nucleoside-2'-O-)-methyltransferase activity(GO:0004483) |
| 0.1 | 1.3 | GO:0008331 | high voltage-gated calcium channel activity(GO:0008331) |
| 0.1 | 0.5 | GO:0003886 | DNA (cytosine-5-)-methyltransferase activity(GO:0003886) |
| 0.1 | 0.3 | GO:0004439 | phosphatidylinositol-4,5-bisphosphate 5-phosphatase activity(GO:0004439) |
| 0.1 | 0.5 | GO:0048763 | calcium-induced calcium release activity(GO:0048763) |
| 0.1 | 1.0 | GO:0030346 | protein phosphatase 2B binding(GO:0030346) |
| 0.1 | 0.4 | GO:0071535 | RING-like zinc finger domain binding(GO:0071535) |
| 0.1 | 3.0 | GO:0070412 | R-SMAD binding(GO:0070412) |
| 0.1 | 4.5 | GO:0048365 | Rac GTPase binding(GO:0048365) |
| 0.1 | 0.4 | GO:0004594 | pantothenate kinase activity(GO:0004594) |
| 0.1 | 0.7 | GO:0043559 | insulin binding(GO:0043559) |
| 0.1 | 0.2 | GO:0071558 | histone demethylase activity (H3-K27 specific)(GO:0071558) |
| 0.1 | 1.0 | GO:0043995 | histone acetyltransferase activity (H4-K5 specific)(GO:0043995) histone acetyltransferase activity (H4-K8 specific)(GO:0043996) histone acetyltransferase activity (H4-K16 specific)(GO:0046972) |
| 0.1 | 0.6 | GO:0015277 | kainate selective glutamate receptor activity(GO:0015277) |
| 0.1 | 0.4 | GO:0071936 | coreceptor activity involved in Wnt signaling pathway(GO:0071936) |
| 0.1 | 0.8 | GO:0008656 | cysteine-type endopeptidase activator activity involved in apoptotic process(GO:0008656) |
| 0.1 | 1.0 | GO:0070016 | armadillo repeat domain binding(GO:0070016) |
| 0.1 | 0.6 | GO:0008349 | MAP kinase kinase kinase kinase activity(GO:0008349) |
| 0.1 | 0.2 | GO:0015616 | DNA translocase activity(GO:0015616) |
| 0.1 | 0.3 | GO:0003976 | UDP-N-acetylglucosamine-lysosomal-enzyme N-acetylglucosaminephosphotransferase activity(GO:0003976) |
| 0.1 | 4.4 | GO:0045182 | translation regulator activity(GO:0045182) |
| 0.1 | 0.1 | GO:0016361 | activin receptor activity, type I(GO:0016361) |
| 0.1 | 0.7 | GO:0070411 | I-SMAD binding(GO:0070411) |
| 0.1 | 0.3 | GO:0016422 | mRNA (2'-O-methyladenosine-N6-)-methyltransferase activity(GO:0016422) |
| 0.1 | 0.4 | GO:0046935 | 1-phosphatidylinositol-3-kinase regulator activity(GO:0046935) |
| 0.1 | 0.4 | GO:0003835 | beta-galactoside alpha-2,6-sialyltransferase activity(GO:0003835) |
| 0.1 | 0.3 | GO:0004528 | phosphodiesterase I activity(GO:0004528) |
| 0.1 | 0.5 | GO:0052629 | phosphatidylinositol-3,5-bisphosphate 3-phosphatase activity(GO:0052629) |
| 0.1 | 0.5 | GO:0008499 | UDP-galactose:beta-N-acetylglucosamine beta-1,3-galactosyltransferase activity(GO:0008499) |
| 0.1 | 0.4 | GO:1990189 | peptide-serine-N-acetyltransferase activity(GO:1990189) |
| 0.1 | 0.1 | GO:0050692 | DBD domain binding(GO:0050692) |
| 0.1 | 0.3 | GO:0008481 | sphinganine kinase activity(GO:0008481) |
| 0.1 | 1.8 | GO:0005229 | intracellular calcium activated chloride channel activity(GO:0005229) |
| 0.1 | 1.5 | GO:0004535 | poly(A)-specific ribonuclease activity(GO:0004535) |
| 0.1 | 1.6 | GO:0017081 | chloride channel regulator activity(GO:0017081) |
| 0.1 | 1.5 | GO:0032266 | phosphatidylinositol-3-phosphate binding(GO:0032266) |
| 0.1 | 1.4 | GO:0032183 | SUMO binding(GO:0032183) |
| 0.1 | 0.8 | GO:0030957 | Tat protein binding(GO:0030957) |
| 0.1 | 1.4 | GO:0005234 | extracellular-glutamate-gated ion channel activity(GO:0005234) |
| 0.1 | 0.4 | GO:0030622 | U4atac snRNA binding(GO:0030622) |
| 0.1 | 0.2 | GO:0043125 | ErbB-3 class receptor binding(GO:0043125) |
| 0.1 | 0.4 | GO:0036033 | mediator complex binding(GO:0036033) |
| 0.1 | 0.4 | GO:0035615 | clathrin adaptor activity(GO:0035615) endocytic adaptor activity(GO:0098748) |
| 0.1 | 1.2 | GO:0050998 | nitric-oxide synthase binding(GO:0050998) |
| 0.1 | 0.3 | GO:0008281 | sulfonylurea receptor activity(GO:0008281) |
| 0.1 | 0.8 | GO:0051766 | inositol trisphosphate kinase activity(GO:0051766) |
| 0.1 | 1.0 | GO:0004576 | oligosaccharyl transferase activity(GO:0004576) dolichyl-diphosphooligosaccharide-protein glycotransferase activity(GO:0004579) |
| 0.1 | 0.3 | GO:0004591 | oxoglutarate dehydrogenase (succinyl-transferring) activity(GO:0004591) |
| 0.1 | 1.4 | GO:0008574 | ATP-dependent microtubule motor activity, plus-end-directed(GO:0008574) |
| 0.1 | 0.4 | GO:0004720 | protein-lysine 6-oxidase activity(GO:0004720) |
| 0.1 | 0.4 | GO:0016907 | G-protein coupled acetylcholine receptor activity(GO:0016907) |
| 0.1 | 0.1 | GO:0001083 | transcription factor activity, RNA polymerase II basal transcription factor binding(GO:0001083) |
| 0.1 | 0.3 | GO:0051731 | polynucleotide 5'-hydroxyl-kinase activity(GO:0051731) |
| 0.1 | 1.3 | GO:0015095 | magnesium ion transmembrane transporter activity(GO:0015095) |
| 0.1 | 3.6 | GO:0030374 | ligand-dependent nuclear receptor transcription coactivator activity(GO:0030374) |
| 0.1 | 1.8 | GO:0003950 | NAD+ ADP-ribosyltransferase activity(GO:0003950) |
| 0.1 | 2.0 | GO:0070530 | K63-linked polyubiquitin binding(GO:0070530) |
| 0.1 | 1.2 | GO:0099604 | calcium-release channel activity(GO:0015278) ligand-gated calcium channel activity(GO:0099604) |
| 0.1 | 0.5 | GO:0070290 | N-acylphosphatidylethanolamine-specific phospholipase D activity(GO:0070290) |
| 0.1 | 0.7 | GO:0022833 | mechanically-gated ion channel activity(GO:0008381) mechanically gated channel activity(GO:0022833) |
| 0.1 | 0.2 | GO:0003844 | 1,4-alpha-glucan branching enzyme activity(GO:0003844) |
| 0.1 | 0.2 | GO:0051425 | PTB domain binding(GO:0051425) |
| 0.1 | 0.3 | GO:0005324 | long-chain fatty acid transporter activity(GO:0005324) |
| 0.1 | 0.3 | GO:0045174 | oxidoreductase activity, acting on a sulfur group of donors, quinone or similar compound as acceptor(GO:0016672) oxidoreductase activity, acting on phosphorus or arsenic in donors(GO:0030613) oxidoreductase activity, acting on phosphorus or arsenic in donors, disulfide as acceptor(GO:0030614) glutathione dehydrogenase (ascorbate) activity(GO:0045174) methylarsonate reductase activity(GO:0050610) |
| 0.1 | 0.5 | GO:0090554 | phosphatidylcholine-translocating ATPase activity(GO:0090554) |
| 0.1 | 2.4 | GO:0017075 | syntaxin-1 binding(GO:0017075) |
| 0.1 | 0.6 | GO:0017151 | DEAD/H-box RNA helicase binding(GO:0017151) |
| 0.1 | 0.4 | GO:0015440 | peptide-transporting ATPase activity(GO:0015440) |
| 0.1 | 1.8 | GO:0004707 | MAP kinase activity(GO:0004707) |
| 0.1 | 0.4 | GO:0051864 | histone demethylase activity (H3-K36 specific)(GO:0051864) |
| 0.1 | 1.6 | GO:0071837 | HMG box domain binding(GO:0071837) |
| 0.1 | 0.5 | GO:0035612 | AP-2 adaptor complex binding(GO:0035612) |
| 0.1 | 0.2 | GO:0070012 | oligopeptidase activity(GO:0070012) |
| 0.1 | 1.5 | GO:0051010 | microtubule plus-end binding(GO:0051010) |
| 0.1 | 0.2 | GO:0001010 | transcription factor activity, sequence-specific DNA binding transcription factor recruiting(GO:0001010) |
| 0.1 | 0.2 | GO:0030159 | receptor signaling complex scaffold activity(GO:0030159) |
| 0.1 | 0.8 | GO:0051011 | microtubule minus-end binding(GO:0051011) |
| 0.1 | 1.6 | GO:0015923 | mannosidase activity(GO:0015923) |
| 0.1 | 0.5 | GO:0070326 | very-low-density lipoprotein particle receptor binding(GO:0070326) |
| 0.1 | 1.6 | GO:0070034 | telomerase RNA binding(GO:0070034) |
| 0.1 | 0.4 | GO:0005042 | netrin receptor activity(GO:0005042) |
| 0.1 | 1.1 | GO:0005247 | voltage-gated chloride channel activity(GO:0005247) |
| 0.1 | 0.2 | GO:0004691 | cAMP-dependent protein kinase activity(GO:0004691) |
| 0.1 | 0.3 | GO:0050659 | N-acetylgalactosamine 4-sulfate 6-O-sulfotransferase activity(GO:0050659) |
| 0.1 | 0.9 | GO:0047372 | acylglycerol lipase activity(GO:0047372) |
| 0.1 | 0.4 | GO:0046790 | virion binding(GO:0046790) |
| 0.1 | 0.1 | GO:0005128 | erythropoietin receptor binding(GO:0005128) |
| 0.1 | 0.2 | GO:0072590 | N-acetyl-L-aspartate-L-glutamate ligase activity(GO:0072590) |
| 0.1 | 0.8 | GO:0016863 | intramolecular oxidoreductase activity, transposing C=C bonds(GO:0016863) |
| 0.1 | 0.2 | GO:0001025 | RNA polymerase III transcription factor binding(GO:0001025) |
| 0.1 | 1.7 | GO:0001784 | phosphotyrosine binding(GO:0001784) |
| 0.1 | 0.3 | GO:0015467 | G-protein activated inward rectifier potassium channel activity(GO:0015467) |
| 0.1 | 0.9 | GO:0030546 | receptor activator activity(GO:0030546) |
| 0.1 | 0.7 | GO:0004679 | AMP-activated protein kinase activity(GO:0004679) |
| 0.1 | 0.2 | GO:0004830 | tryptophan-tRNA ligase activity(GO:0004830) |
| 0.1 | 0.5 | GO:0008140 | cAMP response element binding protein binding(GO:0008140) |
| 0.1 | 0.5 | GO:0035925 | mRNA 3'-UTR AU-rich region binding(GO:0035925) |
| 0.1 | 0.2 | GO:0061665 | SUMO ligase activity(GO:0061665) |
| 0.1 | 0.9 | GO:0008484 | sulfuric ester hydrolase activity(GO:0008484) |
| 0.1 | 0.2 | GO:0016748 | succinyltransferase activity(GO:0016748) |
| 0.1 | 0.4 | GO:0048495 | Roundabout binding(GO:0048495) |
| 0.1 | 1.4 | GO:0032452 | histone demethylase activity(GO:0032452) |
| 0.1 | 0.3 | GO:0042289 | MHC class II protein binding(GO:0042289) |
| 0.1 | 0.1 | GO:0070087 | chromo shadow domain binding(GO:0070087) |
| 0.1 | 13.7 | GO:0005085 | guanyl-nucleotide exchange factor activity(GO:0005085) |
| 0.1 | 2.1 | GO:0030506 | ankyrin binding(GO:0030506) |
| 0.1 | 3.7 | GO:0005201 | extracellular matrix structural constituent(GO:0005201) |
| 0.1 | 0.3 | GO:0060072 | large conductance calcium-activated potassium channel activity(GO:0060072) |
| 0.1 | 4.0 | GO:0003777 | microtubule motor activity(GO:0003777) |
| 0.1 | 0.4 | GO:0051959 | dynein light intermediate chain binding(GO:0051959) |
| 0.1 | 0.7 | GO:0001972 | retinoic acid binding(GO:0001972) |
| 0.1 | 2.4 | GO:0017048 | Rho GTPase binding(GO:0017048) |
| 0.1 | 1.4 | GO:0005158 | insulin receptor binding(GO:0005158) |
| 0.1 | 0.2 | GO:0070883 | pre-miRNA binding(GO:0070883) |
| 0.1 | 0.1 | GO:0055131 | C3HC4-type RING finger domain binding(GO:0055131) |
| 0.1 | 1.3 | GO:0031489 | myosin V binding(GO:0031489) |
| 0.1 | 1.1 | GO:0008187 | poly-pyrimidine tract binding(GO:0008187) |
| 0.1 | 1.4 | GO:0050431 | transforming growth factor beta binding(GO:0050431) |
| 0.1 | 2.4 | GO:0070063 | RNA polymerase binding(GO:0070063) |
| 0.1 | 0.6 | GO:0005222 | intracellular cAMP activated cation channel activity(GO:0005222) |
| 0.1 | 0.2 | GO:0031177 | phosphopantetheine binding(GO:0031177) |
| 0.1 | 0.4 | GO:0005169 | neurotrophin TRKB receptor binding(GO:0005169) |
| 0.1 | 0.8 | GO:0098847 | sequence-specific single stranded DNA binding(GO:0098847) |
| 0.1 | 0.7 | GO:0070700 | BMP receptor binding(GO:0070700) |
| 0.1 | 1.4 | GO:0071949 | FAD binding(GO:0071949) |
| 0.1 | 0.1 | GO:0034485 | phosphatidylinositol-3,4,5-trisphosphate 5-phosphatase activity(GO:0034485) |
| 0.1 | 0.3 | GO:0004470 | malic enzyme activity(GO:0004470) malate dehydrogenase (decarboxylating) (NAD+) activity(GO:0004471) malate dehydrogenase (decarboxylating) (NADP+) activity(GO:0004473) |
| 0.1 | 0.5 | GO:0043008 | ATP-dependent protein binding(GO:0043008) |
| 0.1 | 0.3 | GO:0008603 | cAMP-dependent protein kinase regulator activity(GO:0008603) |
| 0.1 | 0.5 | GO:0008353 | RNA polymerase II carboxy-terminal domain kinase activity(GO:0008353) |
| 0.1 | 0.3 | GO:0010997 | anaphase-promoting complex binding(GO:0010997) |
| 0.1 | 0.3 | GO:0043184 | vascular endothelial growth factor receptor 2 binding(GO:0043184) |
| 0.1 | 0.3 | GO:0008526 | phosphatidylinositol transporter activity(GO:0008526) |
| 0.1 | 0.2 | GO:0004430 | 1-phosphatidylinositol 4-kinase activity(GO:0004430) |
| 0.1 | 0.4 | GO:0035005 | 1-phosphatidylinositol-4-phosphate 3-kinase activity(GO:0035005) |
| 0.1 | 0.4 | GO:0015181 | arginine transmembrane transporter activity(GO:0015181) |
| 0.1 | 0.4 | GO:0000340 | RNA 7-methylguanosine cap binding(GO:0000340) |
| 0.1 | 1.4 | GO:0005385 | zinc ion transmembrane transporter activity(GO:0005385) |
| 0.1 | 0.2 | GO:0047184 | 1-acylglycerophosphocholine O-acyltransferase activity(GO:0047184) |
| 0.1 | 0.1 | GO:0034186 | apolipoprotein A-I binding(GO:0034186) |
| 0.1 | 3.1 | GO:0019209 | kinase activator activity(GO:0019209) |
| 0.1 | 0.2 | GO:0004021 | L-alanine:2-oxoglutarate aminotransferase activity(GO:0004021) alanine-oxo-acid transaminase activity(GO:0047635) |
| 0.1 | 3.8 | GO:0004843 | thiol-dependent ubiquitin-specific protease activity(GO:0004843) |
| 0.1 | 0.3 | GO:0080084 | RNA polymerase III type 1 promoter DNA binding(GO:0001030) RNA polymerase III type 2 promoter DNA binding(GO:0001031) 5S rDNA binding(GO:0080084) |
| 0.1 | 0.1 | GO:0010385 | double-stranded methylated DNA binding(GO:0010385) |
| 0.1 | 0.7 | GO:0043274 | phospholipase binding(GO:0043274) |
| 0.1 | 3.5 | GO:0004702 | receptor signaling protein serine/threonine kinase activity(GO:0004702) |
| 0.1 | 0.2 | GO:0008179 | adenylate cyclase binding(GO:0008179) |
| 0.1 | 0.3 | GO:0015016 | [heparan sulfate]-glucosamine N-sulfotransferase activity(GO:0015016) |
| 0.1 | 0.2 | GO:1990050 | phosphatidic acid transporter activity(GO:1990050) |
| 0.1 | 3.4 | GO:0008013 | beta-catenin binding(GO:0008013) |
| 0.1 | 0.4 | GO:0015093 | ferrous iron transmembrane transporter activity(GO:0015093) |
| 0.1 | 0.2 | GO:0008184 | glycogen phosphorylase activity(GO:0008184) |
| 0.1 | 0.2 | GO:0004719 | protein-L-isoaspartate (D-aspartate) O-methyltransferase activity(GO:0004719) |
| 0.1 | 0.7 | GO:0017091 | AU-rich element binding(GO:0017091) |
| 0.1 | 0.2 | GO:0004829 | threonine-tRNA ligase activity(GO:0004829) |
| 0.1 | 2.3 | GO:0061733 | peptide-lysine-N-acetyltransferase activity(GO:0061733) |
| 0.1 | 0.4 | GO:0008190 | eukaryotic initiation factor 4E binding(GO:0008190) |
| 0.1 | 0.2 | GO:0004874 | aryl hydrocarbon receptor activity(GO:0004874) |
| 0.1 | 0.2 | GO:0008486 | endopolyphosphatase activity(GO:0000298) diphosphoinositol-polyphosphate diphosphatase activity(GO:0008486) bis(5'-adenosyl)-hexaphosphatase activity(GO:0034431) bis(5'-adenosyl)-pentaphosphatase activity(GO:0034432) |
| 0.0 | 0.2 | GO:0034056 | estrogen response element binding(GO:0034056) |
| 0.0 | 0.2 | GO:1990599 | 3' overhang single-stranded DNA endodeoxyribonuclease activity(GO:1990599) |
| 0.0 | 1.2 | GO:0005154 | epidermal growth factor receptor binding(GO:0005154) |
| 0.0 | 0.2 | GO:0005052 | peroxisome matrix targeting signal-1 binding(GO:0005052) |
| 0.0 | 1.8 | GO:0005546 | phosphatidylinositol-4,5-bisphosphate binding(GO:0005546) |
| 0.0 | 0.3 | GO:0004652 | polynucleotide adenylyltransferase activity(GO:0004652) |
| 0.0 | 0.3 | GO:0005432 | calcium:sodium antiporter activity(GO:0005432) |
| 0.0 | 0.4 | GO:0016929 | SUMO-specific protease activity(GO:0016929) |
| 0.0 | 6.5 | GO:0003714 | transcription corepressor activity(GO:0003714) |
| 0.0 | 0.2 | GO:0001163 | RNA polymerase I regulatory region sequence-specific DNA binding(GO:0001163) RNA polymerase I CORE element sequence-specific DNA binding(GO:0001164) |
| 0.0 | 0.5 | GO:0005092 | GDP-dissociation inhibitor activity(GO:0005092) |
| 0.0 | 0.2 | GO:0031705 | bombesin receptor binding(GO:0031705) |
| 0.0 | 0.1 | GO:0050265 | RNA uridylyltransferase activity(GO:0050265) |
| 0.0 | 0.4 | GO:0036312 | phosphatidylinositol 3-kinase regulatory subunit binding(GO:0036312) |
| 0.0 | 0.2 | GO:0004351 | glutamate decarboxylase activity(GO:0004351) |
| 0.0 | 0.1 | GO:0048403 | brain-derived neurotrophic factor binding(GO:0048403) |
| 0.0 | 1.8 | GO:0035064 | methylated histone binding(GO:0035064) |
| 0.0 | 0.3 | GO:0004035 | alkaline phosphatase activity(GO:0004035) |
| 0.0 | 0.1 | GO:0019797 | procollagen-proline 3-dioxygenase activity(GO:0019797) |
| 0.0 | 0.4 | GO:0034236 | protein kinase A catalytic subunit binding(GO:0034236) |
| 0.0 | 0.2 | GO:0031434 | mitogen-activated protein kinase kinase binding(GO:0031434) |
| 0.0 | 0.1 | GO:0042608 | T cell receptor binding(GO:0042608) |
| 0.0 | 0.8 | GO:0005246 | calcium channel regulator activity(GO:0005246) |
| 0.0 | 0.2 | GO:0004985 | opioid receptor activity(GO:0004985) |
| 0.0 | 1.2 | GO:0019707 | protein-cysteine S-palmitoyltransferase activity(GO:0019706) protein-cysteine S-acyltransferase activity(GO:0019707) |
| 0.0 | 0.1 | GO:0003831 | beta-N-acetylglucosaminylglycopeptide beta-1,4-galactosyltransferase activity(GO:0003831) |
| 0.0 | 0.8 | GO:0030275 | LRR domain binding(GO:0030275) |
| 0.0 | 0.5 | GO:0030215 | semaphorin receptor binding(GO:0030215) |
| 0.0 | 2.6 | GO:0004004 | RNA helicase activity(GO:0003724) ATP-dependent RNA helicase activity(GO:0004004) RNA-dependent ATPase activity(GO:0008186) |
| 0.0 | 0.5 | GO:0001134 | transcription factor activity, transcription factor recruiting(GO:0001134) |
| 0.0 | 0.1 | GO:0043199 | sulfate binding(GO:0043199) |
| 0.0 | 0.2 | GO:0034987 | immunoglobulin receptor binding(GO:0034987) |
| 0.0 | 0.5 | GO:0045236 | CXCR chemokine receptor binding(GO:0045236) |
| 0.0 | 0.2 | GO:0015562 | efflux transmembrane transporter activity(GO:0015562) |
| 0.0 | 0.1 | GO:0051880 | G-quadruplex DNA binding(GO:0051880) |
| 0.0 | 0.1 | GO:0008502 | melatonin receptor activity(GO:0008502) |
| 0.0 | 0.4 | GO:0003873 | 6-phosphofructo-2-kinase activity(GO:0003873) |
| 0.0 | 4.0 | GO:0044325 | ion channel binding(GO:0044325) |
| 0.0 | 0.2 | GO:0097001 | ceramide binding(GO:0097001) |
| 0.0 | 0.2 | GO:0001727 | lipid kinase activity(GO:0001727) |
| 0.0 | 0.1 | GO:0032810 | sterol response element binding(GO:0032810) |
| 0.0 | 1.0 | GO:0004693 | cyclin-dependent protein serine/threonine kinase activity(GO:0004693) |
| 0.0 | 0.3 | GO:1990405 | protein antigen binding(GO:1990405) |
| 0.0 | 0.3 | GO:0004791 | thioredoxin-disulfide reductase activity(GO:0004791) |
| 0.0 | 0.4 | GO:0017056 | structural constituent of nuclear pore(GO:0017056) |
| 0.0 | 0.1 | GO:0005534 | galactose binding(GO:0005534) |
| 0.0 | 0.7 | GO:0048027 | mRNA 5'-UTR binding(GO:0048027) |
| 0.0 | 0.1 | GO:0071532 | ankyrin repeat binding(GO:0071532) |
| 0.0 | 0.1 | GO:0005143 | interleukin-12 receptor binding(GO:0005143) |
| 0.0 | 0.6 | GO:0004629 | phospholipase C activity(GO:0004629) |
| 0.0 | 0.7 | GO:0031593 | polyubiquitin binding(GO:0031593) |
| 0.0 | 0.4 | GO:0070577 | lysine-acetylated histone binding(GO:0070577) |
| 0.0 | 1.0 | GO:0005484 | SNAP receptor activity(GO:0005484) |
| 0.0 | 0.4 | GO:0043395 | heparan sulfate proteoglycan binding(GO:0043395) |
| 0.0 | 0.3 | GO:1904264 | ubiquitin protein ligase activity involved in ERAD pathway(GO:1904264) |
| 0.0 | 3.8 | GO:0035091 | phosphatidylinositol binding(GO:0035091) |
| 0.0 | 0.2 | GO:0045503 | dynein light chain binding(GO:0045503) |
| 0.0 | 0.4 | GO:0009982 | pseudouridine synthase activity(GO:0009982) |
| 0.0 | 0.1 | GO:0015489 | polyamine transmembrane transporter activity(GO:0015203) putrescine transmembrane transporter activity(GO:0015489) |
| 0.0 | 0.5 | GO:0030550 | acetylcholine receptor inhibitor activity(GO:0030550) |
| 0.0 | 0.3 | GO:0005149 | interleukin-1 receptor binding(GO:0005149) |
| 0.0 | 0.8 | GO:0048306 | calcium-dependent protein binding(GO:0048306) |
| 0.0 | 0.1 | GO:0000995 | transcription factor activity, core RNA polymerase III binding(GO:0000995) transcription factor activity, RNA polymerase III transcription factor binding(GO:0001007) |
| 0.0 | 0.6 | GO:0043015 | gamma-tubulin binding(GO:0043015) |
| 0.0 | 0.1 | GO:0004735 | pyrroline-5-carboxylate reductase activity(GO:0004735) |
| 0.0 | 0.9 | GO:0015485 | cholesterol binding(GO:0015485) |
| 0.0 | 0.1 | GO:0005004 | GPI-linked ephrin receptor activity(GO:0005004) |
| 0.0 | 0.4 | GO:0070008 | serine-type exopeptidase activity(GO:0070008) |
| 0.0 | 0.6 | GO:0004890 | GABA-A receptor activity(GO:0004890) |
| 0.0 | 0.2 | GO:0008934 | inositol monophosphate 1-phosphatase activity(GO:0008934) inositol monophosphate 3-phosphatase activity(GO:0052832) |
| 0.0 | 0.0 | GO:0004740 | pyruvate dehydrogenase (acetyl-transferring) kinase activity(GO:0004740) |
| 0.0 | 0.1 | GO:0035368 | selenocysteine insertion sequence binding(GO:0035368) |
| 0.0 | 0.6 | GO:0008536 | Ran GTPase binding(GO:0008536) |
| 0.0 | 0.3 | GO:0008417 | fucosyltransferase activity(GO:0008417) |
| 0.0 | 0.1 | GO:0003951 | NAD+ kinase activity(GO:0003951) |
| 0.0 | 0.2 | GO:0019103 | pyrimidine nucleotide binding(GO:0019103) |
| 0.0 | 0.1 | GO:0009384 | N-acylmannosamine kinase activity(GO:0009384) |
| 0.0 | 1.0 | GO:0004715 | non-membrane spanning protein tyrosine kinase activity(GO:0004715) |
| 0.0 | 3.1 | GO:0004222 | metalloendopeptidase activity(GO:0004222) |
| 0.0 | 0.7 | GO:0003746 | translation elongation factor activity(GO:0003746) |
| 0.0 | 0.2 | GO:0004396 | glucokinase activity(GO:0004340) hexokinase activity(GO:0004396) fructokinase activity(GO:0008865) mannokinase activity(GO:0019158) |
| 0.0 | 0.2 | GO:0047499 | calcium-independent phospholipase A2 activity(GO:0047499) |
| 0.0 | 0.1 | GO:0004822 | isoleucine-tRNA ligase activity(GO:0004822) |
| 0.0 | 0.1 | GO:0016833 | oxo-acid-lyase activity(GO:0016833) |
| 0.0 | 0.5 | GO:0036459 | thiol-dependent ubiquitinyl hydrolase activity(GO:0036459) |
| 0.0 | 0.1 | GO:0042954 | lipoprotein transporter activity(GO:0042954) |
| 0.0 | 0.1 | GO:0016149 | translation release factor activity, codon specific(GO:0016149) |
| 0.0 | 0.3 | GO:0042301 | phosphate ion binding(GO:0042301) |
| 0.0 | 0.1 | GO:0015197 | peptide transporter activity(GO:0015197) |
| 0.0 | 0.4 | GO:0005123 | death receptor binding(GO:0005123) |
| 0.0 | 0.1 | GO:0051434 | BH3 domain binding(GO:0051434) |
| 0.0 | 4.7 | GO:0005096 | GTPase activator activity(GO:0005096) |
| 0.0 | 0.3 | GO:0042975 | peroxisome proliferator activated receptor binding(GO:0042975) |
| 0.0 | 0.1 | GO:0004741 | [pyruvate dehydrogenase (lipoamide)] phosphatase activity(GO:0004741) |
| 0.0 | 0.1 | GO:0001094 | TFIID-class transcription factor binding(GO:0001094) |
| 0.0 | 0.2 | GO:0008307 | structural constituent of muscle(GO:0008307) |
| 0.0 | 0.1 | GO:0004768 | stearoyl-CoA 9-desaturase activity(GO:0004768) |
| 0.0 | 0.1 | GO:0000171 | ribonuclease MRP activity(GO:0000171) |
| 0.0 | 0.8 | GO:0030544 | Hsp70 protein binding(GO:0030544) |
| 0.0 | 0.1 | GO:0034185 | apolipoprotein binding(GO:0034185) |
| 0.0 | 0.6 | GO:0070001 | aspartic-type endopeptidase activity(GO:0004190) aspartic-type peptidase activity(GO:0070001) |
| 0.0 | 0.2 | GO:0005540 | hyaluronic acid binding(GO:0005540) |
| 0.0 | 0.3 | GO:0030169 | low-density lipoprotein particle binding(GO:0030169) |
| 0.0 | 0.5 | GO:0005523 | tropomyosin binding(GO:0005523) |
| 0.0 | 0.1 | GO:0043237 | laminin-1 binding(GO:0043237) |
| 0.0 | 0.1 | GO:0000026 | alpha-1,2-mannosyltransferase activity(GO:0000026) |
| 0.0 | 0.1 | GO:0004176 | ATP-dependent peptidase activity(GO:0004176) |
| 0.0 | 0.3 | GO:0016423 | tRNA (guanine) methyltransferase activity(GO:0016423) |
| 0.0 | 0.1 | GO:0004825 | methionine-tRNA ligase activity(GO:0004825) |
| 0.0 | 0.1 | GO:0042030 | ATPase inhibitor activity(GO:0042030) |
| 0.0 | 6.4 | GO:0004674 | protein serine/threonine kinase activity(GO:0004674) |
| 0.0 | 0.4 | GO:0035035 | histone acetyltransferase binding(GO:0035035) |
| 0.0 | 0.3 | GO:0005537 | mannose binding(GO:0005537) |
| 0.0 | 0.1 | GO:0004656 | procollagen-proline 4-dioxygenase activity(GO:0004656) procollagen-proline dioxygenase activity(GO:0019798) |
| 0.0 | 0.1 | GO:0050785 | advanced glycation end-product receptor activity(GO:0050785) |
| 0.0 | 0.3 | GO:0070324 | thyroid hormone binding(GO:0070324) |
| 0.0 | 0.5 | GO:0051018 | protein kinase A binding(GO:0051018) |
| 0.0 | 0.5 | GO:0051721 | protein phosphatase 2A binding(GO:0051721) |
| 0.0 | 0.1 | GO:0030274 | LIM domain binding(GO:0030274) |
| 0.0 | 0.1 | GO:0031404 | chloride ion binding(GO:0031404) |
| 0.0 | 0.1 | GO:0047623 | AMP deaminase activity(GO:0003876) adenosine-phosphate deaminase activity(GO:0047623) |
| 0.0 | 0.2 | GO:0015037 | peptide disulfide oxidoreductase activity(GO:0015037) |
| 0.0 | 0.6 | GO:0030507 | spectrin binding(GO:0030507) |
| 0.0 | 0.2 | GO:0008297 | single-stranded DNA exodeoxyribonuclease activity(GO:0008297) |
| 0.0 | 0.2 | GO:0043139 | 5'-3' DNA helicase activity(GO:0043139) |
| 0.0 | 0.1 | GO:0015186 | L-glutamine transmembrane transporter activity(GO:0015186) |
| 0.0 | 1.3 | GO:0019888 | protein phosphatase regulator activity(GO:0019888) |
| 0.0 | 0.0 | GO:0005030 | neurotrophin receptor activity(GO:0005030) |
| 0.0 | 0.1 | GO:0003910 | DNA ligase activity(GO:0003909) DNA ligase (ATP) activity(GO:0003910) |
| 0.0 | 4.1 | GO:0061659 | ubiquitin-like protein ligase activity(GO:0061659) |
| 0.0 | 0.1 | GO:0005483 | soluble NSF attachment protein activity(GO:0005483) |
| 0.0 | 0.1 | GO:0030899 | calcium-dependent ATPase activity(GO:0030899) |
| 0.0 | 0.1 | GO:0008318 | protein prenyltransferase activity(GO:0008318) |
| 0.0 | 0.3 | GO:0016671 | oxidoreductase activity, acting on a sulfur group of donors, disulfide as acceptor(GO:0016671) |
| 0.0 | 0.2 | GO:0005225 | volume-sensitive anion channel activity(GO:0005225) |
| 0.0 | 0.2 | GO:0016500 | protein-hormone receptor activity(GO:0016500) |
| 0.0 | 0.1 | GO:0097200 | cysteine-type endopeptidase activity involved in apoptotic process(GO:0097153) cysteine-type endopeptidase activity involved in execution phase of apoptosis(GO:0097200) |
| 0.0 | 0.3 | GO:0051879 | Hsp90 protein binding(GO:0051879) |
| 0.0 | 0.2 | GO:0016884 | carbon-nitrogen ligase activity, with glutamine as amido-N-donor(GO:0016884) |
| 0.0 | 0.1 | GO:0001605 | adrenomedullin receptor activity(GO:0001605) |
| 0.0 | 0.1 | GO:0051400 | BH domain binding(GO:0051400) |
| 0.0 | 0.3 | GO:0016832 | aldehyde-lyase activity(GO:0016832) |
| 0.0 | 0.6 | GO:0000149 | SNARE binding(GO:0000149) |
| 0.0 | 0.1 | GO:0050700 | CARD domain binding(GO:0050700) |
| 0.0 | 0.0 | GO:0032135 | DNA insertion or deletion binding(GO:0032135) |
| 0.0 | 0.4 | GO:0019239 | deaminase activity(GO:0019239) |
| 0.0 | 0.1 | GO:0003958 | NADPH-hemoprotein reductase activity(GO:0003958) |
| 0.0 | 0.0 | GO:0031208 | POZ domain binding(GO:0031208) |
| 0.0 | 0.1 | GO:0033188 | sphingomyelin synthase activity(GO:0033188) ceramide cholinephosphotransferase activity(GO:0047493) |
| 0.0 | 0.1 | GO:0047429 | nucleoside-triphosphate diphosphatase activity(GO:0047429) |
| 0.0 | 0.1 | GO:0043262 | adenosine-diphosphatase activity(GO:0043262) |
| 0.0 | 0.1 | GO:0004385 | guanylate kinase activity(GO:0004385) |
| 0.0 | 0.1 | GO:0016774 | phosphotransferase activity, carboxyl group as acceptor(GO:0016774) |
| 0.0 | 0.1 | GO:0001162 | RNA polymerase II intronic transcription regulatory region sequence-specific DNA binding(GO:0001162) |
| 0.0 | 0.2 | GO:0008821 | crossover junction endodeoxyribonuclease activity(GO:0008821) |
| 0.0 | 0.3 | GO:0003995 | acyl-CoA dehydrogenase activity(GO:0003995) |
| 0.0 | 0.1 | GO:0015386 | potassium:proton antiporter activity(GO:0015386) |
| 0.0 | 0.1 | GO:0016889 | endodeoxyribonuclease activity, producing 3'-phosphomonoesters(GO:0016889) |
| 0.0 | 0.1 | GO:0001054 | RNA polymerase I activity(GO:0001054) |
| 0.0 | 0.0 | GO:0004307 | ethanolaminephosphotransferase activity(GO:0004307) |
| 0.0 | 0.1 | GO:0036374 | gamma-glutamyltransferase activity(GO:0003840) glutathione hydrolase activity(GO:0036374) |
| 0.0 | 1.7 | GO:0001047 | core promoter binding(GO:0001047) |
| 0.0 | 0.1 | GO:0001640 | adenylate cyclase inhibiting G-protein coupled glutamate receptor activity(GO:0001640) |
| 0.0 | 0.1 | GO:0090482 | vitamin transmembrane transporter activity(GO:0090482) |
| 0.0 | 0.1 | GO:0005487 | nucleocytoplasmic transporter activity(GO:0005487) |
| 0.0 | 0.1 | GO:0004095 | carnitine O-palmitoyltransferase activity(GO:0004095) O-palmitoyltransferase activity(GO:0016416) |
| 0.0 | 0.1 | GO:0060698 | endoribonuclease inhibitor activity(GO:0060698) |
| 0.0 | 0.3 | GO:0004198 | calcium-dependent cysteine-type endopeptidase activity(GO:0004198) |
| 0.0 | 0.3 | GO:0008009 | chemokine activity(GO:0008009) |
| 0.0 | 0.1 | GO:0070568 | guanylyltransferase activity(GO:0070568) |
| 0.0 | 0.1 | GO:0016406 | carnitine O-acyltransferase activity(GO:0016406) |
| 0.0 | 0.2 | GO:0016594 | glycine binding(GO:0016594) |
| 0.0 | 0.1 | GO:0046912 | transferase activity, transferring acyl groups, acyl groups converted into alkyl on transfer(GO:0046912) |
| 0.0 | 0.0 | GO:0016262 | protein N-acetylglucosaminyltransferase activity(GO:0016262) |
| 0.0 | 0.1 | GO:0047760 | butyrate-CoA ligase activity(GO:0047760) |
| 0.0 | 3.4 | GO:0003779 | actin binding(GO:0003779) |
| 0.0 | 0.1 | GO:0005243 | gap junction channel activity(GO:0005243) |
| 0.0 | 0.1 | GO:0016888 | endodeoxyribonuclease activity, producing 5'-phosphomonoesters(GO:0016888) |
| 0.0 | 0.1 | GO:0030368 | interleukin-17 receptor activity(GO:0030368) |
| 0.0 | 0.1 | GO:0035242 | protein-arginine omega-N asymmetric methyltransferase activity(GO:0035242) |
| 0.0 | 0.2 | GO:0005109 | frizzled binding(GO:0005109) |
| 0.0 | 0.2 | GO:0004383 | guanylate cyclase activity(GO:0004383) |
| 0.0 | 0.2 | GO:0030971 | receptor tyrosine kinase binding(GO:0030971) |
| 0.0 | 1.0 | GO:0004672 | protein kinase activity(GO:0004672) |
Gene overrepresentation in curated gene sets: canonical pathways category:
| Log-likelihood per target | Total log-likelihood | Term | Description |
|---|---|---|---|
| 0.3 | 7.9 | PID NETRIN PATHWAY | Netrin-mediated signaling events |
| 0.3 | 14.6 | PID RET PATHWAY | Signaling events regulated by Ret tyrosine kinase |
| 0.2 | 8.0 | ST DIFFERENTIATION PATHWAY IN PC12 CELLS | Differentiation Pathway in PC12 Cells; this is a specific case of PAC1 Receptor Pathway. |
| 0.2 | 7.4 | PID ERBB4 PATHWAY | ErbB4 signaling events |
| 0.2 | 1.4 | ST G ALPHA S PATHWAY | G alpha s Pathway |
| 0.2 | 2.9 | PID VEGFR1 PATHWAY | VEGFR1 specific signals |
| 0.2 | 2.8 | PID LPA4 PATHWAY | LPA4-mediated signaling events |
| 0.2 | 2.9 | PID S1P S1P1 PATHWAY | S1P1 pathway |
| 0.1 | 0.4 | PID ER NONGENOMIC PATHWAY | Plasma membrane estrogen receptor signaling |
| 0.1 | 3.8 | PID RAS PATHWAY | Regulation of Ras family activation |
| 0.1 | 2.9 | SA CASPASE CASCADE | Apoptosis is mediated by caspases, cysteine proteases arranged in a proteolytic cascade. |
| 0.1 | 1.4 | ST MYOCYTE AD PATHWAY | Myocyte Adrenergic Pathway is a specific case of the generalized Adrenergic Pathway. |
| 0.1 | 3.5 | PID TCR CALCIUM PATHWAY | Calcium signaling in the CD4+ TCR pathway |
| 0.1 | 4.4 | SIG PIP3 SIGNALING IN B LYMPHOCYTES | Genes related to PIP3 signaling in B lymphocytes |
| 0.1 | 3.2 | PID WNT NONCANONICAL PATHWAY | Noncanonical Wnt signaling pathway |
| 0.1 | 0.1 | ST JAK STAT PATHWAY | Jak-STAT Pathway |
| 0.1 | 1.9 | PID INTEGRIN4 PATHWAY | Alpha6 beta4 integrin-ligand interactions |
| 0.1 | 2.1 | PID EPHB FWD PATHWAY | EPHB forward signaling |
| 0.1 | 2.6 | PID MAPK TRK PATHWAY | Trk receptor signaling mediated by the MAPK pathway |
| 0.1 | 0.6 | ST ADRENERGIC | Adrenergic Pathway |
| 0.1 | 4.0 | PID RXR VDR PATHWAY | RXR and RAR heterodimerization with other nuclear receptor |
| 0.1 | 0.4 | SA B CELL RECEPTOR COMPLEXES | Antigen binding to B cell receptors activates protein tyrosine kinases, such as the Src family, which ultimate activate MAP kinases. |
| 0.1 | 2.0 | PID IL12 STAT4 PATHWAY | IL12 signaling mediated by STAT4 |
| 0.1 | 1.8 | PID CIRCADIAN PATHWAY | Circadian rhythm pathway |
| 0.1 | 0.4 | PID PI3KCI AKT PATHWAY | Class I PI3K signaling events mediated by Akt |
| 0.1 | 1.2 | PID NEPHRIN NEPH1 PATHWAY | Nephrin/Neph1 signaling in the kidney podocyte |
| 0.1 | 0.6 | PID HIV NEF PATHWAY | HIV-1 Nef: Negative effector of Fas and TNF-alpha |
| 0.1 | 4.3 | NABA COLLAGENS | Genes encoding collagen proteins |
| 0.1 | 1.7 | NABA BASEMENT MEMBRANES | Genes encoding structural components of basement membranes |
| 0.1 | 1.7 | PID PS1 PATHWAY | Presenilin action in Notch and Wnt signaling |
| 0.1 | 0.7 | PID IGF1 PATHWAY | IGF1 pathway |
| 0.1 | 3.6 | PID BMP PATHWAY | BMP receptor signaling |
| 0.1 | 3.0 | PID AR TF PATHWAY | Regulation of Androgen receptor activity |
| 0.1 | 1.6 | PID EPHA FWDPATHWAY | EPHA forward signaling |
| 0.1 | 1.0 | PID ERBB2 ERBB3 PATHWAY | ErbB2/ErbB3 signaling events |
| 0.1 | 3.8 | PID HES HEY PATHWAY | Notch-mediated HES/HEY network |
| 0.1 | 0.9 | PID EPHA2 FWD PATHWAY | EPHA2 forward signaling |
| 0.1 | 0.4 | ST TYPE I INTERFERON PATHWAY | Type I Interferon (alpha/beta IFN) Pathway |
| 0.1 | 0.8 | PID ERB GENOMIC PATHWAY | Validated nuclear estrogen receptor beta network |
| 0.1 | 3.6 | PID RHOA REG PATHWAY | Regulation of RhoA activity |
| 0.1 | 0.7 | PID FGF PATHWAY | FGF signaling pathway |
| 0.1 | 0.8 | PID SMAD2 3PATHWAY | Regulation of cytoplasmic and nuclear SMAD2/3 signaling |
| 0.1 | 0.2 | PID IL2 1PATHWAY | IL2-mediated signaling events |
| 0.1 | 2.1 | PID TNF PATHWAY | TNF receptor signaling pathway |
| 0.1 | 0.6 | PID AR NONGENOMIC PATHWAY | Nongenotropic Androgen signaling |
| 0.1 | 1.4 | PID WNT SIGNALING PATHWAY | Wnt signaling network |
| 0.1 | 0.8 | ST B CELL ANTIGEN RECEPTOR | B Cell Antigen Receptor |
| 0.1 | 1.1 | PID GMCSF PATHWAY | GMCSF-mediated signaling events |
| 0.1 | 0.6 | ST WNT CA2 CYCLIC GMP PATHWAY | Wnt/Ca2+/cyclic GMP signaling. |
| 0.1 | 0.5 | ST STAT3 PATHWAY | STAT3 Pathway |
| 0.1 | 1.2 | PID CD40 PATHWAY | CD40/CD40L signaling |
| 0.1 | 1.0 | PID GLYPICAN 1PATHWAY | Glypican 1 network |
| 0.1 | 1.3 | ST JNK MAPK PATHWAY | JNK MAPK Pathway |
| 0.1 | 0.3 | SA PROGRAMMED CELL DEATH | Programmed cell death, or apoptosis, eliminates damaged or unneeded cells. |
| 0.1 | 1.0 | ST T CELL SIGNAL TRANSDUCTION | T Cell Signal Transduction |
| 0.1 | 0.5 | PID NECTIN PATHWAY | Nectin adhesion pathway |
| 0.1 | 1.1 | ST WNT BETA CATENIN PATHWAY | Wnt/beta-catenin Pathway |
| 0.1 | 1.0 | PID MYC PATHWAY | C-MYC pathway |
| 0.1 | 0.9 | PID HEDGEHOG 2PATHWAY | Signaling events mediated by the Hedgehog family |
| 0.1 | 0.4 | PID PI3K PLC TRK PATHWAY | Trk receptor signaling mediated by PI3K and PLC-gamma |
| 0.0 | 6.8 | NABA ECM AFFILIATED | Genes encoding proteins affiliated structurally or functionally to extracellular matrix proteins |
| 0.0 | 0.3 | PID ANTHRAX PATHWAY | Cellular roles of Anthrax toxin |
| 0.0 | 1.2 | PID P73PATHWAY | p73 transcription factor network |
| 0.0 | 1.3 | PID KIT PATHWAY | Signaling events mediated by Stem cell factor receptor (c-Kit) |
| 0.0 | 1.3 | PID IL12 2PATHWAY | IL12-mediated signaling events |
| 0.0 | 0.5 | PID ARF6 DOWNSTREAM PATHWAY | Arf6 downstream pathway |
| 0.0 | 1.5 | PID P75 NTR PATHWAY | p75(NTR)-mediated signaling |
| 0.0 | 0.8 | PID FRA PATHWAY | Validated transcriptional targets of AP1 family members Fra1 and Fra2 |
| 0.0 | 0.7 | PID CDC42 REG PATHWAY | Regulation of CDC42 activity |
| 0.0 | 1.6 | PID ECADHERIN STABILIZATION PATHWAY | Stabilization and expansion of the E-cadherin adherens junction |
| 0.0 | 0.3 | PID IL2 PI3K PATHWAY | IL2 signaling events mediated by PI3K |
| 0.0 | 0.2 | PID FAS PATHWAY | FAS (CD95) signaling pathway |
| 0.0 | 0.8 | PID ARF6 PATHWAY | Arf6 signaling events |
| 0.0 | 0.7 | PID TGFBR PATHWAY | TGF-beta receptor signaling |
| 0.0 | 0.7 | PID REG GR PATHWAY | Glucocorticoid receptor regulatory network |
| 0.0 | 0.6 | PID ERBB1 INTERNALIZATION PATHWAY | Internalization of ErbB1 |
| 0.0 | 0.1 | SA REG CASCADE OF CYCLIN EXPR | Expression of cyclins regulates progression through the cell cycle by activating cyclin-dependent kinases. |
| 0.0 | 0.0 | ST TUMOR NECROSIS FACTOR PATHWAY | Tumor Necrosis Factor Pathway. |
| 0.0 | 0.2 | PID ANGIOPOIETIN RECEPTOR PATHWAY | Angiopoietin receptor Tie2-mediated signaling |
| 0.0 | 0.4 | PID HDAC CLASSIII PATHWAY | Signaling events mediated by HDAC Class III |
| 0.0 | 0.3 | PID FCER1 PATHWAY | Fc-epsilon receptor I signaling in mast cells |
| 0.0 | 0.5 | PID BCR 5PATHWAY | BCR signaling pathway |
| 0.0 | 1.2 | WNT SIGNALING | Genes related to Wnt-mediated signal transduction |
| 0.0 | 0.5 | PID ARF6 TRAFFICKING PATHWAY | Arf6 trafficking events |
| 0.0 | 1.1 | PID MYC REPRESS PATHWAY | Validated targets of C-MYC transcriptional repression |
| 0.0 | 0.2 | PID SHP2 PATHWAY | SHP2 signaling |
| 0.0 | 0.9 | PID ATM PATHWAY | ATM pathway |
| 0.0 | 0.7 | PID CDC42 PATHWAY | CDC42 signaling events |
| 0.0 | 0.3 | PID VEGFR1 2 PATHWAY | Signaling events mediated by VEGFR1 and VEGFR2 |
| 0.0 | 0.5 | PID CXCR4 PATHWAY | CXCR4-mediated signaling events |
| 0.0 | 0.3 | PID AVB3 INTEGRIN PATHWAY | Integrins in angiogenesis |
| 0.0 | 0.2 | PID ARF 3PATHWAY | Arf1 pathway |
| 0.0 | 0.1 | PID SYNDECAN 3 PATHWAY | Syndecan-3-mediated signaling events |
| 0.0 | 0.3 | PID DELTA NP63 PATHWAY | Validated transcriptional targets of deltaNp63 isoforms |
| 0.0 | 0.2 | PID FAK PATHWAY | Signaling events mediated by focal adhesion kinase |
| 0.0 | 0.2 | PID TOLL ENDOGENOUS PATHWAY | Endogenous TLR signaling |
| 0.0 | 0.2 | PID NFAT TFPATHWAY | Calcineurin-regulated NFAT-dependent transcription in lymphocytes |
| 0.0 | 0.2 | PID MET PATHWAY | Signaling events mediated by Hepatocyte Growth Factor Receptor (c-Met) |
| 0.0 | 0.2 | PID BARD1 PATHWAY | BARD1 signaling events |
| 0.0 | 0.3 | PID PDGFRB PATHWAY | PDGFR-beta signaling pathway |
| 0.0 | 0.2 | PID HEDGEHOG GLI PATHWAY | Hedgehog signaling events mediated by Gli proteins |
| 0.0 | 0.2 | PID HDAC CLASSII PATHWAY | Signaling events mediated by HDAC Class II |
| 0.0 | 0.1 | PID HNF3A PATHWAY | FOXA1 transcription factor network |
| 0.0 | 0.4 | PID TELOMERASE PATHWAY | Regulation of Telomerase |
| 0.0 | 0.3 | PID AP1 PATHWAY | AP-1 transcription factor network |
Gene overrepresentation in curated gene sets: REACTOME pathways category:
| Log-likelihood per target | Total log-likelihood | Term | Description |
|---|---|---|---|
| 0.4 | 3.7 | REACTOME REGULATION OF INSULIN SECRETION BY ACETYLCHOLINE | Genes involved in Regulation of Insulin Secretion by Acetylcholine |
| 0.3 | 4.8 | REACTOME DOPAMINE NEUROTRANSMITTER RELEASE CYCLE | Genes involved in Dopamine Neurotransmitter Release Cycle |
| 0.3 | 4.9 | REACTOME ACTIVATION OF THE AP1 FAMILY OF TRANSCRIPTION FACTORS | Genes involved in Activation of the AP-1 family of transcription factors |
| 0.3 | 6.7 | REACTOME SIGNALING BY HIPPO | Genes involved in Signaling by Hippo |
| 0.3 | 4.5 | REACTOME N GLYCAN ANTENNAE ELONGATION | Genes involved in N-Glycan antennae elongation |
| 0.2 | 5.7 | REACTOME DOWNREGULATION OF SMAD2 3 SMAD4 TRANSCRIPTIONAL ACTIVITY | Genes involved in Downregulation of SMAD2/3:SMAD4 transcriptional activity |
| 0.2 | 4.0 | REACTOME OTHER SEMAPHORIN INTERACTIONS | Genes involved in Other semaphorin interactions |
| 0.2 | 3.5 | REACTOME CRMPS IN SEMA3A SIGNALING | Genes involved in CRMPs in Sema3A signaling |
| 0.2 | 4.5 | REACTOME PKA MEDIATED PHOSPHORYLATION OF CREB | Genes involved in PKA-mediated phosphorylation of CREB |
| 0.2 | 2.9 | REACTOME JNK C JUN KINASES PHOSPHORYLATION AND ACTIVATION MEDIATED BY ACTIVATED HUMAN TAK1 | Genes involved in JNK (c-Jun kinases) phosphorylation and activation mediated by activated human TAK1 |
| 0.2 | 2.4 | REACTOME SIGNAL ATTENUATION | Genes involved in Signal attenuation |
| 0.2 | 2.5 | REACTOME IL 7 SIGNALING | Genes involved in Interleukin-7 signaling |
| 0.2 | 1.8 | REACTOME PLATELET ADHESION TO EXPOSED COLLAGEN | Genes involved in Platelet Adhesion to exposed collagen |
| 0.2 | 2.5 | REACTOME GABA A RECEPTOR ACTIVATION | Genes involved in GABA A receptor activation |
| 0.2 | 5.1 | REACTOME SYNTHESIS OF PIPS AT THE PLASMA MEMBRANE | Genes involved in Synthesis of PIPs at the plasma membrane |
| 0.1 | 1.4 | REACTOME PECAM1 INTERACTIONS | Genes involved in PECAM1 interactions |
| 0.1 | 0.8 | REACTOME REGULATION OF SIGNALING BY CBL | Genes involved in Regulation of signaling by CBL |
| 0.1 | 2.6 | REACTOME ERK MAPK TARGETS | Genes involved in ERK/MAPK targets |
| 0.1 | 0.9 | REACTOME SIGNAL REGULATORY PROTEIN SIRP FAMILY INTERACTIONS | Genes involved in Signal regulatory protein (SIRP) family interactions |
| 0.1 | 5.5 | REACTOME NCAM1 INTERACTIONS | Genes involved in NCAM1 interactions |
| 0.1 | 0.4 | REACTOME SPRY REGULATION OF FGF SIGNALING | Genes involved in Spry regulation of FGF signaling |
| 0.1 | 0.5 | REACTOME DESTABILIZATION OF MRNA BY BRF1 | Genes involved in Destabilization of mRNA by Butyrate Response Factor 1 (BRF1) |
| 0.1 | 2.5 | REACTOME NEPHRIN INTERACTIONS | Genes involved in Nephrin interactions |
| 0.1 | 6.2 | REACTOME NRAGE SIGNALS DEATH THROUGH JNK | Genes involved in NRAGE signals death through JNK |
| 0.1 | 2.2 | REACTOME NCAM SIGNALING FOR NEURITE OUT GROWTH | Genes involved in NCAM signaling for neurite out-growth |
| 0.1 | 1.4 | REACTOME ROLE OF DCC IN REGULATING APOPTOSIS | Genes involved in Role of DCC in regulating apoptosis |
| 0.1 | 1.8 | REACTOME DCC MEDIATED ATTRACTIVE SIGNALING | Genes involved in DCC mediated attractive signaling |
| 0.1 | 2.2 | REACTOME CREB PHOSPHORYLATION THROUGH THE ACTIVATION OF RAS | Genes involved in CREB phosphorylation through the activation of Ras |
| 0.1 | 2.1 | REACTOME PLC BETA MEDIATED EVENTS | Genes involved in PLC beta mediated events |
| 0.1 | 1.0 | REACTOME RECEPTOR LIGAND BINDING INITIATES THE SECOND PROTEOLYTIC CLEAVAGE OF NOTCH RECEPTOR | Genes involved in Receptor-ligand binding initiates the second proteolytic cleavage of Notch receptor |
| 0.1 | 2.2 | REACTOME EGFR DOWNREGULATION | Genes involved in EGFR downregulation |
| 0.1 | 1.1 | REACTOME CTNNB1 PHOSPHORYLATION CASCADE | Genes involved in Beta-catenin phosphorylation cascade |
| 0.1 | 2.5 | REACTOME MYOGENESIS | Genes involved in Myogenesis |
| 0.1 | 2.9 | REACTOME KINESINS | Genes involved in Kinesins |
| 0.1 | 1.2 | REACTOME GLUTAMATE NEUROTRANSMITTER RELEASE CYCLE | Genes involved in Glutamate Neurotransmitter Release Cycle |
| 0.1 | 3.9 | REACTOME COLLAGEN FORMATION | Genes involved in Collagen formation |
| 0.1 | 1.8 | REACTOME DESTABILIZATION OF MRNA BY KSRP | Genes involved in Destabilization of mRNA by KSRP |
| 0.1 | 3.0 | REACTOME GAB1 SIGNALOSOME | Genes involved in GAB1 signalosome |
| 0.1 | 1.4 | REACTOME GABA SYNTHESIS RELEASE REUPTAKE AND DEGRADATION | Genes involved in GABA synthesis, release, reuptake and degradation |
| 0.1 | 2.4 | REACTOME EFFECTS OF PIP2 HYDROLYSIS | Genes involved in Effects of PIP2 hydrolysis |
| 0.1 | 0.7 | REACTOME SYNTHESIS OF BILE ACIDS AND BILE SALTS VIA 24 HYDROXYCHOLESTEROL | Genes involved in Synthesis of bile acids and bile salts via 24-hydroxycholesterol |
| 0.1 | 0.6 | REACTOME TAK1 ACTIVATES NFKB BY PHOSPHORYLATION AND ACTIVATION OF IKKS COMPLEX | Genes involved in TAK1 activates NFkB by phosphorylation and activation of IKKs complex |
| 0.1 | 0.2 | REACTOME INHIBITION OF REPLICATION INITIATION OF DAMAGED DNA BY RB1 E2F1 | Genes involved in Inhibition of replication initiation of damaged DNA by RB1/E2F1 |
| 0.1 | 0.5 | REACTOME IRAK1 RECRUITS IKK COMPLEX | Genes involved in IRAK1 recruits IKK complex |
| 0.1 | 0.8 | REACTOME THE ACTIVATION OF ARYLSULFATASES | Genes involved in The activation of arylsulfatases |
| 0.1 | 2.0 | REACTOME TRANSPORT TO THE GOLGI AND SUBSEQUENT MODIFICATION | Genes involved in Transport to the Golgi and subsequent modification |
| 0.1 | 1.7 | REACTOME A TETRASACCHARIDE LINKER SEQUENCE IS REQUIRED FOR GAG SYNTHESIS | Genes involved in A tetrasaccharide linker sequence is required for GAG synthesis |
| 0.1 | 0.1 | REACTOME TRANSPORT OF MATURE MRNA DERIVED FROM AN INTRONLESS TRANSCRIPT | Genes involved in Transport of Mature mRNA Derived from an Intronless Transcript |
| 0.1 | 2.9 | REACTOME SIGNALING BY ROBO RECEPTOR | Genes involved in Signaling by Robo receptor |
| 0.1 | 1.4 | REACTOME INSULIN SYNTHESIS AND PROCESSING | Genes involved in Insulin Synthesis and Processing |
| 0.1 | 1.4 | REACTOME ZINC TRANSPORTERS | Genes involved in Zinc transporters |
| 0.1 | 0.1 | REACTOME ACYL CHAIN REMODELLING OF PG | Genes involved in Acyl chain remodelling of PG |
| 0.1 | 0.2 | REACTOME ALPHA LINOLENIC ACID ALA METABOLISM | Genes involved in alpha-linolenic acid (ALA) metabolism |
| 0.1 | 0.6 | REACTOME NEF MEDIATED DOWNREGULATION OF MHC CLASS I COMPLEX CELL SURFACE EXPRESSION | Genes involved in Nef mediated downregulation of MHC class I complex cell surface expression |
| 0.1 | 1.3 | REACTOME SIGNALING BY FGFR1 FUSION MUTANTS | Genes involved in Signaling by FGFR1 fusion mutants |
| 0.1 | 1.6 | REACTOME EXTRACELLULAR MATRIX ORGANIZATION | Genes involved in Extracellular matrix organization |
| 0.1 | 1.3 | REACTOME NETRIN1 SIGNALING | Genes involved in Netrin-1 signaling |
| 0.1 | 1.3 | REACTOME PI METABOLISM | Genes involved in PI Metabolism |
| 0.1 | 0.6 | REACTOME RAP1 SIGNALLING | Genes involved in Rap1 signalling |
| 0.1 | 0.1 | REACTOME PHOSPHORYLATION OF THE APC C | Genes involved in Phosphorylation of the APC/C |
| 0.1 | 0.4 | REACTOME GAP JUNCTION DEGRADATION | Genes involved in Gap junction degradation |
| 0.1 | 0.6 | REACTOME REGULATION OF IFNA SIGNALING | Genes involved in Regulation of IFNA signaling |
| 0.1 | 0.8 | REACTOME INTRINSIC PATHWAY | Genes involved in Intrinsic Pathway |
| 0.1 | 0.9 | REACTOME PROTEOLYTIC CLEAVAGE OF SNARE COMPLEX PROTEINS | Genes involved in Proteolytic cleavage of SNARE complex proteins |
| 0.1 | 0.2 | REACTOME P75NTR RECRUITS SIGNALLING COMPLEXES | Genes involved in p75NTR recruits signalling complexes |
| 0.1 | 0.2 | REACTOME IL 6 SIGNALING | Genes involved in Interleukin-6 signaling |
| 0.1 | 1.3 | REACTOME RORA ACTIVATES CIRCADIAN EXPRESSION | Genes involved in RORA Activates Circadian Expression |
| 0.1 | 0.1 | REACTOME ACYL CHAIN REMODELLING OF PE | Genes involved in Acyl chain remodelling of PE |
| 0.1 | 0.1 | REACTOME CONVERSION FROM APC C CDC20 TO APC C CDH1 IN LATE ANAPHASE | Genes involved in Conversion from APC/C:Cdc20 to APC/C:Cdh1 in late anaphase |
| 0.1 | 0.4 | REACTOME CD28 DEPENDENT PI3K AKT SIGNALING | Genes involved in CD28 dependent PI3K/Akt signaling |
| 0.1 | 1.2 | REACTOME PROCESSING OF INTRONLESS PRE MRNAS | Genes involved in Processing of Intronless Pre-mRNAs |
| 0.1 | 1.0 | REACTOME HS GAG BIOSYNTHESIS | Genes involved in HS-GAG biosynthesis |
| 0.1 | 0.7 | REACTOME IONOTROPIC ACTIVITY OF KAINATE RECEPTORS | Genes involved in Ionotropic activity of Kainate Receptors |
| 0.1 | 2.6 | REACTOME NOTCH1 INTRACELLULAR DOMAIN REGULATES TRANSCRIPTION | Genes involved in NOTCH1 Intracellular Domain Regulates Transcription |
| 0.1 | 1.1 | REACTOME CIRCADIAN CLOCK | Genes involved in Circadian Clock |
| 0.1 | 1.5 | REACTOME RNA POL I TRANSCRIPTION INITIATION | Genes involved in RNA Polymerase I Transcription Initiation |
| 0.1 | 0.2 | REACTOME RNA POL III TRANSCRIPTION TERMINATION | Genes involved in RNA Polymerase III Transcription Termination |
| 0.1 | 0.7 | REACTOME VITAMIN B5 PANTOTHENATE METABOLISM | Genes involved in Vitamin B5 (pantothenate) metabolism |
| 0.1 | 1.2 | REACTOME PEROXISOMAL LIPID METABOLISM | Genes involved in Peroxisomal lipid metabolism |
| 0.1 | 0.5 | REACTOME VEGF LIGAND RECEPTOR INTERACTIONS | Genes involved in VEGF ligand-receptor interactions |
| 0.0 | 0.8 | REACTOME DEADENYLATION OF MRNA | Genes involved in Deadenylation of mRNA |
| 0.0 | 1.8 | REACTOME INTERFERON ALPHA BETA SIGNALING | Genes involved in Interferon alpha/beta signaling |
| 0.0 | 0.8 | REACTOME TRAFFICKING OF AMPA RECEPTORS | Genes involved in Trafficking of AMPA receptors |
| 0.0 | 0.5 | REACTOME TRAF3 DEPENDENT IRF ACTIVATION PATHWAY | Genes involved in TRAF3-dependent IRF activation pathway |
| 0.0 | 0.1 | REACTOME FGFR4 LIGAND BINDING AND ACTIVATION | Genes involved in FGFR4 ligand binding and activation |
| 0.0 | 0.1 | REACTOME DESTABILIZATION OF MRNA BY AUF1 HNRNP D0 | Genes involved in Destabilization of mRNA by AUF1 (hnRNP D0) |
| 0.0 | 0.9 | REACTOME P75 NTR RECEPTOR MEDIATED SIGNALLING | Genes involved in p75 NTR receptor-mediated signalling |
| 0.0 | 0.4 | REACTOME MRNA DECAY BY 5 TO 3 EXORIBONUCLEASE | Genes involved in mRNA Decay by 5' to 3' Exoribonuclease |
| 0.0 | 0.0 | REACTOME NEP NS2 INTERACTS WITH THE CELLULAR EXPORT MACHINERY | Genes involved in NEP/NS2 Interacts with the Cellular Export Machinery |
| 0.0 | 0.3 | REACTOME G ALPHA Z SIGNALLING EVENTS | Genes involved in G alpha (z) signalling events |
| 0.0 | 0.0 | REACTOME SIGNALLING BY NGF | Genes involved in Signalling by NGF |
| 0.0 | 0.0 | REACTOME THE ROLE OF NEF IN HIV1 REPLICATION AND DISEASE PATHOGENESIS | Genes involved in The role of Nef in HIV-1 replication and disease pathogenesis |
| 0.0 | 0.3 | REACTOME PURINE CATABOLISM | Genes involved in Purine catabolism |
| 0.0 | 2.1 | REACTOME ANTIVIRAL MECHANISM BY IFN STIMULATED GENES | Genes involved in Antiviral mechanism by IFN-stimulated genes |
| 0.0 | 0.3 | REACTOME REGULATION OF RHEB GTPASE ACTIVITY BY AMPK | Genes involved in Regulation of Rheb GTPase activity by AMPK |
| 0.0 | 0.8 | REACTOME RNA POL III TRANSCRIPTION INITIATION FROM TYPE 2 PROMOTER | Genes involved in RNA Polymerase III Transcription Initiation From Type 2 Promoter |
| 0.0 | 0.1 | REACTOME HORMONE SENSITIVE LIPASE HSL MEDIATED TRIACYLGLYCEROL HYDROLYSIS | Genes involved in Hormone-sensitive lipase (HSL)-mediated triacylglycerol hydrolysis |
| 0.0 | 0.1 | REACTOME SIGNALING BY ERBB2 | Genes involved in Signaling by ERBB2 |
| 0.0 | 0.4 | REACTOME SIGNALING BY SCF KIT | Genes involved in Signaling by SCF-KIT |
| 0.0 | 0.0 | REACTOME ACTIVATION OF NMDA RECEPTOR UPON GLUTAMATE BINDING AND POSTSYNAPTIC EVENTS | Genes involved in Activation of NMDA receptor upon glutamate binding and postsynaptic events |
| 0.0 | 0.1 | REACTOME ACTIVATED TAK1 MEDIATES P38 MAPK ACTIVATION | Genes involved in activated TAK1 mediates p38 MAPK activation |
| 0.0 | 0.2 | REACTOME ACTIVATION OF BH3 ONLY PROTEINS | Genes involved in Activation of BH3-only proteins |
| 0.0 | 0.4 | REACTOME ACTIVATION OF CHAPERONES BY ATF6 ALPHA | Genes involved in Activation of Chaperones by ATF6-alpha |
| 0.0 | 0.6 | REACTOME SMOOTH MUSCLE CONTRACTION | Genes involved in Smooth Muscle Contraction |
| 0.0 | 0.4 | REACTOME SEMA4D INDUCED CELL MIGRATION AND GROWTH CONE COLLAPSE | Genes involved in Sema4D induced cell migration and growth-cone collapse |
| 0.0 | 0.3 | REACTOME HIGHLY CALCIUM PERMEABLE POSTSYNAPTIC NICOTINIC ACETYLCHOLINE RECEPTORS | Genes involved in Highly calcium permeable postsynaptic nicotinic acetylcholine receptors |
| 0.0 | 2.4 | REACTOME SIGNALING BY RHO GTPASES | Genes involved in Signaling by Rho GTPases |
| 0.0 | 0.5 | REACTOME INFLAMMASOMES | Genes involved in Inflammasomes |
| 0.0 | 0.3 | REACTOME TERMINATION OF O GLYCAN BIOSYNTHESIS | Genes involved in Termination of O-glycan biosynthesis |
| 0.0 | 0.2 | REACTOME ORGANIC CATION ANION ZWITTERION TRANSPORT | Genes involved in Organic cation/anion/zwitterion transport |
| 0.0 | 0.6 | REACTOME CYTOSOLIC TRNA AMINOACYLATION | Genes involved in Cytosolic tRNA aminoacylation |
| 0.0 | 0.9 | REACTOME INWARDLY RECTIFYING K CHANNELS | Genes involved in Inwardly rectifying K+ channels |
| 0.0 | 0.3 | REACTOME NA CL DEPENDENT NEUROTRANSMITTER TRANSPORTERS | Genes involved in Na+/Cl- dependent neurotransmitter transporters |
| 0.0 | 0.2 | REACTOME PD1 SIGNALING | Genes involved in PD-1 signaling |
| 0.0 | 0.2 | REACTOME COSTIMULATION BY THE CD28 FAMILY | Genes involved in Costimulation by the CD28 family |
| 0.0 | 0.0 | REACTOME MRNA DECAY BY 3 TO 5 EXORIBONUCLEASE | Genes involved in mRNA Decay by 3' to 5' Exoribonuclease |
| 0.0 | 0.2 | REACTOME NUCLEOTIDE LIKE PURINERGIC RECEPTORS | Genes involved in Nucleotide-like (purinergic) receptors |
| 0.0 | 0.3 | REACTOME ANTIGEN ACTIVATES B CELL RECEPTOR LEADING TO GENERATION OF SECOND MESSENGERS | Genes involved in Antigen Activates B Cell Receptor Leading to Generation of Second Messengers |
| 0.0 | 0.9 | REACTOME CHEMOKINE RECEPTORS BIND CHEMOKINES | Genes involved in Chemokine receptors bind chemokines |
| 0.0 | 0.2 | REACTOME RECRUITMENT OF NUMA TO MITOTIC CENTROSOMES | Genes involved in Recruitment of NuMA to mitotic centrosomes |
| 0.0 | 0.1 | REACTOME MEMBRANE BINDING AND TARGETTING OF GAG PROTEINS | Genes involved in Membrane binding and targetting of GAG proteins |
| 0.0 | 0.1 | REACTOME AUTODEGRADATION OF THE E3 UBIQUITIN LIGASE COP1 | Genes involved in Autodegradation of the E3 ubiquitin ligase COP1 |
| 0.0 | 0.0 | REACTOME APC C CDC20 MEDIATED DEGRADATION OF MITOTIC PROTEINS | Genes involved in APC/C:Cdc20 mediated degradation of mitotic proteins |
| 0.0 | 0.3 | REACTOME GLYCOGEN BREAKDOWN GLYCOGENOLYSIS | Genes involved in Glycogen breakdown (glycogenolysis) |
| 0.0 | 0.4 | REACTOME PYRIMIDINE METABOLISM | Genes involved in Pyrimidine metabolism |
| 0.0 | 0.2 | REACTOME REGULATION OF PYRUVATE DEHYDROGENASE PDH COMPLEX | Genes involved in Regulation of pyruvate dehydrogenase (PDH) complex |
| 0.0 | 0.1 | REACTOME METAL ION SLC TRANSPORTERS | Genes involved in Metal ion SLC transporters |
| 0.0 | 0.1 | REACTOME DOWNREGULATION OF ERBB2 ERBB3 SIGNALING | Genes involved in Downregulation of ERBB2:ERBB3 signaling |
| 0.0 | 0.2 | REACTOME SYNTHESIS OF SUBSTRATES IN N GLYCAN BIOSYTHESIS | Genes involved in Synthesis of substrates in N-glycan biosythesis |
| 0.0 | 0.0 | REACTOME G2 M CHECKPOINTS | Genes involved in G2/M Checkpoints |
| 0.0 | 0.7 | REACTOME FACTORS INVOLVED IN MEGAKARYOCYTE DEVELOPMENT AND PLATELET PRODUCTION | Genes involved in Factors involved in megakaryocyte development and platelet production |
| 0.0 | 0.6 | REACTOME INTEGRIN CELL SURFACE INTERACTIONS | Genes involved in Integrin cell surface interactions |
| 0.0 | 0.6 | REACTOME VOLTAGE GATED POTASSIUM CHANNELS | Genes involved in Voltage gated Potassium channels |
| 0.0 | 0.2 | REACTOME PROCESSIVE SYNTHESIS ON THE LAGGING STRAND | Genes involved in Processive synthesis on the lagging strand |
| 0.0 | 0.4 | REACTOME O LINKED GLYCOSYLATION OF MUCINS | Genes involved in O-linked glycosylation of mucins |
| 0.0 | 0.1 | REACTOME SYNTHESIS SECRETION AND INACTIVATION OF GLP1 | Genes involved in Synthesis, Secretion, and Inactivation of Glucagon-like Peptide-1 (GLP-1) |
| 0.0 | 0.1 | REACTOME HYALURONAN UPTAKE AND DEGRADATION | Genes involved in Hyaluronan uptake and degradation |
| 0.0 | 0.9 | REACTOME CLASS B 2 SECRETIN FAMILY RECEPTORS | Genes involved in Class B/2 (Secretin family receptors) |