Project
GSE49485: Hypoxia transcriptome sequencing of rat brain.
Navigation
Downloads
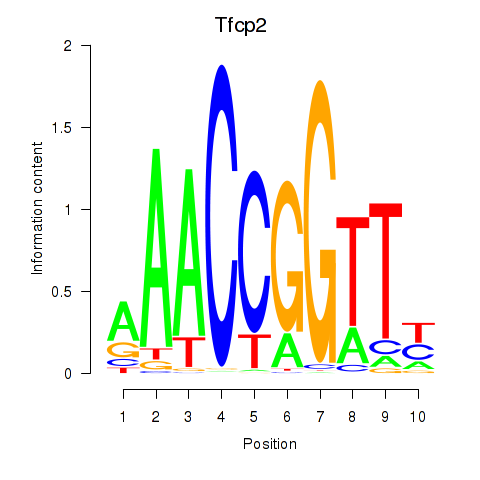
Results for Tfcp2
Z-value: 0.43
Motif logo
Transcription factors associated with Tfcp2
| Gene Symbol | Gene ID | Gene Info |
|---|---|---|
|
Tfcp2
|
ENSRNOG00000032395 | transcription factor CP2 |
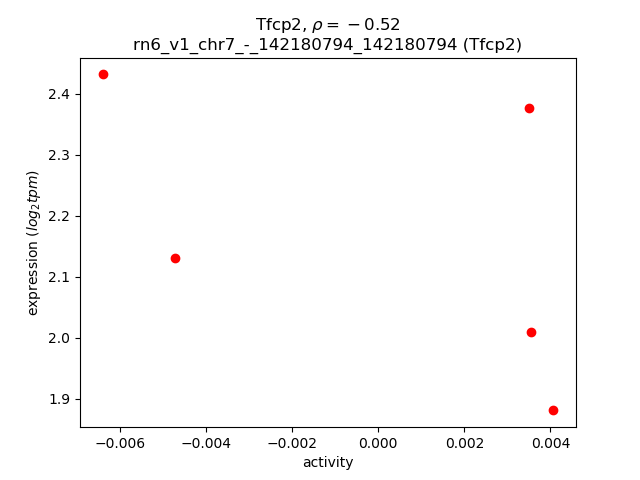
Activity-expression correlation:
| Gene | Promoter | Pearson corr. coef. | P-value | Plot |
|---|---|---|---|---|
| Tfcp2 | rn6_v1_chr7_-_142180794_142180794 | -0.52 | 3.7e-01 | Click! |
Activity profile of Tfcp2 motif
Sorted Z-values of Tfcp2 motif
| Promoter | Log-likelihood | Transcript | Gene | Gene Info |
|---|---|---|---|---|
| chr11_-_36479868 | 0.38 |
ENSRNOT00000075762
|
LOC100911295
|
non-histone chromosomal protein HMG-14-like |
| chr4_-_124113242 | 0.29 |
ENSRNOT00000015944
|
Trh
|
thyrotropin releasing hormone |
| chr11_+_39482408 | 0.22 |
ENSRNOT00000075126
|
Hmgn1
|
high mobility group nucleosome binding domain 1 |
| chr5_+_8459660 | 0.20 |
ENSRNOT00000007491
|
Cpa6
|
carboxypeptidase A6 |
| chr1_+_168957460 | 0.17 |
ENSRNOT00000090745
|
LOC103694857
|
hemoglobin subunit beta-2 |
| chr3_-_5510908 | 0.13 |
ENSRNOT00000042289
|
Rexo4
|
REX4 homolog, 3'-5' exonuclease |
| chr11_+_33812662 | 0.12 |
ENSRNOT00000085961
|
LOC102556347
|
carbonyl reductase [NADPH] 1-like |
| chr11_+_33812989 | 0.12 |
ENSRNOT00000042283
ENSRNOT00000075985 |
Cbr1
|
carbonyl reductase 1 |
| chr1_+_170262156 | 0.11 |
ENSRNOT00000024077
ENSRNOT00000085395 |
Cckbr
|
cholecystokinin B receptor |
| chr20_+_5050327 | 0.11 |
ENSRNOT00000083353
|
Ddah2
|
dimethylarginine dimethylaminohydrolase 2 |
| chr7_-_140580783 | 0.10 |
ENSRNOT00000087327
|
Dhh
|
desert hedgehog |
| chr20_+_5049496 | 0.10 |
ENSRNOT00000088251
ENSRNOT00000001118 |
Ddah2
|
dimethylarginine dimethylaminohydrolase 2 |
| chr10_+_105500290 | 0.10 |
ENSRNOT00000079080
ENSRNOT00000083593 |
Sphk1
|
sphingosine kinase 1 |
| chr4_+_168832910 | 0.10 |
ENSRNOT00000011134
|
Gprc5a
|
G protein-coupled receptor, class C, group 5, member A |
| chr8_-_108261021 | 0.09 |
ENSRNOT00000040710
|
LOC100912210
|
40S ribosomal protein S25-like |
| chr6_+_123361864 | 0.09 |
ENSRNOT00000057577
|
AABR07065353.1
|
|
| chr2_+_196277978 | 0.09 |
ENSRNOT00000028625
|
Vps72
|
vacuolar protein sorting 72 homolog |
| chr2_+_196334626 | 0.08 |
ENSRNOT00000050914
ENSRNOT00000028645 ENSRNOT00000090729 |
Sema6c
|
semaphorin 6C |
| chr7_-_107385528 | 0.08 |
ENSRNOT00000093352
|
Tmem71
|
transmembrane protein 71 |
| chr20_-_4879779 | 0.08 |
ENSRNOT00000081924
|
Hspa1b
|
heat shock protein family A (Hsp70) member 1B |
| chr3_+_103747654 | 0.08 |
ENSRNOT00000006887
|
Nop10
|
NOP10 ribonucleoprotein |
| chr5_-_134927235 | 0.07 |
ENSRNOT00000016751
|
Uqcrh
|
ubiquinol-cytochrome c reductase hinge protein |
| chr4_-_181477281 | 0.07 |
ENSRNOT00000055463
|
Mansc4
|
MANSC domain containing 4 |
| chr1_-_199177365 | 0.07 |
ENSRNOT00000041840
|
Ctf2
|
cardiotrophin 2 |
| chr2_-_144467912 | 0.07 |
ENSRNOT00000040002
|
Ccna1
|
cyclin A1 |
| chr7_-_145154131 | 0.07 |
ENSRNOT00000055271
|
Ppp1r1a
|
protein phosphatase 1, regulatory (inhibitor) subunit 1A |
| chr1_+_213991620 | 0.07 |
ENSRNOT00000038691
|
Rplp2
|
ribosomal protein lateral stalk subunit P2 |
| chr5_-_152198813 | 0.07 |
ENSRNOT00000082953
|
Hmgn2
|
high mobility group nucleosomal binding domain 2 |
| chr6_-_108415093 | 0.07 |
ENSRNOT00000031650
|
Syndig1l
|
synapse differentiation inducing 1-like |
| chr1_+_219345918 | 0.06 |
ENSRNOT00000025018
|
Cdk2ap2
|
cyclin-dependent kinase 2 associated protein 2 |
| chr6_+_42568220 | 0.06 |
ENSRNOT00000074829
|
Pdia6
|
protein disulfide isomerase family A, member 6 |
| chr9_+_61655963 | 0.06 |
ENSRNOT00000040461
|
Coq10b
|
coenzyme Q10B |
| chr3_+_79918969 | 0.06 |
ENSRNOT00000016306
|
Spi1
|
Spi-1 proto-oncogene |
| chr11_-_61530567 | 0.06 |
ENSRNOT00000076277
|
Naa50
|
N(alpha)-acetyltransferase 50, NatE catalytic subunit |
| chr18_-_61231515 | 0.06 |
ENSRNOT00000080159
|
AABR07032328.1
|
|
| chr1_+_69841998 | 0.06 |
ENSRNOT00000072231
|
Zfp773-ps1
|
zinc finger protein 773, pseudogene 1 |
| chr2_-_88135410 | 0.06 |
ENSRNOT00000014180
|
Car3
|
carbonic anhydrase 3 |
| chr2_-_251532312 | 0.06 |
ENSRNOT00000019501
|
Cyr61
|
cysteine-rich, angiogenic inducer, 61 |
| chrX_-_72133692 | 0.06 |
ENSRNOT00000004263
|
Cited1
|
Cbp/p300-interacting transactivator with Glu/Asp-rich carboxy-terminal domain 1 |
| chr20_+_48335540 | 0.05 |
ENSRNOT00000000352
|
Cd24
|
CD24 molecule |
| chr10_+_37069344 | 0.05 |
ENSRNOT00000073317
ENSRNOT00000090404 |
LOC103690013
|
H/ACA ribonucleoprotein complex subunit 2 |
| chr2_+_199199845 | 0.05 |
ENSRNOT00000020932
|
LOC100909441
|
tubulin alpha-1C chain-like |
| chr12_-_52644260 | 0.05 |
ENSRNOT00000073986
|
Plcxd1
|
phosphatidylinositol-specific phospholipase C, X domain containing 1 |
| chr17_-_32158538 | 0.05 |
ENSRNOT00000024141
|
Nqo2
|
NAD(P)H quinone dehydrogenase 2 |
| chr11_-_66759402 | 0.05 |
ENSRNOT00000003326
|
Hcls1
|
hematopoietic cell specific Lyn substrate 1 |
| chr1_+_166433109 | 0.05 |
ENSRNOT00000026428
|
Stard10
|
StAR-related lipid transfer domain containing 10 |
| chr1_-_252461461 | 0.05 |
ENSRNOT00000026093
|
Ankrd22
|
ankyrin repeat domain 22 |
| chr10_+_3218466 | 0.05 |
ENSRNOT00000093629
ENSRNOT00000093338 ENSRNOT00000077695 |
Ntan1
|
N-terminal asparagine amidase |
| chr14_+_108007724 | 0.05 |
ENSRNOT00000014062
|
Xpo1
|
exportin 1 |
| chr13_+_27465930 | 0.05 |
ENSRNOT00000003314
|
Serpinb10
|
serpin family B member 10 |
| chr12_+_2170630 | 0.04 |
ENSRNOT00000071928
|
Pet100
|
PET100 homolog |
| chrX_+_122808605 | 0.04 |
ENSRNOT00000017567
|
Zcchc12
|
zinc finger CCHC-type containing 12 |
| chr16_-_36161089 | 0.04 |
ENSRNOT00000017888
|
Scrg1
|
stimulator of chondrogenesis 1 |
| chrX_+_110789269 | 0.04 |
ENSRNOT00000086014
|
Rnf128
|
ring finger protein 128, E3 ubiquitin protein ligase |
| chr16_-_21338771 | 0.04 |
ENSRNOT00000014265
|
Pbx4
|
PBX homeobox 4 |
| chr7_+_93376277 | 0.04 |
ENSRNOT00000017602
|
LOC100359763
|
ribosomal protein S25-like |
| chr5_+_157434481 | 0.04 |
ENSRNOT00000088556
|
Tmco4
|
transmembrane and coiled-coil domains 4 |
| chr10_-_15200117 | 0.04 |
ENSRNOT00000026921
|
Stub1
|
STIP1 homology and U-box containing protein 1 |
| chr8_-_133002201 | 0.04 |
ENSRNOT00000008772
|
Ccr1
|
C-C motif chemokine receptor 1 |
| chr4_+_157453069 | 0.04 |
ENSRNOT00000088622
|
Mlf2
|
myeloid leukemia factor 2 |
| chr20_+_7788084 | 0.04 |
ENSRNOT00000000597
|
Def6
|
DEF6 guanine nucleotide exchange factor |
| chr11_-_81444375 | 0.04 |
ENSRNOT00000058479
ENSRNOT00000078131 ENSRNOT00000080949 ENSRNOT00000080562 ENSRNOT00000084867 |
Kng1
|
kininogen 1 |
| chr20_-_2224463 | 0.04 |
ENSRNOT00000001019
|
Trim26
|
tripartite motif-containing 26 |
| chr2_+_38230757 | 0.04 |
ENSRNOT00000048598
|
RGD1564606
|
similar to 60S ribosomal protein L23a |
| chr2_-_143931940 | 0.04 |
ENSRNOT00000086214
|
Exosc8
|
exosome component 8 |
| chr19_+_52217984 | 0.04 |
ENSRNOT00000079580
|
Dnaaf1
|
dynein, axonemal, assembly factor 1 |
| chr17_-_36438752 | 0.04 |
ENSRNOT00000048997
|
RGD1561310
|
similar to ribosomal protein L37 |
| chr6_+_34028936 | 0.04 |
ENSRNOT00000085797
|
Laptm4a
|
lysosomal protein transmembrane 4 alpha |
| chr10_+_62303662 | 0.04 |
ENSRNOT00000056355
|
Tlcd2
|
TLC domain containing 2 |
| chr1_+_214009986 | 0.04 |
ENSRNOT00000089241
|
LOC100911730
|
CD151 antigen-like |
| chr11_-_61530830 | 0.03 |
ENSRNOT00000059666
ENSRNOT00000068345 |
Naa50
|
N(alpha)-acetyltransferase 50, NatE catalytic subunit |
| chr10_+_92018562 | 0.03 |
ENSRNOT00000006483
|
Arf2
|
ADP-ribosylation factor 2 |
| chr3_-_72071895 | 0.03 |
ENSRNOT00000082857
|
Selenoh
|
selenoprotein H |
| chr1_+_184271590 | 0.03 |
ENSRNOT00000014764
|
Calcb
|
calcitonin-related polypeptide, beta |
| chr1_+_199196059 | 0.03 |
ENSRNOT00000090428
|
Fbxl19
|
F-box and leucine-rich repeat protein 19 |
| chr2_-_143931316 | 0.03 |
ENSRNOT00000081705
|
Exosc8
|
exosome component 8 |
| chr4_-_165522418 | 0.03 |
ENSRNOT00000064420
|
Magohb
|
mago homolog B, exon junction complex core component |
| chr1_+_214009784 | 0.03 |
ENSRNOT00000026079
|
LOC100911730
|
CD151 antigen-like |
| chr3_-_111941841 | 0.03 |
ENSRNOT00000010701
|
Ehd4
|
EH-domain containing 4 |
| chr20_-_12858096 | 0.03 |
ENSRNOT00000085270
|
Lss
|
lanosterol synthase (2,3-oxidosqualene-lanosterol cyclase) |
| chr6_-_103470427 | 0.03 |
ENSRNOT00000091560
ENSRNOT00000088795 ENSRNOT00000079824 |
Actn1
|
actinin, alpha 1 |
| chr6_-_47904163 | 0.03 |
ENSRNOT00000011333
|
Rps7
|
ribosomal protein S7 |
| chr7_-_126461658 | 0.03 |
ENSRNOT00000081032
|
Wnt7b
|
wingless-type MMTV integration site family, member 7B |
| chr8_+_13796021 | 0.03 |
ENSRNOT00000013927
|
Vstm5
|
V-set and transmembrane domain containing 5 |
| chr3_-_123206828 | 0.03 |
ENSRNOT00000030192
|
Ddrgk1
|
DDRGK domain containing 1 |
| chr11_+_86421106 | 0.03 |
ENSRNOT00000002599
|
LOC100362453
|
serine/threonine-protein phosphatase 2A catalytic subunit alpha-like |
| chr5_+_159967839 | 0.03 |
ENSRNOT00000051317
|
Hspb7
|
heat shock protein family B (small) member 7 |
| chr10_+_106828981 | 0.03 |
ENSRNOT00000073809
|
Afmid
|
arylformamidase |
| chrX_-_104932508 | 0.03 |
ENSRNOT00000075325
|
Nox1
|
NADPH oxidase 1 |
| chr10_-_34221928 | 0.03 |
ENSRNOT00000045545
|
Irgm
|
immunity-related GTPase M |
| chr15_-_46681467 | 0.03 |
ENSRNOT00000015353
|
Tdh
|
L-threonine dehydrogenase |
| chr4_-_147122060 | 0.03 |
ENSRNOT00000047694
|
AC128901.1
|
|
| chr7_-_12569110 | 0.03 |
ENSRNOT00000093446
ENSRNOT00000016733 |
Wdr18
|
WD repeat domain 18 |
| chr11_+_54619129 | 0.03 |
ENSRNOT00000059924
|
Trat1
|
T cell receptor associated transmembrane adaptor 1 |
| chr1_+_157646173 | 0.03 |
ENSRNOT00000013851
|
Rab30
|
RAB30, member RAS oncogene family |
| chr10_-_59112788 | 0.03 |
ENSRNOT00000041886
|
Spns3
|
SPNS sphingolipid transporter 3 |
| chr5_+_126856705 | 0.03 |
ENSRNOT00000057362
|
Hspb11
|
heat shock protein family B (small), member 11 |
| chr4_-_179307095 | 0.03 |
ENSRNOT00000021193
|
Bcat1
|
branched chain amino acid transaminase 1 |
| chr3_-_160573978 | 0.03 |
ENSRNOT00000018386
|
Wfdc5
|
WAP four-disulfide core domain 5 |
| chrX_-_111102464 | 0.03 |
ENSRNOT00000084176
|
Ripply1
|
ripply transcriptional repressor 1 |
| chr9_+_69790831 | 0.03 |
ENSRNOT00000045156
|
LOC100360781
|
ribosomal protein L37-like |
| chr1_+_22758212 | 0.03 |
ENSRNOT00000022184
|
Rps12
|
ribosomal protein S12 |
| chr3_-_137969658 | 0.03 |
ENSRNOT00000007727
|
Bfsp1
|
beaded filament structural protein 1 |
| chr12_-_29958050 | 0.03 |
ENSRNOT00000058725
|
Tmem248
|
transmembrane protein 248 |
| chr19_+_33083412 | 0.02 |
ENSRNOT00000016184
|
Rbmxl1
|
RNA binding motif protein, X-linked-like 1 |
| chr15_+_32894938 | 0.02 |
ENSRNOT00000012837
|
Abhd4
|
abhydrolase domain containing 4 |
| chr4_-_146839397 | 0.02 |
ENSRNOT00000010338
|
Vgll4
|
vestigial-like family member 4 |
| chr3_-_129884810 | 0.02 |
ENSRNOT00000009540
|
Mkks
|
McKusick-Kaufman syndrome |
| chr16_+_4997461 | 0.02 |
ENSRNOT00000071042
|
LOC102547963
|
leucine-rich repeat and transmembrane domain-containing protein 1-like |
| chr3_-_121836086 | 0.02 |
ENSRNOT00000006113
|
Il1a
|
interleukin 1 alpha |
| chr10_+_37582706 | 0.02 |
ENSRNOT00000007630
|
RGD1306484
|
similar to growth and transformation-dependent protein |
| chr10_-_109630005 | 0.02 |
ENSRNOT00000075206
|
Oxld1
|
oxidoreductase-like domain containing 1 |
| chr6_+_56846789 | 0.02 |
ENSRNOT00000032108
|
Agmo
|
alkylglycerol monooxygenase |
| chr10_+_40208223 | 0.02 |
ENSRNOT00000000772
|
Hint1
|
histidine triad nucleotide binding protein 1 |
| chr17_+_30617382 | 0.02 |
ENSRNOT00000048923
|
Eci2
|
enoyl-CoA delta isomerase 2 |
| chr4_-_168933079 | 0.02 |
ENSRNOT00000000025
|
Hebp1
|
heme binding protein 1 |
| chr13_+_104284660 | 0.02 |
ENSRNOT00000005400
|
Dusp10
|
dual specificity phosphatase 10 |
| chr2_+_240021152 | 0.02 |
ENSRNOT00000012473
|
Tacr3
|
tachykinin receptor 3 |
| chrX_+_112311251 | 0.02 |
ENSRNOT00000086698
|
AABR07040855.1
|
|
| chr15_+_38341089 | 0.02 |
ENSRNOT00000015367
|
Fgf9
|
fibroblast growth factor 9 |
| chr20_-_33323367 | 0.02 |
ENSRNOT00000080444
|
Ros1
|
ROS proto-oncogene 1 , receptor tyrosine kinase |
| chr7_+_130296897 | 0.02 |
ENSRNOT00000044854
|
Adm2
|
adrenomedullin 2 |
| chr17_-_69404323 | 0.02 |
ENSRNOT00000051342
ENSRNOT00000066282 |
Akr1c2
|
aldo-keto reductase family 1, member C2 |
| chr2_+_243820661 | 0.02 |
ENSRNOT00000090526
|
Eif4e
|
eukaryotic translation initiation factor 4E |
| chr1_-_77844189 | 0.02 |
ENSRNOT00000017555
|
Gltscr2
|
glioma tumor suppressor candidate region gene 2 |
| chr9_-_11339790 | 0.02 |
ENSRNOT00000082837
|
Uxs1
|
UDP-glucuronate decarboxylase 1 |
| chr10_+_49541051 | 0.02 |
ENSRNOT00000041606
|
Pmp22
|
peripheral myelin protein 22 |
| chr7_+_70335061 | 0.02 |
ENSRNOT00000072176
ENSRNOT00000084933 |
Cyp27b1
|
cytochrome P450, family 27, subfamily b, polypeptide 1 |
| chr10_+_37594578 | 0.02 |
ENSRNOT00000007676
|
Skp1
|
S-phase kinase-associated protein 1 |
| chr11_+_31002451 | 0.02 |
ENSRNOT00000002838
|
Eva1c
|
eva-1 homolog C |
| chr16_+_61795432 | 0.02 |
ENSRNOT00000017756
|
Dctn6
|
dynactin subunit 6 |
| chr12_+_13716596 | 0.02 |
ENSRNOT00000080216
|
Actb
|
actin, beta |
| chr1_+_214446659 | 0.02 |
ENSRNOT00000072434
|
Cd151
|
CD151 molecule (Raph blood group) |
| chr7_+_120901934 | 0.02 |
ENSRNOT00000019323
|
Tomm22
|
translocase of outer mitochondrial membrane 22 |
| chr9_+_27402381 | 0.02 |
ENSRNOT00000077372
|
Gsta3
|
glutathione S-transferase alpha 3 |
| chr20_-_33322966 | 0.02 |
ENSRNOT00000000459
|
Ros1
|
ROS proto-oncogene 1 , receptor tyrosine kinase |
| chr7_-_116955148 | 0.02 |
ENSRNOT00000087328
|
Pycrl
|
pyrroline-5-carboxylate reductase-like |
| chr3_+_160410757 | 0.02 |
ENSRNOT00000055172
|
Pabpc1l
|
poly(A) binding protein, cytoplasmic 1-like |
| chr10_-_36716601 | 0.02 |
ENSRNOT00000038838
|
LOC497899
|
similar to hypothetical protein 4930503F14 |
| chr6_+_111476768 | 0.02 |
ENSRNOT00000016479
|
Slirp
|
SRA stem-loop interacting RNA binding protein |
| chr2_-_148722263 | 0.02 |
ENSRNOT00000017868
|
Serp1
|
stress-associated endoplasmic reticulum protein 1 |
| chr2_+_45668969 | 0.02 |
ENSRNOT00000014761
ENSRNOT00000071353 |
Arl15
|
ADP-ribosylation factor like GTPase 15 |
| chr4_+_118160147 | 0.02 |
ENSRNOT00000022014
|
Fam136a
|
family with sequence similarity 136, member A |
| chr16_-_70998575 | 0.02 |
ENSRNOT00000019935
|
Kcnu1
|
potassium calcium-activated channel subfamily U member 1 |
| chr9_+_51009116 | 0.02 |
ENSRNOT00000039313
|
Mettl21cl1
|
methyltransferase like 21C-like 1 |
| chr8_+_59532389 | 0.01 |
ENSRNOT00000018173
|
Psma4
|
proteasome subunit alpha 4 |
| chr1_+_79894450 | 0.01 |
ENSRNOT00000057963
|
Nanos2
|
nanos C2HC-type zinc finger 2 |
| chr7_-_140417530 | 0.01 |
ENSRNOT00000077884
|
Fkbp11
|
FK506 binding protein 11 |
| chr1_-_80809769 | 0.01 |
ENSRNOT00000045073
|
Ceacam19
|
carcinoembryonic antigen-related cell adhesion molecule 19 |
| chr7_+_93975451 | 0.01 |
ENSRNOT00000011379
|
Colec10
|
collectin subfamily member 10 |
| chr16_-_36080191 | 0.01 |
ENSRNOT00000017635
|
Hmgb2l1
|
high mobility group box 2-like 1 |
| chr15_+_108453147 | 0.01 |
ENSRNOT00000018486
|
Timm8a2
|
translocase of inner mitochondrial membrane 8A2 |
| chr13_+_60545635 | 0.01 |
ENSRNOT00000077153
|
Uchl5
|
ubiquitin C-terminal hydrolase L5 |
| chr9_-_11240282 | 0.01 |
ENSRNOT00000070920
|
Uxs1
|
UDP-glucuronate decarboxylase 1 |
| chr1_+_91663736 | 0.01 |
ENSRNOT00000089587
ENSRNOT00000031236 |
Cep89
|
centrosomal protein 89 |
| chr19_-_49623758 | 0.01 |
ENSRNOT00000071130
|
Pkd1l2
|
polycystic kidney disease 1-like 2 |
| chr1_+_101152734 | 0.01 |
ENSRNOT00000028022
|
Pih1d1
|
PIH1 domain containing 1 |
| chr18_+_30387937 | 0.01 |
ENSRNOT00000027210
|
Pcdhb4
|
protocadherin beta 4 |
| chr1_-_101426852 | 0.01 |
ENSRNOT00000028217
|
Ruvbl2
|
RuvB-like AAA ATPase 2 |
| chr14_-_104612597 | 0.01 |
ENSRNOT00000007002
|
Slc1a4
|
solute carrier family 1 member 4 |
| chr3_-_162872831 | 0.01 |
ENSRNOT00000008478
|
Sulf2
|
sulfatase 2 |
| chr2_+_80269661 | 0.01 |
ENSRNOT00000015975
|
AABR07008940.1
|
|
| chr19_+_37330930 | 0.01 |
ENSRNOT00000022439
|
Plekhg4
|
pleckstrin homology and RhoGEF domain containing G4 |
| chr10_+_65591622 | 0.01 |
ENSRNOT00000015207
|
Pigs
|
phosphatidylinositol glycan anchor biosynthesis, class S |
| chr3_+_94585873 | 0.01 |
ENSRNOT00000076762
|
Cstf3
|
cleavage stimulation factor subunit 3 |
| chr1_-_64405149 | 0.01 |
ENSRNOT00000089944
|
Cacng7
|
calcium voltage-gated channel auxiliary subunit gamma 7 |
| chr17_-_90149894 | 0.01 |
ENSRNOT00000024272
|
Apbb1ip
|
amyloid beta precursor protein binding family B member 1 interacting protein |
| chr14_+_38030189 | 0.01 |
ENSRNOT00000035623
|
Txk
|
TXK tyrosine kinase |
| chr4_+_67165883 | 0.01 |
ENSRNOT00000012280
|
Rab19
|
RAB19, member RAS oncogene family |
| chr5_+_107712579 | 0.01 |
ENSRNOT00000090739
|
Mtap
|
methylthioadenosine phosphorylase |
| chr1_+_85058548 | 0.01 |
ENSRNOT00000057120
|
Fcgbpl1
|
Fc fragment of IgG binding protein-like 1 |
| chr4_-_165317573 | 0.01 |
ENSRNOT00000087529
ENSRNOT00000080017 |
Klra5
|
killer cell lectin-like receptor, subfamily A, member 5 |
| chr3_+_123776181 | 0.01 |
ENSRNOT00000090764
ENSRNOT00000034146 |
Mavs
|
mitochondrial antiviral signaling protein |
| chr4_+_163267450 | 0.01 |
ENSRNOT00000079337
|
Tmem52b
|
transmembrane protein 52B |
| chr2_+_181987217 | 0.01 |
ENSRNOT00000034521
|
Fgg
|
fibrinogen gamma chain |
| chr1_-_276228574 | 0.01 |
ENSRNOT00000021746
|
Gucy2g
|
guanylate cyclase 2G |
| chr4_+_155437675 | 0.01 |
ENSRNOT00000031353
|
Dppa3
|
developmental pluripotency-associated 3 |
| chr2_+_24668116 | 0.01 |
ENSRNOT00000067022
ENSRNOT00000036748 |
Wdr41
|
WD repeat domain 41 |
| chr15_+_86153628 | 0.01 |
ENSRNOT00000012842
|
Uchl3
|
ubiquitin C-terminal hydrolase L3 |
| chr1_+_78800754 | 0.01 |
ENSRNOT00000084601
|
Dact3
|
dishevelled-binding antagonist of beta-catenin 3 |
| chr18_+_35489274 | 0.01 |
ENSRNOT00000073952
ENSRNOT00000076060 |
Dcp2
|
decapping mRNA 2 |
| chr2_+_185393441 | 0.01 |
ENSRNOT00000015802
|
Sh3d19
|
SH3 domain containing 19 |
| chr1_-_212021567 | 0.01 |
ENSRNOT00000029027
|
Cfap46
|
cilia and flagella associated protein 46 |
| chr10_+_34975708 | 0.01 |
ENSRNOT00000064984
|
Nhp2
|
NHP2 ribonucleoprotein |
| chr1_+_209237233 | 0.01 |
ENSRNOT00000021537
|
Mgmt
|
O-6-methylguanine-DNA methyltransferase |
| chr10_+_56228043 | 0.01 |
ENSRNOT00000015769
|
Sat2
|
spermidine/spermine N1-acetyltransferase family member 2 |
| chr10_-_88842233 | 0.01 |
ENSRNOT00000026760
|
Stat3
|
signal transducer and activator of transcription 3 |
| chr2_-_41785792 | 0.01 |
ENSRNOT00000015871
|
Rab3c
|
RAB3C, member RAS oncogene family |
| chr7_-_70498992 | 0.01 |
ENSRNOT00000067774
ENSRNOT00000079327 |
Pip4k2c
|
phosphatidylinositol-5-phosphate 4-kinase type 2 gamma |
| chr8_+_117268337 | 0.01 |
ENSRNOT00000072098
ENSRNOT00000083578 |
Lamb2
|
laminin subunit beta 2 |
| chr1_+_229267916 | 0.01 |
ENSRNOT00000073717
ENSRNOT00000082670 ENSRNOT00000076941 |
LOC100910851
|
serine protease inhibitor Kazal-type 5-like |
| chrX_+_1275612 | 0.01 |
ENSRNOT00000013476
|
Uxt
|
ubiquitously-expressed, prefoldin-like chaperone |
| chr18_+_35121967 | 0.01 |
ENSRNOT00000017522
|
Spink5
|
serine peptidase inhibitor, Kazal type 5 |
| chr13_+_50164563 | 0.01 |
ENSRNOT00000029533
|
Lax1
|
lymphocyte transmembrane adaptor 1 |
| chr3_+_11587941 | 0.01 |
ENSRNOT00000071505
|
Dpm2
|
dolichyl-phosphate mannosyltransferase subunit 2, regulatory |
| chr7_-_97759852 | 0.01 |
ENSRNOT00000007484
|
Derl1
|
derlin 1 |
| chr6_-_24201864 | 0.01 |
ENSRNOT00000080972
|
AABR07063248.1
|
|
| chr14_+_84150908 | 0.01 |
ENSRNOT00000005516
|
Dusp18
|
dual specificity phosphatase 18 |
| chr13_-_104284068 | 0.01 |
ENSRNOT00000005407
|
LOC100912365
|
uncharacterized LOC100912365 |
| chr2_+_187697523 | 0.01 |
ENSRNOT00000026153
|
Glmp
|
glycosylated lysosomal membrane protein |
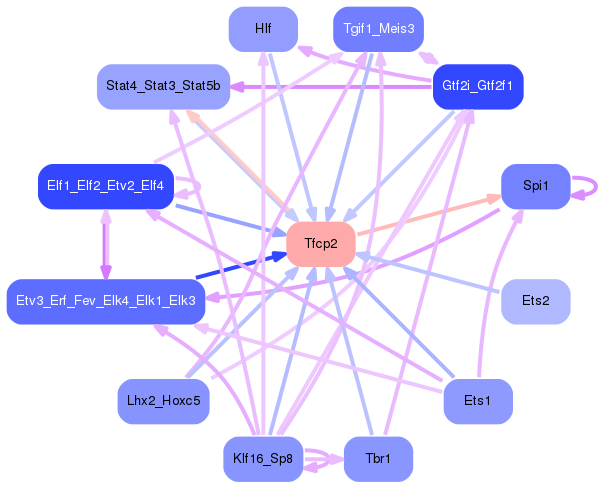
Network of associatons between targets according to the STRING database.

First level regulatory network of Tfcp2
Gene Ontology Analysis
Gene overrepresentation in biological process category:
| Log-likelihood per target | Total log-likelihood | Term | Description |
|---|---|---|---|
| 0.1 | 0.2 | GO:0000720 | pyrimidine dimer repair by nucleotide-excision repair(GO:0000720) |
| 0.1 | 0.3 | GO:0001692 | histamine metabolic process(GO:0001692) |
| 0.0 | 0.1 | GO:0042376 | phylloquinone metabolic process(GO:0042374) phylloquinone catabolic process(GO:0042376) quinone catabolic process(GO:1901662) |
| 0.0 | 0.1 | GO:0016539 | intein-mediated protein splicing(GO:0016539) protein splicing(GO:0030908) |
| 0.0 | 0.1 | GO:1904722 | positive regulation of mRNA cleavage(GO:0031439) positive regulation of endoribonuclease activity(GO:1902380) positive regulation of mRNA endonucleolytic cleavage involved in unfolded protein response(GO:1904722) |
| 0.0 | 0.1 | GO:0031120 | snRNA pseudouridine synthesis(GO:0031120) |
| 0.0 | 0.1 | GO:0090274 | positive regulation of somatostatin secretion(GO:0090274) |
| 0.0 | 0.1 | GO:0019371 | cyclooxygenase pathway(GO:0019371) |
| 0.0 | 0.1 | GO:0002840 | T cell mediated immune response to tumor cell(GO:0002424) regulation of T cell mediated immune response to tumor cell(GO:0002840) |
| 0.0 | 0.1 | GO:0042531 | regulation of tyrosine phosphorylation of STAT protein(GO:0042509) positive regulation of tyrosine phosphorylation of STAT protein(GO:0042531) |
| 0.0 | 0.0 | GO:0072054 | renal outer medulla development(GO:0072054) |
| 0.0 | 0.2 | GO:0006527 | arginine catabolic process(GO:0006527) |
| 0.0 | 0.2 | GO:0015671 | oxygen transport(GO:0015671) |
| 0.0 | 0.1 | GO:0045347 | negative regulation of MHC class II biosynthetic process(GO:0045347) |
| 0.0 | 0.1 | GO:1904401 | cellular response to Thyroid stimulating hormone(GO:1904401) |
| 0.0 | 0.1 | GO:0070601 | centromeric sister chromatid cohesion(GO:0070601) |
| 0.0 | 0.1 | GO:0071104 | negative regulation of mesenchymal to epithelial transition involved in metanephros morphogenesis(GO:0003340) response to interleukin-9(GO:0071104) |
| 0.0 | 0.0 | GO:1903719 | regulation of I-kappaB phosphorylation(GO:1903719) positive regulation of I-kappaB phosphorylation(GO:1903721) |
Gene overrepresentation in cellular component category:
| Log-likelihood per target | Total log-likelihood | Term | Description |
|---|---|---|---|
| 0.0 | 0.2 | GO:0005833 | hemoglobin complex(GO:0005833) |
| 0.0 | 0.1 | GO:0090661 | box H/ACA telomerase RNP complex(GO:0090661) |
| 0.0 | 0.1 | GO:0031415 | NatA complex(GO:0031415) |
| 0.0 | 0.1 | GO:0072588 | box H/ACA snoRNP complex(GO:0031429) box H/ACA RNP complex(GO:0072588) |
Gene overrepresentation in molecular function category:
| Log-likelihood per target | Total log-likelihood | Term | Description |
|---|---|---|---|
| 0.1 | 0.2 | GO:0016403 | dimethylargininase activity(GO:0016403) |
| 0.0 | 0.1 | GO:0008481 | sphinganine kinase activity(GO:0008481) |
| 0.0 | 0.1 | GO:0031249 | denatured protein binding(GO:0031249) |
| 0.0 | 0.1 | GO:0005146 | leukemia inhibitory factor receptor binding(GO:0005146) |
| 0.0 | 0.1 | GO:0004090 | carbonyl reductase (NADPH) activity(GO:0004090) |
| 0.0 | 0.7 | GO:0031492 | nucleosomal DNA binding(GO:0031492) |
| 0.0 | 0.2 | GO:0005344 | oxygen transporter activity(GO:0005344) |
| 0.0 | 0.1 | GO:0034513 | box H/ACA snoRNA binding(GO:0034513) |
| 0.0 | 0.0 | GO:0071791 | chemokine (C-C motif) ligand 5 binding(GO:0071791) |
| 0.0 | 0.1 | GO:0005113 | patched binding(GO:0005113) |
| 0.0 | 0.0 | GO:0000250 | lanosterol synthase activity(GO:0000250) oxidosqualene cyclase activity(GO:0031559) |
| 0.0 | 0.0 | GO:1902379 | chemoattractant activity involved in axon guidance(GO:1902379) |
| 0.0 | 0.3 | GO:0005184 | neuropeptide hormone activity(GO:0005184) |
| 0.0 | 0.1 | GO:0048039 | ubiquinone binding(GO:0048039) |