Project
GSE49485: Hypoxia transcriptome sequencing of rat brain.
Navigation
Downloads
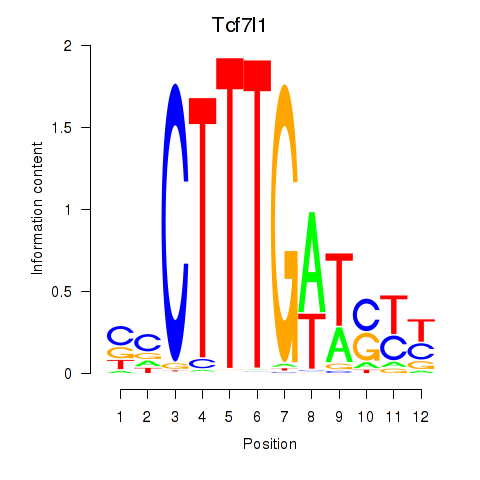
Results for Tcf7l1
Z-value: 0.69
Motif logo
Transcription factors associated with Tcf7l1
| Gene Symbol | Gene ID | Gene Info |
|---|---|---|
|
Tcf7l1
|
ENSRNOG00000014753 | transcription factor 7 like 1 |
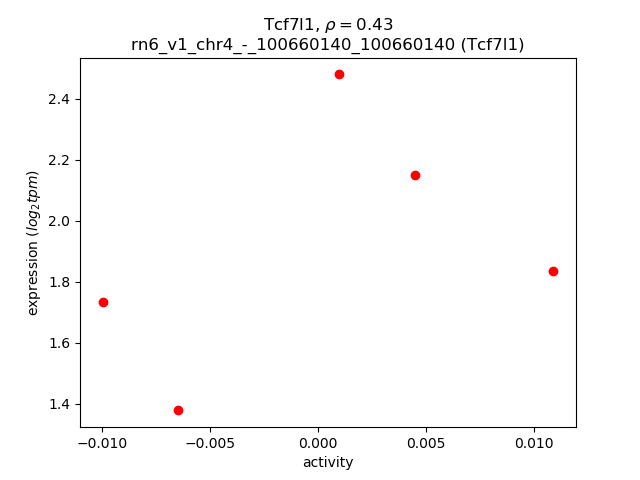
Activity-expression correlation:
| Gene | Promoter | Pearson corr. coef. | P-value | Plot |
|---|---|---|---|---|
| Tcf7l1 | rn6_v1_chr4_-_100660140_100660140 | 0.43 | 4.7e-01 | Click! |
Activity profile of Tcf7l1 motif
Sorted Z-values of Tcf7l1 motif
| Promoter | Log-likelihood | Transcript | Gene | Gene Info |
|---|---|---|---|---|
| chr7_-_93826665 | 0.39 |
ENSRNOT00000011344
|
Tnfrsf11b
|
TNF receptor superfamily member 11B |
| chr20_-_27208041 | 0.25 |
ENSRNOT00000084720
|
Rufy2
|
RUN and FYVE domain containing 2 |
| chr20_-_31598118 | 0.21 |
ENSRNOT00000046537
|
Col13a1
|
collagen type XIII alpha 1 chain |
| chr15_-_41338284 | 0.20 |
ENSRNOT00000077225
|
Tnfrsf19
|
TNF receptor superfamily member 19 |
| chr2_-_142686577 | 0.18 |
ENSRNOT00000014562
|
Nhlrc3
|
NHL repeat containing 3 |
| chr10_-_37645802 | 0.18 |
ENSRNOT00000008022
|
Tcf7
|
transcription factor 7 (T-cell specific, HMG-box) |
| chr17_+_12762752 | 0.18 |
ENSRNOT00000044842
|
Diras2
|
DIRAS family GTPase 2 |
| chr7_-_140090922 | 0.17 |
ENSRNOT00000014456
|
Lalba
|
lactalbumin, alpha |
| chr3_+_21764377 | 0.16 |
ENSRNOT00000063938
|
Gpr21
|
G protein-coupled receptor 21 |
| chr2_-_165739874 | 0.16 |
ENSRNOT00000014384
|
Kpna4
|
karyopherin subunit alpha 4 |
| chr7_-_116201756 | 0.16 |
ENSRNOT00000091401
|
Cyp11b2
|
cytochrome P450, family 11, subfamily b, polypeptide 2 |
| chr10_-_109840047 | 0.15 |
ENSRNOT00000054947
|
Notum
|
NOTUM, palmitoleoyl-protein carboxylesterase |
| chr12_-_11808977 | 0.15 |
ENSRNOT00000071795
|
AABR07035375.1
|
|
| chr2_+_241029693 | 0.15 |
ENSRNOT00000033413
|
Slc39a8
|
solute carrier family 39 member 8 |
| chr20_-_31597830 | 0.15 |
ENSRNOT00000085877
|
Col13a1
|
collagen type XIII alpha 1 chain |
| chr2_+_238257031 | 0.14 |
ENSRNOT00000016066
|
Ints12
|
integrator complex subunit 12 |
| chr3_+_138974871 | 0.14 |
ENSRNOT00000012524
|
Scp2d1
|
SCP2 sterol-binding domain containing 1 |
| chr2_+_179952227 | 0.14 |
ENSRNOT00000015081
|
Pdgfc
|
platelet derived growth factor C |
| chr17_+_22619891 | 0.13 |
ENSRNOT00000060403
|
Adtrp
|
androgen-dependent TFPI-regulating protein |
| chr3_-_80601410 | 0.13 |
ENSRNOT00000022841
|
Atg13
|
autophagy related 13 |
| chr20_+_20105047 | 0.13 |
ENSRNOT00000082181
|
Ank3
|
ankyrin 3 |
| chr4_+_57019941 | 0.13 |
ENSRNOT00000011356
|
Smo
|
smoothened, frizzled class receptor |
| chr1_-_219422268 | 0.13 |
ENSRNOT00000025092
|
Carns1
|
carnosine synthase 1 |
| chr11_-_31213787 | 0.13 |
ENSRNOT00000002800
|
Paxbp1
|
PAX3 and PAX7 binding protein 1 |
| chr7_-_98098268 | 0.13 |
ENSRNOT00000010361
|
Fbxo32
|
F-box protein 32 |
| chr5_-_144479306 | 0.12 |
ENSRNOT00000087697
|
Ago1
|
argonaute 1, RISC catalytic component |
| chr5_+_116421894 | 0.12 |
ENSRNOT00000080577
ENSRNOT00000086628 ENSRNOT00000004017 |
Nfia
|
nuclear factor I/A |
| chr11_+_69484293 | 0.12 |
ENSRNOT00000049292
|
Kalrn
|
kalirin, RhoGEF kinase |
| chr15_+_86243148 | 0.12 |
ENSRNOT00000084471
ENSRNOT00000090727 |
Lmo7
|
LIM domain 7 |
| chr5_+_173256834 | 0.12 |
ENSRNOT00000089936
|
Ccnl2
|
cyclin L2 |
| chr6_-_72596446 | 0.11 |
ENSRNOT00000008459
|
Hectd1
|
HECT domain E3 ubiquitin protein ligase 1 |
| chr4_-_16654811 | 0.11 |
ENSRNOT00000008637
|
Pclo
|
piccolo (presynaptic cytomatrix protein) |
| chr9_-_93404883 | 0.11 |
ENSRNOT00000025024
|
Nmur1
|
neuromedin U receptor 1 |
| chr10_-_74376270 | 0.11 |
ENSRNOT00000079311
|
Gdpd1
|
glycerophosphodiester phosphodiesterase domain containing 1 |
| chr3_-_51297852 | 0.10 |
ENSRNOT00000001607
|
Cobll1
|
cordon-bleu WH2 repeat protein-like 1 |
| chr15_+_41927241 | 0.10 |
ENSRNOT00000012035
|
Trim13
|
tripartite motif-containing 13 |
| chr17_-_17947777 | 0.10 |
ENSRNOT00000036876
|
Rnf144b
|
ring finger protein 144B |
| chr13_+_83996080 | 0.10 |
ENSRNOT00000004403
ENSRNOT00000070958 |
Cd247
|
Cd247 molecule |
| chr1_+_190671696 | 0.10 |
ENSRNOT00000084934
|
AABR07005633.1
|
|
| chr4_+_78283026 | 0.10 |
ENSRNOT00000059173
|
Gimap8
|
GTPase, IMAP family member 8 |
| chr1_+_65564173 | 0.10 |
ENSRNOT00000038860
|
Zbtb45
|
zinc finger and BTB domain containing 45 |
| chr12_-_35979193 | 0.10 |
ENSRNOT00000071104
|
Tmem132b
|
transmembrane protein 132B |
| chr8_+_117620317 | 0.10 |
ENSRNOT00000084220
|
Celsr3
|
cadherin, EGF LAG seven-pass G-type receptor 3 |
| chr1_+_187149453 | 0.10 |
ENSRNOT00000082738
|
Xylt1
|
xylosyltransferase 1 |
| chr18_+_79773608 | 0.10 |
ENSRNOT00000088484
|
Zfp516
|
zinc finger protein 516 |
| chr2_-_33025271 | 0.10 |
ENSRNOT00000074941
|
NEWGENE_1310139
|
microtubule associated serine/threonine kinase family member 4 |
| chr10_+_89358376 | 0.10 |
ENSRNOT00000028067
|
Ifi35
|
interferon-induced protein 35 |
| chr8_+_76400341 | 0.10 |
ENSRNOT00000087382
ENSRNOT00000081072 |
Bnip2
|
BCL2/adenovirus E1B interacting protein 2 |
| chr3_-_2719513 | 0.10 |
ENSRNOT00000020997
|
Lcn12
|
lipocalin 12 |
| chr3_+_172856733 | 0.09 |
ENSRNOT00000009826
|
Edn3
|
endothelin 3 |
| chr6_+_147876237 | 0.09 |
ENSRNOT00000056649
|
Tmem196
|
transmembrane protein 196 |
| chr12_-_52596076 | 0.09 |
ENSRNOT00000056639
|
Chfr
|
checkpoint with forkhead and ring finger domains |
| chr3_-_2719135 | 0.09 |
ENSRNOT00000080257
|
Lcn12
|
lipocalin 12 |
| chr17_-_86657473 | 0.09 |
ENSRNOT00000078827
|
AABR07028795.1
|
|
| chr13_+_52976507 | 0.09 |
ENSRNOT00000090599
ENSRNOT00000011324 |
Kif21b
|
kinesin family member 21B |
| chr11_-_29710849 | 0.09 |
ENSRNOT00000029345
|
Krtap11-1
|
keratin associated protein 11-1 |
| chr17_+_9596957 | 0.09 |
ENSRNOT00000017349
|
Fam193b
|
family with sequence similarity 193, member B |
| chr1_+_128614138 | 0.09 |
ENSRNOT00000076227
ENSRNOT00000078707 |
Ttc23
|
tetratricopeptide repeat domain 23 |
| chr5_-_77294735 | 0.08 |
ENSRNOT00000018209
ENSRNOT00000056900 |
Zfp37
|
zinc finger protein 37 |
| chr10_-_65766050 | 0.08 |
ENSRNOT00000013639
|
Sarm1
|
sterile alpha and TIR motif containing 1 |
| chr6_+_60566196 | 0.08 |
ENSRNOT00000006709
ENSRNOT00000075193 |
Dock4
|
dedicator of cytokinesis 4 |
| chr19_-_55490426 | 0.08 |
ENSRNOT00000081800
|
Cbfa2t3
|
CBFA2/RUNX1 translocation partner 3 |
| chr6_+_80159364 | 0.08 |
ENSRNOT00000005439
|
Pnn
|
pinin, desmosome associated protein |
| chr6_-_38228379 | 0.08 |
ENSRNOT00000084924
|
Mycn
|
v-myc avian myelocytomatosis viral oncogene neuroblastoma derived homolog |
| chr11_-_80650802 | 0.08 |
ENSRNOT00000043660
|
Rtp4
|
receptor (chemosensory) transporter protein 4 |
| chr7_-_12275609 | 0.08 |
ENSRNOT00000086061
|
Apc2
|
APC2, WNT signaling pathway regulator |
| chr12_+_2589818 | 0.08 |
ENSRNOT00000087848
|
AABR07034980.1
|
|
| chr12_+_9728486 | 0.08 |
ENSRNOT00000001263
|
Lnx2
|
ligand of numb-protein X 2 |
| chr20_+_3558827 | 0.07 |
ENSRNOT00000088130
|
Ddr1
|
discoidin domain receptor tyrosine kinase 1 |
| chr18_-_40134504 | 0.07 |
ENSRNOT00000022294
|
Trim36
|
tripartite motif-containing 36 |
| chr5_+_128083118 | 0.07 |
ENSRNOT00000079161
|
Zcchc11
|
zinc finger CCHC-type containing 11 |
| chr11_-_72378895 | 0.07 |
ENSRNOT00000058885
|
Dlg1
|
discs large MAGUK scaffold protein 1 |
| chr2_+_104744461 | 0.07 |
ENSRNOT00000016083
ENSRNOT00000082627 |
Cp
|
ceruloplasmin |
| chr13_-_73055631 | 0.07 |
ENSRNOT00000081892
|
Xpr1
|
xenotropic and polytropic retrovirus receptor 1 |
| chr2_+_196013799 | 0.07 |
ENSRNOT00000084023
|
Pogz
|
pogo transposable element with ZNF domain |
| chr17_-_10818835 | 0.07 |
ENSRNOT00000091046
|
Cplx2
|
complexin 2 |
| chrX_+_20351486 | 0.07 |
ENSRNOT00000093675
ENSRNOT00000047444 |
Wnk3
|
WNK lysine deficient protein kinase 3 |
| chr5_-_16799776 | 0.07 |
ENSRNOT00000011721
|
Plag1
|
PLAG1 zinc finger |
| chr6_-_107080524 | 0.07 |
ENSRNOT00000011662
|
Zfyve1
|
zinc finger FYVE-type containing 1 |
| chr10_+_110445797 | 0.07 |
ENSRNOT00000054920
|
Narf
|
nuclear prelamin A recognition factor |
| chr1_-_263431290 | 0.07 |
ENSRNOT00000022633
|
Slc25a28
|
solute carrier family 25 member 28 |
| chr6_-_80107236 | 0.07 |
ENSRNOT00000006369
|
Sec23a
|
Sec23 homolog A, coat complex II component |
| chr19_+_44908905 | 0.07 |
ENSRNOT00000066057
ENSRNOT00000085072 |
Cntnap4
|
contactin associated protein-like 4 |
| chr13_-_1946508 | 0.06 |
ENSRNOT00000043890
|
Dsel
|
dermatan sulfate epimerase-like |
| chrX_-_128268285 | 0.06 |
ENSRNOT00000009755
ENSRNOT00000081880 |
Thoc2
|
THO complex 2 |
| chr6_-_99843245 | 0.06 |
ENSRNOT00000080270
|
Gpx2
|
glutathione peroxidase 2 |
| chr2_+_142686724 | 0.06 |
ENSRNOT00000014614
|
Proser1
|
proline and serine rich 1 |
| chr10_-_87541851 | 0.06 |
ENSRNOT00000089610
|
RGD1561684
|
similar to keratin associated protein 2-4 |
| chr5_+_135351816 | 0.06 |
ENSRNOT00000082602
|
Ipp
|
intracisternal A particle-promoted polypeptide |
| chr18_+_30909490 | 0.06 |
ENSRNOT00000026967
|
Pcdhgb8
|
protocadherin gamma subfamily B, 8 |
| chr9_-_44126919 | 0.06 |
ENSRNOT00000024701
|
Mgat4a
|
mannosyl (alpha-1,3-)-glycoprotein beta-1,4-N-acetylglucosaminyltransferase, isozyme A |
| chr3_+_80634470 | 0.06 |
ENSRNOT00000045644
|
Ambra1
|
autophagy and beclin 1 regulator 1 |
| chr16_+_20027348 | 0.06 |
ENSRNOT00000034589
|
Fam129c
|
family with sequence similarity 129, member C |
| chr9_-_81772851 | 0.06 |
ENSRNOT00000032719
|
Usp37
|
ubiquitin specific peptidase 37 |
| chr3_+_148510779 | 0.06 |
ENSRNOT00000012156
|
Xkr7
|
XK related 7 |
| chr13_-_79801112 | 0.06 |
ENSRNOT00000087323
ENSRNOT00000036483 |
Suco
|
SUN domain containing ossification factor |
| chr9_+_30419001 | 0.06 |
ENSRNOT00000018116
|
Col9a1
|
collagen type IX alpha 1 chain |
| chr6_+_44009872 | 0.06 |
ENSRNOT00000082657
|
Mboat2
|
membrane bound O-acyltransferase domain containing 2 |
| chr6_+_10642700 | 0.06 |
ENSRNOT00000040329
|
LOC100359600
|
karyopherin alpha 2-like |
| chr6_-_18351536 | 0.06 |
ENSRNOT00000061588
|
Crnkl1
|
crooked neck pre-mRNA splicing factor 1 |
| chr20_+_4369394 | 0.06 |
ENSRNOT00000088734
ENSRNOT00000091491 |
Agpat1
|
1-acylglycerol-3-phosphate O-acyltransferase 1 |
| chr17_-_20364714 | 0.06 |
ENSRNOT00000070962
|
Jarid2
|
jumonji and AT-rich interaction domain containing 2 |
| chr6_+_108123816 | 0.06 |
ENSRNOT00000089242
ENSRNOT00000063900 |
Bbof1
|
basal body orientation factor 1 |
| chr3_-_51643140 | 0.06 |
ENSRNOT00000006646
|
Scn3a
|
sodium voltage-gated channel alpha subunit 3 |
| chr7_-_3342491 | 0.06 |
ENSRNOT00000081756
|
Rdh5
|
retinol dehydrogenase 5 |
| chr3_+_149741312 | 0.06 |
ENSRNOT00000070854
|
LOC100911637
|
high mobility group protein B1-like |
| chr1_+_238843338 | 0.05 |
ENSRNOT00000024583
|
Zfand5
|
zinc finger AN1-type containing 5 |
| chr8_+_128087345 | 0.05 |
ENSRNOT00000019777
|
Acvr2b
|
activin A receptor type 2B |
| chr7_-_140546908 | 0.05 |
ENSRNOT00000077502
|
Kmt2d
|
lysine methyltransferase 2D |
| chr3_+_149790856 | 0.05 |
ENSRNOT00000075275
|
LOC100911637
|
high mobility group protein B1-like |
| chr8_+_70630767 | 0.05 |
ENSRNOT00000051353
|
Igdcc3
|
immunoglobulin superfamily, DCC subclass, member 3 |
| chr1_-_89509343 | 0.05 |
ENSRNOT00000028637
|
Fxyd3
|
FXYD domain-containing ion transport regulator 3 |
| chr10_-_74119009 | 0.05 |
ENSRNOT00000085712
ENSRNOT00000006926 |
Dhx40
|
DEAH-box helicase 40 |
| chr16_+_10727571 | 0.05 |
ENSRNOT00000084422
|
Mmrn2
|
multimerin 2 |
| chr5_+_103479767 | 0.05 |
ENSRNOT00000008999
|
Sh3gl2
|
SH3 domain-containing GRB2-like 2 |
| chr10_-_56831243 | 0.05 |
ENSRNOT00000025403
|
Slc16a13
|
solute carrier family 16, member 13 |
| chr8_-_96132634 | 0.05 |
ENSRNOT00000041655
|
Syncrip
|
synaptotagmin binding, cytoplasmic RNA interacting protein |
| chr14_-_114047527 | 0.05 |
ENSRNOT00000083199
|
AABR07016779.1
|
|
| chr8_+_45797315 | 0.04 |
ENSRNOT00000059997
|
AABR07070046.1
|
|
| chr16_+_54899452 | 0.04 |
ENSRNOT00000016882
|
Cnot7
|
CCR4-NOT transcription complex, subunit 7 |
| chr13_+_99473044 | 0.04 |
ENSRNOT00000004939
|
Cnih4
|
cornichon family AMPA receptor auxiliary protein 4 |
| chrX_-_25628272 | 0.04 |
ENSRNOT00000086414
|
Mid1
|
midline 1 |
| chr1_+_23977688 | 0.04 |
ENSRNOT00000014805
|
Tbpl1
|
TATA-box binding protein like 1 |
| chrX_+_135470915 | 0.04 |
ENSRNOT00000009637
|
Slc25a14
|
solute carrier family 25 member 14 |
| chr6_-_1622196 | 0.04 |
ENSRNOT00000007492
|
Prkd3
|
protein kinase D3 |
| chr5_+_71742911 | 0.04 |
ENSRNOT00000047225
|
Zfp462
|
zinc finger protein 462 |
| chr4_-_161091010 | 0.04 |
ENSRNOT00000043708
|
Senp17
|
Sumo1/sentrin/SMT3 specific peptidase 17 |
| chr15_+_105851542 | 0.04 |
ENSRNOT00000086959
|
Rap2a
|
RAS related protein 2a |
| chr14_-_3288017 | 0.04 |
ENSRNOT00000080452
|
LOC689986
|
hypothetical protein LOC689986 |
| chr7_-_140417530 | 0.04 |
ENSRNOT00000077884
|
Fkbp11
|
FK506 binding protein 11 |
| chrX_+_33884499 | 0.04 |
ENSRNOT00000090041
|
Reps2
|
RALBP1 associated Eps domain containing protein 2 |
| chr11_-_1836897 | 0.04 |
ENSRNOT00000050533
|
Zfp654
|
zinc finger protein 654 |
| chr12_-_8156151 | 0.04 |
ENSRNOT00000064721
|
Mtus2
|
microtubule associated tumor suppressor candidate 2 |
| chr2_+_119112513 | 0.03 |
ENSRNOT00000015460
|
Actl6a
|
actin-like 6A |
| chr5_+_126976456 | 0.03 |
ENSRNOT00000014275
|
Ndc1
|
NDC1 transmembrane nucleoporin |
| chr6_+_10912383 | 0.03 |
ENSRNOT00000061747
ENSRNOT00000086247 |
Ttc7a
|
tetratricopeptide repeat domain 7A |
| chr3_+_116899878 | 0.03 |
ENSRNOT00000090802
ENSRNOT00000066101 |
Sema6d
|
semaphorin 6D |
| chr5_-_151898022 | 0.03 |
ENSRNOT00000000133
|
Pigv
|
phosphatidylinositol glycan anchor biosynthesis, class V |
| chr15_+_52767442 | 0.03 |
ENSRNOT00000014441
|
LOC108348161
|
phytanoyl-CoA hydroxylase-interacting protein |
| chr4_+_78240385 | 0.03 |
ENSRNOT00000011041
|
Zfp775
|
zinc finger protein 775 |
| chr2_-_232178533 | 0.03 |
ENSRNOT00000082173
ENSRNOT00000055607 |
Ap1ar
|
adaptor-related protein complex 1 associated regulatory protein |
| chr1_+_205911552 | 0.03 |
ENSRNOT00000024751
|
Fank1
|
fibronectin type 3 and ankyrin repeat domains 1 |
| chr9_-_116222374 | 0.03 |
ENSRNOT00000090111
ENSRNOT00000067900 |
Arhgap28
|
Rho GTPase activating protein 28 |
| chr19_+_39543242 | 0.03 |
ENSRNOT00000018837
|
Wwp2
|
WW domain containing E3 ubiquitin protein ligase 2 |
| chr16_-_74264142 | 0.03 |
ENSRNOT00000026067
|
Dkk4
|
dickkopf WNT signaling pathway inhibitor 4 |
| chr2_-_226779440 | 0.03 |
ENSRNOT00000055669
|
Fnbp1l
|
formin binding protein 1-like |
| chr15_+_27933211 | 0.02 |
ENSRNOT00000013619
|
Rnase10
|
ribonuclease A family member 10 |
| chr6_+_43644830 | 0.02 |
ENSRNOT00000086798
|
Taf1b
|
TATA-box binding protein associated factor, RNA polymerase I subunit B |
| chr15_+_52148379 | 0.02 |
ENSRNOT00000074912
|
Phyhip
|
phytanoyl-CoA 2-hydroxylase interacting protein |
| chr8_-_111101416 | 0.02 |
ENSRNOT00000084413
|
Cep63
|
centrosomal protein 63 |
| chr17_+_36335804 | 0.02 |
ENSRNOT00000091334
|
E2f3
|
E2F transcription factor 3 |
| chr4_+_89536647 | 0.02 |
ENSRNOT00000058581
|
Tigd2
|
tigger transposable element derived 2 |
| chr9_+_6966908 | 0.02 |
ENSRNOT00000072796
|
St6gal2
|
ST6 beta-galactoside alpha-2,6-sialyltransferase 2 |
| chr3_+_148541909 | 0.02 |
ENSRNOT00000012187
|
Ccm2l
|
CCM2 like scaffolding protein |
| chr10_-_14788617 | 0.02 |
ENSRNOT00000043626
|
Cacna1h
|
calcium voltage-gated channel subunit alpha1 H |
| chr5_+_127404450 | 0.02 |
ENSRNOT00000017575
|
Lrp8
|
LDL receptor related protein 8 |
| chr5_+_18901039 | 0.02 |
ENSRNOT00000012066
|
Fam110b
|
family with sequence similarity 110, member B |
| chr10_-_87529599 | 0.02 |
ENSRNOT00000074099
|
Krtap2-1
|
keratin associated protein 2-1 |
| chr9_+_66952720 | 0.02 |
ENSRNOT00000023678
|
Nbeal1
|
neurobeachin-like 1 |
| chr18_-_74059533 | 0.02 |
ENSRNOT00000038767
|
RGD1308601
|
similar to hypothetical protein |
| chr18_-_58097316 | 0.02 |
ENSRNOT00000088527
|
AABR07032265.1
|
|
| chr5_-_150167077 | 0.02 |
ENSRNOT00000088493
ENSRNOT00000013761 ENSRNOT00000067349 ENSRNOT00000051097 ENSRNOT00000067189 |
Epb41
|
erythrocyte membrane protein band 4.1 |
| chr15_-_52214616 | 0.02 |
ENSRNOT00000015035
|
Sftpc
|
surfactant protein C |
| chr8_+_59457018 | 0.02 |
ENSRNOT00000017900
|
Ireb2
|
iron responsive element binding protein 2 |
| chr10_+_90085559 | 0.02 |
ENSRNOT00000028332
|
Nags
|
N-acetylglutamate synthase |
| chr1_-_89007041 | 0.02 |
ENSRNOT00000032363
|
Proser3
|
proline and serine rich 3 |
| chr7_-_140291620 | 0.01 |
ENSRNOT00000088323
|
Adcy6
|
adenylate cyclase 6 |
| chr8_+_111210811 | 0.01 |
ENSRNOT00000011347
|
Amotl2
|
angiomotin like 2 |
| chr7_-_143956668 | 0.01 |
ENSRNOT00000018809
|
Aaas
|
aladin WD repeat nucleoporin |
| chr1_-_198316882 | 0.01 |
ENSRNOT00000085304
ENSRNOT00000064985 |
Taok2
|
TAO kinase 2 |
| chr13_-_79744939 | 0.01 |
ENSRNOT00000076706
|
Suco
|
SUN domain containing ossification factor |
| chr16_-_27472687 | 0.01 |
ENSRNOT00000046984
|
AABR07025074.1
|
|
| chr19_-_41010122 | 0.01 |
ENSRNOT00000088770
|
Vac14
|
Vac14, PIKFYVE complex component |
| chr8_+_118206698 | 0.01 |
ENSRNOT00000082607
ENSRNOT00000064140 |
Smarcc1
|
SWI/SNF related, matrix associated, actin dependent regulator of chromatin, subfamily c, member 1 |
| chr13_-_70922245 | 0.01 |
ENSRNOT00000064860
|
Dhx9
|
DExH-box helicase 9 |
| chr1_+_98440186 | 0.01 |
ENSRNOT00000024150
|
Iglon5
|
IgLON family member 5 |
| chr15_-_82482009 | 0.01 |
ENSRNOT00000011926
|
Dach1
|
dachshund family transcription factor 1 |
| chr1_+_41590494 | 0.01 |
ENSRNOT00000089984
|
Esr1
|
estrogen receptor 1 |
| chr7_+_12256387 | 0.01 |
ENSRNOT00000021939
|
RGD1359127
|
similar to RIKEN cDNA 2310011J03 |
| chr6_-_22281886 | 0.01 |
ENSRNOT00000039375
|
Spast
|
spastin |
| chr8_+_97537968 | 0.01 |
ENSRNOT00000037276
|
Adamts7
|
ADAM metallopeptidase with thrombospondin type 1 motif, 7 |
| chrX_-_153878806 | 0.01 |
ENSRNOT00000087990
|
Aff2
|
AF4/FMR2 family, member 2 |
| chr2_-_94903226 | 0.01 |
ENSRNOT00000015194
|
AABR07009373.1
|
|
| chr1_-_248898607 | 0.01 |
ENSRNOT00000074393
|
NEWGENE_1307313
|
dickkopf WNT signaling pathway inhibitor 1 |
| chr18_-_80865584 | 0.00 |
ENSRNOT00000021750
|
Tshz1
|
teashirt zinc finger homeobox 1 |
| chr16_+_2670618 | 0.00 |
ENSRNOT00000030102
|
Il17rd
|
interleukin 17 receptor D |
| chr19_+_37330930 | 0.00 |
ENSRNOT00000022439
|
Plekhg4
|
pleckstrin homology and RhoGEF domain containing G4 |
| chr1_+_264741911 | 0.00 |
ENSRNOT00000019956
|
Sema4g
|
semaphorin 4G |
| chr5_-_50362344 | 0.00 |
ENSRNOT00000035808
|
Zfp292
|
zinc finger protein 292 |
| chr8_+_22648323 | 0.00 |
ENSRNOT00000013165
|
Smarca4
|
SWI/SNF related, matrix associated, actin dependent regulator of chromatin, subfamily a, member 4 |
| chr18_-_8360684 | 0.00 |
ENSRNOT00000021170
|
Cdh2
|
cadherin 2 |
| chr10_-_89225297 | 0.00 |
ENSRNOT00000027868
ENSRNOT00000082010 |
Becn1
|
beclin 1 |
| chr10_-_82209459 | 0.00 |
ENSRNOT00000004377
|
Spata20
|
spermatogenesis associated 20 |
| chr8_+_56451240 | 0.00 |
ENSRNOT00000085278
|
LOC100359687
|
mitochondrial ribosomal protein L1-like |
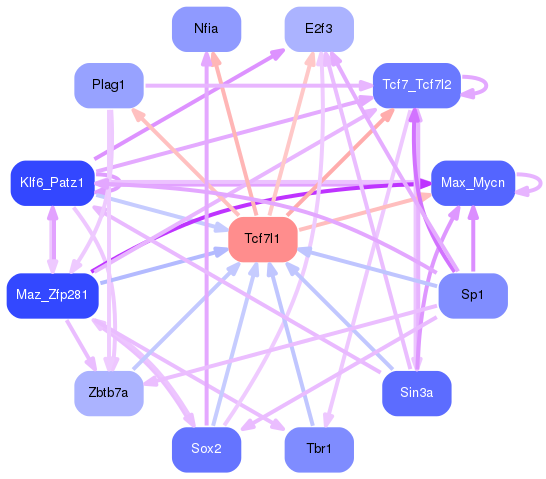
Network of associatons between targets according to the STRING database.

First level regulatory network of Tcf7l1
Gene Ontology Analysis
Gene overrepresentation in biological process category:
| Log-likelihood per target | Total log-likelihood | Term | Description |
|---|---|---|---|
| 0.1 | 0.4 | GO:0042489 | negative regulation of odontogenesis of dentin-containing tooth(GO:0042489) |
| 0.1 | 0.2 | GO:0048619 | embryonic hindgut morphogenesis(GO:0048619) |
| 0.0 | 0.2 | GO:0046351 | disaccharide biosynthetic process(GO:0046351) |
| 0.0 | 0.1 | GO:1900827 | positive regulation of cell communication by electrical coupling(GO:0010650) positive regulation of membrane depolarization during cardiac muscle cell action potential(GO:1900827) |
| 0.0 | 0.1 | GO:0007228 | positive regulation of hh target transcription factor activity(GO:0007228) |
| 0.0 | 0.1 | GO:0014878 | response to electrical stimulus involved in regulation of muscle adaptation(GO:0014878) |
| 0.0 | 0.1 | GO:0090625 | mRNA cleavage involved in gene silencing by siRNA(GO:0090625) |
| 0.0 | 0.1 | GO:1904694 | negative regulation of vascular smooth muscle contraction(GO:1904694) |
| 0.0 | 0.2 | GO:0051365 | cellular response to potassium ion starvation(GO:0051365) |
| 0.0 | 0.1 | GO:1903760 | regulation of voltage-gated potassium channel activity involved in ventricular cardiac muscle cell action potential repolarization(GO:1903760) |
| 0.0 | 0.1 | GO:0061368 | behavioral response to chemical pain(GO:0061366) behavioral response to formalin induced pain(GO:0061368) NMDA selective glutamate receptor signaling pathway(GO:0098989) |
| 0.0 | 0.1 | GO:0014826 | vein smooth muscle contraction(GO:0014826) |
| 0.0 | 0.1 | GO:0060708 | spongiotrophoblast differentiation(GO:0060708) |
| 0.0 | 0.1 | GO:2000682 | positive regulation of rubidium ion transport(GO:2000682) positive regulation of rubidium ion transmembrane transporter activity(GO:2000688) |
| 0.0 | 0.2 | GO:0070574 | cadmium ion transport(GO:0015691) cadmium ion transmembrane transport(GO:0070574) |
| 0.0 | 0.1 | GO:0009609 | response to symbiotic bacterium(GO:0009609) |
| 0.0 | 0.1 | GO:0036515 | serotonergic neuron axon guidance(GO:0036515) |
| 0.0 | 0.1 | GO:0016080 | synaptic vesicle targeting(GO:0016080) presynaptic signal transduction(GO:0098928) presynapse to nucleus signaling pathway(GO:0099526) |
| 0.0 | 0.1 | GO:0015679 | plasma membrane copper ion transport(GO:0015679) |
| 0.0 | 0.1 | GO:0030205 | dermatan sulfate metabolic process(GO:0030205) |
| 0.0 | 0.2 | GO:0042159 | lipoprotein catabolic process(GO:0042159) |
| 0.0 | 0.1 | GO:2000288 | positive regulation of myoblast proliferation(GO:2000288) |
| 0.0 | 0.1 | GO:1990830 | response to leukemia inhibitory factor(GO:1990823) cellular response to leukemia inhibitory factor(GO:1990830) |
| 0.0 | 0.2 | GO:0006607 | NLS-bearing protein import into nucleus(GO:0006607) |
| 0.0 | 0.1 | GO:0001555 | oocyte growth(GO:0001555) |
| 0.0 | 0.0 | GO:0009212 | dTTP biosynthetic process(GO:0006235) pyrimidine deoxyribonucleoside triphosphate biosynthetic process(GO:0009212) |
| 0.0 | 0.1 | GO:0007171 | activation of transmembrane receptor protein tyrosine kinase activity(GO:0007171) |
| 0.0 | 0.1 | GO:0010587 | miRNA catabolic process(GO:0010587) |
Gene overrepresentation in cellular component category:
| Log-likelihood per target | Total log-likelihood | Term | Description |
|---|---|---|---|
| 0.0 | 0.1 | GO:0044317 | rod spherule(GO:0044317) |
| 0.0 | 0.1 | GO:0097629 | extrinsic component of omegasome membrane(GO:0097629) |
| 0.0 | 0.1 | GO:1990316 | ATG1/ULK1 kinase complex(GO:1990316) |
| 0.0 | 0.1 | GO:0097025 | MPP7-DLG1-LIN7 complex(GO:0097025) |
| 0.0 | 0.1 | GO:0035068 | micro-ribonucleoprotein complex(GO:0035068) |
| 0.0 | 0.1 | GO:0031315 | extrinsic component of mitochondrial outer membrane(GO:0031315) |
| 0.0 | 0.1 | GO:0014731 | spectrin-associated cytoskeleton(GO:0014731) |
| 0.0 | 0.1 | GO:0042105 | alpha-beta T cell receptor complex(GO:0042105) |
| 0.0 | 0.1 | GO:0070033 | synaptobrevin 2-SNAP-25-syntaxin-1a-complexin II complex(GO:0070033) |
| 0.0 | 0.1 | GO:0044294 | dendritic growth cone(GO:0044294) |
Gene overrepresentation in molecular function category:
| Log-likelihood per target | Total log-likelihood | Term | Description |
|---|---|---|---|
| 0.1 | 0.2 | GO:0001588 | dopamine neurotransmitter receptor activity, coupled via Gs(GO:0001588) |
| 0.1 | 0.2 | GO:0004507 | steroid 11-beta-monooxygenase activity(GO:0004507) corticosterone 18-monooxygenase activity(GO:0047783) |
| 0.0 | 0.1 | GO:0030158 | protein xylosyltransferase activity(GO:0030158) |
| 0.0 | 0.1 | GO:0031708 | endothelin B receptor binding(GO:0031708) |
| 0.0 | 0.1 | GO:0050265 | RNA uridylyltransferase activity(GO:0050265) |
| 0.0 | 0.1 | GO:0047757 | chondroitin-glucuronate 5-epimerase activity(GO:0047757) |
| 0.0 | 0.1 | GO:0031849 | olfactory receptor binding(GO:0031849) |
| 0.0 | 0.4 | GO:0005035 | tumor necrosis factor-activated receptor activity(GO:0005031) death receptor activity(GO:0005035) |
| 0.0 | 0.1 | GO:0000822 | inositol hexakisphosphate binding(GO:0000822) |
| 0.0 | 0.1 | GO:0097016 | L27 domain binding(GO:0097016) |
| 0.0 | 0.1 | GO:0005113 | patched binding(GO:0005113) |
| 0.0 | 0.2 | GO:0001972 | retinoic acid binding(GO:0001972) |
| 0.0 | 0.1 | GO:0016724 | ferroxidase activity(GO:0004322) oxidoreductase activity, oxidizing metal ions, oxygen as acceptor(GO:0016724) |
| 0.0 | 0.1 | GO:0038062 | protein tyrosine kinase collagen receptor activity(GO:0038062) |
Gene overrepresentation in curated gene sets: REACTOME pathways category:
| Log-likelihood per target | Total log-likelihood | Term | Description |
|---|---|---|---|
| 0.0 | 0.1 | REACTOME TRANSLOCATION OF ZAP 70 TO IMMUNOLOGICAL SYNAPSE | Genes involved in Translocation of ZAP-70 to Immunological synapse |
| 0.0 | 0.1 | REACTOME VEGF LIGAND RECEPTOR INTERACTIONS | Genes involved in VEGF ligand-receptor interactions |