Project
GSE49485: Hypoxia transcriptome sequencing of rat brain.
Navigation
Downloads
Results for Tbx20
Z-value: 0.09
Motif logo
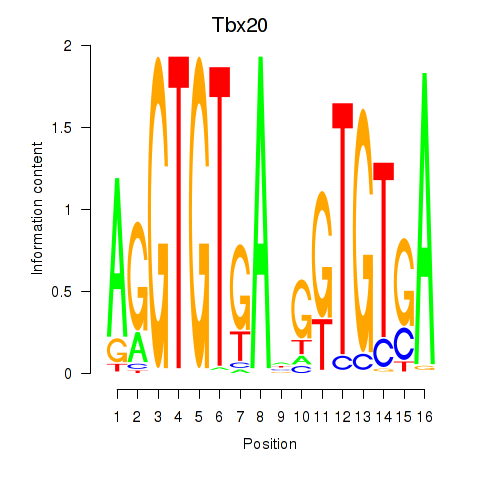
Transcription factors associated with Tbx20
| Gene Symbol | Gene ID | Gene Info |
|---|---|---|
|
Tbx20
|
ENSRNOG00000016181 | T-box 20 |
Activity-expression correlation:
| Gene | Promoter | Pearson corr. coef. | P-value | Plot |
|---|---|---|---|---|
| Tbx20 | rn6_v1_chr8_-_25904564_25904570 | 0.68 | 2.0e-01 | Click! |
Activity profile of Tbx20 motif
Sorted Z-values of Tbx20 motif
| Promoter | Log-likelihood | Transcript | Gene | Gene Info |
|---|---|---|---|---|
| chr1_-_245817809 | 0.06 |
ENSRNOT00000080607
|
AABR07006672.1
|
|
| chr2_+_2694480 | 0.04 |
ENSRNOT00000083565
|
AABR07072671.1
|
|
| chr1_+_78025995 | 0.03 |
ENSRNOT00000086396
|
Slc8a2
|
solute carrier family 8 member A2 |
| chrX_+_68752597 | 0.02 |
ENSRNOT00000077039
|
Stard8
|
StAR-related lipid transfer domain containing 8 |
| chr19_-_37907714 | 0.02 |
ENSRNOT00000026361
|
Ctrl
|
chymotrypsin-like |
| chr18_-_18079560 | 0.02 |
ENSRNOT00000072093
|
AABR07031533.1
|
|
| chr17_+_20619324 | 0.02 |
ENSRNOT00000079788
|
AABR07027235.1
|
|
| chr15_-_42898150 | 0.02 |
ENSRNOT00000030036
|
Ptk2b
|
protein tyrosine kinase 2 beta |
| chr20_+_6211420 | 0.02 |
ENSRNOT00000000624
|
Kctd20
|
potassium channel tetramerization domain containing 20 |
| chr5_+_148661070 | 0.01 |
ENSRNOT00000056229
|
Nkain1
|
Sodium/potassium transporting ATPase interacting 1 |
| chr5_+_143500441 | 0.01 |
ENSRNOT00000045513
|
Grik3
|
glutamate ionotropic receptor kainate type subunit 3 |
| chr8_-_90984224 | 0.01 |
ENSRNOT00000044931
|
Lca5
|
LCA5, lebercilin |
| chr1_-_102845083 | 0.01 |
ENSRNOT00000082289
|
Saa4
|
serum amyloid A4 |
| chr20_+_44803666 | 0.01 |
ENSRNOT00000057227
|
Rev3l
|
REV3 like, DNA directed polymerase zeta catalytic subunit |
| chr15_-_52029816 | 0.01 |
ENSRNOT00000013067
|
Slc39a14
|
solute carrier family 39 member 14 |
| chr7_+_61165640 | 0.01 |
ENSRNOT00000087955
|
Mdm1
|
Mdm1 nuclear protein |
| chr3_-_146812989 | 0.00 |
ENSRNOT00000011315
|
Nanp
|
N-acetylneuraminic acid phosphatase |
| chr1_-_141655894 | 0.00 |
ENSRNOT00000082591
|
Ap3s2
|
adaptor-related protein complex 3, sigma 2 subunit |
| chr1_+_252944103 | 0.00 |
ENSRNOT00000025770
|
Ifit1
|
interferon-induced protein with tetratricopeptide repeats 1 |
| chr8_-_61519507 | 0.00 |
ENSRNOT00000038347
|
Odf3l1
|
outer dense fiber of sperm tails 3-like 1 |
| chr6_+_21708487 | 0.00 |
ENSRNOT00000087358
|
AABR07063197.1
|
|
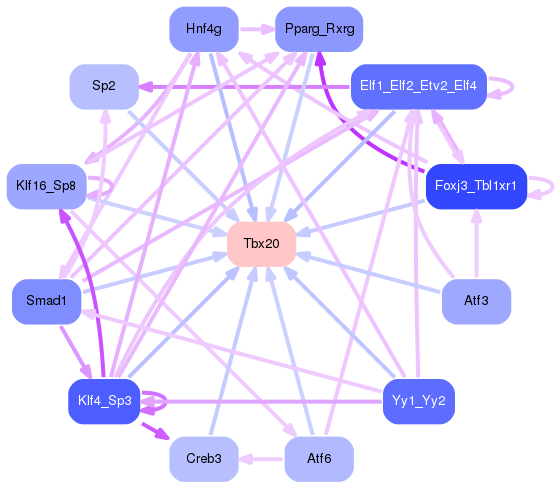
Network of associatons between targets according to the STRING database.
