Project
GSE49485: Hypoxia transcriptome sequencing of rat brain.
Navigation
Downloads
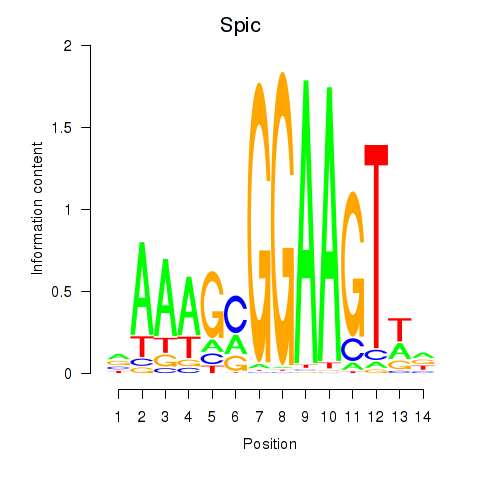
Results for Spic
Z-value: 0.88
Motif logo
Transcription factors associated with Spic
| Gene Symbol | Gene ID | Gene Info |
|---|---|---|
|
Spic
|
ENSRNOG00000005720 | Spi-C transcription factor |
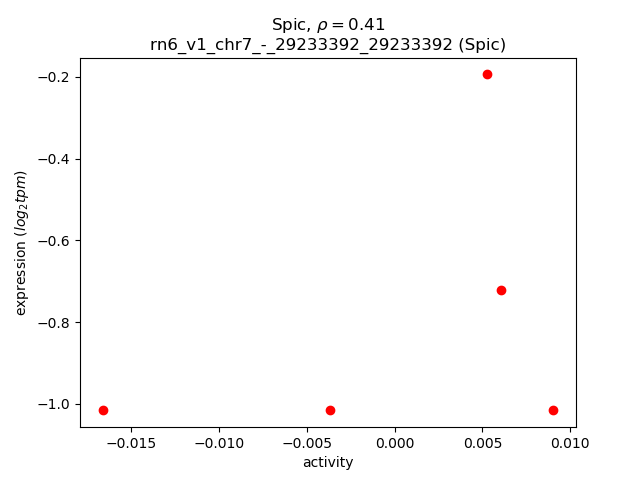
Activity-expression correlation:
| Gene | Promoter | Pearson corr. coef. | P-value | Plot |
|---|---|---|---|---|
| Spic | rn6_v1_chr7_-_29233392_29233392 | 0.41 | 5.0e-01 | Click! |
Activity profile of Spic motif
Sorted Z-values of Spic motif
| Promoter | Log-likelihood | Transcript | Gene | Gene Info |
|---|---|---|---|---|
| chr20_-_5163247 | 0.29 |
ENSRNOT00000001135
|
Aif1
|
allograft inflammatory factor 1 |
| chr6_+_53401109 | 0.29 |
ENSRNOT00000014763
|
Twist1
|
twist family bHLH transcription factor 1 |
| chr1_-_101236065 | 0.28 |
ENSRNOT00000066834
|
Cd37
|
CD37 molecule |
| chr8_+_21663325 | 0.25 |
ENSRNOT00000027749
|
Ubl5
|
ubiquitin-like 5 |
| chr13_-_89606326 | 0.25 |
ENSRNOT00000029179
|
Fcer1g
|
Fc fragment of IgE receptor Ig |
| chr4_-_155923079 | 0.23 |
ENSRNOT00000013308
|
Clec4a3
|
C-type lectin domain family 4, member A3 |
| chr13_+_89386023 | 0.23 |
ENSRNOT00000086223
|
Fcgr3a
|
Fc fragment of IgG receptor IIIa |
| chr5_-_155258392 | 0.21 |
ENSRNOT00000017065
|
C1qc
|
complement C1q C chain |
| chr2_-_28799266 | 0.20 |
ENSRNOT00000089293
|
Tmem171
|
transmembrane protein 171 |
| chr5_-_155252003 | 0.19 |
ENSRNOT00000017060
|
C1qb
|
complement C1q B chain |
| chr8_+_81949877 | 0.19 |
ENSRNOT00000030221
|
LOC100360828
|
cAMP-regulated phosphoprotein 19-like |
| chr1_-_146289465 | 0.19 |
ENSRNOT00000017362
|
Abhd17c
|
abhydrolase domain containing 17C |
| chr9_+_81518176 | 0.19 |
ENSRNOT00000078317
ENSRNOT00000019265 ENSRNOT00000088246 ENSRNOT00000084682 |
Arpc2
|
actin related protein 2/3 complex, subunit 2 |
| chr13_-_89433815 | 0.19 |
ENSRNOT00000091541
|
Fcgr2b
|
Fc fragment of IgG receptor IIb |
| chr1_+_219481575 | 0.18 |
ENSRNOT00000025507
|
Pold4
|
DNA polymerase delta 4, accessory subunit |
| chr1_-_13175876 | 0.18 |
ENSRNOT00000084870
|
Abracl
|
ABRA C-terminal like |
| chr1_-_281101438 | 0.18 |
ENSRNOT00000012734
|
Rab11fip2
|
RAB11 family interacting protein 2 |
| chr6_+_26836216 | 0.18 |
ENSRNOT00000077903
ENSRNOT00000011373 |
Ost4
|
oligosaccharyltransferase complex subunit 4, non-catalytic |
| chr10_-_57436368 | 0.18 |
ENSRNOT00000056608
|
Scimp
|
SLP adaptor and CSK interacting membrane protein |
| chr4_+_145330457 | 0.18 |
ENSRNOT00000011937
|
Arpc4
|
actin related protein 2/3 complex, subunit 4 |
| chr5_+_149047681 | 0.17 |
ENSRNOT00000015198
|
Laptm5
|
lysosomal protein transmembrane 5 |
| chr4_-_157252104 | 0.17 |
ENSRNOT00000082739
|
Ptpn6
|
protein tyrosine phosphatase, non-receptor type 6 |
| chr17_+_80250521 | 0.17 |
ENSRNOT00000023446
|
Pter
|
phosphotriesterase related |
| chr4_-_120414118 | 0.17 |
ENSRNOT00000072795
|
LOC100911337
|
40S ribosomal protein S25-like |
| chr7_+_58814805 | 0.17 |
ENSRNOT00000005909
|
Tspan8
|
tetraspanin 8 |
| chr6_+_137323713 | 0.17 |
ENSRNOT00000029017
|
Pld4
|
phospholipase D family, member 4 |
| chr1_-_47502952 | 0.16 |
ENSRNOT00000025580
|
Tagap
|
T-cell activation RhoGTPase activating protein |
| chr1_+_215628785 | 0.16 |
ENSRNOT00000054864
|
Lsp1
|
lymphocyte-specific protein 1 |
| chr19_+_26194465 | 0.16 |
ENSRNOT00000087627
ENSRNOT00000065931 |
Wdr83os
|
WD repeat domain 83 opposite strand |
| chr1_+_87938042 | 0.16 |
ENSRNOT00000027837
|
Map4k1
|
mitogen activated protein kinase kinase kinase kinase 1 |
| chr13_+_89385859 | 0.16 |
ENSRNOT00000047434
|
Fcgr3a
|
Fc fragment of IgG receptor IIIa |
| chr8_-_96547568 | 0.16 |
ENSRNOT00000078343
|
RGD1560775
|
similar to RIKEN cDNA 4930579C12 gene |
| chr9_-_52830457 | 0.16 |
ENSRNOT00000073557
|
Slc40a1
|
solute carrier family 40 member 1 |
| chr8_-_117820413 | 0.15 |
ENSRNOT00000075819
|
Tma7
|
translation machinery associated 7 homolog |
| chr1_-_165997751 | 0.15 |
ENSRNOT00000050227
|
P2ry6
|
pyrimidinergic receptor P2Y6 |
| chr1_-_198120061 | 0.15 |
ENSRNOT00000026231
|
Slx1b
|
SLX1 structure-specific endonuclease subunit homolog B (S. cerevisiae) |
| chr11_-_67756799 | 0.15 |
ENSRNOT00000030975
|
Parp9
|
poly (ADP-ribose) polymerase family, member 9 |
| chr2_-_185303610 | 0.15 |
ENSRNOT00000093479
ENSRNOT00000046286 |
NEWGENE_1592020
|
protease, serine 48 |
| chr14_-_100184192 | 0.15 |
ENSRNOT00000007044
|
Plek
|
pleckstrin |
| chr10_+_86819472 | 0.14 |
ENSRNOT00000081424
|
Cdc6
|
cell division cycle 6 |
| chr4_-_99746560 | 0.14 |
ENSRNOT00000012021
|
Mrpl35
|
mitochondrial ribosomal protein L35 |
| chr2_-_209537087 | 0.14 |
ENSRNOT00000024344
|
Cd53
|
Cd53 molecule |
| chr19_-_15540773 | 0.14 |
ENSRNOT00000022359
|
Lpcat2
|
lysophosphatidylcholine acyltransferase 2 |
| chr10_+_55924938 | 0.14 |
ENSRNOT00000087003
ENSRNOT00000057079 |
Trappc1
|
trafficking protein particle complex 1 |
| chr2_+_234375315 | 0.14 |
ENSRNOT00000071270
|
LOC102549542
|
elongation of very long chain fatty acids protein 6-like |
| chr20_-_4368693 | 0.14 |
ENSRNOT00000000501
|
Rnf5
|
ring finger protein 5 |
| chr3_+_160467552 | 0.13 |
ENSRNOT00000066657
|
Stk4
|
serine/threonine kinase 4 |
| chr15_-_34352673 | 0.13 |
ENSRNOT00000064916
|
Nedd8
|
neural precursor cell expressed, developmentally down-regulated 8 |
| chr9_-_26932201 | 0.13 |
ENSRNOT00000017081
|
Mcm3
|
minichromosome maintenance complex component 3 |
| chr12_+_24148567 | 0.13 |
ENSRNOT00000077378
ENSRNOT00000045157 |
Ccl24
|
C-C motif chemokine ligand 24 |
| chr5_-_57896475 | 0.13 |
ENSRNOT00000017903
|
RGD1561916
|
similar to testes development-related NYD-SP22 isoform 1 |
| chr13_+_99663150 | 0.12 |
ENSRNOT00000036705
|
Cnih3
|
cornichon family AMPA receptor auxiliary protein 3 |
| chr1_+_215609645 | 0.12 |
ENSRNOT00000076140
ENSRNOT00000027487 |
Tnni2
|
troponin I2, fast skeletal type |
| chr10_-_3321404 | 0.12 |
ENSRNOT00000093722
ENSRNOT00000003284 |
Pdxdc1
|
pyridoxal-dependent decarboxylase domain containing 1 |
| chr11_+_31560530 | 0.12 |
ENSRNOT00000061345
|
Il10rb
|
interleukin 10 receptor subunit beta |
| chr1_-_260254600 | 0.12 |
ENSRNOT00000019014
|
Blnk
|
B-cell linker |
| chr7_-_12899004 | 0.12 |
ENSRNOT00000011086
|
Gzmm
|
granzyme M |
| chr4_-_120041238 | 0.12 |
ENSRNOT00000073799
|
LOC100911337
|
40S ribosomal protein S25-like |
| chr2_+_55835151 | 0.12 |
ENSRNOT00000018634
|
Fyb
|
FYN binding protein |
| chr7_+_78005232 | 0.12 |
ENSRNOT00000005803
|
Dcaf13
|
DDB1 and CUL4 associated factor 13 |
| chr3_+_160391106 | 0.12 |
ENSRNOT00000016981
|
Ywhab
|
tyrosine 3-monooxygenase/tryptophan 5-monooxygenase activation protein, beta |
| chr1_-_277181345 | 0.12 |
ENSRNOT00000038017
ENSRNOT00000038038 |
Nrap
|
nebulin-related anchoring protein |
| chr2_-_198002625 | 0.11 |
ENSRNOT00000091888
|
BC028528
|
cDNA sequence BC028528 |
| chr6_-_27323992 | 0.11 |
ENSRNOT00000013198
|
RGD1559683
|
similar to RIKEN cDNA 1700001C02 |
| chr1_+_215610368 | 0.11 |
ENSRNOT00000078903
ENSRNOT00000087781 |
Tnni2
|
troponin I2, fast skeletal type |
| chr2_+_210045161 | 0.11 |
ENSRNOT00000024455
|
Slc16a4
|
solute carrier family 16, member 4 |
| chr9_+_81518584 | 0.11 |
ENSRNOT00000084309
|
Arpc2
|
actin related protein 2/3 complex, subunit 2 |
| chr1_-_101118825 | 0.11 |
ENSRNOT00000066328
|
Rps11
|
ribosomal protein S11 |
| chr4_-_170932618 | 0.10 |
ENSRNOT00000007779
|
Arhgdib
|
Rho GDP dissociation inhibitor beta |
| chr6_+_129609375 | 0.10 |
ENSRNOT00000083732
|
Papola
|
poly (A) polymerase alpha |
| chr5_-_38923095 | 0.10 |
ENSRNOT00000009146
|
AABR07047593.1
|
|
| chr20_+_5441876 | 0.10 |
ENSRNOT00000092476
|
Rps18
|
ribosomal protein S18 |
| chr12_-_39667849 | 0.10 |
ENSRNOT00000011499
|
Arpc3
|
actin related protein 2/3 complex, subunit 3 |
| chr19_-_55257876 | 0.10 |
ENSRNOT00000017564
|
Cyba
|
cytochrome b-245 alpha chain |
| chr20_+_4530342 | 0.10 |
ENSRNOT00000076352
ENSRNOT00000000478 ENSRNOT00000075925 |
Nelfe
|
negative elongation factor complex member E |
| chr10_-_109630005 | 0.10 |
ENSRNOT00000075206
|
Oxld1
|
oxidoreductase-like domain containing 1 |
| chr1_+_242959488 | 0.10 |
ENSRNOT00000015668
|
Dock8
|
dedicator of cytokinesis 8 |
| chr7_+_11784341 | 0.10 |
ENSRNOT00000026155
|
Plekhj1
|
pleckstrin homology domain containing J1 |
| chr3_+_175629374 | 0.10 |
ENSRNOT00000084027
|
Rps21
|
ribosomal protein S21 |
| chr5_-_78267063 | 0.10 |
ENSRNOT00000040894
ENSRNOT00000087648 |
Cdc26
|
cell division cycle 26 |
| chr4_-_165192647 | 0.10 |
ENSRNOT00000086461
|
Klra5
|
killer cell lectin-like receptor, subfamily A, member 5 |
| chr1_-_198662610 | 0.09 |
ENSRNOT00000055012
|
Sept1
|
septin 1 |
| chr1_+_101517714 | 0.09 |
ENSRNOT00000028423
|
Plekha4
|
pleckstrin homology domain containing A4 |
| chr15_+_12569235 | 0.09 |
ENSRNOT00000083787
|
Thoc7
|
THO complex 7 |
| chr8_+_61615650 | 0.09 |
ENSRNOT00000007261
|
Snupn
|
snurportin 1 |
| chr5_-_136721379 | 0.09 |
ENSRNOT00000026704
|
Atp6v0b
|
ATPase H+ transporting V0 subunit B |
| chr2_+_69415057 | 0.09 |
ENSRNOT00000013152
|
Cdh10
|
cadherin 10 |
| chr12_+_22259713 | 0.09 |
ENSRNOT00000001913
|
Pop7
|
POP7 homolog, ribonuclease P/MRP subunit |
| chr8_+_116318963 | 0.09 |
ENSRNOT00000036556
|
Tusc2
|
tumor suppressor candidate 2 |
| chr4_-_146839397 | 0.09 |
ENSRNOT00000010338
|
Vgll4
|
vestigial-like family member 4 |
| chr8_+_5768811 | 0.09 |
ENSRNOT00000013936
|
Mmp8
|
matrix metallopeptidase 8 |
| chr7_+_91384187 | 0.09 |
ENSRNOT00000005828
|
Utp23
|
UTP23, small subunit processome component |
| chr1_+_198120099 | 0.09 |
ENSRNOT00000073652
|
Bola2
|
bolA family member 2 |
| chr2_+_260884337 | 0.09 |
ENSRNOT00000032808
|
Cryz
|
crystallin zeta |
| chr2_+_52152536 | 0.09 |
ENSRNOT00000072691
|
AABR07008293.2
|
|
| chrX_+_78196300 | 0.09 |
ENSRNOT00000048695
|
P2ry10
|
purinergic receptor P2Y10 |
| chr5_+_61425746 | 0.09 |
ENSRNOT00000064113
|
RGD1305807
|
hypothetical LOC298077 |
| chr13_-_61070599 | 0.09 |
ENSRNOT00000005251
|
Rgs1
|
regulator of G-protein signaling 1 |
| chr9_-_9675110 | 0.09 |
ENSRNOT00000073294
|
Vav1
|
vav guanine nucleotide exchange factor 1 |
| chr5_+_126783061 | 0.09 |
ENSRNOT00000013224
|
Tmem59
|
transmembrane protein 59 |
| chr6_+_101865917 | 0.09 |
ENSRNOT00000029888
|
Fam71d
|
family with sequence similarity 71, member D |
| chr4_-_44136815 | 0.09 |
ENSRNOT00000086810
|
Tfec
|
transcription factor EC |
| chr13_-_90641772 | 0.09 |
ENSRNOT00000064601
|
Atp1a4
|
ATPase Na+/K+ transporting subunit alpha 4 |
| chr20_+_18547370 | 0.09 |
ENSRNOT00000000750
|
Ube2d1
|
ubiquitin-conjugating enzyme E2D 1 |
| chr14_-_23604834 | 0.09 |
ENSRNOT00000002760
|
Stap1
|
signal transducing adaptor family member 1 |
| chr1_+_197999336 | 0.09 |
ENSRNOT00000023555
|
Apobr
|
apolipoprotein B receptor |
| chr7_+_145068286 | 0.09 |
ENSRNOT00000088956
ENSRNOT00000065753 |
Nckap1l
|
NCK associated protein 1 like |
| chr3_+_28416954 | 0.09 |
ENSRNOT00000043533
|
Kynu
|
kynureninase |
| chr6_+_28663602 | 0.08 |
ENSRNOT00000005402
|
Ptrhd1
|
peptidyl-tRNA hydrolase domain containing 1 |
| chr2_-_27949066 | 0.08 |
ENSRNOT00000081472
ENSRNOT00000022138 |
Nsa2
|
NSA2 ribosome biogenesis homolog |
| chr11_-_54545230 | 0.08 |
ENSRNOT00000002676
|
Retnla
|
resistin like alpha |
| chr1_-_77830399 | 0.08 |
ENSRNOT00000052231
|
LOC100360449
|
ribosomal protein L9-like |
| chr3_+_28627084 | 0.08 |
ENSRNOT00000049884
|
Arhgap15
|
Rho GTPase activating protein 15 |
| chr8_+_61607015 | 0.08 |
ENSRNOT00000023456
|
Imp3
|
IMP3, U3 small nucleolar ribonucleoprotein |
| chr5_+_169244778 | 0.08 |
ENSRNOT00000064841
|
Plekhg5
|
pleckstrin homology and RhoGEF domain containing G5 |
| chr2_-_250923744 | 0.08 |
ENSRNOT00000084996
|
Clca1
|
chloride channel accessory 1 |
| chr6_+_48021771 | 0.08 |
ENSRNOT00000060185
|
Tssc1
|
tumor suppressing subtransferable candidate 1 |
| chr9_+_8052210 | 0.08 |
ENSRNOT00000073659
|
Adgre4
|
adhesion G protein-coupled receptor E4 |
| chr1_-_98521706 | 0.08 |
ENSRNOT00000015941
|
Siglec10
|
sialic acid binding Ig-like lectin 10 |
| chr4_-_164453171 | 0.08 |
ENSRNOT00000077539
ENSRNOT00000083610 ENSRNOT00000079975 |
Ly49s6
|
Ly49 stimulatory receptor 6 |
| chr4_+_163174487 | 0.08 |
ENSRNOT00000088108
|
Clec9a
|
C-type lectin domain family 9, member A |
| chr13_+_34267471 | 0.08 |
ENSRNOT00000061619
ENSRNOT00000092802 |
Nifk
|
nucleolar protein interacting with the FHA domain of MKI67 |
| chr2_+_28370373 | 0.08 |
ENSRNOT00000073183
|
LOC100910438
|
ankyrin repeat family A protein 2-like |
| chr7_-_12646960 | 0.08 |
ENSRNOT00000014687
|
Prtn3
|
proteinase 3 |
| chr10_-_109757550 | 0.08 |
ENSRNOT00000054957
|
Arhgdia
|
Rho GDP dissociation inhibitor alpha |
| chr1_-_227506822 | 0.08 |
ENSRNOT00000091506
|
Ms4a7
|
membrane spanning 4-domains A7 |
| chr10_+_91126689 | 0.08 |
ENSRNOT00000004046
|
Nmt1
|
N-myristoyltransferase 1 |
| chr7_-_1188165 | 0.08 |
ENSRNOT00000076063
ENSRNOT00000074108 |
Arl13b
|
ADP-ribosylation factor like GTPase 13B |
| chr1_-_103760913 | 0.08 |
ENSRNOT00000049722
|
Mrgprx2
|
MAS-related GPR, member X2 |
| chr10_+_83655460 | 0.08 |
ENSRNOT00000008011
|
Gngt2
|
G protein subunit gamma transducin 2 |
| chrX_+_72684329 | 0.08 |
ENSRNOT00000057644
|
Dmrtc1c1
|
DMRT-like family C1c1 |
| chr4_-_164406146 | 0.08 |
ENSRNOT00000090110
|
Klra22
|
killer cell lectin-like receptor subfamily A, member 22 |
| chr11_-_66759402 | 0.08 |
ENSRNOT00000003326
|
Hcls1
|
hematopoietic cell specific Lyn substrate 1 |
| chr12_-_38116919 | 0.08 |
ENSRNOT00000001467
|
Denr
|
density regulated reinitiation and release factor |
| chr13_-_89668473 | 0.07 |
ENSRNOT00000004938
|
Ufc1
|
ubiquitin-fold modifier conjugating enzyme 1 |
| chrX_-_138237157 | 0.07 |
ENSRNOT00000003414
|
Rap2c
|
RAP2C, member of RAS oncogene family |
| chr1_-_254671778 | 0.07 |
ENSRNOT00000025493
|
Htr7
|
5-hydroxytryptamine receptor 7 |
| chr10_+_69412017 | 0.07 |
ENSRNOT00000009448
|
Ccl2
|
C-C motif chemokine ligand 2 |
| chr16_-_84406538 | 0.07 |
ENSRNOT00000051980
|
LOC500845
|
LRRG00131 |
| chr1_+_189550354 | 0.07 |
ENSRNOT00000083153
|
Exnef
|
exonuclease NEF-sp |
| chr1_-_140535934 | 0.07 |
ENSRNOT00000065457
|
Det1
|
de-etiolated homolog 1 (Arabidopsis) |
| chr6_+_129519709 | 0.07 |
ENSRNOT00000006307
|
Gskip
|
GSK3B interacting protein |
| chr6_-_102047758 | 0.07 |
ENSRNOT00000012101
|
Atp6v1d
|
ATPase H+ transporting V1 subunit D |
| chr2_-_197982385 | 0.07 |
ENSRNOT00000034074
|
Mrps21
|
mitochondrial ribosomal protein S21 |
| chr6_-_94834908 | 0.07 |
ENSRNOT00000006284
|
L3hypdh
|
trans-L-3-hydroxyproline dehydratase |
| chr5_+_163612518 | 0.07 |
ENSRNOT00000071103
|
LOC103692519
|
60S ribosomal protein L9 pseudogene |
| chr1_-_98521551 | 0.07 |
ENSRNOT00000081922
|
Siglec10
|
sialic acid binding Ig-like lectin 10 |
| chr1_-_157461588 | 0.07 |
ENSRNOT00000068402
|
Ankrd42
|
ankyrin repeat domain 42 |
| chr6_-_103470427 | 0.07 |
ENSRNOT00000091560
ENSRNOT00000088795 ENSRNOT00000079824 |
Actn1
|
actinin, alpha 1 |
| chr18_+_29386809 | 0.07 |
ENSRNOT00000082079
ENSRNOT00000024825 |
Eif4ebp3
|
eukaryotic translation initiation factor 4E binding protein 3 |
| chr1_+_189549960 | 0.07 |
ENSRNOT00000019654
|
Exnef
|
exonuclease NEF-sp |
| chr10_+_109630099 | 0.07 |
ENSRNOT00000072099
|
Ccdc137
|
coiled-coil domain containing 137 |
| chr9_-_65329066 | 0.07 |
ENSRNOT00000018284
|
Ppil3
|
peptidylprolyl isomerase like 3 |
| chr10_+_55013703 | 0.07 |
ENSRNOT00000032785
|
Pik3r5
|
phosphoinositide-3-kinase, regulatory subunit 5 |
| chr10_+_85978691 | 0.07 |
ENSRNOT00000006359
|
Rpl19
|
ribosomal protein L19 |
| chr18_+_35574002 | 0.07 |
ENSRNOT00000093442
ENSRNOT00000070817 ENSRNOT00000093356 |
Myot
|
myotilin |
| chr3_-_63535991 | 0.07 |
ENSRNOT00000015722
|
Fkbp7
|
FK506 binding protein 7 |
| chr1_+_88620317 | 0.07 |
ENSRNOT00000075116
|
Cox7a1
|
cytochrome c oxidase subunit 7A1 |
| chr4_-_165026414 | 0.07 |
ENSRNOT00000071421
|
Klra1
|
killer cell lectin-like receptor, subfamily A, member 1 |
| chr9_+_37727942 | 0.07 |
ENSRNOT00000016511
ENSRNOT00000074276 |
LOC100912306
|
myotilin-like |
| chr20_+_6869767 | 0.07 |
ENSRNOT00000000631
ENSRNOT00000086330 ENSRNOT00000093188 ENSRNOT00000093736 |
RGD735065
|
similar to GI:13385412-like protein splice form I |
| chr4_-_157252565 | 0.07 |
ENSRNOT00000079947
|
Ptpn6
|
protein tyrosine phosphatase, non-receptor type 6 |
| chr5_-_155916893 | 0.07 |
ENSRNOT00000055947
|
Ldlrad2
|
low density lipoprotein receptor class A domain containing 2 |
| chr13_+_110007010 | 0.07 |
ENSRNOT00000005387
|
Tmem206
|
transmembrane protein 206 |
| chr7_+_135803698 | 0.07 |
ENSRNOT00000007932
|
Irak4
|
interleukin-1 receptor-associated kinase 4 |
| chr1_-_198652674 | 0.07 |
ENSRNOT00000023706
|
Tbc1d10b
|
TBC1 domain family, member 10b |
| chr9_+_94745217 | 0.06 |
ENSRNOT00000051338
|
Inpp5d
|
inositol polyphosphate-5-phosphatase D |
| chr3_+_159995064 | 0.06 |
ENSRNOT00000012606
|
Ttpal
|
alpha tocopherol transfer protein like |
| chr1_-_91074294 | 0.06 |
ENSRNOT00000075236
|
LOC687508
|
similar to Cytochrome c oxidase polypeptide VIIa-heart, mitochondrial precursor (Cytochrome c oxidase subunit VIIa-H) (COX VIIa-M) |
| chr6_-_111132320 | 0.06 |
ENSRNOT00000016057
|
Ngb
|
neuroglobin |
| chr17_+_9797907 | 0.06 |
ENSRNOT00000021638
|
Lman2
|
lectin, mannose-binding 2 |
| chr10_+_65805860 | 0.06 |
ENSRNOT00000011795
|
Ift20
|
intraflagellar transport 20 |
| chr11_-_14304603 | 0.06 |
ENSRNOT00000040202
ENSRNOT00000082143 |
Samsn1
|
SAM domain, SH3 domain and nuclear localization signals, 1 |
| chr1_+_60717386 | 0.06 |
ENSRNOT00000015019
|
Ppp2r1a
|
protein phosphatase 2 scaffold subunit A alpha |
| chr1_+_255479261 | 0.06 |
ENSRNOT00000079808
|
Tnks2
|
tankyrase 2 |
| chrX_-_77700269 | 0.06 |
ENSRNOT00000092418
|
Cysltr1
|
cysteinyl leukotriene receptor 1 |
| chr4_+_78320190 | 0.06 |
ENSRNOT00000032742
ENSRNOT00000091359 |
Gimap4
|
GTPase, IMAP family member 4 |
| chr8_-_68525911 | 0.06 |
ENSRNOT00000080588
ENSRNOT00000011109 |
Iqch
|
IQ motif containing H |
| chr4_-_164900857 | 0.06 |
ENSRNOT00000078690
|
Ly49i2
|
Ly49 inhibitory receptor 2 |
| chr13_-_90832469 | 0.06 |
ENSRNOT00000086508
|
Igsf9
|
immunoglobulin superfamily, member 9 |
| chr14_+_81043454 | 0.06 |
ENSRNOT00000043609
|
AC114393.1
|
|
| chr10_+_75087892 | 0.06 |
ENSRNOT00000065910
|
Mpo
|
myeloperoxidase |
| chr11_+_27210593 | 0.06 |
ENSRNOT00000084580
|
Map3k7cl
|
MAP3K7 C-terminal like |
| chr12_+_25497104 | 0.06 |
ENSRNOT00000002028
|
Ncf1
|
neutrophil cytosolic factor 1 |
| chrX_+_17171605 | 0.06 |
ENSRNOT00000048236
|
Nudt10
|
nudix (nucleoside diphosphate linked moiety X)-type motif 10 |
| chr16_+_6970342 | 0.06 |
ENSRNOT00000061294
ENSRNOT00000048344 |
Itih4
|
inter-alpha-trypsin inhibitor heavy chain family, member 4 |
| chr3_+_112228720 | 0.06 |
ENSRNOT00000079079
|
Capn3
|
calpain 3 |
| chr5_-_135472116 | 0.06 |
ENSRNOT00000022170
|
Nasp
|
nuclear autoantigenic sperm protein |
| chr4_-_157433467 | 0.06 |
ENSRNOT00000028965
|
Lag3
|
lymphocyte activating 3 |
| chr3_-_46726946 | 0.06 |
ENSRNOT00000011030
ENSRNOT00000086576 |
Itgb6
|
integrin subunit beta 6 |
| chrX_-_82418425 | 0.06 |
ENSRNOT00000022525
|
Ankra2
|
ankyrin repeat family A member 2 |
| chr1_+_21525421 | 0.06 |
ENSRNOT00000017911
|
Arg1
|
arginase 1 |
| chr4_+_21862313 | 0.06 |
ENSRNOT00000007948
|
Dmtf1
|
cyclin D binding myb-like transcription factor 1 |
| chr20_+_3344870 | 0.06 |
ENSRNOT00000001058
ENSRNOT00000087613 ENSRNOT00000089978 |
Mrps18b
|
mitochondrial ribosomal protein S18B |
| chr1_-_36112993 | 0.06 |
ENSRNOT00000023161
|
Med10
|
mediator complex subunit 10 |
| chr9_+_24066303 | 0.05 |
ENSRNOT00000018163
|
Crisp3
|
cysteine-rich secretory protein 3 |
| chr4_+_6946634 | 0.05 |
ENSRNOT00000040373
|
Wdr86
|
WD repeat domain 86 |
| chrX_+_20351486 | 0.05 |
ENSRNOT00000093675
ENSRNOT00000047444 |
Wnk3
|
WNK lysine deficient protein kinase 3 |
| chr5_-_171459488 | 0.05 |
ENSRNOT00000075423
ENSRNOT00000080686 |
Tprg1l
|
tumor protein p63 regulated 1-like |
| chr9_+_65614142 | 0.05 |
ENSRNOT00000016613
|
Casp8
|
caspase 8 |
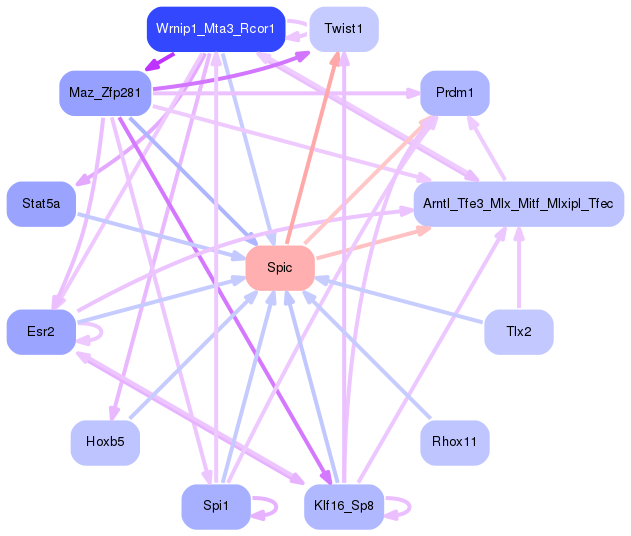
Network of associatons between targets according to the STRING database.

First level regulatory network of Spic
Gene Ontology Analysis
Gene overrepresentation in biological process category:
| Log-likelihood per target | Total log-likelihood | Term | Description |
|---|---|---|---|
| 0.1 | 0.3 | GO:0014739 | positive regulation of muscle hyperplasia(GO:0014739) |
| 0.1 | 0.3 | GO:0035359 | negative regulation of histone phosphorylation(GO:0033128) negative regulation of peroxisome proliferator activated receptor signaling pathway(GO:0035359) |
| 0.1 | 0.3 | GO:0002434 | immune complex clearance(GO:0002434) |
| 0.1 | 0.3 | GO:0030886 | negative regulation of myeloid dendritic cell activation(GO:0030886) |
| 0.1 | 0.2 | GO:0002554 | serotonin secretion by platelet(GO:0002554) |
| 0.1 | 0.3 | GO:2000814 | positive regulation of barbed-end actin filament capping(GO:2000814) |
| 0.1 | 0.2 | GO:0071461 | cellular response to redox state(GO:0071461) |
| 0.1 | 0.2 | GO:0033277 | abortive mitotic cell cycle(GO:0033277) |
| 0.1 | 0.2 | GO:0034395 | regulation of transcription from RNA polymerase II promoter in response to iron(GO:0034395) |
| 0.0 | 0.1 | GO:0006663 | platelet activating factor biosynthetic process(GO:0006663) |
| 0.0 | 0.2 | GO:1904431 | positive regulation of t-circle formation(GO:1904431) |
| 0.0 | 0.2 | GO:0070560 | protein secretion by platelet(GO:0070560) |
| 0.0 | 0.1 | GO:1904845 | regulation of renal output by angiotensin(GO:0002019) response to L-glutamine(GO:1904844) cellular response to L-glutamine(GO:1904845) |
| 0.0 | 0.1 | GO:0060800 | regulation of cell differentiation involved in embryonic placenta development(GO:0060800) |
| 0.0 | 0.1 | GO:0007056 | spindle assembly involved in female meiosis(GO:0007056) |
| 0.0 | 0.1 | GO:0052572 | response to immune response of other organism involved in symbiotic interaction(GO:0052564) response to host immune response(GO:0052572) |
| 0.0 | 0.3 | GO:0038095 | Fc-epsilon receptor signaling pathway(GO:0038095) |
| 0.0 | 0.2 | GO:0045650 | negative regulation of macrophage differentiation(GO:0045650) |
| 0.0 | 0.1 | GO:0046864 | isoprenoid transport(GO:0046864) terpenoid transport(GO:0046865) |
| 0.0 | 0.1 | GO:0090283 | regulation of protein glycosylation in Golgi(GO:0090283) |
| 0.0 | 0.1 | GO:1990091 | sodium-dependent self proteolysis(GO:1990091) |
| 0.0 | 0.1 | GO:1903969 | regulation of macrophage colony-stimulating factor signaling pathway(GO:1902226) regulation of response to macrophage colony-stimulating factor(GO:1903969) regulation of cellular response to macrophage colony-stimulating factor stimulus(GO:1903972) microglial cell migration(GO:1904124) regulation of microglial cell migration(GO:1904139) |
| 0.0 | 0.1 | GO:0070358 | actin polymerization-dependent cell motility(GO:0070358) |
| 0.0 | 0.1 | GO:2000418 | positive regulation of eosinophil migration(GO:2000418) |
| 0.0 | 0.1 | GO:0018201 | peptidyl-glycine modification(GO:0018201) |
| 0.0 | 0.2 | GO:0061737 | leukotriene signaling pathway(GO:0061737) |
| 0.0 | 0.1 | GO:0042509 | regulation of tyrosine phosphorylation of STAT protein(GO:0042509) positive regulation of tyrosine phosphorylation of STAT protein(GO:0042531) |
| 0.0 | 0.1 | GO:0051030 | snRNA transport(GO:0051030) |
| 0.0 | 0.2 | GO:0035589 | G-protein coupled purinergic nucleotide receptor signaling pathway(GO:0035589) |
| 0.0 | 0.1 | GO:0045409 | negative regulation of interleukin-6 biosynthetic process(GO:0045409) |
| 0.0 | 0.1 | GO:0019805 | quinolinate biosynthetic process(GO:0019805) |
| 0.0 | 0.1 | GO:0045903 | positive regulation of translational fidelity(GO:0045903) |
| 0.0 | 0.1 | GO:0002149 | hypochlorous acid metabolic process(GO:0002148) hypochlorous acid biosynthetic process(GO:0002149) |
| 0.0 | 0.1 | GO:1904117 | cellular response to vasopressin(GO:1904117) |
| 0.0 | 0.1 | GO:0070946 | neutrophil mediated killing of gram-positive bacterium(GO:0070946) |
| 0.0 | 0.1 | GO:0090666 | scaRNA localization to Cajal body(GO:0090666) |
| 0.0 | 0.1 | GO:0034625 | fatty acid elongation, monounsaturated fatty acid(GO:0034625) |
| 0.0 | 0.1 | GO:0002188 | translation reinitiation(GO:0002188) |
| 0.0 | 0.1 | GO:0042322 | negative regulation of circadian sleep/wake cycle, REM sleep(GO:0042322) |
| 0.0 | 0.1 | GO:0044565 | dendritic cell proliferation(GO:0044565) |
| 0.0 | 0.1 | GO:2000688 | positive regulation of rubidium ion transport(GO:2000682) positive regulation of rubidium ion transmembrane transporter activity(GO:2000688) |
| 0.0 | 0.1 | GO:0044571 | [2Fe-2S] cluster assembly(GO:0044571) |
| 0.0 | 0.1 | GO:1902544 | regulation of DNA N-glycosylase activity(GO:1902544) |
| 0.0 | 0.0 | GO:0002232 | leukocyte chemotaxis involved in inflammatory response(GO:0002232) |
| 0.0 | 0.1 | GO:0097029 | mature conventional dendritic cell differentiation(GO:0097029) |
| 0.0 | 0.1 | GO:0000480 | endonucleolytic cleavage in 5'-ETS of tricistronic rRNA transcript (SSU-rRNA, 5.8S rRNA, LSU-rRNA)(GO:0000480) |
| 0.0 | 0.1 | GO:1990592 | protein polyufmylation(GO:1990564) protein K69-linked ufmylation(GO:1990592) |
| 0.0 | 0.1 | GO:0010958 | regulation of amino acid import(GO:0010958) |
| 0.0 | 0.1 | GO:0021943 | formation of radial glial scaffolds(GO:0021943) |
| 0.0 | 0.1 | GO:0051754 | meiotic sister chromatid cohesion, centromeric(GO:0051754) |
| 0.0 | 0.2 | GO:0060330 | regulation of response to interferon-gamma(GO:0060330) |
| 0.0 | 0.1 | GO:0000447 | endonucleolytic cleavage in ITS1 to separate SSU-rRNA from 5.8S rRNA and LSU-rRNA from tricistronic rRNA transcript (SSU-rRNA, 5.8S rRNA, LSU-rRNA)(GO:0000447) |
| 0.0 | 0.1 | GO:0045085 | negative regulation of interleukin-2 biosynthetic process(GO:0045085) |
| 0.0 | 0.0 | GO:1903070 | negative regulation of ER-associated ubiquitin-dependent protein catabolic process(GO:1903070) |
| 0.0 | 0.1 | GO:0038044 | transforming growth factor-beta secretion(GO:0038044) |
| 0.0 | 0.0 | GO:0006011 | UDP-glucose metabolic process(GO:0006011) |
| 0.0 | 0.0 | GO:0046946 | hydroxylysine metabolic process(GO:0046946) hydroxylysine biosynthetic process(GO:0046947) |
| 0.0 | 0.1 | GO:0071712 | ER-associated misfolded protein catabolic process(GO:0071712) |
| 0.0 | 0.0 | GO:1900673 | olefin metabolic process(GO:1900673) |
Gene overrepresentation in cellular component category:
| Log-likelihood per target | Total log-likelihood | Term | Description |
|---|---|---|---|
| 0.1 | 0.2 | GO:0033557 | Slx1-Slx4 complex(GO:0033557) |
| 0.0 | 0.3 | GO:0036194 | muscle cell projection(GO:0036194) muscle cell projection membrane(GO:0036195) |
| 0.0 | 0.2 | GO:0043625 | delta DNA polymerase complex(GO:0043625) |
| 0.0 | 0.2 | GO:0042105 | alpha-beta T cell receptor complex(GO:0042105) |
| 0.0 | 0.1 | GO:0034457 | Mpp10 complex(GO:0034457) |
| 0.0 | 0.1 | GO:0032021 | NELF complex(GO:0032021) |
| 0.0 | 0.1 | GO:0005846 | nuclear cap binding complex(GO:0005846) |
| 0.0 | 0.1 | GO:0005927 | muscle tendon junction(GO:0005927) |
| 0.0 | 0.1 | GO:0005944 | phosphatidylinositol 3-kinase complex, class IB(GO:0005944) |
| 0.0 | 0.2 | GO:0005885 | Arp2/3 protein complex(GO:0005885) |
| 0.0 | 0.2 | GO:0097197 | tetraspanin-enriched microdomain(GO:0097197) |
| 0.0 | 0.2 | GO:0005861 | troponin complex(GO:0005861) |
| 0.0 | 0.1 | GO:0030690 | Noc1p-Noc2p complex(GO:0030690) |
| 0.0 | 0.1 | GO:0044299 | C-fiber(GO:0044299) |
| 0.0 | 0.2 | GO:0043020 | NADPH oxidase complex(GO:0043020) |
| 0.0 | 0.0 | GO:0032807 | DNA ligase IV complex(GO:0032807) |
| 0.0 | 0.1 | GO:0030485 | smooth muscle contractile fiber(GO:0030485) |
| 0.0 | 0.1 | GO:0031209 | SCAR complex(GO:0031209) |
| 0.0 | 0.0 | GO:1990730 | VCP-NSFL1C complex(GO:1990730) |
| 0.0 | 0.5 | GO:0001772 | immunological synapse(GO:0001772) |
| 0.0 | 0.1 | GO:0000137 | Golgi cis cisterna(GO:0000137) |
| 0.0 | 0.0 | GO:0097543 | ciliary inversin compartment(GO:0097543) |
| 0.0 | 0.1 | GO:0002177 | manchette(GO:0002177) |
| 0.0 | 0.1 | GO:0030008 | TRAPP complex(GO:0030008) |
| 0.0 | 0.3 | GO:0001891 | phagocytic cup(GO:0001891) |
| 0.0 | 0.2 | GO:0008250 | oligosaccharyltransferase complex(GO:0008250) |
| 0.0 | 0.0 | GO:1902560 | GMP reductase complex(GO:1902560) |
Gene overrepresentation in molecular function category:
| Log-likelihood per target | Total log-likelihood | Term | Description |
|---|---|---|---|
| 0.2 | 0.6 | GO:0019767 | IgE receptor activity(GO:0019767) |
| 0.1 | 0.2 | GO:0015065 | uridine nucleotide receptor activity(GO:0015065) G-protein coupled pyrimidinergic nucleotide receptor activity(GO:0071553) |
| 0.0 | 0.3 | GO:0035650 | AP-1 adaptor complex binding(GO:0035650) |
| 0.0 | 0.1 | GO:0047184 | 1-acylglycerophosphocholine O-acyltransferase activity(GO:0047184) |
| 0.0 | 0.2 | GO:0031014 | troponin T binding(GO:0031014) |
| 0.0 | 0.3 | GO:0031386 | protein tag(GO:0031386) |
| 0.0 | 0.1 | GO:0005157 | macrophage colony-stimulating factor receptor binding(GO:0005157) |
| 0.0 | 0.1 | GO:0016822 | hydrolase activity, acting on acid carbon-carbon bonds(GO:0016822) hydrolase activity, acting on acid carbon-carbon bonds, in ketonic substances(GO:0016823) |
| 0.0 | 0.2 | GO:0004630 | phospholipase D activity(GO:0004630) |
| 0.0 | 0.2 | GO:0019198 | transmembrane receptor protein tyrosine phosphatase activity(GO:0005001) transmembrane receptor protein phosphatase activity(GO:0019198) |
| 0.0 | 0.2 | GO:0008349 | MAP kinase kinase kinase kinase activity(GO:0008349) |
| 0.0 | 0.1 | GO:0004920 | interleukin-10 receptor activity(GO:0004920) |
| 0.0 | 0.1 | GO:0030229 | very-low-density lipoprotein particle receptor activity(GO:0030229) |
| 0.0 | 0.2 | GO:0017108 | 5'-flap endonuclease activity(GO:0017108) |
| 0.0 | 0.1 | GO:0004045 | aminoacyl-tRNA hydrolase activity(GO:0004045) |
| 0.0 | 0.2 | GO:0019864 | IgG binding(GO:0019864) |
| 0.0 | 0.1 | GO:0070181 | small ribosomal subunit rRNA binding(GO:0070181) |
| 0.0 | 0.1 | GO:0004652 | polynucleotide adenylyltransferase activity(GO:0004652) |
| 0.0 | 0.1 | GO:0070404 | NADH binding(GO:0070404) |
| 0.0 | 0.1 | GO:0031727 | CCR2 chemokine receptor binding(GO:0031727) |
| 0.0 | 0.2 | GO:0016175 | superoxide-generating NADPH oxidase activity(GO:0016175) |
| 0.0 | 0.1 | GO:0005068 | transmembrane receptor protein tyrosine kinase adaptor activity(GO:0005068) |
| 0.0 | 0.2 | GO:0015093 | ferrous iron transmembrane transporter activity(GO:0015093) |
| 0.0 | 0.1 | GO:0051425 | inositol bisphosphate phosphatase activity(GO:0016312) PTB domain binding(GO:0051425) |
| 0.0 | 0.1 | GO:0002046 | opsin binding(GO:0002046) |
| 0.0 | 0.0 | GO:0004060 | arylamine N-acetyltransferase activity(GO:0004060) |
| 0.0 | 0.1 | GO:0050815 | phosphoserine binding(GO:0050815) |
| 0.0 | 0.1 | GO:1904264 | ubiquitin protein ligase activity involved in ERAD pathway(GO:1904264) |
| 0.0 | 0.1 | GO:1990932 | 5.8S rRNA binding(GO:1990932) |
| 0.0 | 0.1 | GO:0035877 | death effector domain binding(GO:0035877) |
| 0.0 | 0.1 | GO:0102337 | fatty acid elongase activity(GO:0009922) 3-oxo-arachidoyl-CoA synthase activity(GO:0102336) 3-oxo-cerotoyl-CoA synthase activity(GO:0102337) 3-oxo-lignoceronyl-CoA synthase activity(GO:0102338) |
| 0.0 | 0.0 | GO:0004478 | methionine adenosyltransferase activity(GO:0004478) |
| 0.0 | 0.1 | GO:0004974 | leukotriene receptor activity(GO:0004974) |
| 0.0 | 0.2 | GO:0005092 | GDP-dissociation inhibitor activity(GO:0005092) |
| 0.0 | 0.0 | GO:1904288 | BAT3 complex binding(GO:1904288) |
| 0.0 | 0.1 | GO:0046935 | 1-phosphatidylinositol-3-kinase regulator activity(GO:0046935) |
| 0.0 | 0.0 | GO:1990599 | 3' overhang single-stranded DNA endodeoxyribonuclease activity(GO:1990599) |
| 0.0 | 0.0 | GO:0008475 | procollagen-lysine 5-dioxygenase activity(GO:0008475) procollagen glucosyltransferase activity(GO:0033823) |
| 0.0 | 0.0 | GO:0016657 | GMP reductase activity(GO:0003920) oxidoreductase activity, acting on NAD(P)H, nitrogenous group as acceptor(GO:0016657) |
Gene overrepresentation in curated gene sets: canonical pathways category:
| Log-likelihood per target | Total log-likelihood | Term | Description |
|---|---|---|---|
| 0.0 | 0.3 | SA MMP CYTOKINE CONNECTION | Cytokines can induce activation of matrix metalloproteinases, which degrade extracellular matrix. |
| 0.0 | 0.2 | PID TCR JNK PATHWAY | JNK signaling in the CD4+ TCR pathway |
| 0.0 | 0.3 | PID P38 MK2 PATHWAY | p38 signaling mediated by MAPKAP kinases |
| 0.0 | 0.7 | PID FCER1 PATHWAY | Fc-epsilon receptor I signaling in mast cells |
| 0.0 | 0.7 | PID RAC1 PATHWAY | RAC1 signaling pathway |
| 0.0 | 0.1 | SA B CELL RECEPTOR COMPLEXES | Antigen binding to B cell receptors activates protein tyrosine kinases, such as the Src family, which ultimate activate MAP kinases. |
Gene overrepresentation in curated gene sets: REACTOME pathways category:
| Log-likelihood per target | Total log-likelihood | Term | Description |
|---|---|---|---|
| 0.0 | 0.4 | REACTOME CREATION OF C4 AND C2 ACTIVATORS | Genes involved in Creation of C4 and C2 activators |
| 0.0 | 0.4 | REACTOME SIGNAL REGULATORY PROTEIN SIRP FAMILY INTERACTIONS | Genes involved in Signal regulatory protein (SIRP) family interactions |
| 0.0 | 0.2 | REACTOME P2Y RECEPTORS | Genes involved in P2Y receptors |
| 0.0 | 0.2 | REACTOME REMOVAL OF THE FLAP INTERMEDIATE FROM THE C STRAND | Genes involved in Removal of the Flap Intermediate from the C-strand |
| 0.0 | 0.2 | REACTOME PLATELET ADHESION TO EXPOSED COLLAGEN | Genes involved in Platelet Adhesion to exposed collagen |
| 0.0 | 0.6 | REACTOME IMMUNOREGULATORY INTERACTIONS BETWEEN A LYMPHOID AND A NON LYMPHOID CELL | Genes involved in Immunoregulatory interactions between a Lymphoid and a non-Lymphoid cell |
| 0.0 | 0.2 | REACTOME REGULATION OF SIGNALING BY CBL | Genes involved in Regulation of signaling by CBL |
| 0.0 | 0.3 | REACTOME SIGNALING BY HIPPO | Genes involved in Signaling by Hippo |
| 0.0 | 0.2 | REACTOME CONVERSION FROM APC C CDC20 TO APC C CDH1 IN LATE ANAPHASE | Genes involved in Conversion from APC/C:Cdc20 to APC/C:Cdh1 in late anaphase |
| 0.0 | 0.1 | REACTOME TRYPTOPHAN CATABOLISM | Genes involved in Tryptophan catabolism |