Project
GSE49485: Hypoxia transcriptome sequencing of rat brain.
Navigation
Downloads
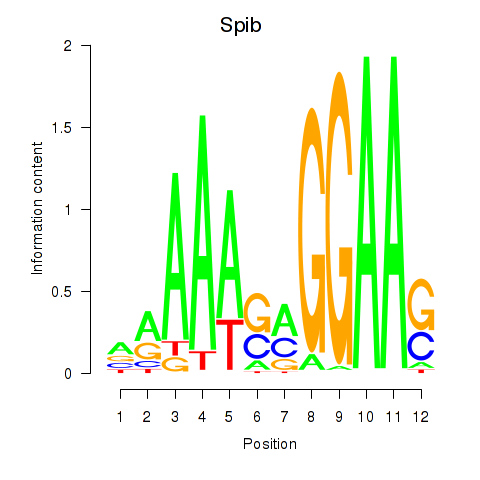
Results for Spib
Z-value: 0.61
Motif logo
Transcription factors associated with Spib
| Gene Symbol | Gene ID | Gene Info |
|---|---|---|
|
Spib
|
ENSRNOG00000019660 | Spi-B transcription factor |
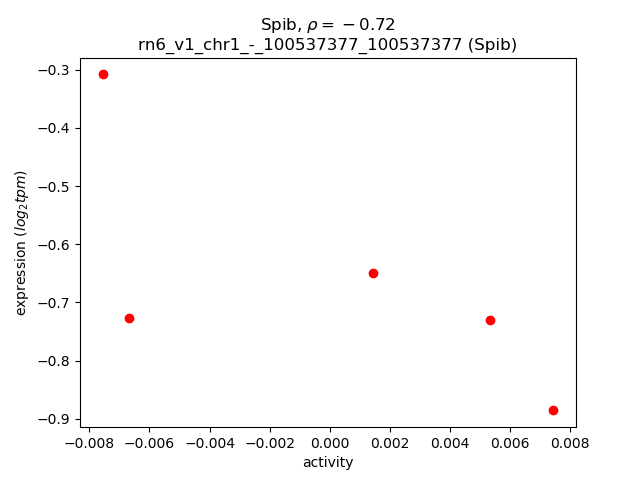
Activity-expression correlation:
| Gene | Promoter | Pearson corr. coef. | P-value | Plot |
|---|---|---|---|---|
| Spib | rn6_v1_chr1_-_100537377_100537377 | -0.72 | 1.7e-01 | Click! |
Activity profile of Spib motif
Sorted Z-values of Spib motif
| Promoter | Log-likelihood | Transcript | Gene | Gene Info |
|---|---|---|---|---|
| chr6_+_53401109 | 0.23 |
ENSRNOT00000014763
|
Twist1
|
twist family bHLH transcription factor 1 |
| chr4_-_155923079 | 0.20 |
ENSRNOT00000013308
|
Clec4a3
|
C-type lectin domain family 4, member A3 |
| chr1_-_101236065 | 0.17 |
ENSRNOT00000066834
|
Cd37
|
CD37 molecule |
| chr13_-_91198036 | 0.16 |
ENSRNOT00000004204
|
LOC108348047
|
low affinity immunoglobulin gamma Fc region receptor III |
| chr10_-_103685844 | 0.16 |
ENSRNOT00000064284
|
Cd300lf
|
Cd300 molecule-like family member F |
| chr16_-_19791832 | 0.15 |
ENSRNOT00000040393
|
Ushbp1
|
USH1 protein network component harmonin binding protein 1 |
| chr20_-_5163247 | 0.14 |
ENSRNOT00000001135
|
Aif1
|
allograft inflammatory factor 1 |
| chr6_-_47904163 | 0.13 |
ENSRNOT00000011333
|
Rps7
|
ribosomal protein S7 |
| chr7_-_122644054 | 0.12 |
ENSRNOT00000025941
|
Dnajb7
|
DnaJ heat shock protein family (Hsp40) member B7 |
| chr2_-_198439454 | 0.12 |
ENSRNOT00000028780
|
Fcgr1a
|
Fc fragment of IgG receptor Ia |
| chr13_-_91197744 | 0.12 |
ENSRNOT00000047349
|
LOC108348047
|
low affinity immunoglobulin gamma Fc region receptor III |
| chr2_+_55835151 | 0.11 |
ENSRNOT00000018634
|
Fyb
|
FYN binding protein |
| chrX_+_92596378 | 0.10 |
ENSRNOT00000045001
|
Pcdh11x
|
protocadherin 11 X-linked |
| chr8_+_21663325 | 0.10 |
ENSRNOT00000027749
|
Ubl5
|
ubiquitin-like 5 |
| chr4_-_15505362 | 0.10 |
ENSRNOT00000009763
|
Hgf
|
hepatocyte growth factor |
| chr1_+_219481575 | 0.10 |
ENSRNOT00000025507
|
Pold4
|
DNA polymerase delta 4, accessory subunit |
| chr1_+_242959488 | 0.09 |
ENSRNOT00000015668
|
Dock8
|
dedicator of cytokinesis 8 |
| chr1_+_226634009 | 0.09 |
ENSRNOT00000028094
|
Cyb561a3
|
cytochrome b561 family, member A3 |
| chr4_+_175729726 | 0.09 |
ENSRNOT00000013230
|
Slco1c1
|
solute carrier organic anion transporter family, member 1c1 |
| chr2_-_185303610 | 0.09 |
ENSRNOT00000093479
ENSRNOT00000046286 |
NEWGENE_1592020
|
protease, serine 48 |
| chr18_-_77579969 | 0.09 |
ENSRNOT00000034896
|
Sall3
|
spalt-like transcription factor 3 |
| chr16_-_19349080 | 0.09 |
ENSRNOT00000038494
|
Hsh2d
|
hematopoietic SH2 domain containing |
| chr14_-_100184192 | 0.09 |
ENSRNOT00000007044
|
Plek
|
pleckstrin |
| chr12_+_25497104 | 0.09 |
ENSRNOT00000002028
|
Ncf1
|
neutrophil cytosolic factor 1 |
| chr7_+_145068286 | 0.08 |
ENSRNOT00000088956
ENSRNOT00000065753 |
Nckap1l
|
NCK associated protein 1 like |
| chr5_+_154489590 | 0.08 |
ENSRNOT00000035788
|
Id3
|
inhibitor of DNA binding 3, HLH protein |
| chr4_+_145330457 | 0.08 |
ENSRNOT00000011937
|
Arpc4
|
actin related protein 2/3 complex, subunit 4 |
| chr2_+_182723854 | 0.08 |
ENSRNOT00000012658
|
Sfrp2
|
secreted frizzled-related protein 2 |
| chr8_-_96547568 | 0.08 |
ENSRNOT00000078343
|
RGD1560775
|
similar to RIKEN cDNA 4930579C12 gene |
| chr4_+_115024927 | 0.08 |
ENSRNOT00000090987
|
Mob1a
|
MOB kinase activator 1A |
| chr1_-_198008893 | 0.08 |
ENSRNOT00000025950
|
Il27
|
interleukin 27 |
| chr3_+_160467552 | 0.08 |
ENSRNOT00000066657
|
Stk4
|
serine/threonine kinase 4 |
| chr1_+_221420271 | 0.08 |
ENSRNOT00000028481
|
LOC687780
|
similar to Finkel-Biskis-Reilly murine sarcoma virusubiquitously expressed |
| chr10_+_83655460 | 0.08 |
ENSRNOT00000008011
|
Gngt2
|
G protein subunit gamma transducin 2 |
| chr5_+_25168295 | 0.07 |
ENSRNOT00000020245
|
Fsbp
|
fibrinogen silencer binding protein |
| chr4_+_66670618 | 0.07 |
ENSRNOT00000010796
|
Tbxas1
|
thromboxane A synthase 1 |
| chr6_-_47904437 | 0.07 |
ENSRNOT00000092867
|
Rps7
|
ribosomal protein S7 |
| chr14_+_58877806 | 0.07 |
ENSRNOT00000051559
|
RGD1562755
|
similar to 60S ribosomal protein L23a |
| chr7_+_122160171 | 0.07 |
ENSRNOT00000074499
|
LOC100362980
|
CG3918-like |
| chr3_-_23297774 | 0.07 |
ENSRNOT00000019162
|
Rpl35
|
ribosomal protein L35 |
| chr17_-_1648973 | 0.07 |
ENSRNOT00000036212
|
Slc35d2
|
solute carrier family 35 member D2 |
| chr10_+_56187679 | 0.07 |
ENSRNOT00000085115
|
Tp53
|
tumor protein p53 |
| chr11_-_31892531 | 0.07 |
ENSRNOT00000033745
|
Cryzl1
|
crystallin zeta like 1 |
| chr5_+_169244778 | 0.06 |
ENSRNOT00000064841
|
Plekhg5
|
pleckstrin homology and RhoGEF domain containing G5 |
| chr1_-_247476827 | 0.06 |
ENSRNOT00000021298
|
Insl6
|
insulin-like 6 |
| chr4_-_120414118 | 0.06 |
ENSRNOT00000072795
|
LOC100911337
|
40S ribosomal protein S25-like |
| chr3_+_104899682 | 0.06 |
ENSRNOT00000041910
|
Fmn1
|
formin 1 |
| chr9_-_9675110 | 0.06 |
ENSRNOT00000073294
|
Vav1
|
vav guanine nucleotide exchange factor 1 |
| chr1_-_64446818 | 0.06 |
ENSRNOT00000081980
|
Myadm
|
myeloid-associated differentiation marker |
| chr5_+_149047681 | 0.06 |
ENSRNOT00000015198
|
Laptm5
|
lysosomal protein transmembrane 5 |
| chr10_+_55924938 | 0.06 |
ENSRNOT00000087003
ENSRNOT00000057079 |
Trappc1
|
trafficking protein particle complex 1 |
| chr10_-_57436368 | 0.06 |
ENSRNOT00000056608
|
Scimp
|
SLP adaptor and CSK interacting membrane protein |
| chr2_+_114386019 | 0.06 |
ENSRNOT00000082148
|
AABR07009834.1
|
|
| chr6_-_25616995 | 0.06 |
ENSRNOT00000077894
|
Fosl2
|
FOS like 2, AP-1 transcription factor subunit |
| chr14_-_23604834 | 0.06 |
ENSRNOT00000002760
|
Stap1
|
signal transducing adaptor family member 1 |
| chr2_+_197715761 | 0.06 |
ENSRNOT00000083069
|
Golph3l
|
golgi phosphoprotein 3-like |
| chr1_-_53520788 | 0.06 |
ENSRNOT00000060121
|
Gpr31
|
G protein-coupled receptor 31 |
| chr13_-_73704678 | 0.06 |
ENSRNOT00000005280
|
Tor1aip1
|
torsin 1A interacting protein 1 |
| chr6_-_7058314 | 0.06 |
ENSRNOT00000045996
|
Haao
|
3-hydroxyanthranilate 3,4-dioxygenase |
| chr2_-_118882562 | 0.06 |
ENSRNOT00000058860
|
Kcnmb3
|
potassium calcium-activated channel subfamily M regulatory beta subunit 3 |
| chr20_-_4368693 | 0.05 |
ENSRNOT00000000501
|
Rnf5
|
ring finger protein 5 |
| chr3_-_130114770 | 0.05 |
ENSRNOT00000010638
|
Jag1
|
jagged 1 |
| chr13_-_89433815 | 0.05 |
ENSRNOT00000091541
|
Fcgr2b
|
Fc fragment of IgG receptor IIb |
| chr6_+_129609375 | 0.05 |
ENSRNOT00000083732
|
Papola
|
poly (A) polymerase alpha |
| chrX_-_77700269 | 0.05 |
ENSRNOT00000092418
|
Cysltr1
|
cysteinyl leukotriene receptor 1 |
| chrX_+_105239620 | 0.05 |
ENSRNOT00000085693
|
Drp2
|
dystrophin related protein 2 |
| chr8_-_39243705 | 0.05 |
ENSRNOT00000043518
|
Stt3a
|
STT3A, catalytic subunit of the oligosaccharyltransferase complex |
| chr5_+_142332607 | 0.05 |
ENSRNOT00000072841
|
LOC100909856
|
metal regulatory transcription factor 1-like |
| chr10_+_103874383 | 0.05 |
ENSRNOT00000038935
|
Otop2
|
otopetrin 2 |
| chr1_-_143169657 | 0.05 |
ENSRNOT00000025888
|
Rps17
|
ribosomal protein S17 |
| chr16_+_18975746 | 0.05 |
ENSRNOT00000066121
|
Smim7
|
small integral membrane protein 7 |
| chr6_+_137323713 | 0.05 |
ENSRNOT00000029017
|
Pld4
|
phospholipase D family, member 4 |
| chr7_+_27248115 | 0.05 |
ENSRNOT00000031946
ENSRNOT00000059545 |
LOC362863
|
first gene upstream of Nt5dc3 |
| chr4_-_157252104 | 0.05 |
ENSRNOT00000082739
|
Ptpn6
|
protein tyrosine phosphatase, non-receptor type 6 |
| chr5_+_142797366 | 0.05 |
ENSRNOT00000031928
|
Mtf1
|
metal-regulatory transcription factor 1 |
| chrX_+_113948654 | 0.05 |
ENSRNOT00000068431
|
Tmem164
|
transmembrane protein 164 |
| chr12_-_38116919 | 0.04 |
ENSRNOT00000001467
|
Denr
|
density regulated reinitiation and release factor |
| chr1_-_227506822 | 0.04 |
ENSRNOT00000091506
|
Ms4a7
|
membrane spanning 4-domains A7 |
| chr4_+_163112301 | 0.04 |
ENSRNOT00000087113
|
Clec12a
|
C-type lectin domain family 12, member A |
| chr3_+_28416954 | 0.04 |
ENSRNOT00000043533
|
Kynu
|
kynureninase |
| chr6_-_103313074 | 0.04 |
ENSRNOT00000083677
|
Zfp36l1
|
zinc finger protein 36, C3H type-like 1 |
| chr5_-_155252003 | 0.04 |
ENSRNOT00000017060
|
C1qb
|
complement C1q B chain |
| chr10_-_5260608 | 0.04 |
ENSRNOT00000003572
|
Ciita
|
class II, major histocompatibility complex, transactivator |
| chr13_-_67206688 | 0.04 |
ENSRNOT00000003630
ENSRNOT00000090693 |
Pla2g4a
|
phospholipase A2 group IVA |
| chr9_+_24066303 | 0.04 |
ENSRNOT00000018163
|
Crisp3
|
cysteine-rich secretory protein 3 |
| chr10_-_87437455 | 0.04 |
ENSRNOT00000051080
|
Krt39
|
keratin 39 |
| chr3_+_28627084 | 0.04 |
ENSRNOT00000049884
|
Arhgap15
|
Rho GTPase activating protein 15 |
| chr2_+_189454340 | 0.04 |
ENSRNOT00000087063
|
Nup210l
|
nucleoporin 210-like |
| chr13_-_91228901 | 0.04 |
ENSRNOT00000071728
ENSRNOT00000073643 ENSRNOT00000071897 |
LOC100911825
|
low affinity immunoglobulin gamma Fc region receptor III-like |
| chr1_-_260254600 | 0.04 |
ENSRNOT00000019014
|
Blnk
|
B-cell linker |
| chr13_+_89718066 | 0.04 |
ENSRNOT00000005147
|
Dedd
|
death effector domain-containing |
| chr15_-_52317219 | 0.04 |
ENSRNOT00000016555
|
Dmtn
|
dematin actin binding protein |
| chrX_+_78196300 | 0.04 |
ENSRNOT00000048695
|
P2ry10
|
purinergic receptor P2Y10 |
| chr16_+_40050734 | 0.04 |
ENSRNOT00000067375
|
Spcs3
|
signal peptidase complex subunit 3 |
| chr8_+_102304095 | 0.04 |
ENSRNOT00000011358
|
Slc9a9
|
solute carrier family 9 member A9 |
| chr1_-_227149748 | 0.04 |
ENSRNOT00000063879
|
Ms4a8
|
membrane spanning 4-domains A8 |
| chr10_-_34990943 | 0.04 |
ENSRNOT00000075555
|
Rmnd5b
|
required for meiotic nuclear division 5 homolog B |
| chr10_+_62981297 | 0.04 |
ENSRNOT00000031618
|
Efcab5
|
EF-hand calcium binding domain 5 |
| chr18_+_45023932 | 0.04 |
ENSRNOT00000039379
|
Fam170a
|
family with sequence similarity 170, member A |
| chr1_+_201337416 | 0.04 |
ENSRNOT00000067742
|
Btbd16
|
BTB domain containing 16 |
| chr12_-_2826378 | 0.04 |
ENSRNOT00000061749
|
Clec4m
|
C-type lectin domain family 4 member M |
| chr3_-_154042099 | 0.04 |
ENSRNOT00000033525
|
Blcap
|
bladder cancer associated protein |
| chr5_-_57896475 | 0.04 |
ENSRNOT00000017903
|
RGD1561916
|
similar to testes development-related NYD-SP22 isoform 1 |
| chr3_+_2512492 | 0.04 |
ENSRNOT00000074026
|
AABR07051241.1
|
|
| chr13_+_49250301 | 0.03 |
ENSRNOT00000036110
|
Rbbp5
|
RB binding protein 5, histone lysine methyltransferase complex subunit |
| chr5_+_157222636 | 0.03 |
ENSRNOT00000022579
|
Pla2g2d
|
phospholipase A2, group IID |
| chr17_-_76281660 | 0.03 |
ENSRNOT00000058070
|
Upf2
|
UPF2 regulator of nonsense transcripts homolog (yeast) |
| chr3_+_103753238 | 0.03 |
ENSRNOT00000007144
|
Slc12a6
|
solute carrier family 12, member 6 |
| chr5_-_136721379 | 0.03 |
ENSRNOT00000026704
|
Atp6v0b
|
ATPase H+ transporting V0 subunit B |
| chr1_-_198652674 | 0.03 |
ENSRNOT00000023706
|
Tbc1d10b
|
TBC1 domain family, member 10b |
| chr1_+_264756499 | 0.03 |
ENSRNOT00000031018
|
Peo1
|
progressive external ophthalmoplegia 1 |
| chr2_-_120316357 | 0.03 |
ENSRNOT00000065469
|
Ccdc39
|
coiled-coil domain containing 39 |
| chr2_-_34313094 | 0.03 |
ENSRNOT00000016863
|
Ppwd1
|
peptidylprolyl isomerase domain and WD repeat containing 1 |
| chr5_-_141430659 | 0.03 |
ENSRNOT00000034944
|
Akirin1
|
akirin 1 |
| chr6_+_94636222 | 0.03 |
ENSRNOT00000005846
|
Daam1
|
dishevelled associated activator of morphogenesis 1 |
| chr5_+_61425746 | 0.03 |
ENSRNOT00000064113
|
RGD1305807
|
hypothetical LOC298077 |
| chr2_-_189880743 | 0.03 |
ENSRNOT00000018830
|
Snapin
|
SNAP-associated protein |
| chr6_+_129609074 | 0.03 |
ENSRNOT00000064957
|
Papola
|
poly (A) polymerase alpha |
| chr5_-_160423811 | 0.03 |
ENSRNOT00000018864
|
Efhd2
|
EF-hand domain family, member D2 |
| chr13_-_90977734 | 0.03 |
ENSRNOT00000011869
|
Slamf8
|
SLAM family member 8 |
| chr3_+_79918969 | 0.03 |
ENSRNOT00000016306
|
Spi1
|
Spi-1 proto-oncogene |
| chr7_+_122818975 | 0.03 |
ENSRNOT00000000206
|
Ep300
|
E1A binding protein p300 |
| chr1_+_215610368 | 0.03 |
ENSRNOT00000078903
ENSRNOT00000087781 |
Tnni2
|
troponin I2, fast skeletal type |
| chr10_+_109630099 | 0.03 |
ENSRNOT00000072099
|
Ccdc137
|
coiled-coil domain containing 137 |
| chr13_-_69172643 | 0.03 |
ENSRNOT00000049703
|
AABR07021384.1
|
|
| chr1_+_60717386 | 0.03 |
ENSRNOT00000015019
|
Ppp2r1a
|
protein phosphatase 2 scaffold subunit A alpha |
| chr1_-_103128743 | 0.03 |
ENSRNOT00000075006
|
Spty2d1
|
SPT2 chromatin protein domain containing 1 |
| chr1_-_69963592 | 0.03 |
ENSRNOT00000021245
|
Aurkc
|
aurora kinase C |
| chr4_-_120041238 | 0.03 |
ENSRNOT00000073799
|
LOC100911337
|
40S ribosomal protein S25-like |
| chr3_+_80555196 | 0.03 |
ENSRNOT00000067318
|
Arhgap1
|
Rho GTPase activating protein 1 |
| chr13_+_48689962 | 0.03 |
ENSRNOT00000079707
|
Nucks1
|
nuclear casein kinase and cyclin-dependent kinase substrate 1 |
| chr6_+_48021771 | 0.03 |
ENSRNOT00000060185
|
Tssc1
|
tumor suppressing subtransferable candidate 1 |
| chrX_+_157095937 | 0.03 |
ENSRNOT00000091792
|
Bcap31
|
B-cell receptor-associated protein 31 |
| chr17_-_34905117 | 0.02 |
ENSRNOT00000088931
|
Irf4
|
interferon regulatory factor 4 |
| chr1_+_215609645 | 0.02 |
ENSRNOT00000076140
ENSRNOT00000027487 |
Tnni2
|
troponin I2, fast skeletal type |
| chr3_+_47439076 | 0.02 |
ENSRNOT00000011794
|
Tank
|
TRAF family member-associated NFKB activator |
| chr1_+_197999336 | 0.02 |
ENSRNOT00000023555
|
Apobr
|
apolipoprotein B receptor |
| chr10_+_46840113 | 0.02 |
ENSRNOT00000086083
ENSRNOT00000079133 |
Myo15a
|
myosin XVA |
| chr8_+_60760078 | 0.02 |
ENSRNOT00000063930
|
Pstpip1
|
proline-serine-threonine phosphatase-interacting protein 1 |
| chr2_-_189765415 | 0.02 |
ENSRNOT00000020815
|
Slc27a3
|
solute carrier family 27 member 3 |
| chr19_+_25815207 | 0.02 |
ENSRNOT00000003980
|
Lyl1
|
LYL1, basic helix-loop-helix family member |
| chr18_+_64114933 | 0.02 |
ENSRNOT00000022364
|
Mc5r
|
melanocortin 5 receptor |
| chr1_-_221420115 | 0.02 |
ENSRNOT00000028475
|
Mrpl49
|
mitochondrial ribosomal protein L49 |
| chrX_+_128493614 | 0.02 |
ENSRNOT00000044240
|
Stag2
|
stromal antigen 2 |
| chr20_-_5466265 | 0.02 |
ENSRNOT00000000554
|
Rgl2
|
ral guanine nucleotide dissociation stimulator-like 2 |
| chr14_+_85142279 | 0.02 |
ENSRNOT00000011281
|
Thoc5
|
THO complex 5 |
| chr10_+_47930633 | 0.02 |
ENSRNOT00000003515
|
Grap
|
GRB2-related adaptor protein |
| chr12_-_19582185 | 0.02 |
ENSRNOT00000060020
ENSRNOT00000085853 |
RGD1305455
|
similar to hypothetical protein FLJ10925 |
| chr3_-_59688692 | 0.02 |
ENSRNOT00000078752
|
Sp3
|
Sp3 transcription factor |
| chr8_+_63379087 | 0.02 |
ENSRNOT00000012091
ENSRNOT00000012295 |
Nptn
|
neuroplastin |
| chr6_-_98695988 | 0.02 |
ENSRNOT00000006913
|
Sgpp1
|
sphingosine-1-phosphate phosphatase 1 |
| chr14_-_82347679 | 0.02 |
ENSRNOT00000032972
|
Tacc3
|
transforming, acidic coiled-coil containing protein 3 |
| chr8_-_48634797 | 0.02 |
ENSRNOT00000012868
|
Hinfp
|
histone H4 transcription factor |
| chr5_+_159484370 | 0.02 |
ENSRNOT00000010593
|
Sdhb
|
succinate dehydrogenase complex iron sulfur subunit B |
| chr4_+_21862313 | 0.02 |
ENSRNOT00000007948
|
Dmtf1
|
cyclin D binding myb-like transcription factor 1 |
| chrX_-_1704033 | 0.02 |
ENSRNOT00000051956
|
Usp11
|
ubiquitin specific peptidase 11 |
| chr2_+_189106039 | 0.02 |
ENSRNOT00000028210
|
Ube2q1
|
ubiquitin conjugating enzyme E2 Q1 |
| chr11_-_33003021 | 0.02 |
ENSRNOT00000084134
|
Runx1
|
runt-related transcription factor 1 |
| chr4_+_95884743 | 0.02 |
ENSRNOT00000008585
|
Smarcad1
|
SWI/SNF-related, matrix-associated actin-dependent regulator of chromatin, subfamily a, containing DEAD/H box 1` |
| chr2_+_157854667 | 0.02 |
ENSRNOT00000039294
|
AC119603.1
|
|
| chrX_+_15155230 | 0.02 |
ENSRNOT00000073289
ENSRNOT00000051439 |
Was
|
Wiskott-Aldrich syndrome |
| chr3_+_172692452 | 0.02 |
ENSRNOT00000077193
|
Zfp831
|
zinc finger protein 831 |
| chr8_-_108261021 | 0.02 |
ENSRNOT00000040710
|
LOC100912210
|
40S ribosomal protein S25-like |
| chr2_-_120316600 | 0.02 |
ENSRNOT00000084521
|
Ccdc39
|
coiled-coil domain containing 39 |
| chr1_-_164441167 | 0.02 |
ENSRNOT00000023935
|
Rps3
|
ribosomal protein S3 |
| chr7_-_120026755 | 0.02 |
ENSRNOT00000077677
|
Card10
|
caspase recruitment domain family, member 10 |
| chr9_-_42805673 | 0.01 |
ENSRNOT00000020558
|
Uggt1
|
UDP-glucose glycoprotein glucosyltransferase 1 |
| chr3_-_79892429 | 0.01 |
ENSRNOT00000016191
|
Slc39a13
|
solute carrier family 39 member 13 |
| chr1_+_14797766 | 0.01 |
ENSRNOT00000016048
|
Olig3
|
oligodendrocyte transcription factor 3 |
| chr1_+_197999037 | 0.01 |
ENSRNOT00000091065
|
Apobr
|
apolipoprotein B receptor |
| chr1_-_250626844 | 0.01 |
ENSRNOT00000077135
|
Asah2
|
N-acylsphingosine amidohydrolase 2 |
| chr10_+_85608544 | 0.01 |
ENSRNOT00000092122
|
Mllt6
|
MLLT6, PHD finger domain containing |
| chr1_-_101883744 | 0.01 |
ENSRNOT00000028635
|
Syngr4
|
synaptogyrin 4 |
| chr5_-_171459488 | 0.01 |
ENSRNOT00000075423
ENSRNOT00000080686 |
Tprg1l
|
tumor protein p63 regulated 1-like |
| chr9_-_61528882 | 0.01 |
ENSRNOT00000015432
|
Ankrd44
|
ankyrin repeat domain 44 |
| chr4_-_57625147 | 0.01 |
ENSRNOT00000074649
ENSRNOT00000078961 |
Ube2h
|
ubiquitin-conjugating enzyme E2H |
| chr9_+_82718709 | 0.01 |
ENSRNOT00000027256
ENSRNOT00000080524 |
Stk11ip
|
serine/threonine kinase 11 interacting protein |
| chr2_-_184993341 | 0.01 |
ENSRNOT00000071580
|
Fam160a1
|
family with sequence similarity 160, member A1 |
| chr19_+_19672856 | 0.01 |
ENSRNOT00000064275
ENSRNOT00000086560 |
Brd7
|
bromodomain containing 7 |
| chr11_-_54545230 | 0.01 |
ENSRNOT00000002676
|
Retnla
|
resistin like alpha |
| chrX_+_9436707 | 0.01 |
ENSRNOT00000004187
|
Cask
|
calcium/calmodulin dependent serine protein kinase |
| chr1_-_102970950 | 0.01 |
ENSRNOT00000018194
|
Tsg101
|
tumor susceptibility 101 |
| chr11_-_84090259 | 0.01 |
ENSRNOT00000002321
|
Eif2b5
|
eukaryotic translation initiation factor 2B subunit 5 epsilon |
| chr5_-_155258392 | 0.01 |
ENSRNOT00000017065
|
C1qc
|
complement C1q C chain |
| chr4_-_153373649 | 0.01 |
ENSRNOT00000016495
|
Atp6v1e1
|
ATPase H+ transporting V1 subunit E1 |
| chr4_+_22898527 | 0.01 |
ENSRNOT00000072455
ENSRNOT00000076123 |
Dbf4
|
DBF4 zinc finger |
| chr7_-_120027026 | 0.01 |
ENSRNOT00000011215
|
Card10
|
caspase recruitment domain family, member 10 |
| chr3_-_162872831 | 0.01 |
ENSRNOT00000008478
|
Sulf2
|
sulfatase 2 |
| chrX_-_116792864 | 0.01 |
ENSRNOT00000090918
|
Amot
|
angiomotin |
| chr10_+_63098116 | 0.01 |
ENSRNOT00000030749
|
Nsrp1
|
nuclear speckle splicing regulatory protein 1 |
| chr7_-_75421874 | 0.01 |
ENSRNOT00000012775
|
Pabpc1
|
poly(A) binding protein, cytoplasmic 1 |
| chr12_+_1889331 | 0.01 |
ENSRNOT00000066281
|
Arhgef18
|
Rho/Rac guanine nucleotide exchange factor 18 |
| chr16_-_85306366 | 0.00 |
ENSRNOT00000089650
|
Tnfsf13b
|
tumor necrosis factor superfamily member 13b |
| chr3_+_118317761 | 0.00 |
ENSRNOT00000012700
|
Fgf7
|
fibroblast growth factor 7 |
| chr1_-_254671778 | 0.00 |
ENSRNOT00000025493
|
Htr7
|
5-hydroxytryptamine receptor 7 |
| chr10_+_75032365 | 0.00 |
ENSRNOT00000010448
|
Supt4h1
|
SPT4 homolog, DSIF elongation factor subunit |
| chr1_+_266358728 | 0.00 |
ENSRNOT00000027118
|
Wbp1l
|
WW domain binding protein 1-like |
| chr13_-_73704480 | 0.00 |
ENSRNOT00000005296
|
Tor1aip1
|
torsin 1A interacting protein 1 |
| chr13_+_90943255 | 0.00 |
ENSRNOT00000011539
|
Vsig8
|
V-set and immunoglobulin domain containing 8 |
| chr3_+_112228919 | 0.00 |
ENSRNOT00000011761
|
Capn3
|
calpain 3 |
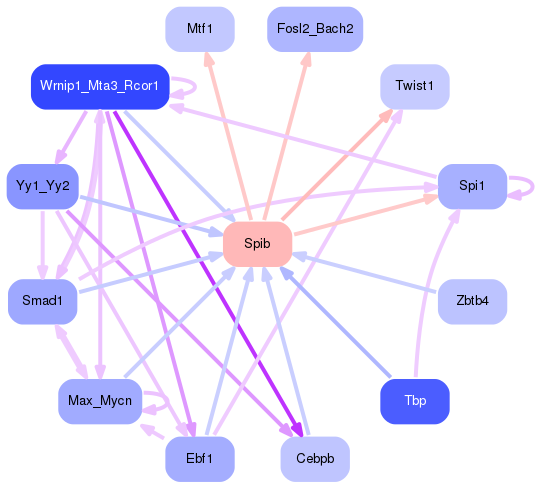
Network of associatons between targets according to the STRING database.

First level regulatory network of Spib
Gene Ontology Analysis
Gene overrepresentation in biological process category:
| Log-likelihood per target | Total log-likelihood | Term | Description |
|---|---|---|---|
| 0.1 | 0.2 | GO:0033128 | negative regulation of histone phosphorylation(GO:0033128) negative regulation of peroxisome proliferator activated receptor signaling pathway(GO:0035359) |
| 0.1 | 0.2 | GO:0030886 | negative regulation of myeloid dendritic cell activation(GO:0030886) |
| 0.1 | 0.2 | GO:1902214 | regulation of interleukin-4-mediated signaling pathway(GO:1902214) negative regulation of apoptotic cell clearance(GO:2000426) |
| 0.0 | 0.1 | GO:0014739 | positive regulation of muscle hyperplasia(GO:0014739) |
| 0.0 | 0.1 | GO:0001788 | antibody-dependent cellular cytotoxicity(GO:0001788) |
| 0.0 | 0.1 | GO:0070560 | protein secretion by platelet(GO:0070560) |
| 0.0 | 0.1 | GO:1903972 | regulation of macrophage colony-stimulating factor signaling pathway(GO:1902226) regulation of response to macrophage colony-stimulating factor(GO:1903969) regulation of cellular response to macrophage colony-stimulating factor stimulus(GO:1903972) |
| 0.0 | 0.1 | GO:0070946 | neutrophil mediated killing of gram-positive bacterium(GO:0070946) |
| 0.0 | 0.1 | GO:0070358 | actin polymerization-dependent cell motility(GO:0070358) |
| 0.0 | 0.1 | GO:2000041 | regulation of midbrain dopaminergic neuron differentiation(GO:1904956) regulation of planar cell polarity pathway involved in axis elongation(GO:2000040) negative regulation of planar cell polarity pathway involved in axis elongation(GO:2000041) |
| 0.0 | 0.1 | GO:0019805 | quinolinate biosynthetic process(GO:0019805) |
| 0.0 | 0.1 | GO:1902947 | regulation of tau-protein kinase activity(GO:1902947) |
| 0.0 | 0.1 | GO:0090038 | negative regulation of protein kinase C signaling(GO:0090038) |
| 0.0 | 0.0 | GO:1901837 | negative regulation of transcription of nuclear large rRNA transcript from RNA polymerase I promoter(GO:1901837) |
| 0.0 | 0.1 | GO:0060800 | regulation of cell differentiation involved in embryonic placenta development(GO:0060800) |
| 0.0 | 0.2 | GO:1902255 | positive regulation of intrinsic apoptotic signaling pathway by p53 class mediator(GO:1902255) |
| 0.0 | 0.1 | GO:0061443 | endocardial cushion cell differentiation(GO:0061443) |
| 0.0 | 0.1 | GO:0051902 | negative regulation of mitochondrial depolarization(GO:0051902) |
| 0.0 | 0.1 | GO:1902689 | negative regulation of fermentation(GO:1901003) negative regulation of NAD metabolic process(GO:1902689) negative regulation of glucose catabolic process to lactate via pyruvate(GO:1904024) |
| 0.0 | 0.1 | GO:0072092 | ureteric bud invasion(GO:0072092) |
| 0.0 | 0.0 | GO:0003342 | proepicardium development(GO:0003342) septum transversum development(GO:0003343) mesendoderm development(GO:0048382) regulation of intracellular mRNA localization(GO:1904580) |
| 0.0 | 0.0 | GO:0033277 | abortive mitotic cell cycle(GO:0033277) |
| 0.0 | 0.0 | GO:0002188 | translation reinitiation(GO:0002188) |
| 0.0 | 0.0 | GO:0046864 | isoprenoid transport(GO:0046864) terpenoid transport(GO:0046865) |
Gene overrepresentation in cellular component category:
| Log-likelihood per target | Total log-likelihood | Term | Description |
|---|---|---|---|
| 0.0 | 0.1 | GO:0043625 | delta DNA polymerase complex(GO:0043625) |
| 0.0 | 0.0 | GO:0031095 | platelet dense tubular network membrane(GO:0031095) |
Gene overrepresentation in molecular function category:
| Log-likelihood per target | Total log-likelihood | Term | Description |
|---|---|---|---|
| 0.0 | 0.4 | GO:0019864 | IgG binding(GO:0019864) |
| 0.0 | 0.2 | GO:0005136 | interleukin-4 receptor binding(GO:0005136) |
| 0.0 | 0.2 | GO:0055104 | ligase inhibitor activity(GO:0055104) ubiquitin ligase inhibitor activity(GO:1990948) |
| 0.0 | 0.1 | GO:0005157 | macrophage colony-stimulating factor receptor binding(GO:0005157) |
| 0.0 | 0.1 | GO:0015349 | thyroid hormone transmembrane transporter activity(GO:0015349) |
| 0.0 | 0.0 | GO:0016823 | hydrolase activity, acting on acid carbon-carbon bonds(GO:0016822) hydrolase activity, acting on acid carbon-carbon bonds, in ketonic substances(GO:0016823) |
| 0.0 | 0.1 | GO:0031386 | protein tag(GO:0031386) |
| 0.0 | 0.1 | GO:0004652 | polynucleotide adenylyltransferase activity(GO:0004652) |
| 0.0 | 0.1 | GO:0061133 | endopeptidase activator activity(GO:0061133) |
| 0.0 | 0.1 | GO:0004974 | leukotriene receptor activity(GO:0004974) |
Gene overrepresentation in curated gene sets: REACTOME pathways category:
| Log-likelihood per target | Total log-likelihood | Term | Description |
|---|---|---|---|
| 0.0 | 0.1 | REACTOME TRYPTOPHAN CATABOLISM | Genes involved in Tryptophan catabolism |