Project
GSE49485: Hypoxia transcriptome sequencing of rat brain.
Navigation
Downloads
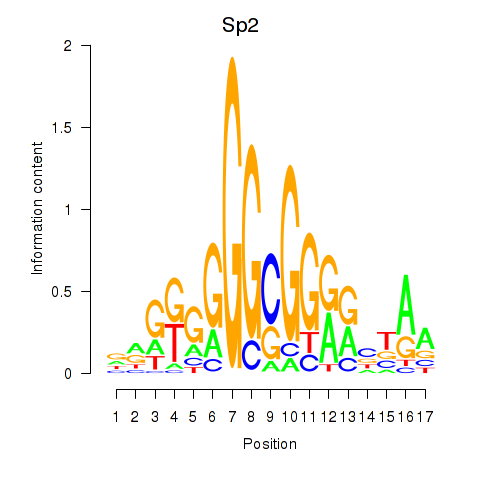
Results for Sp2
Z-value: 0.38
Motif logo
Transcription factors associated with Sp2
| Gene Symbol | Gene ID | Gene Info |
|---|---|---|
|
Sp2
|
ENSRNOG00000010492 | Sp2 transcription factor |
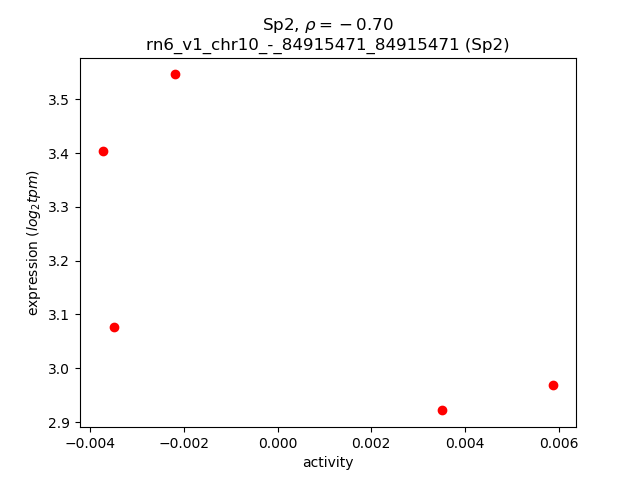
Activity-expression correlation:
| Gene | Promoter | Pearson corr. coef. | P-value | Plot |
|---|---|---|---|---|
| Sp2 | rn6_v1_chr10_-_84915471_84915471 | -0.70 | 1.9e-01 | Click! |
Activity profile of Sp2 motif
Sorted Z-values of Sp2 motif
| Promoter | Log-likelihood | Transcript | Gene | Gene Info |
|---|---|---|---|---|
| chr8_+_22937916 | 0.10 |
ENSRNOT00000088255
ENSRNOT00000049993 |
Ccdc159
|
coiled-coil domain containing 159 |
| chr17_-_67904674 | 0.10 |
ENSRNOT00000078532
|
Klf6
|
Kruppel-like factor 6 |
| chrX_-_134866210 | 0.08 |
ENSRNOT00000005331
|
Apln
|
apelin |
| chr1_-_226501920 | 0.08 |
ENSRNOT00000050716
|
Lrrc10b
|
leucine rich repeat containing 10B |
| chr1_-_222182721 | 0.08 |
ENSRNOT00000078008
|
Tex40
|
testis expressed 40 |
| chr6_-_55647665 | 0.07 |
ENSRNOT00000007414
|
Bzw2
|
basic leucine zipper and W2 domains 2 |
| chr10_+_109107389 | 0.07 |
ENSRNOT00000068437
ENSRNOT00000005687 |
Baiap2
|
BAI1-associated protein 2 |
| chr1_-_80073223 | 0.07 |
ENSRNOT00000021456
|
Gipr
|
gastric inhibitory polypeptide receptor |
| chr7_+_41114697 | 0.07 |
ENSRNOT00000041354
|
Atp2b1
|
ATPase plasma membrane Ca2+ transporting 1 |
| chr19_-_38321528 | 0.07 |
ENSRNOT00000031977
|
Smpd3
|
sphingomyelin phosphodiesterase 3 |
| chr7_+_53878610 | 0.06 |
ENSRNOT00000091910
|
Osbpl8
|
oxysterol binding protein-like 8 |
| chr1_-_198120061 | 0.06 |
ENSRNOT00000026231
|
Slx1b
|
SLX1 structure-specific endonuclease subunit homolog B (S. cerevisiae) |
| chr20_+_4967194 | 0.06 |
ENSRNOT00000070846
|
Lsm2
|
LSM2 homolog, U6 small nuclear RNA and mRNA degradation associated |
| chr6_-_1319541 | 0.06 |
ENSRNOT00000006527
|
Strn
|
striatin |
| chr10_+_56445647 | 0.05 |
ENSRNOT00000056870
|
Tmem256
|
transmembrane protein 256 |
| chr18_-_6587080 | 0.05 |
ENSRNOT00000040815
|
LOC103694404
|
60S ribosomal protein L39 |
| chr6_+_137184820 | 0.05 |
ENSRNOT00000073796
|
Adssl1
|
adenylosuccinate synthase like 1 |
| chr1_+_101405314 | 0.05 |
ENSRNOT00000028194
|
Ntf4
|
neurotrophin 4 |
| chr3_+_51883559 | 0.05 |
ENSRNOT00000007197
|
Csrnp3
|
cysteine and serine rich nuclear protein 3 |
| chr5_-_136112344 | 0.05 |
ENSRNOT00000050195
|
RGD1563714
|
RGD1563714 |
| chr3_+_134413170 | 0.05 |
ENSRNOT00000074338
|
AABR07054000.1
|
|
| chr17_+_6701315 | 0.05 |
ENSRNOT00000026054
ENSRNOT00000080683 |
Kif27
|
kinesin family member 27 |
| chr1_+_221710670 | 0.05 |
ENSRNOT00000064798
|
Map4k2
|
mitogen activated protein kinase kinase kinase kinase 2 |
| chr4_-_177331874 | 0.04 |
ENSRNOT00000065387
ENSRNOT00000091099 |
C2cd5
|
C2 calcium-dependent domain containing 5 |
| chrX_+_157150655 | 0.04 |
ENSRNOT00000090795
|
Pnck
|
pregnancy up-regulated nonubiquitous CaM kinase |
| chrX_-_78911601 | 0.04 |
ENSRNOT00000003188
|
RGD1566265
|
similar to RIKEN cDNA 2610002M06 |
| chrX_-_123254557 | 0.04 |
ENSRNOT00000039809
|
Akap17b
|
A kinase (PRKA) anchor protein 17B |
| chr12_+_22259713 | 0.04 |
ENSRNOT00000001913
|
Pop7
|
POP7 homolog, ribonuclease P/MRP subunit |
| chr1_-_199377035 | 0.04 |
ENSRNOT00000026572
|
Prss8
|
protease, serine, 8 |
| chr16_+_3051449 | 0.04 |
ENSRNOT00000074069
|
Fam208a
|
family with sequence similarity 208, member A |
| chr10_+_29289203 | 0.04 |
ENSRNOT00000067013
|
Pwwp2a
|
PWWP domain containing 2A |
| chr5_-_85123829 | 0.04 |
ENSRNOT00000007578
|
Brinp1
|
BMP/retinoic acid inducible neural specific 1 |
| chr3_-_110828879 | 0.04 |
ENSRNOT00000013963
|
Ccdc32
|
coiled-coil domain containing 32 |
| chr10_-_8498422 | 0.04 |
ENSRNOT00000082332
|
Rbfox1
|
RNA binding protein, fox-1 homolog 1 |
| chr4_-_180887050 | 0.04 |
ENSRNOT00000065730
|
Ints13
|
integrator complex subunit 13 |
| chr5_+_57947716 | 0.04 |
ENSRNOT00000067657
|
Dnai1
|
dynein, axonemal, intermediate chain 1 |
| chr5_+_106409456 | 0.04 |
ENSRNOT00000058387
|
Focad
|
focadhesin |
| chr13_+_52976507 | 0.04 |
ENSRNOT00000090599
ENSRNOT00000011324 |
Kif21b
|
kinesin family member 21B |
| chr8_-_22937909 | 0.03 |
ENSRNOT00000015684
|
Tmem205
|
transmembrane protein 205 |
| chr3_-_163935617 | 0.03 |
ENSRNOT00000074023
|
Kcnb1
|
potassium voltage-gated channel subfamily B member 1 |
| chrX_-_152641679 | 0.03 |
ENSRNOT00000080277
|
Gabra3
|
gamma-aminobutyric acid type A receptor alpha3 subunit |
| chr7_+_26375866 | 0.03 |
ENSRNOT00000059639
|
Aldh1l2
|
aldehyde dehydrogenase 1 family, member L2 |
| chrX_+_20484517 | 0.03 |
ENSRNOT00000093701
|
FAM120C
|
family with sequence similarity 120C |
| chr6_+_24064738 | 0.03 |
ENSRNOT00000035362
|
Ypel5
|
yippee-like 5 |
| chr11_-_83867203 | 0.03 |
ENSRNOT00000002394
|
Chrd
|
chordin |
| chr9_+_112293388 | 0.03 |
ENSRNOT00000020767
|
Man2a1
|
mannosidase, alpha, class 2A, member 1 |
| chr7_+_94130852 | 0.03 |
ENSRNOT00000011485
|
Mal2
|
mal, T-cell differentiation protein 2 |
| chr4_-_58195143 | 0.03 |
ENSRNOT00000033706
|
Copg2
|
coatomer protein complex, subunit gamma 2 |
| chr7_+_140315368 | 0.03 |
ENSRNOT00000081206
|
Cacnb3
|
calcium voltage-gated channel auxiliary subunit beta 3 |
| chr2_+_209097927 | 0.03 |
ENSRNOT00000023807
|
Dennd2d
|
DENN domain containing 2D |
| chr1_-_221420115 | 0.03 |
ENSRNOT00000028475
|
Mrpl49
|
mitochondrial ribosomal protein L49 |
| chr5_+_122647281 | 0.03 |
ENSRNOT00000066041
|
Mier1
|
mesoderm induction early response 1, transcriptional regulator |
| chr17_-_55709740 | 0.03 |
ENSRNOT00000033359
|
RGD1562037
|
similar to OTTHUMP00000046255 |
| chr10_+_56591292 | 0.03 |
ENSRNOT00000023379
|
Ctdnep1
|
CTD nuclear envelope phosphatase 1 |
| chr13_-_78608844 | 0.03 |
ENSRNOT00000003671
|
Rabgap1l
|
RAB GTPase activating protein 1-like |
| chrX_-_10630281 | 0.03 |
ENSRNOT00000080651
ENSRNOT00000048980 |
Usp9x
|
ubiquitin specific peptidase 9, X-linked |
| chr19_+_38846201 | 0.03 |
ENSRNOT00000030768
ENSRNOT00000063977 |
Tango6
|
transport and golgi organization 6 homolog |
| chr1_+_126523169 | 0.03 |
ENSRNOT00000051000
|
Tarsl2
|
threonyl-tRNA synthetase-like 2 |
| chr10_-_54467956 | 0.03 |
ENSRNOT00000065383
|
Usp43
|
ubiquitin specific peptidase 43 |
| chr1_-_198232344 | 0.03 |
ENSRNOT00000080988
|
Aldoa
|
aldolase, fructose-bisphosphate A |
| chr6_-_103470427 | 0.03 |
ENSRNOT00000091560
ENSRNOT00000088795 ENSRNOT00000079824 |
Actn1
|
actinin, alpha 1 |
| chr7_-_143863186 | 0.03 |
ENSRNOT00000017096
|
Rarg
|
retinoic acid receptor, gamma |
| chr5_+_173340060 | 0.03 |
ENSRNOT00000067841
|
Acap3
|
ArfGAP with coiled-coil, ankyrin repeat and PH domains 3 |
| chr6_-_55001464 | 0.03 |
ENSRNOT00000006618
|
Ahr
|
aryl hydrocarbon receptor |
| chrX_-_154722220 | 0.03 |
ENSRNOT00000089743
ENSRNOT00000087893 |
Fmr1
|
fragile X mental retardation 1 |
| chr10_+_28243 | 0.03 |
ENSRNOT00000003193
ENSRNOT00000087156 |
LOC103689943
|
meiosis arrest female protein 1-like |
| chr1_+_165625058 | 0.03 |
ENSRNOT00000025104
|
Rab6a
|
RAB6A, member RAS oncogene family |
| chr1_-_263718745 | 0.03 |
ENSRNOT00000074810
|
Dnmbp
|
dynamin binding protein |
| chr4_+_180887182 | 0.03 |
ENSRNOT00000042270
ENSRNOT00000002476 |
Fgfr1op2
|
FGFR1 oncogene partner 2 |
| chr4_+_60549197 | 0.03 |
ENSRNOT00000071249
ENSRNOT00000075621 |
Exoc4
|
exocyst complex component 4 |
| chr5_+_135574172 | 0.03 |
ENSRNOT00000023416
|
Tesk2
|
testis-specific kinase 2 |
| chr12_-_38274036 | 0.03 |
ENSRNOT00000063990
|
Kntc1
|
kinetochore associated 1 |
| chr3_-_3890758 | 0.03 |
ENSRNOT00000064083
|
Sec16a
|
SEC16 homolog A, endoplasmic reticulum export factor |
| chr15_-_43733182 | 0.03 |
ENSRNOT00000015318
|
Ppp2r2a
|
protein phosphatase 2, regulatory subunit B, alpha |
| chr9_+_81783349 | 0.03 |
ENSRNOT00000021548
|
Cnot9
|
CCR4-NOT transcription complex subunit 9 |
| chr5_-_150390099 | 0.02 |
ENSRNOT00000014479
|
Ythdf2
|
YTH N(6)-methyladenosine RNA binding protein 2 |
| chr5_+_172986291 | 0.02 |
ENSRNOT00000022900
|
Nadk
|
NAD kinase |
| chr2_+_211050360 | 0.02 |
ENSRNOT00000026928
|
Psma5
|
proteasome subunit alpha 5 |
| chr5_-_147375009 | 0.02 |
ENSRNOT00000009436
|
S100pbp
|
S100P binding protein |
| chr6_+_26686033 | 0.02 |
ENSRNOT00000081167
|
Slc5a6
|
solute carrier family 5 member 6 |
| chr3_+_33641616 | 0.02 |
ENSRNOT00000051953
|
Epc2
|
enhancer of polycomb homolog 2 |
| chr18_+_72550219 | 0.02 |
ENSRNOT00000046847
|
Smad2
|
SMAD family member 2 |
| chr13_-_35048444 | 0.02 |
ENSRNOT00000009963
|
Gli2
|
GLI family zinc finger 2 |
| chrX_-_22413714 | 0.02 |
ENSRNOT00000084129
ENSRNOT00000085905 |
Tspyl2
|
TSPY-like 2 |
| chr20_+_5535432 | 0.02 |
ENSRNOT00000040859
|
Syngap1
|
synaptic Ras GTPase activating protein 1 |
| chr5_+_9279970 | 0.02 |
ENSRNOT00000067977
|
Mybl1
|
myeloblastosis oncogene-like 1 |
| chr20_-_11528332 | 0.02 |
ENSRNOT00000038419
|
Tspear
|
thrombospondin-type laminin G domain and EAR repeats |
| chr20_-_29199224 | 0.02 |
ENSRNOT00000071477
|
Mcu
|
mitochondrial calcium uniporter |
| chr13_-_86671515 | 0.02 |
ENSRNOT00000082869
|
AABR07021704.1
|
|
| chr1_+_162549420 | 0.02 |
ENSRNOT00000037050
|
Rsf1
|
remodeling and spacing factor 1 |
| chr1_+_80195532 | 0.02 |
ENSRNOT00000022528
|
Rtn2
|
reticulon 2 |
| chr2_-_210991509 | 0.02 |
ENSRNOT00000087329
|
Cyb561d1
|
cytochrome b561 family, member D1 |
| chr1_+_238843338 | 0.02 |
ENSRNOT00000024583
|
Zfand5
|
zinc finger AN1-type containing 5 |
| chr6_-_26685235 | 0.02 |
ENSRNOT00000066743
|
Atraid
|
all-trans retinoic acid-induced differentiation factor |
| chr3_+_80362858 | 0.02 |
ENSRNOT00000021353
ENSRNOT00000086242 |
Lrp4
|
LDL receptor related protein 4 |
| chr3_-_168111920 | 0.02 |
ENSRNOT00000046011
|
Cyp24a1
|
cytochrome P450, family 24, subfamily a, polypeptide 1 |
| chr16_-_54137660 | 0.02 |
ENSRNOT00000085435
|
Pcm1
|
pericentriolar material 1 |
| chr1_+_192025357 | 0.02 |
ENSRNOT00000025072
|
Ubfd1
|
ubiquitin family domain containing 1 |
| chr2_-_218951030 | 0.02 |
ENSRNOT00000019172
|
Slc30a7
|
solute carrier family 30 member 7 |
| chr9_+_65478496 | 0.02 |
ENSRNOT00000016060
|
Ndufb3
|
NADH:ubiquinone oxidoreductase subunit B3 |
| chr12_+_45905371 | 0.02 |
ENSRNOT00000039275
|
Hspb8
|
heat shock protein family B (small) member 8 |
| chr16_-_7758189 | 0.02 |
ENSRNOT00000026588
|
Hacl1
|
2-hydroxyacyl-CoA lyase 1 |
| chr1_-_241460868 | 0.02 |
ENSRNOT00000054776
|
RGD1560242
|
similar to RIKEN cDNA 1700028P14 |
| chr2_+_22427474 | 0.02 |
ENSRNOT00000061761
|
Mtx3
|
metaxin 3 |
| chr15_-_43667029 | 0.02 |
ENSRNOT00000014798
|
Bnip3l
|
BCL2/adenovirus E1B interacting protein 3-like |
| chr17_-_78735324 | 0.02 |
ENSRNOT00000036299
|
Cdnf
|
cerebral dopamine neurotrophic factor |
| chr10_-_91807937 | 0.02 |
ENSRNOT00000005074
|
Wnt9b
|
wingless-type MMTV integration site family, member 9B |
| chr1_+_72380711 | 0.02 |
ENSRNOT00000022236
|
Fiz1
|
FLT3-interacting zinc finger 1 |
| chr1_+_264756499 | 0.02 |
ENSRNOT00000031018
|
Peo1
|
progressive external ophthalmoplegia 1 |
| chr2_+_188844073 | 0.02 |
ENSRNOT00000028117
|
Kcnn3
|
potassium calcium-activated channel subfamily N member 3 |
| chr13_+_100817359 | 0.02 |
ENSRNOT00000004330
|
Tp53bp2
|
tumor protein p53 binding protein, 2 |
| chr2_+_2456735 | 0.02 |
ENSRNOT00000032974
|
Ell2
|
elongation factor for RNA polymerase II 2 |
| chr12_+_37923528 | 0.02 |
ENSRNOT00000045223
|
Abcb9
|
ATP binding cassette subfamily B member 9 |
| chr16_+_20395845 | 0.02 |
ENSRNOT00000078108
|
Mast3
|
microtubule associated serine/threonine kinase 3 |
| chr1_-_78573374 | 0.02 |
ENSRNOT00000090519
|
Arhgap35
|
Rho GTPase activating protein 35 |
| chrX_-_142131545 | 0.02 |
ENSRNOT00000077402
|
Fgf13
|
fibroblast growth factor 13 |
| chrX_+_20316893 | 0.02 |
ENSRNOT00000082177
|
Wnk3
|
WNK lysine deficient protein kinase 3 |
| chr13_+_70174936 | 0.02 |
ENSRNOT00000064068
ENSRNOT00000079861 ENSRNOT00000092562 |
Arpc5
|
actin related protein 2/3 complex, subunit 5 |
| chr5_-_144479306 | 0.02 |
ENSRNOT00000087697
|
Ago1
|
argonaute 1, RISC catalytic component |
| chr4_-_62438958 | 0.02 |
ENSRNOT00000014010
|
Wdr91
|
WD repeat domain 91 |
| chr9_-_17114177 | 0.02 |
ENSRNOT00000061185
|
Lrrc73
|
leucine rich repeat containing 73 |
| chr3_-_81282157 | 0.02 |
ENSRNOT00000051258
|
Large2
|
LARGE xylosyl- and glucuronyltransferase 2 |
| chr8_-_1450138 | 0.02 |
ENSRNOT00000008062
|
Aasdhppt
|
aminoadipate-semialdehyde dehydrogenase-phosphopantetheinyl transferase |
| chr6_-_29483460 | 0.02 |
ENSRNOT00000007160
|
Klhl29
|
kelch-like family member 29 |
| chr10_+_13000090 | 0.02 |
ENSRNOT00000004845
|
Cldn6
|
claudin 6 |
| chr1_-_54748763 | 0.02 |
ENSRNOT00000074549
|
LOC100911027
|
protein MAL2-like |
| chr8_+_64364741 | 0.02 |
ENSRNOT00000082840
|
Celf6
|
CUGBP, Elav-like family member 6 |
| chr13_-_70174565 | 0.02 |
ENSRNOT00000067135
|
Rgl1
|
ral guanine nucleotide dissociation stimulator,-like 1 |
| chr19_-_10360310 | 0.02 |
ENSRNOT00000087100
|
Katnb1
|
katanin regulatory subunit B1 |
| chr7_-_75098331 | 0.02 |
ENSRNOT00000013344
|
Rnf19a
|
ring finger protein 19A, RBR E3 ubiquitin protein ligase |
| chr20_-_3397039 | 0.02 |
ENSRNOT00000001084
ENSRNOT00000085259 |
Ppp1r18
|
protein phosphatase 1, regulatory subunit 18 |
| chr11_-_53731779 | 0.01 |
ENSRNOT00000002684
|
Ift57
|
intraflagellar transport 57 |
| chr18_+_15298978 | 0.01 |
ENSRNOT00000021263
|
Trappc8
|
trafficking protein particle complex 8 |
| chr19_-_43714418 | 0.01 |
ENSRNOT00000047179
|
Wdr59
|
WD repeat domain 59 |
| chr1_+_86996093 | 0.01 |
ENSRNOT00000027425
ENSRNOT00000027494 |
Hnrnpl
|
heterogeneous nuclear ribonucleoprotein L |
| chr3_+_152552822 | 0.01 |
ENSRNOT00000089719
|
Epb41l1
|
erythrocyte membrane protein band 4.1-like 1 |
| chr10_-_97896525 | 0.01 |
ENSRNOT00000005172
|
Wipi1
|
WD repeat domain, phosphoinositide interacting 1 |
| chr3_-_157099306 | 0.01 |
ENSRNOT00000022861
|
Chd6
|
chromodomain helicase DNA binding protein 6 |
| chr13_+_48607308 | 0.01 |
ENSRNOT00000063882
|
Slc41a1
|
solute carrier family 41 member 1 |
| chr16_-_54137485 | 0.01 |
ENSRNOT00000014202
|
Pcm1
|
pericentriolar material 1 |
| chr15_+_106257650 | 0.01 |
ENSRNOT00000014859
ENSRNOT00000072538 |
Ipo5
|
importin 5 |
| chr8_-_25904564 | 0.01 |
ENSRNOT00000082744
ENSRNOT00000064783 |
Tbx20
|
T-box 20 |
| chr1_-_212568224 | 0.01 |
ENSRNOT00000024976
|
LOC100911225
|
fucose mutarotase-like |
| chr7_+_142239035 | 0.01 |
ENSRNOT00000006239
|
Dazap2
|
DAZ associated protein 2 |
| chr20_-_7397448 | 0.01 |
ENSRNOT00000059426
|
LOC294154
|
similar to chromosome 6 open reading frame 106 isoform a |
| chr1_+_221420271 | 0.01 |
ENSRNOT00000028481
|
LOC687780
|
similar to Finkel-Biskis-Reilly murine sarcoma virusubiquitously expressed |
| chr12_-_24724997 | 0.01 |
ENSRNOT00000025560
|
Abhd11
|
abhydrolase domain containing 11 |
| chr8_-_12993651 | 0.01 |
ENSRNOT00000033932
|
Kdm4d
|
lysine demethylase 4D |
| chr6_+_55648021 | 0.01 |
ENSRNOT00000064822
ENSRNOT00000091488 |
Ankmy2
|
ankyrin repeat and MYND domain containing 2 |
| chr6_-_51257625 | 0.01 |
ENSRNOT00000012004
|
Hbp1
|
HMG-box transcription factor 1 |
| chr16_-_14210449 | 0.01 |
ENSRNOT00000016494
|
Ccser2
|
coiled-coil serine-rich protein 2 |
| chr3_-_121822436 | 0.01 |
ENSRNOT00000039794
|
Ckap2l
|
cytoskeleton associated protein 2-like |
| chr1_+_192025710 | 0.01 |
ENSRNOT00000077457
|
Ubfd1
|
ubiquitin family domain containing 1 |
| chr17_+_86408151 | 0.01 |
ENSRNOT00000022734
|
Otud1
|
OTU deubiquitinase 1 |
| chr9_-_82514399 | 0.01 |
ENSRNOT00000026799
|
Dnpep
|
aspartyl aminopeptidase |
| chr3_+_2462466 | 0.01 |
ENSRNOT00000014087
|
Rnf208
|
ring finger protein 208 |
| chr3_+_160391106 | 0.01 |
ENSRNOT00000016981
|
Ywhab
|
tyrosine 3-monooxygenase/tryptophan 5-monooxygenase activation protein, beta |
| chr5_+_136406308 | 0.01 |
ENSRNOT00000072492
|
Eri3
|
ERI1 exoribonuclease family member 3 |
| chr3_+_103866144 | 0.01 |
ENSRNOT00000007688
|
NEWGENE_1582771
|
katanin regulatory subunit B1 like 1 |
| chr13_-_83504494 | 0.01 |
ENSRNOT00000004083
|
Tiprl
|
TOR signaling pathway regulator |
| chr1_+_198120099 | 0.01 |
ENSRNOT00000073652
|
Bola2
|
bolA family member 2 |
| chr10_-_94384339 | 0.01 |
ENSRNOT00000055125
|
Strada
|
STE20-related kinase adaptor alpha |
| chr9_-_100624638 | 0.01 |
ENSRNOT00000051155
|
Hdlbp
|
high density lipoprotein binding protein |
| chr16_-_71809925 | 0.01 |
ENSRNOT00000022425
|
Tm2d2
|
TM2 domain containing 2 |
| chr1_-_229639187 | 0.01 |
ENSRNOT00000016804
|
Zfp91
|
zinc finger protein 91 |
| chr14_+_44479614 | 0.01 |
ENSRNOT00000003691
|
Ugdh
|
UDP-glucose 6-dehydrogenase |
| chr9_-_17698569 | 0.01 |
ENSRNOT00000087528
|
Mrpl14
|
mitochondrial ribosomal protein L14 |
| chr4_+_118207862 | 0.01 |
ENSRNOT00000085787
ENSRNOT00000023103 |
Tia1
|
TIA1 cytotoxic granule-associated RNA binding protein |
| chr13_+_103300932 | 0.01 |
ENSRNOT00000085214
ENSRNOT00000038264 |
Eprs
|
glutamyl-prolyl-tRNA synthetase |
| chr3_+_118144596 | 0.01 |
ENSRNOT00000012447
ENSRNOT00000079023 |
Galk2
|
galactokinase 2 |
| chr3_-_60795951 | 0.01 |
ENSRNOT00000002174
|
Atf2
|
activating transcription factor 2 |
| chrX_+_156463953 | 0.01 |
ENSRNOT00000079889
|
Flna
|
filamin A |
| chr1_-_192025350 | 0.01 |
ENSRNOT00000071946
|
Ears2
|
glutamyl-tRNA synthetase 2, mitochondrial |
| chr1_-_214074663 | 0.01 |
ENSRNOT00000026215
|
LOC100911881
|
chitinase domain-containing protein 1-like |
| chr7_+_74047814 | 0.01 |
ENSRNOT00000014879
|
Osr2
|
odd-skipped related transciption factor 2 |
| chr1_-_221041401 | 0.01 |
ENSRNOT00000064136
|
Pcnx3
|
pecanex homolog 3 (Drosophila) |
| chr8_+_70994563 | 0.01 |
ENSRNOT00000051504
ENSRNOT00000077163 |
Spg21
|
spastic paraplegia 21 homolog (human) |
| chr8_+_91464229 | 0.01 |
ENSRNOT00000013249
|
Bckdhb
|
branched chain keto acid dehydrogenase E1 subunit beta |
| chr6_-_92760018 | 0.01 |
ENSRNOT00000009560
|
Trim9
|
tripartite motif-containing 9 |
| chr4_+_157563990 | 0.01 |
ENSRNOT00000024618
|
Acrbp
|
acrosin binding protein |
| chr10_-_16689321 | 0.01 |
ENSRNOT00000028173
|
Bnip1
|
BCL2/adenovirus E1B interacting protein 1 |
| chr16_+_71810377 | 0.01 |
ENSRNOT00000041330
|
Adam9
|
ADAM metallopeptidase domain 9 |
| chr6_-_72462657 | 0.01 |
ENSRNOT00000088720
ENSRNOT00000077578 |
Strn3
|
striatin 3 |
| chrX_-_157139291 | 0.01 |
ENSRNOT00000092123
|
Slc6a8
|
solute carrier family 6 member 8 |
| chr5_-_144996431 | 0.01 |
ENSRNOT00000016992
|
Zmym4
|
zinc finger MYM-type containing 4 |
| chr17_+_82065937 | 0.01 |
ENSRNOT00000051349
|
Arl5b
|
ADP-ribosylation factor like GTPase 5B |
| chr3_+_111478382 | 0.01 |
ENSRNOT00000056392
|
Rtf1
|
Rtf1, Paf1/RNA polymerase II complex component, homolog (S. cerevisiae) |
| chr10_-_10550138 | 0.01 |
ENSRNOT00000067932
|
Alg1
|
ALG1, chitobiosyldiphosphodolichol beta-mannosyltransferase |
| chr18_+_65155685 | 0.01 |
ENSRNOT00000081797
|
Tcf4
|
transcription factor 4 |
| chr1_+_219759183 | 0.01 |
ENSRNOT00000026316
|
Pc
|
pyruvate carboxylase |
| chr15_+_344685 | 0.01 |
ENSRNOT00000065542
ENSRNOT00000066928 |
Kcnma1
|
potassium calcium-activated channel subfamily M alpha 1 |
| chr4_+_57050214 | 0.01 |
ENSRNOT00000025165
|
Ahcyl2
|
adenosylhomocysteinase-like 2 |
| chr6_+_92568975 | 0.01 |
ENSRNOT00000036933
|
Abhd12b
|
abhydrolase domain containing 12B |
| chr10_+_89376530 | 0.01 |
ENSRNOT00000028089
|
Rnd2
|
Rho family GTPase 2 |
| chr9_-_99651813 | 0.01 |
ENSRNOT00000022089
|
Ndufa10
|
NADH:ubiquinone oxidoreductase subunit A10 |
| chr13_+_25966428 | 0.01 |
ENSRNOT00000061814
ENSRNOT00000003870 |
Zcchc2
|
zinc finger CCHC-type containing 2 |
| chr5_+_47853818 | 0.01 |
ENSRNOT00000009228
ENSRNOT00000079656 |
Casp8ap2
|
caspase 8 associated protein 2 |
| chrX_+_17540458 | 0.01 |
ENSRNOT00000045710
|
Nudt11
|
nudix hydrolase 11 |
| chr7_-_2986935 | 0.01 |
ENSRNOT00000081125
ENSRNOT00000006578 |
Pa2g4
|
proliferation-associated 2G4 |
| chr3_+_2625015 | 0.01 |
ENSRNOT00000018927
|
Npdc1
|
neural proliferation, differentiation and control, 1 |
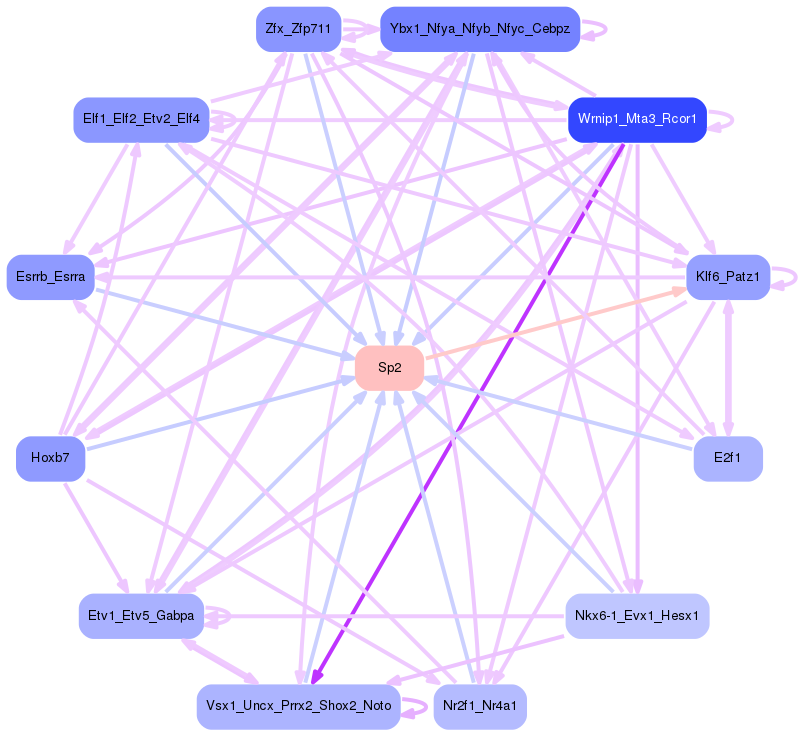
Network of associatons between targets according to the STRING database.

First level regulatory network of Sp2
Gene Ontology Analysis
Gene overrepresentation in biological process category:
| Log-likelihood per target | Total log-likelihood | Term | Description |
|---|---|---|---|
| 0.0 | 0.1 | GO:0043396 | corticotropin-releasing hormone secretion(GO:0043396) regulation of corticotropin-releasing hormone secretion(GO:0043397) |
| 0.0 | 0.1 | GO:0044208 | 'de novo' AMP biosynthetic process(GO:0044208) |
| 0.0 | 0.1 | GO:0090204 | protein localization to nuclear pore(GO:0090204) |
| 0.0 | 0.1 | GO:1904431 | positive regulation of t-circle formation(GO:1904431) |
| 0.0 | 0.0 | GO:0006433 | prolyl-tRNA aminoacylation(GO:0006433) |
| 0.0 | 0.1 | GO:0048865 | stem cell fate commitment(GO:0048865) |
| 0.0 | 0.1 | GO:0071409 | cellular response to cycloheximide(GO:0071409) |
| 0.0 | 0.1 | GO:1905232 | cellular response to L-glutamate(GO:1905232) |
| 0.0 | 0.1 | GO:0071386 | cellular response to corticosterone stimulus(GO:0071386) |
| 0.0 | 0.0 | GO:0009397 | folic acid-containing compound catabolic process(GO:0009397) pteridine-containing compound catabolic process(GO:0042560) |
| 0.0 | 0.1 | GO:0090154 | positive regulation of sphingolipid biosynthetic process(GO:0090154) positive regulation of ceramide biosynthetic process(GO:2000304) |
Gene overrepresentation in cellular component category:
| Log-likelihood per target | Total log-likelihood | Term | Description |
|---|---|---|---|
| 0.0 | 0.1 | GO:0033557 | Slx1-Slx4 complex(GO:0033557) |
Gene overrepresentation in molecular function category:
| Log-likelihood per target | Total log-likelihood | Term | Description |
|---|---|---|---|
| 0.0 | 0.0 | GO:0004827 | proline-tRNA ligase activity(GO:0004827) |
| 0.0 | 0.1 | GO:0008093 | cytoskeletal adaptor activity(GO:0008093) |