Project
GSE49485: Hypoxia transcriptome sequencing of rat brain.
Navigation
Downloads
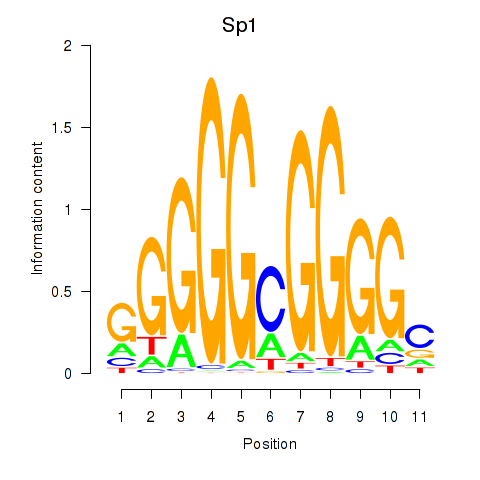
Results for Sp1
Z-value: 0.82
Motif logo
Transcription factors associated with Sp1
| Gene Symbol | Gene ID | Gene Info |
|---|---|---|
|
Sp1
|
ENSRNOG00000014084 | Sp1 transcription factor |
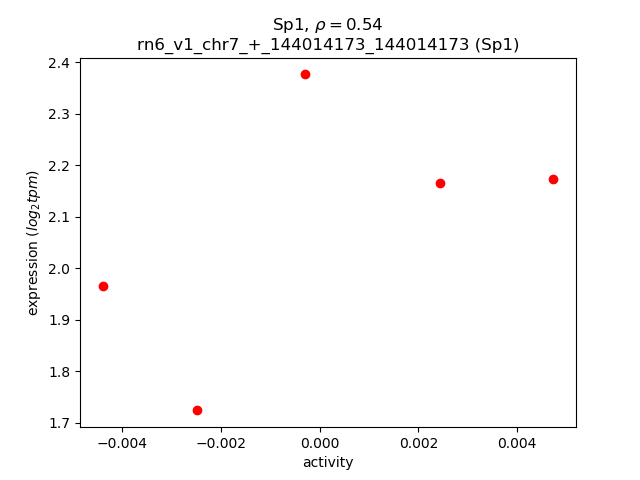
Activity-expression correlation:
| Gene | Promoter | Pearson corr. coef. | P-value | Plot |
|---|---|---|---|---|
| Sp1 | rn6_v1_chr7_+_144014173_144014173 | 0.54 | 3.5e-01 | Click! |
Activity profile of Sp1 motif
Sorted Z-values of Sp1 motif
| Promoter | Log-likelihood | Transcript | Gene | Gene Info |
|---|---|---|---|---|
| chr20_+_5535432 | 0.89 |
ENSRNOT00000040859
|
Syngap1
|
synaptic Ras GTPase activating protein 1 |
| chr1_+_199196059 | 0.70 |
ENSRNOT00000090428
|
Fbxl19
|
F-box and leucine-rich repeat protein 19 |
| chr13_+_52976507 | 0.70 |
ENSRNOT00000090599
ENSRNOT00000011324 |
Kif21b
|
kinesin family member 21B |
| chr7_+_70364813 | 0.65 |
ENSRNOT00000084012
ENSRNOT00000031230 |
Agap2
|
ArfGAP with GTPase domain, ankyrin repeat and PH domain 2 |
| chr10_+_56546710 | 0.64 |
ENSRNOT00000023003
|
Ybx2
|
Y box binding protein 2 |
| chr2_+_34186091 | 0.61 |
ENSRNOT00000016129
|
Sgtb
|
small glutamine rich tetratricopeptide repeat containing beta |
| chr5_-_147375009 | 0.54 |
ENSRNOT00000009436
|
S100pbp
|
S100P binding protein |
| chr16_-_9709347 | 0.54 |
ENSRNOT00000083933
|
Mapk8
|
mitogen-activated protein kinase 8 |
| chr10_-_85684138 | 0.53 |
ENSRNOT00000017989
|
Pip4k2b
|
phosphatidylinositol-5-phosphate 4-kinase type 2 beta |
| chr3_-_164095878 | 0.52 |
ENSRNOT00000079414
|
B4galt5
|
beta-1,4-galactosyltransferase 5 |
| chr8_-_71118927 | 0.51 |
ENSRNOT00000042633
|
Plekho2
|
pleckstrin homology domain containing O2 |
| chr10_-_37645802 | 0.50 |
ENSRNOT00000008022
|
Tcf7
|
transcription factor 7 (T-cell specific, HMG-box) |
| chrX_-_157095274 | 0.48 |
ENSRNOT00000084088
|
Abcd1
|
ATP binding cassette subfamily D member 1 |
| chr1_-_88112683 | 0.48 |
ENSRNOT00000090615
|
Spred3
|
sprouty-related, EVH1 domain containing 3 |
| chr8_-_64572850 | 0.46 |
ENSRNOT00000015415
|
Senp8
|
SUMO/sentrin peptidase family member, NEDD8 specific |
| chr13_-_86671515 | 0.45 |
ENSRNOT00000082869
|
AABR07021704.1
|
|
| chr12_-_19599374 | 0.45 |
ENSRNOT00000001849
|
Gpc2
|
glypican 2 |
| chr12_+_14092541 | 0.45 |
ENSRNOT00000033998
|
Radil
|
Rap associating with DIL domain |
| chr1_+_91857057 | 0.44 |
ENSRNOT00000077993
ENSRNOT00000081465 |
Ankrd27
|
ankyrin repeat domain 27 |
| chr3_-_60795951 | 0.42 |
ENSRNOT00000002174
|
Atf2
|
activating transcription factor 2 |
| chr2_+_22909569 | 0.42 |
ENSRNOT00000073871
|
Homer1
|
homer scaffolding protein 1 |
| chr7_-_143852119 | 0.42 |
ENSRNOT00000016801
|
Rarg
|
retinoic acid receptor, gamma |
| chr7_+_130474279 | 0.41 |
ENSRNOT00000092388
|
Shank3
|
SH3 and multiple ankyrin repeat domains 3 |
| chr1_+_144831523 | 0.39 |
ENSRNOT00000039748
|
Mex3b
|
mex-3 RNA binding family member B |
| chr7_-_118396728 | 0.39 |
ENSRNOT00000066431
|
Rbfox2
|
RNA binding protein, fox-1 homolog 2 |
| chr1_-_87155118 | 0.39 |
ENSRNOT00000072441
|
AABR07002854.1
|
|
| chrX_+_13117239 | 0.39 |
ENSRNOT00000088998
|
AABR07037112.1
|
|
| chr18_+_27657628 | 0.38 |
ENSRNOT00000026303
|
Egr1
|
early growth response 1 |
| chr2_+_77868412 | 0.37 |
ENSRNOT00000065897
ENSRNOT00000014022 |
Myo10
|
myosin X |
| chr13_+_44812567 | 0.37 |
ENSRNOT00000005372
|
R3hdm1
|
R3H domain containing 1 |
| chr3_+_124896618 | 0.37 |
ENSRNOT00000028888
|
Cds2
|
CDP-diacylglycerol synthase 2 |
| chr1_+_100297152 | 0.36 |
ENSRNOT00000026100
|
Shank1
|
SH3 and multiple ankyrin repeat domains 1 |
| chr1_-_267245636 | 0.36 |
ENSRNOT00000082799
|
Sh3pxd2a
|
SH3 and PX domains 2A |
| chr10_-_85517683 | 0.36 |
ENSRNOT00000016070
|
Srcin1
|
SRC kinase signaling inhibitor 1 |
| chr4_-_169999873 | 0.35 |
ENSRNOT00000011697
|
Grin2b
|
glutamate ionotropic receptor NMDA type subunit 2B |
| chr1_-_42486035 | 0.35 |
ENSRNOT00000025398
|
Mtrf1l
|
mitochondrial translational release factor 1-like |
| chr7_+_130474508 | 0.35 |
ENSRNOT00000085191
|
Shank3
|
SH3 and multiple ankyrin repeat domains 3 |
| chr1_-_220265772 | 0.35 |
ENSRNOT00000027119
|
Npas4
|
neuronal PAS domain protein 4 |
| chr1_-_126227469 | 0.35 |
ENSRNOT00000087332
|
Tjp1
|
tight junction protein 1 |
| chrX_+_156873849 | 0.35 |
ENSRNOT00000085410
|
Arhgap4
|
Rho GTPase activating protein 4 |
| chr15_-_45927804 | 0.34 |
ENSRNOT00000086271
|
Ints6
|
integrator complex subunit 6 |
| chr12_-_2555164 | 0.34 |
ENSRNOT00000084460
ENSRNOT00000061821 |
Map2k7
|
mitogen activated protein kinase kinase 7 |
| chr6_-_28464118 | 0.34 |
ENSRNOT00000068214
|
Efr3b
|
EFR3 homolog B |
| chr6_-_38228379 | 0.34 |
ENSRNOT00000084924
|
Mycn
|
v-myc avian myelocytomatosis viral oncogene neuroblastoma derived homolog |
| chr7_+_142912316 | 0.34 |
ENSRNOT00000010171
|
Nr4a1
|
nuclear receptor subfamily 4, group A, member 1 |
| chr5_+_59348639 | 0.34 |
ENSRNOT00000084031
ENSRNOT00000060264 |
Reck
|
reversion-inducing-cysteine-rich protein with kazal motifs |
| chr1_+_91596397 | 0.34 |
ENSRNOT00000016148
|
Rhpn2
|
rhophilin, Rho GTPase binding protein 2 |
| chr20_+_4572100 | 0.33 |
ENSRNOT00000000476
|
Zbtb12
|
zinc finger and BTB domain containing 12 |
| chr6_-_55001464 | 0.33 |
ENSRNOT00000006618
|
Ahr
|
aryl hydrocarbon receptor |
| chr19_+_10119253 | 0.33 |
ENSRNOT00000017971
|
Zfp319
|
zinc finger protein 319 |
| chr2_-_21931720 | 0.33 |
ENSRNOT00000018449
|
Msh3
|
mutS homolog 3 |
| chr17_+_86408151 | 0.32 |
ENSRNOT00000022734
|
Otud1
|
OTU deubiquitinase 1 |
| chr8_+_53295222 | 0.32 |
ENSRNOT00000009724
ENSRNOT00000067420 |
Usp28
|
ubiquitin specific peptidase 28 |
| chr15_-_33725188 | 0.32 |
ENSRNOT00000083941
|
Zfhx2
|
zinc finger homeobox 2 |
| chr2_+_179952227 | 0.32 |
ENSRNOT00000015081
|
Pdgfc
|
platelet derived growth factor C |
| chr8_-_6203515 | 0.32 |
ENSRNOT00000087278
ENSRNOT00000031189 ENSRNOT00000008074 ENSRNOT00000085285 ENSRNOT00000007866 |
Yap1
|
yes-associated protein 1 |
| chr18_-_399242 | 0.31 |
ENSRNOT00000045926
|
F8
|
coagulation factor VIII |
| chr14_+_44479614 | 0.31 |
ENSRNOT00000003691
|
Ugdh
|
UDP-glucose 6-dehydrogenase |
| chr7_-_70552897 | 0.31 |
ENSRNOT00000080594
|
Kif5a
|
kinesin family member 5A |
| chr19_-_55490426 | 0.31 |
ENSRNOT00000081800
|
Cbfa2t3
|
CBFA2/RUNX1 translocation partner 3 |
| chr9_-_63637677 | 0.31 |
ENSRNOT00000049259
|
Satb2
|
SATB homeobox 2 |
| chr10_-_46720907 | 0.31 |
ENSRNOT00000083093
ENSRNOT00000067866 |
Tom1l2
|
target of myb1 like 2 membrane trafficking protein |
| chr3_+_11811962 | 0.31 |
ENSRNOT00000060258
ENSRNOT00000039151 |
Ptrh1
|
peptidyl-tRNA hydrolase 1 homolog |
| chr20_-_29199224 | 0.30 |
ENSRNOT00000071477
|
Mcu
|
mitochondrial calcium uniporter |
| chr1_-_80544825 | 0.30 |
ENSRNOT00000057802
ENSRNOT00000040060 ENSRNOT00000067049 ENSRNOT00000052387 ENSRNOT00000073352 |
Relb
|
RELB proto-oncogene, NF-kB subunit |
| chr1_-_220644636 | 0.30 |
ENSRNOT00000027632
|
Pacs1
|
phosphofurin acidic cluster sorting protein 1 |
| chr7_-_63578490 | 0.30 |
ENSRNOT00000007295
|
Rassf3
|
Ras association domain family member 3 |
| chr4_-_115157263 | 0.30 |
ENSRNOT00000015296
|
Tet3
|
tet methylcytosine dioxygenase 3 |
| chr17_-_10208360 | 0.30 |
ENSRNOT00000087397
|
Unc5a
|
unc-5 netrin receptor A |
| chr5_-_169167831 | 0.30 |
ENSRNOT00000012407
|
Phf13
|
PHD finger protein 13 |
| chr20_+_4357733 | 0.30 |
ENSRNOT00000000509
|
Pbx2
|
PBX homeobox 2 |
| chr5_-_57881944 | 0.30 |
ENSRNOT00000033235
|
RGD1309821
|
similar to KIAA1161 protein |
| chr4_+_133286114 | 0.29 |
ENSRNOT00000084158
|
Ppp4r2
|
protein phosphatase 4, regulatory subunit 2 |
| chr9_+_100932932 | 0.29 |
ENSRNOT00000065058
|
Ing5
|
inhibitor of growth family, member 5 |
| chr1_+_266953139 | 0.29 |
ENSRNOT00000054696
|
Neurl1
|
neuralized E3 ubiquitin protein ligase 1 |
| chr7_-_130128589 | 0.29 |
ENSRNOT00000079777
ENSRNOT00000009325 |
Mapk11
|
mitogen-activated protein kinase 11 |
| chr5_-_109621170 | 0.29 |
ENSRNOT00000093007
|
Elavl2
|
ELAV like RNA binding protein 2 |
| chr1_-_82004538 | 0.29 |
ENSRNOT00000087572
|
Pou2f2
|
POU class 2 homeobox 2 |
| chr3_-_176144531 | 0.29 |
ENSRNOT00000082266
|
Tcfl5
|
transcription factor like 5 |
| chr9_+_53906073 | 0.28 |
ENSRNOT00000017813
|
Nab1
|
Ngfi-A binding protein 1 |
| chr8_+_130283542 | 0.28 |
ENSRNOT00000071573
|
Vipr1
|
vasoactive intestinal peptide receptor 1 |
| chr3_+_80833272 | 0.28 |
ENSRNOT00000023583
|
Chrm4
|
cholinergic receptor, muscarinic 4 |
| chr3_-_3890758 | 0.28 |
ENSRNOT00000064083
|
Sec16a
|
SEC16 homolog A, endoplasmic reticulum export factor |
| chr7_-_77162148 | 0.28 |
ENSRNOT00000008350
|
Klf10
|
Kruppel-like factor 10 |
| chr2_+_198823366 | 0.28 |
ENSRNOT00000083769
ENSRNOT00000028814 |
Pias3
|
protein inhibitor of activated STAT, 3 |
| chr2_-_34185682 | 0.28 |
ENSRNOT00000066925
ENSRNOT00000082755 |
Nln
|
neurolysin |
| chr7_-_143863186 | 0.27 |
ENSRNOT00000017096
|
Rarg
|
retinoic acid receptor, gamma |
| chr3_+_58443101 | 0.27 |
ENSRNOT00000002075
|
Itga6
|
integrin subunit alpha 6 |
| chr17_-_55709740 | 0.27 |
ENSRNOT00000033359
|
RGD1562037
|
similar to OTTHUMP00000046255 |
| chr2_-_247988462 | 0.27 |
ENSRNOT00000022387
|
Pdlim5
|
PDZ and LIM domain 5 |
| chr3_+_110442637 | 0.27 |
ENSRNOT00000010471
|
Pak6
|
p21 (RAC1) activated kinase 6 |
| chr3_+_175408629 | 0.27 |
ENSRNOT00000081344
|
Lsm14b
|
LSM family member 14B |
| chr4_-_180887050 | 0.27 |
ENSRNOT00000065730
|
Ints13
|
integrator complex subunit 13 |
| chr7_-_115910522 | 0.27 |
ENSRNOT00000076998
ENSRNOT00000067442 |
Arc
|
activity-regulated cytoskeleton-associated protein |
| chr14_-_108658371 | 0.27 |
ENSRNOT00000008919
|
Papolg
|
poly(A) polymerase gamma |
| chr15_+_43582020 | 0.27 |
ENSRNOT00000013001
|
Pnma2
|
paraneoplastic Ma antigen 2 |
| chr1_+_166564664 | 0.27 |
ENSRNOT00000090959
|
Pde2a
|
phosphodiesterase 2A |
| chr3_+_161425988 | 0.27 |
ENSRNOT00000065184
|
Slc12a5
|
solute carrier family 12 member 5 |
| chr9_-_104350308 | 0.27 |
ENSRNOT00000033958
|
Slco4c1
|
solute carrier organic anion transporter family, member 4C1 |
| chr1_-_64147251 | 0.27 |
ENSRNOT00000088502
|
Cnot3
|
CCR4-NOT transcription complex, subunit 3 |
| chr1_+_80000165 | 0.26 |
ENSRNOT00000084912
|
Six5
|
SIX homeobox 5 |
| chr17_+_88095830 | 0.26 |
ENSRNOT00000045984
|
Thnsl1
|
threonine synthase-like 1 |
| chr2_-_207300854 | 0.26 |
ENSRNOT00000018061
|
Mov10
|
Mov10 RISC complex RNA helicase |
| chr4_+_160020472 | 0.26 |
ENSRNOT00000078802
|
Parp11
|
poly (ADP-ribose) polymerase family, member 11 |
| chr5_-_148492232 | 0.26 |
ENSRNOT00000017577
|
Serinc2
|
serine incorporator 2 |
| chr7_-_124620703 | 0.26 |
ENSRNOT00000017727
|
Scube1
|
signal peptide, CUB domain and EGF like domain containing 1 |
| chr13_+_44475970 | 0.26 |
ENSRNOT00000024602
ENSRNOT00000091645 |
Ccnt2
|
cyclin T2 |
| chr8_+_122197027 | 0.26 |
ENSRNOT00000013050
|
Ubp1
|
upstream binding protein 1 (LBP-1a) |
| chr10_-_56444847 | 0.26 |
ENSRNOT00000056872
ENSRNOT00000092662 |
Nlgn2
|
neuroligin 2 |
| chr6_+_53401109 | 0.26 |
ENSRNOT00000014763
|
Twist1
|
twist family bHLH transcription factor 1 |
| chr3_+_58632476 | 0.26 |
ENSRNOT00000010630
|
Rapgef4
|
Rap guanine nucleotide exchange factor 4 |
| chr7_-_119071712 | 0.26 |
ENSRNOT00000037611
|
Myh9l1
|
myosin heavy chain 9-like 1 |
| chr10_-_74679858 | 0.25 |
ENSRNOT00000003859
|
Ppm1e
|
protein phosphatase, Mg2+/Mn2+ dependent, 1E |
| chr15_-_19733967 | 0.25 |
ENSRNOT00000012036
|
Gnpnat1
|
glucosamine-phosphate N-acetyltransferase 1 |
| chr20_-_22459025 | 0.25 |
ENSRNOT00000000792
|
Egr2
|
early growth response 2 |
| chr2_-_183031214 | 0.25 |
ENSRNOT00000013260
|
LOC679811
|
similar to RIKEN cDNA D930015E06 |
| chr7_+_18668692 | 0.25 |
ENSRNOT00000009532
|
Kank3
|
KN motif and ankyrin repeat domains 3 |
| chrX_+_104882704 | 0.25 |
ENSRNOT00000079572
ENSRNOT00000074330 ENSRNOT00000082983 |
Cstf2
|
cleavage stimulation factor subunit 2 |
| chr17_-_18028808 | 0.25 |
ENSRNOT00000022244
|
Kdm1b
|
lysine demethylase 1B |
| chr6_+_43829945 | 0.25 |
ENSRNOT00000086548
|
Klf11
|
Kruppel-like factor 11 |
| chr3_+_134413170 | 0.25 |
ENSRNOT00000074338
|
AABR07054000.1
|
|
| chr10_-_61744976 | 0.25 |
ENSRNOT00000079926
ENSRNOT00000092314 ENSRNOT00000034298 |
Sgsm2
|
small G protein signaling modulator 2 |
| chr1_-_188101566 | 0.25 |
ENSRNOT00000092435
|
Syt17
|
synaptotagmin 17 |
| chr14_+_19866408 | 0.25 |
ENSRNOT00000060465
|
Adamts3
|
ADAM metallopeptidase with thrombospondin type 1, motif 3 |
| chr16_-_21362955 | 0.25 |
ENSRNOT00000039607
|
Gmip
|
Gem-interacting protein |
| chr3_-_111560556 | 0.25 |
ENSRNOT00000030532
|
Ltk
|
leukocyte receptor tyrosine kinase |
| chr10_-_64657089 | 0.25 |
ENSRNOT00000080703
|
Abr
|
active BCR-related |
| chr10_+_83655460 | 0.24 |
ENSRNOT00000008011
|
Gngt2
|
G protein subunit gamma transducin 2 |
| chr9_+_81615251 | 0.24 |
ENSRNOT00000081106
ENSRNOT00000020049 |
Pnkd
|
paroxysmal nonkinesigenic dyskinesia |
| chr1_-_221041401 | 0.24 |
ENSRNOT00000064136
|
Pcnx3
|
pecanex homolog 3 (Drosophila) |
| chr5_+_58505500 | 0.24 |
ENSRNOT00000043216
|
Unc13b
|
unc-13 homolog B |
| chr2_+_205553163 | 0.24 |
ENSRNOT00000039572
|
Nras
|
neuroblastoma RAS viral oncogene homolog |
| chr4_+_157523320 | 0.24 |
ENSRNOT00000023192
|
Zfp384
|
zinc finger protein 384 |
| chrX_+_71174699 | 0.24 |
ENSRNOT00000076957
ENSRNOT00000090192 ENSRNOT00000040334 |
Med12
|
mediator complex subunit 12 |
| chr18_-_55891710 | 0.24 |
ENSRNOT00000064686
|
Synpo
|
synaptopodin |
| chr7_+_27309966 | 0.24 |
ENSRNOT00000031871
|
Nt5dc3
|
5'-nucleotidase domain containing 3 |
| chr5_-_58484900 | 0.24 |
ENSRNOT00000012386
|
Fam214b
|
family with sequence similarity 214, member B |
| chr1_-_167308827 | 0.24 |
ENSRNOT00000027590
ENSRNOT00000027575 |
Nup98
|
nucleoporin 98 |
| chr9_+_100932545 | 0.24 |
ENSRNOT00000025683
|
Ing5
|
inhibitor of growth family, member 5 |
| chr11_+_83868655 | 0.24 |
ENSRNOT00000072402
|
NEWGENE_621438
|
thrombopoietin |
| chr5_-_60559533 | 0.24 |
ENSRNOT00000092899
|
Zbtb5
|
zinc finger and BTB domain containing 5 |
| chr8_-_115358046 | 0.23 |
ENSRNOT00000017607
|
Grm2
|
glutamate metabotropic receptor 2 |
| chr1_+_266143818 | 0.23 |
ENSRNOT00000026987
|
Sufu
|
SUFU negative regulator of hedgehog signaling |
| chr9_+_47386626 | 0.23 |
ENSRNOT00000021270
|
Slc9a2
|
solute carrier family 9 member A2 |
| chr10_-_65200109 | 0.23 |
ENSRNOT00000030501
|
Nufip2
|
NUFIP2, FMR1 interacting protein 2 |
| chrX_+_39711201 | 0.23 |
ENSRNOT00000080512
ENSRNOT00000009802 |
Cnksr2
|
connector enhancer of kinase suppressor of Ras 2 |
| chr7_+_99954492 | 0.23 |
ENSRNOT00000005885
|
Trib1
|
tribbles pseudokinase 1 |
| chr16_-_81434038 | 0.23 |
ENSRNOT00000067508
|
Rasa3
|
RAS p21 protein activator 3 |
| chr13_-_48848864 | 0.23 |
ENSRNOT00000077857
ENSRNOT00000068003 |
Mfsd4
|
major facilitator superfamily domain containing 4 |
| chr18_-_16497886 | 0.23 |
ENSRNOT00000021624
|
Rprd1a
|
regulation of nuclear pre-mRNA domain containing 1A |
| chr1_-_188101261 | 0.23 |
ENSRNOT00000092243
ENSRNOT00000023090 |
Syt17
|
synaptotagmin 17 |
| chr7_+_11033317 | 0.23 |
ENSRNOT00000007498
|
Gna11
|
guanine nucleotide binding protein, alpha 11 |
| chr5_+_120498883 | 0.23 |
ENSRNOT00000007859
|
Leprot
|
leptin receptor overlapping transcript |
| chr7_-_12246729 | 0.23 |
ENSRNOT00000044030
|
Reep6
|
receptor accessory protein 6 |
| chr19_-_56633633 | 0.23 |
ENSRNOT00000023911
|
Ccsap
|
centriole, cilia and spindle-associated protein |
| chr6_-_115616766 | 0.23 |
ENSRNOT00000006143
ENSRNOT00000045870 |
Sel1l
|
SEL1L ERAD E3 ligase adaptor subunit |
| chr18_-_57114545 | 0.23 |
ENSRNOT00000026495
|
Afap1l1
|
actin filament associated protein 1-like 1 |
| chr5_+_43603043 | 0.23 |
ENSRNOT00000009899
|
Epha7
|
Eph receptor A7 |
| chr8_+_128087345 | 0.22 |
ENSRNOT00000019777
|
Acvr2b
|
activin A receptor type 2B |
| chr5_-_59647633 | 0.22 |
ENSRNOT00000091944
|
Rnf38
|
ring finger protein 38 |
| chr15_+_83707735 | 0.22 |
ENSRNOT00000057843
|
Klf5
|
Kruppel-like factor 5 |
| chr5_+_147476221 | 0.22 |
ENSRNOT00000010730
|
Sync
|
syncoilin, intermediate filament protein |
| chr9_+_43889473 | 0.22 |
ENSRNOT00000024330
|
Inpp4a
|
inositol polyphosphate-4-phosphatase type I A |
| chr10_-_91353601 | 0.22 |
ENSRNOT00000004532
|
Map3k14
|
mitogen-activated protein kinase kinase kinase 14 |
| chr2_+_216863428 | 0.22 |
ENSRNOT00000068413
|
Col11a1
|
collagen type XI alpha 1 chain |
| chr15_+_3936786 | 0.22 |
ENSRNOT00000066163
|
Camk2g
|
calcium/calmodulin-dependent protein kinase II gamma |
| chr10_-_62699723 | 0.22 |
ENSRNOT00000086706
|
Coro6
|
coronin 6 |
| chr11_+_15436269 | 0.22 |
ENSRNOT00000002150
ENSRNOT00000084928 |
Usp25
|
ubiquitin specific peptidase 25 |
| chr17_-_20364714 | 0.22 |
ENSRNOT00000070962
|
Jarid2
|
jumonji and AT-rich interaction domain containing 2 |
| chr16_+_3051449 | 0.22 |
ENSRNOT00000074069
|
Fam208a
|
family with sequence similarity 208, member A |
| chr3_-_123179644 | 0.22 |
ENSRNOT00000028835
|
Lzts3
|
leucine zipper tumor suppressor family member 3 |
| chr1_+_192233910 | 0.22 |
ENSRNOT00000016418
ENSRNOT00000016442 |
Prkcb
|
protein kinase C, beta |
| chr4_-_16130563 | 0.22 |
ENSRNOT00000090240
ENSRNOT00000034969 |
Cacna2d1
|
calcium voltage-gated channel auxiliary subunit alpha2delta 1 |
| chr8_-_78655856 | 0.22 |
ENSRNOT00000081185
|
Tcf12
|
transcription factor 12 |
| chr1_+_224998172 | 0.22 |
ENSRNOT00000026321
|
Zbtb3
|
zinc finger and BTB domain containing 3 |
| chr18_+_83471342 | 0.22 |
ENSRNOT00000019384
|
Neto1
|
neuropilin and tolloid like 1 |
| chr2_-_88135410 | 0.22 |
ENSRNOT00000014180
|
Car3
|
carbonic anhydrase 3 |
| chr5_+_154552195 | 0.22 |
ENSRNOT00000072864
|
Asap3
|
ArfGAP with SH3 domain, ankyrin repeat and PH domain 3 |
| chr8_+_45797315 | 0.22 |
ENSRNOT00000059997
|
AABR07070046.1
|
|
| chr10_+_57185347 | 0.22 |
ENSRNOT00000040488
ENSRNOT00000086374 |
Mink1
|
misshapen-like kinase 1 |
| chr19_-_37303788 | 0.22 |
ENSRNOT00000084734
|
Fhod1
|
formin homology 2 domain containing 1 |
| chr15_+_46008613 | 0.22 |
ENSRNOT00000066864
ENSRNOT00000080537 |
Wdfy2
|
WD repeat and FYVE domain containing 2 |
| chr6_-_111329882 | 0.22 |
ENSRNOT00000074480
|
Ism2
|
isthmin 2 |
| chr11_-_83546674 | 0.22 |
ENSRNOT00000044896
|
Ephb3
|
Eph receptor B3 |
| chr12_-_22138382 | 0.22 |
ENSRNOT00000001899
|
Lrch4
|
leucine rich repeats and calponin homology domain containing 4 |
| chr9_+_55050203 | 0.21 |
ENSRNOT00000021403
|
Nabp1
|
nucleic acid binding protein 1 |
| chr10_+_11912543 | 0.21 |
ENSRNOT00000045192
|
Zfp597
|
zinc finger protein 597 |
| chr6_-_135829953 | 0.21 |
ENSRNOT00000080623
ENSRNOT00000039059 |
Cdc42bpb
|
CDC42 binding protein kinase beta |
| chr18_+_63016761 | 0.21 |
ENSRNOT00000081432
|
Impa2
|
inositol monophosphatase 2 |
| chr14_+_115166416 | 0.21 |
ENSRNOT00000088916
ENSRNOT00000078329 |
Psme4
|
proteasome activator subunit 4 |
| chrX_-_34794589 | 0.21 |
ENSRNOT00000008703
|
Rai2
|
retinoic acid induced 2 |
| chr5_-_133959447 | 0.21 |
ENSRNOT00000011985
|
Cyp4x1
|
cytochrome P450, family 4, subfamily x, polypeptide 1 |
| chr3_-_123376455 | 0.21 |
ENSRNOT00000028842
|
RGD1565616
|
RGD1565616 |
| chr9_-_44456554 | 0.21 |
ENSRNOT00000080011
|
Tsga10
|
testis specific 10 |
| chr6_+_64224861 | 0.21 |
ENSRNOT00000093159
ENSRNOT00000093664 |
Pnpla8
|
patatin-like phospholipase domain containing 8 |
| chr8_+_59561721 | 0.21 |
ENSRNOT00000093107
ENSRNOT00000065771 ENSRNOT00000088304 |
Chrna5
|
cholinergic receptor nicotinic alpha 5 subunit |
| chr2_+_144646308 | 0.21 |
ENSRNOT00000078337
ENSRNOT00000093407 |
Dclk1
|
doublecortin-like kinase 1 |
| chr3_-_12415073 | 0.21 |
ENSRNOT00000022755
|
Ralgps1
|
Ral GEF with PH domain and SH3 binding motif 1 |
| chr1_+_226435979 | 0.21 |
ENSRNOT00000048704
ENSRNOT00000036232 ENSRNOT00000035576 ENSRNOT00000036180 ENSRNOT00000036168 ENSRNOT00000047964 ENSRNOT00000036283 ENSRNOT00000007429 |
Syt7
|
synaptotagmin 7 |
| chr8_+_22189600 | 0.21 |
ENSRNOT00000061100
|
Pde4a
|
phosphodiesterase 4A |
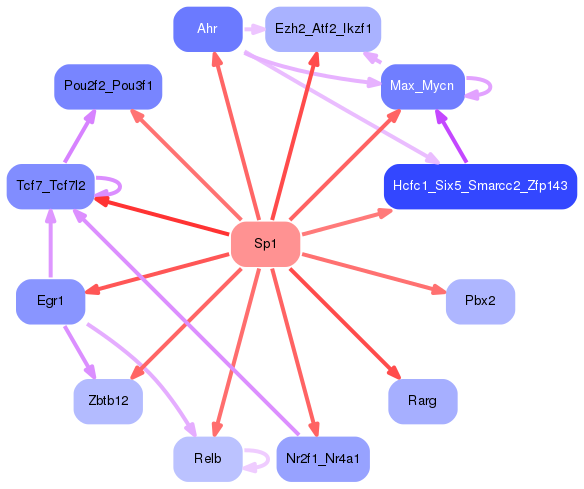
Network of associatons between targets according to the STRING database.

First level regulatory network of Sp1
Gene Ontology Analysis
Gene overrepresentation in biological process category:
| Log-likelihood per target | Total log-likelihood | Term | Description |
|---|---|---|---|
| 0.2 | 0.7 | GO:0003430 | growth plate cartilage chondrocyte growth(GO:0003430) |
| 0.2 | 0.7 | GO:0035544 | negative regulation of SNARE complex assembly(GO:0035544) |
| 0.2 | 0.5 | GO:1902595 | regulation of DNA replication origin binding(GO:1902595) |
| 0.2 | 0.8 | GO:1904717 | regulation of AMPA glutamate receptor clustering(GO:1904717) |
| 0.1 | 0.4 | GO:0032915 | positive regulation of transforming growth factor beta2 production(GO:0032915) |
| 0.1 | 0.4 | GO:0098971 | anterograde dendritic transport of neurotransmitter receptor complex(GO:0098971) |
| 0.1 | 0.4 | GO:2000182 | regulation of progesterone biosynthetic process(GO:2000182) |
| 0.1 | 0.4 | GO:0048619 | embryonic hindgut morphogenesis(GO:0048619) |
| 0.1 | 0.4 | GO:0021816 | lamellipodium assembly involved in ameboidal cell migration(GO:0003363) extension of a leading process involved in cell motility in cerebral cortex radial glia guided migration(GO:0021816) |
| 0.1 | 0.1 | GO:0038028 | insulin receptor signaling pathway via phosphatidylinositol 3-kinase(GO:0038028) |
| 0.1 | 0.4 | GO:0051088 | PMA-inducible membrane protein ectodomain proteolysis(GO:0051088) |
| 0.1 | 0.2 | GO:1902809 | regulation of skeletal muscle fiber differentiation(GO:1902809) |
| 0.1 | 0.7 | GO:0043435 | response to corticotropin-releasing hormone(GO:0043435) cellular response to corticotropin-releasing hormone stimulus(GO:0071376) |
| 0.1 | 0.3 | GO:0070649 | formin-nucleated actin cable assembly(GO:0070649) |
| 0.1 | 0.6 | GO:0098989 | NMDA selective glutamate receptor signaling pathway(GO:0098989) |
| 0.1 | 0.3 | GO:0035408 | histone H3-T6 phosphorylation(GO:0035408) |
| 0.1 | 0.5 | GO:0098795 | mRNA cleavage involved in gene silencing by miRNA(GO:0035279) mRNA cleavage involved in gene silencing(GO:0098795) |
| 0.1 | 0.3 | GO:0070563 | negative regulation of vitamin D receptor signaling pathway(GO:0070563) |
| 0.1 | 0.3 | GO:0002380 | immunoglobulin secretion involved in immune response(GO:0002380) |
| 0.1 | 0.3 | GO:0007597 | blood coagulation, intrinsic pathway(GO:0007597) |
| 0.1 | 0.4 | GO:0040009 | regulation of growth rate(GO:0040009) |
| 0.1 | 0.3 | GO:0044725 | chromatin reprogramming in the zygote(GO:0044725) |
| 0.1 | 0.5 | GO:0042758 | long-chain fatty acid catabolic process(GO:0042758) |
| 0.1 | 0.3 | GO:0003343 | proepicardium development(GO:0003342) septum transversum development(GO:0003343) |
| 0.1 | 0.3 | GO:0000973 | posttranscriptional tethering of RNA polymerase II gene DNA at nuclear periphery(GO:0000973) |
| 0.1 | 0.4 | GO:0050893 | sensory processing(GO:0050893) |
| 0.1 | 0.3 | GO:0072156 | distal tubule morphogenesis(GO:0072156) |
| 0.1 | 0.4 | GO:2000969 | positive regulation of alpha-amino-3-hydroxy-5-methyl-4-isoxazole propionate selective glutamate receptor activity(GO:2000969) |
| 0.1 | 0.3 | GO:0051935 | amino acid neurotransmitter reuptake(GO:0051933) glutamate reuptake(GO:0051935) |
| 0.1 | 0.5 | GO:0072697 | protein localization to cell cortex(GO:0072697) |
| 0.1 | 0.5 | GO:0060023 | soft palate development(GO:0060023) |
| 0.1 | 0.2 | GO:0003415 | chondrocyte hypertrophy(GO:0003415) |
| 0.1 | 0.1 | GO:0007442 | hindgut morphogenesis(GO:0007442) |
| 0.1 | 0.3 | GO:0007079 | mitotic chromosome movement towards spindle pole(GO:0007079) |
| 0.1 | 0.2 | GO:0016539 | intein-mediated protein splicing(GO:0016539) protein splicing(GO:0030908) |
| 0.1 | 0.3 | GO:0034499 | late endosome to Golgi transport(GO:0034499) |
| 0.1 | 0.3 | GO:1900748 | positive regulation of vascular endothelial growth factor signaling pathway(GO:1900748) |
| 0.1 | 0.3 | GO:0043570 | maintenance of DNA repeat elements(GO:0043570) |
| 0.1 | 0.3 | GO:0035359 | negative regulation of histone phosphorylation(GO:0033128) negative regulation of peroxisome proliferator activated receptor signaling pathway(GO:0035359) |
| 0.1 | 0.3 | GO:0031632 | positive regulation of synaptic vesicle fusion to presynaptic membrane(GO:0031632) |
| 0.1 | 0.3 | GO:0019086 | late viral transcription(GO:0019086) |
| 0.1 | 0.3 | GO:0098886 | modification of dendritic spine(GO:0098886) |
| 0.1 | 0.3 | GO:0060994 | regulation of transcription from RNA polymerase II promoter involved in kidney development(GO:0060994) |
| 0.1 | 0.2 | GO:0021586 | pons maturation(GO:0021586) |
| 0.1 | 0.2 | GO:0006543 | glutamine catabolic process(GO:0006543) |
| 0.1 | 0.2 | GO:0043314 | negative regulation of neutrophil degranulation(GO:0043314) |
| 0.1 | 0.2 | GO:1904457 | positive regulation of neuronal action potential(GO:1904457) |
| 0.1 | 0.3 | GO:0072709 | cellular response to sorbitol(GO:0072709) |
| 0.1 | 0.1 | GO:0021502 | neural fold elevation formation(GO:0021502) |
| 0.1 | 0.2 | GO:0070212 | protein poly-ADP-ribosylation(GO:0070212) |
| 0.1 | 0.3 | GO:0010808 | positive regulation of synaptic vesicle priming(GO:0010808) |
| 0.1 | 0.2 | GO:0061034 | olfactory bulb mitral cell layer development(GO:0061034) |
| 0.1 | 0.7 | GO:0045607 | regulation of auditory receptor cell differentiation(GO:0045607) regulation of mechanoreceptor differentiation(GO:0045631) regulation of inner ear receptor cell differentiation(GO:2000980) |
| 0.1 | 0.3 | GO:0032485 | regulation of Ral protein signal transduction(GO:0032485) |
| 0.1 | 0.9 | GO:0033601 | positive regulation of mammary gland epithelial cell proliferation(GO:0033601) |
| 0.1 | 0.2 | GO:2000312 | regulation of kainate selective glutamate receptor activity(GO:2000312) |
| 0.1 | 0.5 | GO:0021942 | radial glia guided migration of Purkinje cell(GO:0021942) |
| 0.1 | 0.3 | GO:0060158 | phospholipase C-activating dopamine receptor signaling pathway(GO:0060158) |
| 0.1 | 0.2 | GO:1900368 | regulation of RNA interference(GO:1900368) |
| 0.1 | 0.2 | GO:1990926 | short-term synaptic potentiation(GO:1990926) |
| 0.1 | 0.3 | GO:0045658 | regulation of neutrophil differentiation(GO:0045658) |
| 0.1 | 0.1 | GO:0060129 | corticotropin hormone secreting cell differentiation(GO:0060128) thyroid-stimulating hormone-secreting cell differentiation(GO:0060129) |
| 0.1 | 0.2 | GO:0001966 | thigmotaxis(GO:0001966) |
| 0.1 | 0.3 | GO:0021776 | smoothened signaling pathway involved in ventral spinal cord interneuron specification(GO:0021775) smoothened signaling pathway involved in spinal cord motor neuron cell fate specification(GO:0021776) |
| 0.1 | 0.7 | GO:0007256 | activation of JNKK activity(GO:0007256) |
| 0.1 | 0.2 | GO:1902748 | positive regulation of lens fiber cell differentiation(GO:1902748) |
| 0.1 | 0.2 | GO:0090370 | negative regulation of cholesterol efflux(GO:0090370) |
| 0.1 | 0.2 | GO:0070537 | histone H2A K63-linked deubiquitination(GO:0070537) |
| 0.1 | 0.2 | GO:0009644 | response to high light intensity(GO:0009644) |
| 0.1 | 0.2 | GO:0072209 | metanephric mesangial cell differentiation(GO:0072209) metanephric glomerular mesangial cell differentiation(GO:0072254) |
| 0.1 | 0.1 | GO:0032423 | regulation of mismatch repair(GO:0032423) |
| 0.1 | 0.5 | GO:0010735 | positive regulation of transcription via serum response element binding(GO:0010735) |
| 0.1 | 0.5 | GO:2001184 | positive regulation of interleukin-12 secretion(GO:2001184) |
| 0.1 | 0.2 | GO:0032298 | positive regulation of DNA-dependent DNA replication initiation(GO:0032298) |
| 0.1 | 0.1 | GO:0086048 | membrane depolarization during bundle of His cell action potential(GO:0086048) |
| 0.1 | 0.1 | GO:0044340 | canonical Wnt signaling pathway involved in regulation of cell proliferation(GO:0044340) |
| 0.1 | 0.1 | GO:2000587 | negative regulation of platelet-derived growth factor receptor-beta signaling pathway(GO:2000587) |
| 0.1 | 0.2 | GO:0071929 | alpha-tubulin acetylation(GO:0071929) |
| 0.1 | 0.4 | GO:0043686 | co-translational protein modification(GO:0043686) |
| 0.1 | 0.2 | GO:0021849 | neuroblast division in subventricular zone(GO:0021849) |
| 0.1 | 0.2 | GO:0021812 | neuronal-glial interaction involved in cerebral cortex radial glia guided migration(GO:0021812) |
| 0.1 | 0.2 | GO:0071579 | regulation of zinc ion transport(GO:0071579) |
| 0.1 | 0.2 | GO:0042489 | negative regulation of odontogenesis of dentin-containing tooth(GO:0042489) |
| 0.1 | 0.2 | GO:0016203 | muscle attachment(GO:0016203) olfactory nerve morphogenesis(GO:0021627) olfactory nerve structural organization(GO:0021629) |
| 0.1 | 0.2 | GO:0071454 | cellular response to anoxia(GO:0071454) |
| 0.1 | 0.2 | GO:1902534 | single-organism membrane invagination(GO:1902534) |
| 0.1 | 0.2 | GO:1902263 | apoptotic process involved in embryonic digit morphogenesis(GO:1902263) |
| 0.1 | 0.2 | GO:0021882 | regulation of transcription from RNA polymerase II promoter involved in forebrain neuron fate commitment(GO:0021882) commitment of multipotent stem cells to neuronal lineage in forebrain(GO:0021898) |
| 0.1 | 0.3 | GO:0035093 | spermatogenesis, exchange of chromosomal proteins(GO:0035093) |
| 0.1 | 0.3 | GO:0051964 | negative regulation of synapse assembly(GO:0051964) |
| 0.1 | 0.2 | GO:0035521 | monoubiquitinated histone deubiquitination(GO:0035521) monoubiquitinated histone H2A deubiquitination(GO:0035522) |
| 0.1 | 0.5 | GO:0061193 | taste bud development(GO:0061193) |
| 0.1 | 0.2 | GO:1904219 | regulation of CDP-diacylglycerol-serine O-phosphatidyltransferase activity(GO:1904217) positive regulation of CDP-diacylglycerol-serine O-phosphatidyltransferase activity(GO:1904219) positive regulation of serine C-palmitoyltransferase activity(GO:1904222) |
| 0.1 | 0.2 | GO:1903406 | positive regulation of synaptic growth at neuromuscular junction(GO:0045887) regulation of sodium:potassium-exchanging ATPase activity(GO:1903406) regulation of protein geranylgeranylation(GO:2000539) positive regulation of protein geranylgeranylation(GO:2000541) |
| 0.1 | 0.4 | GO:0030644 | cellular chloride ion homeostasis(GO:0030644) |
| 0.1 | 0.6 | GO:0006655 | phosphatidylglycerol biosynthetic process(GO:0006655) |
| 0.1 | 0.2 | GO:1900673 | olefin metabolic process(GO:1900673) |
| 0.1 | 0.5 | GO:0042795 | snRNA transcription from RNA polymerase II promoter(GO:0042795) |
| 0.1 | 0.2 | GO:0061441 | renal artery morphogenesis(GO:0061441) |
| 0.1 | 0.4 | GO:0034773 | histone H4-K20 trimethylation(GO:0034773) |
| 0.1 | 0.6 | GO:0035507 | regulation of myosin-light-chain-phosphatase activity(GO:0035507) |
| 0.1 | 0.1 | GO:2000137 | negative regulation of cell proliferation involved in heart morphogenesis(GO:2000137) |
| 0.1 | 0.2 | GO:0002337 | B-1a B cell differentiation(GO:0002337) |
| 0.1 | 0.2 | GO:0060398 | regulation of growth hormone receptor signaling pathway(GO:0060398) |
| 0.1 | 0.3 | GO:0021902 | commitment of neuronal cell to specific neuron type in forebrain(GO:0021902) |
| 0.1 | 0.2 | GO:0090038 | negative regulation of protein kinase C signaling(GO:0090038) |
| 0.1 | 0.3 | GO:0007197 | adenylate cyclase-inhibiting G-protein coupled acetylcholine receptor signaling pathway(GO:0007197) phospholipase C-activating G-protein coupled acetylcholine receptor signaling pathway(GO:0007207) |
| 0.1 | 0.3 | GO:0001661 | conditioned taste aversion(GO:0001661) |
| 0.1 | 0.2 | GO:0034971 | histone H3-R17 methylation(GO:0034971) |
| 0.1 | 0.1 | GO:0009794 | regulation of mitotic cell cycle, embryonic(GO:0009794) mitotic cell cycle, embryonic(GO:0045448) |
| 0.1 | 0.2 | GO:0046959 | habituation(GO:0046959) |
| 0.1 | 0.3 | GO:0021747 | cochlear nucleus development(GO:0021747) |
| 0.1 | 0.3 | GO:1904684 | negative regulation of metalloendopeptidase activity(GO:1904684) |
| 0.1 | 0.2 | GO:0097155 | fasciculation of sensory neuron axon(GO:0097155) |
| 0.1 | 0.2 | GO:2000328 | regulation of T-helper 17 cell lineage commitment(GO:2000328) |
| 0.1 | 0.2 | GO:0036515 | serotonergic neuron axon guidance(GO:0036515) |
| 0.1 | 0.1 | GO:0017055 | negative regulation of RNA polymerase II transcriptional preinitiation complex assembly(GO:0017055) |
| 0.1 | 0.3 | GO:2000327 | positive regulation of ligand-dependent nuclear receptor transcription coactivator activity(GO:2000327) |
| 0.1 | 0.6 | GO:2000786 | positive regulation of autophagosome assembly(GO:2000786) |
| 0.1 | 0.3 | GO:0070940 | dephosphorylation of RNA polymerase II C-terminal domain(GO:0070940) |
| 0.1 | 0.2 | GO:1902211 | regulation of prolactin signaling pathway(GO:1902211) |
| 0.1 | 0.1 | GO:0070094 | positive regulation of glucagon secretion(GO:0070094) |
| 0.1 | 0.4 | GO:0021764 | amygdala development(GO:0021764) |
| 0.1 | 0.3 | GO:1901843 | positive regulation of high voltage-gated calcium channel activity(GO:1901843) |
| 0.1 | 0.2 | GO:0046338 | phosphatidylethanolamine catabolic process(GO:0046338) |
| 0.1 | 0.2 | GO:2000525 | regulation of T cell costimulation(GO:2000523) positive regulation of T cell costimulation(GO:2000525) |
| 0.1 | 0.2 | GO:0034628 | nicotinamide nucleotide biosynthetic process from aspartate(GO:0019355) 'de novo' NAD biosynthetic process from aspartate(GO:0034628) |
| 0.1 | 0.4 | GO:0035878 | nail development(GO:0035878) |
| 0.1 | 0.2 | GO:0072034 | renal vesicle induction(GO:0072034) |
| 0.1 | 0.1 | GO:0035995 | detection of muscle stretch(GO:0035995) |
| 0.1 | 0.2 | GO:0003160 | endocardium morphogenesis(GO:0003160) |
| 0.1 | 0.2 | GO:0000189 | MAPK import into nucleus(GO:0000189) |
| 0.1 | 0.1 | GO:1901219 | regulation of cardiac chamber morphogenesis(GO:1901219) negative regulation of cardiac chamber morphogenesis(GO:1901220) |
| 0.1 | 0.1 | GO:0060373 | regulation of ventricular cardiac muscle cell membrane depolarization(GO:0060373) |
| 0.1 | 0.2 | GO:0099628 | receptor diffusion trapping(GO:0098953) postsynaptic neurotransmitter receptor diffusion trapping(GO:0098970) neurotransmitter receptor diffusion trapping(GO:0099628) |
| 0.1 | 0.3 | GO:0010701 | positive regulation of norepinephrine secretion(GO:0010701) |
| 0.1 | 0.2 | GO:2000286 | receptor internalization involved in canonical Wnt signaling pathway(GO:2000286) |
| 0.1 | 0.2 | GO:0070086 | ubiquitin-dependent endocytosis(GO:0070086) |
| 0.0 | 0.2 | GO:0033088 | negative regulation of immature T cell proliferation in thymus(GO:0033088) |
| 0.0 | 0.3 | GO:0071386 | cellular response to corticosterone stimulus(GO:0071386) |
| 0.0 | 0.1 | GO:0099525 | presynaptic dense core granule exocytosis(GO:0099525) |
| 0.0 | 0.2 | GO:0021593 | rhombomere morphogenesis(GO:0021593) |
| 0.0 | 0.6 | GO:0007076 | mitotic chromosome condensation(GO:0007076) |
| 0.0 | 0.1 | GO:0090172 | microtubule cytoskeleton organization involved in homologous chromosome segregation(GO:0090172) |
| 0.0 | 0.0 | GO:0031630 | regulation of synaptic vesicle fusion to presynaptic membrane(GO:0031630) |
| 0.0 | 0.1 | GO:0043382 | positive regulation of memory T cell differentiation(GO:0043382) |
| 0.0 | 0.1 | GO:0030327 | prenylated protein catabolic process(GO:0030327) |
| 0.0 | 0.2 | GO:0060066 | oviduct development(GO:0060066) |
| 0.0 | 0.5 | GO:0016926 | protein desumoylation(GO:0016926) |
| 0.0 | 0.3 | GO:0071000 | response to magnetism(GO:0071000) |
| 0.0 | 0.2 | GO:0018125 | peptidyl-cysteine methylation(GO:0018125) |
| 0.0 | 0.2 | GO:0010519 | negative regulation of phospholipase activity(GO:0010519) |
| 0.0 | 0.0 | GO:0060687 | regulation of branching involved in prostate gland morphogenesis(GO:0060687) |
| 0.0 | 0.0 | GO:2000729 | positive regulation of mesenchymal cell proliferation involved in ureter development(GO:2000729) |
| 0.0 | 0.3 | GO:0090245 | axis elongation involved in somitogenesis(GO:0090245) |
| 0.0 | 0.1 | GO:0090210 | regulation of establishment of blood-brain barrier(GO:0090210) |
| 0.0 | 0.1 | GO:0060821 | inactivation of X chromosome by DNA methylation(GO:0060821) |
| 0.0 | 0.2 | GO:0010424 | DNA methylation on cytosine within a CG sequence(GO:0010424) |
| 0.0 | 0.1 | GO:1902202 | regulation of hepatocyte growth factor receptor signaling pathway(GO:1902202) |
| 0.0 | 0.1 | GO:1902309 | negative regulation of peptidyl-serine dephosphorylation(GO:1902309) |
| 0.0 | 0.1 | GO:0001560 | regulation of cell growth by extracellular stimulus(GO:0001560) |
| 0.0 | 0.4 | GO:0098789 | pre-mRNA cleavage required for polyadenylation(GO:0098789) |
| 0.0 | 0.1 | GO:0072053 | renal inner medulla development(GO:0072053) |
| 0.0 | 0.0 | GO:0044330 | canonical Wnt signaling pathway involved in positive regulation of wound healing(GO:0044330) |
| 0.0 | 0.1 | GO:0072708 | response to sorbitol(GO:0072708) |
| 0.0 | 0.1 | GO:0006433 | prolyl-tRNA aminoacylation(GO:0006433) |
| 0.0 | 0.4 | GO:0060836 | lymphatic endothelial cell differentiation(GO:0060836) |
| 0.0 | 0.3 | GO:0038027 | apolipoprotein A-I-mediated signaling pathway(GO:0038027) |
| 0.0 | 0.7 | GO:0007216 | G-protein coupled glutamate receptor signaling pathway(GO:0007216) |
| 0.0 | 0.2 | GO:0000414 | regulation of histone H3-K36 methylation(GO:0000414) |
| 0.0 | 0.2 | GO:0021914 | negative regulation of smoothened signaling pathway involved in ventral spinal cord patterning(GO:0021914) |
| 0.0 | 0.0 | GO:0001923 | B-1 B cell differentiation(GO:0001923) |
| 0.0 | 0.5 | GO:0043569 | negative regulation of insulin-like growth factor receptor signaling pathway(GO:0043569) |
| 0.0 | 0.1 | GO:1990166 | protein localization to site of double-strand break(GO:1990166) |
| 0.0 | 0.2 | GO:0036394 | amylase secretion(GO:0036394) |
| 0.0 | 0.4 | GO:0010764 | negative regulation of fibroblast migration(GO:0010764) |
| 0.0 | 0.3 | GO:0048170 | positive regulation of long-term neuronal synaptic plasticity(GO:0048170) |
| 0.0 | 0.2 | GO:1990414 | replication-born double-strand break repair via sister chromatid exchange(GO:1990414) |
| 0.0 | 0.3 | GO:0006041 | glucosamine metabolic process(GO:0006041) |
| 0.0 | 0.1 | GO:0034770 | histone H4-K20 methylation(GO:0034770) |
| 0.0 | 0.1 | GO:0010571 | positive regulation of nuclear cell cycle DNA replication(GO:0010571) |
| 0.0 | 0.2 | GO:0042494 | detection of bacterial lipoprotein(GO:0042494) |
| 0.0 | 0.0 | GO:0072190 | ureter urothelium development(GO:0072190) |
| 0.0 | 0.3 | GO:0051823 | regulation of synapse structural plasticity(GO:0051823) |
| 0.0 | 0.7 | GO:0072600 | establishment of protein localization to Golgi(GO:0072600) |
| 0.0 | 0.1 | GO:0072061 | inner medullary collecting duct development(GO:0072061) |
| 0.0 | 0.1 | GO:0034395 | regulation of transcription from RNA polymerase II promoter in response to iron(GO:0034395) |
| 0.0 | 0.2 | GO:0033091 | positive regulation of immature T cell proliferation(GO:0033091) |
| 0.0 | 0.4 | GO:0086046 | membrane depolarization during SA node cell action potential(GO:0086046) |
| 0.0 | 0.1 | GO:0044778 | meiotic DNA integrity checkpoint(GO:0044778) |
| 0.0 | 0.4 | GO:0006975 | DNA damage induced protein phosphorylation(GO:0006975) |
| 0.0 | 0.1 | GO:0061010 | gall bladder development(GO:0061010) |
| 0.0 | 0.2 | GO:0097039 | protein linear polyubiquitination(GO:0097039) |
| 0.0 | 0.1 | GO:0046416 | D-amino acid metabolic process(GO:0046416) |
| 0.0 | 0.1 | GO:0030576 | Cajal body organization(GO:0030576) |
| 0.0 | 0.1 | GO:2000830 | vacuolar phosphate transport(GO:0007037) positive regulation of parathyroid hormone secretion(GO:2000830) |
| 0.0 | 0.3 | GO:1903546 | protein localization to photoreceptor outer segment(GO:1903546) |
| 0.0 | 0.6 | GO:0032688 | negative regulation of interferon-beta production(GO:0032688) |
| 0.0 | 0.2 | GO:1903300 | negative regulation of glucokinase activity(GO:0033132) negative regulation of hexokinase activity(GO:1903300) |
| 0.0 | 0.1 | GO:0002554 | serotonin secretion by platelet(GO:0002554) |
| 0.0 | 0.2 | GO:0060689 | cell differentiation involved in salivary gland development(GO:0060689) |
| 0.0 | 0.1 | GO:0060355 | positive regulation of cell adhesion molecule production(GO:0060355) |
| 0.0 | 0.8 | GO:0070536 | protein K63-linked deubiquitination(GO:0070536) |
| 0.0 | 0.2 | GO:0000320 | re-entry into mitotic cell cycle(GO:0000320) |
| 0.0 | 0.1 | GO:0019343 | cysteine biosynthetic process via cystathionine(GO:0019343) |
| 0.0 | 0.2 | GO:0015811 | L-cystine transport(GO:0015811) |
| 0.0 | 0.1 | GO:0002433 | immune response-regulating cell surface receptor signaling pathway involved in phagocytosis(GO:0002433) Fc-gamma receptor signaling pathway involved in phagocytosis(GO:0038096) |
| 0.0 | 0.2 | GO:0090129 | positive regulation of synapse maturation(GO:0090129) |
| 0.0 | 0.0 | GO:0010032 | meiotic chromosome condensation(GO:0010032) |
| 0.0 | 0.1 | GO:1900034 | regulation of cellular response to heat(GO:1900034) |
| 0.0 | 0.2 | GO:0072734 | response to staurosporine(GO:0072733) cellular response to staurosporine(GO:0072734) |
| 0.0 | 0.3 | GO:0051388 | positive regulation of neurotrophin TRK receptor signaling pathway(GO:0051388) |
| 0.0 | 0.2 | GO:1903977 | positive regulation of glial cell migration(GO:1903977) |
| 0.0 | 0.2 | GO:0097401 | synaptic vesicle lumen acidification(GO:0097401) |
| 0.0 | 0.1 | GO:0010643 | cell communication by chemical coupling(GO:0010643) |
| 0.0 | 0.2 | GO:0048341 | paraxial mesoderm formation(GO:0048341) |
| 0.0 | 0.1 | GO:1903225 | negative regulation of endodermal cell differentiation(GO:1903225) |
| 0.0 | 0.1 | GO:0043316 | cytotoxic T cell degranulation(GO:0043316) |
| 0.0 | 0.0 | GO:0010847 | regulation of chromatin assembly(GO:0010847) |
| 0.0 | 0.0 | GO:0061734 | parkin-mediated mitophagy in response to mitochondrial depolarization(GO:0061734) |
| 0.0 | 0.1 | GO:1990478 | response to ultrasound(GO:1990478) |
| 0.0 | 0.1 | GO:0000972 | transcription-dependent tethering of RNA polymerase II gene DNA at nuclear periphery(GO:0000972) |
| 0.0 | 0.2 | GO:0070345 | negative regulation of fat cell proliferation(GO:0070345) |
| 0.0 | 0.1 | GO:0036151 | phosphatidylcholine acyl-chain remodeling(GO:0036151) |
| 0.0 | 0.0 | GO:0010909 | regulation of heparan sulfate proteoglycan biosynthetic process(GO:0010908) positive regulation of heparan sulfate proteoglycan biosynthetic process(GO:0010909) |
| 0.0 | 0.2 | GO:0097676 | histone H3-K36 dimethylation(GO:0097676) |
| 0.0 | 0.1 | GO:0021997 | neural plate axis specification(GO:0021997) |
| 0.0 | 0.1 | GO:1901097 | negative regulation of autophagosome maturation(GO:1901097) |
| 0.0 | 0.2 | GO:0051596 | methylglyoxal catabolic process to D-lactate via S-lactoyl-glutathione(GO:0019243) methylglyoxal catabolic process(GO:0051596) methylglyoxal catabolic process to lactate(GO:0061727) |
| 0.0 | 0.1 | GO:0019389 | glucuronoside metabolic process(GO:0019389) |
| 0.0 | 0.0 | GO:1900126 | negative regulation of hyaluronan biosynthetic process(GO:1900126) |
| 0.0 | 0.0 | GO:2000049 | positive regulation of cell-cell adhesion mediated by cadherin(GO:2000049) |
| 0.0 | 0.5 | GO:0016578 | histone deubiquitination(GO:0016578) |
| 0.0 | 0.1 | GO:0034497 | protein localization to pre-autophagosomal structure(GO:0034497) |
| 0.0 | 0.2 | GO:0007223 | Wnt signaling pathway, calcium modulating pathway(GO:0007223) |
| 0.0 | 0.1 | GO:2000118 | regulation of sodium-dependent phosphate transport(GO:2000118) |
| 0.0 | 0.2 | GO:0001574 | ganglioside biosynthetic process(GO:0001574) |
| 0.0 | 0.3 | GO:0035330 | regulation of hippo signaling(GO:0035330) |
| 0.0 | 0.3 | GO:1903715 | regulation of aerobic respiration(GO:1903715) |
| 0.0 | 0.1 | GO:1903760 | regulation of voltage-gated potassium channel activity involved in ventricular cardiac muscle cell action potential repolarization(GO:1903760) |
| 0.0 | 0.2 | GO:0072675 | osteoclast fusion(GO:0072675) |
| 0.0 | 0.3 | GO:0010603 | regulation of cytoplasmic mRNA processing body assembly(GO:0010603) |
| 0.0 | 0.1 | GO:0045900 | negative regulation of translational elongation(GO:0045900) |
| 0.0 | 0.9 | GO:1903861 | positive regulation of dendrite extension(GO:1903861) |
| 0.0 | 0.1 | GO:0021698 | cerebellar cortex structural organization(GO:0021698) |
| 0.0 | 0.3 | GO:0034720 | histone H3-K4 demethylation(GO:0034720) |
| 0.0 | 0.1 | GO:1903575 | cornified envelope assembly(GO:1903575) |
| 0.0 | 0.0 | GO:2000474 | regulation of opioid receptor signaling pathway(GO:2000474) |
| 0.0 | 0.2 | GO:0060750 | epithelial cell proliferation involved in mammary gland duct elongation(GO:0060750) |
| 0.0 | 0.5 | GO:0036092 | phosphatidylinositol-3-phosphate biosynthetic process(GO:0036092) |
| 0.0 | 0.1 | GO:0016480 | negative regulation of transcription from RNA polymerase III promoter(GO:0016480) |
| 0.0 | 0.7 | GO:0000188 | inactivation of MAPK activity(GO:0000188) |
| 0.0 | 0.2 | GO:0021869 | forebrain ventricular zone progenitor cell division(GO:0021869) |
| 0.0 | 0.2 | GO:0006610 | ribosomal protein import into nucleus(GO:0006610) |
| 0.0 | 0.3 | GO:0006021 | inositol biosynthetic process(GO:0006021) |
| 0.0 | 0.1 | GO:0033540 | fatty acid beta-oxidation using acyl-CoA oxidase(GO:0033540) |
| 0.0 | 0.1 | GO:0071802 | negative regulation of podosome assembly(GO:0071802) |
| 0.0 | 0.1 | GO:0032916 | positive regulation of transforming growth factor beta3 production(GO:0032916) |
| 0.0 | 0.1 | GO:0032911 | negative regulation of transforming growth factor beta1 production(GO:0032911) |
| 0.0 | 0.2 | GO:0061577 | calcium ion transmembrane transport via high voltage-gated calcium channel(GO:0061577) |
| 0.0 | 0.1 | GO:0070946 | neutrophil mediated killing of gram-positive bacterium(GO:0070946) |
| 0.0 | 0.2 | GO:1990785 | response to water-immersion restraint stress(GO:1990785) |
| 0.0 | 0.2 | GO:0030050 | vesicle transport along actin filament(GO:0030050) |
| 0.0 | 0.1 | GO:1990839 | response to endothelin(GO:1990839) cellular response to endothelin(GO:1990859) |
| 0.0 | 0.4 | GO:0035970 | peptidyl-threonine dephosphorylation(GO:0035970) |
| 0.0 | 0.1 | GO:0021564 | vagus nerve development(GO:0021564) |
| 0.0 | 0.1 | GO:0003050 | regulation of systemic arterial blood pressure by atrial natriuretic peptide(GO:0003050) |
| 0.0 | 0.3 | GO:0072502 | cellular phosphate ion homeostasis(GO:0030643) cellular trivalent inorganic anion homeostasis(GO:0072502) |
| 0.0 | 0.1 | GO:0043132 | NAD transport(GO:0043132) |
| 0.0 | 0.1 | GO:1904347 | eye blink reflex(GO:0060082) negative regulation of gastro-intestinal system smooth muscle contraction(GO:1904305) regulation of small intestine smooth muscle contraction(GO:1904347) negative regulation of small intestine smooth muscle contraction(GO:1904348) small intestine smooth muscle contraction(GO:1990770) |
| 0.0 | 0.3 | GO:0016973 | poly(A)+ mRNA export from nucleus(GO:0016973) |
| 0.0 | 0.2 | GO:0045218 | zonula adherens maintenance(GO:0045218) |
| 0.0 | 0.8 | GO:0007020 | microtubule nucleation(GO:0007020) |
| 0.0 | 0.0 | GO:0045077 | negative regulation of interferon-gamma biosynthetic process(GO:0045077) |
| 0.0 | 0.3 | GO:0045654 | positive regulation of megakaryocyte differentiation(GO:0045654) |
| 0.0 | 0.1 | GO:0090271 | positive regulation of fibroblast growth factor production(GO:0090271) |
| 0.0 | 0.3 | GO:0051182 | coenzyme transport(GO:0051182) |
| 0.0 | 0.4 | GO:1901407 | regulation of phosphorylation of RNA polymerase II C-terminal domain(GO:1901407) |
| 0.0 | 0.1 | GO:0002669 | positive regulation of T cell anergy(GO:0002669) positive regulation of lymphocyte anergy(GO:0002913) |
| 0.0 | 0.0 | GO:2000298 | regulation of Rho-dependent protein serine/threonine kinase activity(GO:2000298) |
| 0.0 | 0.2 | GO:0071557 | histone H3-K27 demethylation(GO:0071557) |
| 0.0 | 0.1 | GO:0071926 | endocannabinoid signaling pathway(GO:0071926) regulation of endocannabinoid signaling pathway(GO:2000124) |
| 0.0 | 0.1 | GO:2000297 | negative regulation of synapse maturation(GO:2000297) |
| 0.0 | 0.3 | GO:1901525 | negative regulation of macromitophagy(GO:1901525) |
| 0.0 | 0.2 | GO:0038092 | nodal signaling pathway(GO:0038092) |
| 0.0 | 0.0 | GO:0035280 | miRNA loading onto RISC involved in gene silencing by miRNA(GO:0035280) |
| 0.0 | 0.3 | GO:1990118 | sodium ion import across plasma membrane(GO:0098719) sodium ion import into cell(GO:1990118) |
| 0.0 | 0.1 | GO:1902732 | positive regulation of chondrocyte proliferation(GO:1902732) |
| 0.0 | 0.0 | GO:1900222 | negative regulation of beta-amyloid clearance(GO:1900222) |
| 0.0 | 0.1 | GO:0034650 | cortisol metabolic process(GO:0034650) cortisol biosynthetic process(GO:0034651) |
| 0.0 | 0.1 | GO:0006499 | N-terminal protein myristoylation(GO:0006499) |
| 0.0 | 0.0 | GO:0042695 | thelarche(GO:0042695) mammary gland branching involved in thelarche(GO:0060744) |
| 0.0 | 0.2 | GO:0090435 | protein localization to nuclear envelope(GO:0090435) |
| 0.0 | 0.1 | GO:0072429 | response to intra-S DNA damage checkpoint signaling(GO:0072429) |
| 0.0 | 0.2 | GO:0048368 | lateral mesoderm development(GO:0048368) |
| 0.0 | 0.0 | GO:0072194 | kidney smooth muscle tissue development(GO:0072194) |
| 0.0 | 0.1 | GO:2000628 | regulation of miRNA metabolic process(GO:2000628) |
| 0.0 | 0.4 | GO:0045086 | positive regulation of interleukin-2 biosynthetic process(GO:0045086) |
| 0.0 | 0.1 | GO:0021910 | smoothened signaling pathway involved in ventral spinal cord patterning(GO:0021910) |
| 0.0 | 0.4 | GO:0071420 | cellular response to histamine(GO:0071420) |
| 0.0 | 0.1 | GO:0060666 | dichotomous subdivision of terminal units involved in salivary gland branching(GO:0060666) |
| 0.0 | 0.1 | GO:0018076 | N-terminal peptidyl-lysine acetylation(GO:0018076) |
| 0.0 | 0.1 | GO:0006574 | valine catabolic process(GO:0006574) |
| 0.0 | 0.1 | GO:1904426 | positive regulation of GTP binding(GO:1904426) |
| 0.0 | 0.2 | GO:0000301 | retrograde transport, vesicle recycling within Golgi(GO:0000301) |
| 0.0 | 0.3 | GO:0036005 | response to macrophage colony-stimulating factor(GO:0036005) cellular response to macrophage colony-stimulating factor stimulus(GO:0036006) |
| 0.0 | 0.1 | GO:0007221 | positive regulation of transcription of Notch receptor target(GO:0007221) |
| 0.0 | 0.2 | GO:0048207 | vesicle targeting, rough ER to cis-Golgi(GO:0048207) COPII vesicle coating(GO:0048208) |
| 0.0 | 0.1 | GO:0060392 | negative regulation of SMAD protein import into nucleus(GO:0060392) |
| 0.0 | 0.3 | GO:0036444 | calcium ion transmembrane import into mitochondrion(GO:0036444) |
| 0.0 | 0.4 | GO:1903830 | magnesium ion transmembrane transport(GO:1903830) |
| 0.0 | 0.1 | GO:0010360 | negative regulation of anion channel activity(GO:0010360) |
| 0.0 | 0.1 | GO:0006438 | valyl-tRNA aminoacylation(GO:0006438) |
| 0.0 | 0.1 | GO:0051534 | negative regulation of NFAT protein import into nucleus(GO:0051534) |
| 0.0 | 0.1 | GO:1900224 | zygotic specification of dorsal/ventral axis(GO:0007352) positive regulation of nodal signaling pathway involved in determination of lateral mesoderm left/right asymmetry(GO:1900224) |
| 0.0 | 0.2 | GO:0010890 | positive regulation of sequestering of triglyceride(GO:0010890) |
| 0.0 | 0.1 | GO:0070120 | ciliary neurotrophic factor-mediated signaling pathway(GO:0070120) |
| 0.0 | 0.3 | GO:0046548 | retinal rod cell development(GO:0046548) |
| 0.0 | 0.1 | GO:0042998 | positive regulation of Golgi to plasma membrane protein transport(GO:0042998) |
| 0.0 | 0.1 | GO:0060762 | regulation of branching involved in mammary gland duct morphogenesis(GO:0060762) |
| 0.0 | 0.1 | GO:0044339 | canonical Wnt signaling pathway involved in osteoblast differentiation(GO:0044339) |
| 0.0 | 0.1 | GO:1902414 | protein localization to cell junction(GO:1902414) |
| 0.0 | 0.1 | GO:0030910 | olfactory placode formation(GO:0030910) olfactory placode development(GO:0071698) olfactory placode morphogenesis(GO:0071699) |
| 0.0 | 0.1 | GO:0006436 | tryptophanyl-tRNA aminoacylation(GO:0006436) |
| 0.0 | 0.0 | GO:0007066 | female meiosis sister chromatid cohesion(GO:0007066) |
| 0.0 | 0.1 | GO:1903774 | positive regulation of viral budding via host ESCRT complex(GO:1903774) |
| 0.0 | 0.1 | GO:0010796 | regulation of multivesicular body size(GO:0010796) |
| 0.0 | 0.7 | GO:0032012 | regulation of ARF protein signal transduction(GO:0032012) |
| 0.0 | 0.1 | GO:0006522 | alanine metabolic process(GO:0006522) pyruvate family amino acid metabolic process(GO:0009078) L-alanine metabolic process(GO:0042851) |
| 0.0 | 0.2 | GO:0099526 | presynaptic signal transduction(GO:0098928) presynapse to nucleus signaling pathway(GO:0099526) |
| 0.0 | 0.1 | GO:0016240 | autophagosome docking(GO:0016240) |
| 0.0 | 0.1 | GO:0048687 | positive regulation of sprouting of injured axon(GO:0048687) positive regulation of axon extension involved in regeneration(GO:0048691) |
| 0.0 | 0.1 | GO:0034729 | histone H3-K79 methylation(GO:0034729) |
| 0.0 | 0.0 | GO:0089718 | amino acid import across plasma membrane(GO:0089718) |
| 0.0 | 0.2 | GO:0035947 | regulation of gluconeogenesis by regulation of transcription from RNA polymerase II promoter(GO:0035947) |
| 0.0 | 0.1 | GO:0006421 | asparaginyl-tRNA aminoacylation(GO:0006421) |
| 0.0 | 0.4 | GO:0032486 | Rap protein signal transduction(GO:0032486) |
| 0.0 | 0.1 | GO:0060019 | radial glial cell differentiation(GO:0060019) |
| 0.0 | 0.4 | GO:0048312 | intracellular distribution of mitochondria(GO:0048312) |
| 0.0 | 0.0 | GO:0035986 | senescence-associated heterochromatin focus assembly(GO:0035986) |
| 0.0 | 0.1 | GO:0010982 | regulation of high-density lipoprotein particle clearance(GO:0010982) |
| 0.0 | 0.1 | GO:0032053 | ciliary basal body organization(GO:0032053) positive regulation of protein localization to cilium(GO:1903566) |
| 0.0 | 0.3 | GO:0033234 | negative regulation of protein sumoylation(GO:0033234) |
| 0.0 | 0.1 | GO:1904742 | regulation of telomeric DNA binding(GO:1904742) |
| 0.0 | 0.2 | GO:0034162 | toll-like receptor 9 signaling pathway(GO:0034162) |
| 0.0 | 0.1 | GO:1900169 | regulation of glucocorticoid mediated signaling pathway(GO:1900169) |
| 0.0 | 0.1 | GO:0032905 | transforming growth factor beta1 production(GO:0032905) regulation of transforming growth factor beta1 production(GO:0032908) positive regulation of transforming growth factor beta1 production(GO:0032914) |
| 0.0 | 0.1 | GO:0098749 | cerebellar neuron development(GO:0098749) |
| 0.0 | 0.3 | GO:0033962 | cytoplasmic mRNA processing body assembly(GO:0033962) |
| 0.0 | 0.0 | GO:0061183 | dermatome development(GO:0061054) regulation of dermatome development(GO:0061183) |
| 0.0 | 0.1 | GO:0018992 | germ-line sex determination(GO:0018992) |
| 0.0 | 0.3 | GO:0006607 | NLS-bearing protein import into nucleus(GO:0006607) |
| 0.0 | 0.2 | GO:0042940 | D-amino acid transport(GO:0042940) |
| 0.0 | 0.4 | GO:2000311 | regulation of alpha-amino-3-hydroxy-5-methyl-4-isoxazole propionate selective glutamate receptor activity(GO:2000311) |
| 0.0 | 0.1 | GO:0036500 | ATF6-mediated unfolded protein response(GO:0036500) |
| 0.0 | 0.1 | GO:0014029 | neural crest formation(GO:0014029) |
| 0.0 | 0.1 | GO:0038158 | granulocyte colony-stimulating factor signaling pathway(GO:0038158) |
| 0.0 | 0.1 | GO:0021932 | hindbrain radial glia guided cell migration(GO:0021932) |
| 0.0 | 0.2 | GO:1901503 | ether lipid biosynthetic process(GO:0008611) glycerol ether biosynthetic process(GO:0046504) ether biosynthetic process(GO:1901503) |
| 0.0 | 0.2 | GO:0003177 | pulmonary valve development(GO:0003177) pulmonary valve morphogenesis(GO:0003184) |
| 0.0 | 0.1 | GO:0036066 | protein O-linked fucosylation(GO:0036066) |
| 0.0 | 0.1 | GO:0046909 | intermembrane transport(GO:0046909) protein transport from ciliary membrane to plasma membrane(GO:1903445) |
| 0.0 | 0.2 | GO:0046602 | regulation of mitotic centrosome separation(GO:0046602) |
| 0.0 | 0.1 | GO:0009597 | detection of virus(GO:0009597) |
| 0.0 | 0.1 | GO:0071691 | cardiac muscle thin filament assembly(GO:0071691) |
| 0.0 | 0.1 | GO:0034224 | cellular response to zinc ion starvation(GO:0034224) |
| 0.0 | 0.1 | GO:1904000 | positive regulation of eating behavior(GO:1904000) |
| 0.0 | 0.1 | GO:0038203 | TORC2 signaling(GO:0038203) |
| 0.0 | 0.3 | GO:0080182 | histone H3-K4 trimethylation(GO:0080182) |
| 0.0 | 0.1 | GO:0045163 | clustering of voltage-gated potassium channels(GO:0045163) |
| 0.0 | 0.3 | GO:0007171 | activation of transmembrane receptor protein tyrosine kinase activity(GO:0007171) |
| 0.0 | 0.1 | GO:0019254 | carnitine metabolic process, CoA-linked(GO:0019254) |
| 0.0 | 0.1 | GO:0070127 | tRNA aminoacylation for mitochondrial protein translation(GO:0070127) |
| 0.0 | 0.1 | GO:1904354 | negative regulation of telomere capping(GO:1904354) |
| 0.0 | 0.2 | GO:2000400 | positive regulation of T cell differentiation in thymus(GO:0033089) positive regulation of thymocyte aggregation(GO:2000400) |
| 0.0 | 0.1 | GO:0019371 | cyclooxygenase pathway(GO:0019371) |
| 0.0 | 0.0 | GO:0060331 | negative regulation of response to interferon-gamma(GO:0060331) negative regulation of interferon-gamma-mediated signaling pathway(GO:0060336) |
| 0.0 | 0.1 | GO:0033572 | transferrin transport(GO:0033572) |
| 0.0 | 0.3 | GO:0000083 | regulation of transcription involved in G1/S transition of mitotic cell cycle(GO:0000083) |
| 0.0 | 0.1 | GO:1901073 | N-acetylglucosamine biosynthetic process(GO:0006045) N-acetylneuraminate biosynthetic process(GO:0046380) glucosamine-containing compound biosynthetic process(GO:1901073) |
| 0.0 | 0.1 | GO:0090394 | negative regulation of excitatory postsynaptic potential(GO:0090394) |
| 0.0 | 0.4 | GO:0031581 | hemidesmosome assembly(GO:0031581) |
| 0.0 | 0.1 | GO:0070560 | protein secretion by platelet(GO:0070560) |
| 0.0 | 0.1 | GO:0072344 | rescue of stalled ribosome(GO:0072344) |
| 0.0 | 0.0 | GO:0032097 | positive regulation of response to food(GO:0032097) positive regulation of appetite(GO:0032100) |
| 0.0 | 0.1 | GO:0019323 | pentose catabolic process(GO:0019323) |
| 0.0 | 0.1 | GO:0010730 | negative regulation of hydrogen peroxide biosynthetic process(GO:0010730) |
| 0.0 | 0.1 | GO:0048549 | positive regulation of pinocytosis(GO:0048549) |
| 0.0 | 0.2 | GO:0010666 | positive regulation of muscle cell apoptotic process(GO:0010661) positive regulation of striated muscle cell apoptotic process(GO:0010663) positive regulation of cardiac muscle cell apoptotic process(GO:0010666) |
| 0.0 | 0.0 | GO:0048003 | antigen processing and presentation of lipid antigen via MHC class Ib(GO:0048003) antigen processing and presentation, exogenous lipid antigen via MHC class Ib(GO:0048007) |
| 0.0 | 0.0 | GO:0045054 | constitutive secretory pathway(GO:0045054) |
| 0.0 | 0.5 | GO:0007064 | mitotic sister chromatid cohesion(GO:0007064) |
| 0.0 | 0.0 | GO:2000721 | positive regulation of transcription from RNA polymerase II promoter involved in smooth muscle cell differentiation(GO:2000721) |
| 0.0 | 0.0 | GO:0015827 | tryptophan transport(GO:0015827) |
| 0.0 | 0.1 | GO:0031937 | positive regulation of chromatin silencing(GO:0031937) |
| 0.0 | 0.2 | GO:0034393 | positive regulation of smooth muscle cell apoptotic process(GO:0034393) |
| 0.0 | 0.0 | GO:0002296 | T-helper 1 cell lineage commitment(GO:0002296) |
| 0.0 | 0.1 | GO:0030210 | heparin biosynthetic process(GO:0030210) |
| 0.0 | 0.1 | GO:0060014 | granulosa cell differentiation(GO:0060014) |
| 0.0 | 0.2 | GO:0042659 | regulation of cell fate specification(GO:0042659) |
| 0.0 | 0.1 | GO:0090073 | positive regulation of protein homodimerization activity(GO:0090073) |
| 0.0 | 0.0 | GO:0001828 | inner cell mass cellular morphogenesis(GO:0001828) |
| 0.0 | 0.2 | GO:0051574 | positive regulation of histone H3-K9 methylation(GO:0051574) |
| 0.0 | 0.0 | GO:1901656 | glycoside transport(GO:1901656) |
| 0.0 | 0.0 | GO:0050904 | diapedesis(GO:0050904) |
| 0.0 | 0.4 | GO:0060236 | regulation of mitotic spindle organization(GO:0060236) |
| 0.0 | 0.1 | GO:0038001 | paracrine signaling(GO:0038001) |
| 0.0 | 0.0 | GO:2001013 | epithelial cell proliferation involved in renal tubule morphogenesis(GO:2001013) |
| 0.0 | 0.0 | GO:0008354 | germ cell migration(GO:0008354) |
| 0.0 | 0.1 | GO:0071934 | thiamine transmembrane transport(GO:0071934) |
| 0.0 | 0.2 | GO:0046600 | negative regulation of centriole replication(GO:0046600) |
| 0.0 | 0.1 | GO:0061343 | cell adhesion involved in heart morphogenesis(GO:0061343) |
| 0.0 | 0.1 | GO:0033575 | protein glycosylation at cell surface(GO:0033575) protein galactosylation at cell surface(GO:0033580) protein galactosylation(GO:0042125) |
| 0.0 | 0.2 | GO:0035721 | intraciliary retrograde transport(GO:0035721) |
| 0.0 | 0.1 | GO:0039689 | negative stranded viral RNA replication(GO:0039689) multi-organism biosynthetic process(GO:0044034) |
| 0.0 | 0.3 | GO:0001829 | trophectodermal cell differentiation(GO:0001829) |
| 0.0 | 0.2 | GO:0071578 | zinc II ion transmembrane import(GO:0071578) |
| 0.0 | 0.2 | GO:0021800 | cerebral cortex tangential migration(GO:0021800) |
| 0.0 | 0.2 | GO:1901223 | negative regulation of NIK/NF-kappaB signaling(GO:1901223) |
| 0.0 | 0.1 | GO:0002326 | B cell lineage commitment(GO:0002326) |
| 0.0 | 0.5 | GO:0043984 | histone H4-K16 acetylation(GO:0043984) |
| 0.0 | 0.1 | GO:1905232 | cellular response to L-glutamate(GO:1905232) |
| 0.0 | 0.1 | GO:0001757 | somite specification(GO:0001757) |
| 0.0 | 0.0 | GO:0060697 | positive regulation of phospholipid catabolic process(GO:0060697) |
| 0.0 | 0.1 | GO:0099590 | neurotransmitter receptor internalization(GO:0099590) |
| 0.0 | 0.1 | GO:0001880 | Mullerian duct regression(GO:0001880) |
| 0.0 | 0.1 | GO:0008626 | granzyme-mediated apoptotic signaling pathway(GO:0008626) |
| 0.0 | 0.2 | GO:1904754 | positive regulation of vascular associated smooth muscle cell migration(GO:1904754) |
| 0.0 | 0.0 | GO:0072126 | positive regulation of glomerular mesangial cell proliferation(GO:0072126) |
| 0.0 | 0.1 | GO:0060800 | regulation of cell differentiation involved in embryonic placenta development(GO:0060800) |
| 0.0 | 0.1 | GO:0046967 | cytosol to ER transport(GO:0046967) peptide antigen transport(GO:0046968) |
| 0.0 | 0.1 | GO:0006272 | leading strand elongation(GO:0006272) |
| 0.0 | 0.1 | GO:1902715 | positive regulation of interferon-gamma secretion(GO:1902715) |
| 0.0 | 0.1 | GO:1902525 | regulation of protein monoubiquitination(GO:1902525) |
| 0.0 | 0.1 | GO:0001983 | baroreceptor response to increased systemic arterial blood pressure(GO:0001983) |
| 0.0 | 0.1 | GO:0006409 | tRNA export from nucleus(GO:0006409) tRNA-containing ribonucleoprotein complex export from nucleus(GO:0071431) |
| 0.0 | 0.2 | GO:0080009 | mRNA methylation(GO:0080009) |
| 0.0 | 0.2 | GO:0051639 | actin filament network formation(GO:0051639) |
| 0.0 | 0.2 | GO:0060965 | negative regulation of gene silencing by miRNA(GO:0060965) |
| 0.0 | 0.1 | GO:0000012 | single strand break repair(GO:0000012) |
| 0.0 | 0.1 | GO:0006011 | UDP-glucose metabolic process(GO:0006011) |
| 0.0 | 0.1 | GO:1990416 | cellular response to brain-derived neurotrophic factor stimulus(GO:1990416) |
| 0.0 | 0.0 | GO:0035441 | cell migration involved in vasculogenesis(GO:0035441) |
| 0.0 | 0.1 | GO:0038172 | interleukin-33-mediated signaling pathway(GO:0038172) |
| 0.0 | 0.1 | GO:0001711 | endodermal cell fate commitment(GO:0001711) |
| 0.0 | 0.1 | GO:0010989 | negative regulation of low-density lipoprotein particle clearance(GO:0010989) |
| 0.0 | 0.1 | GO:1902083 | negative regulation of peptidyl-cysteine S-nitrosylation(GO:1902083) |
| 0.0 | 0.1 | GO:2000253 | positive regulation of feeding behavior(GO:2000253) |
| 0.0 | 0.1 | GO:0006297 | nucleotide-excision repair, DNA gap filling(GO:0006297) |
| 0.0 | 0.1 | GO:0090403 | oxidative stress-induced premature senescence(GO:0090403) |
| 0.0 | 0.1 | GO:0031053 | primary miRNA processing(GO:0031053) |
| 0.0 | 0.0 | GO:0007525 | somatic muscle development(GO:0007525) |
| 0.0 | 0.1 | GO:0030579 | ubiquitin-dependent SMAD protein catabolic process(GO:0030579) |
| 0.0 | 0.1 | GO:0006741 | NADP biosynthetic process(GO:0006741) |
| 0.0 | 0.1 | GO:0033564 | anterior/posterior axon guidance(GO:0033564) |
| 0.0 | 0.2 | GO:0097120 | receptor localization to synapse(GO:0097120) |
| 0.0 | 0.1 | GO:0002002 | regulation of angiotensin levels in blood(GO:0002002) |
| 0.0 | 0.0 | GO:0098828 | modulation of inhibitory postsynaptic potential(GO:0098828) |
| 0.0 | 0.0 | GO:0098917 | retrograde trans-synaptic signaling(GO:0098917) retrograde trans-synaptic signaling by soluble gas(GO:0098923) trans-synaptic signaling by soluble gas(GO:0099543) |
| 0.0 | 0.1 | GO:1903999 | negative regulation of eating behavior(GO:1903999) |
| 0.0 | 0.0 | GO:0043988 | histone H3-S28 phosphorylation(GO:0043988) |
| 0.0 | 0.1 | GO:0035627 | ceramide transport(GO:0035627) |
| 0.0 | 0.1 | GO:0014842 | regulation of skeletal muscle satellite cell proliferation(GO:0014842) |
| 0.0 | 0.2 | GO:0043568 | positive regulation of insulin-like growth factor receptor signaling pathway(GO:0043568) |
| 0.0 | 0.0 | GO:1901896 | positive regulation of calcium-transporting ATPase activity(GO:1901896) |
| 0.0 | 0.4 | GO:0048169 | regulation of long-term neuronal synaptic plasticity(GO:0048169) |
| 0.0 | 0.1 | GO:0036334 | epidermal stem cell homeostasis(GO:0036334) |
| 0.0 | 0.1 | GO:0034334 | adherens junction maintenance(GO:0034334) |
| 0.0 | 0.1 | GO:0061484 | hematopoietic stem cell homeostasis(GO:0061484) |
| 0.0 | 0.0 | GO:0006014 | D-ribose metabolic process(GO:0006014) |
| 0.0 | 0.1 | GO:0035973 | aggrephagy(GO:0035973) |
| 0.0 | 0.0 | GO:0003431 | growth plate cartilage chondrocyte development(GO:0003431) |
| 0.0 | 0.1 | GO:0045196 | establishment or maintenance of neuroblast polarity(GO:0045196) establishment of neuroblast polarity(GO:0045200) |
| 0.0 | 0.1 | GO:0038128 | ERBB2 signaling pathway(GO:0038128) |
| 0.0 | 0.0 | GO:0016188 | synaptic vesicle maturation(GO:0016188) |
| 0.0 | 0.1 | GO:0043504 | mitochondrial DNA repair(GO:0043504) |
| 0.0 | 0.1 | GO:0090315 | negative regulation of protein targeting to membrane(GO:0090315) |
| 0.0 | 0.0 | GO:2000158 | positive regulation of protein deubiquitination(GO:1903003) positive regulation of ubiquitin-specific protease activity(GO:2000158) |
| 0.0 | 0.1 | GO:0036072 | intramembranous ossification(GO:0001957) direct ossification(GO:0036072) |
| 0.0 | 0.3 | GO:0051457 | maintenance of protein location in nucleus(GO:0051457) |
| 0.0 | 0.2 | GO:0051292 | nuclear pore complex assembly(GO:0051292) |
| 0.0 | 0.1 | GO:0032264 | IMP salvage(GO:0032264) |
| 0.0 | 0.5 | GO:0045022 | early endosome to late endosome transport(GO:0045022) |
| 0.0 | 0.1 | GO:0010961 | cellular magnesium ion homeostasis(GO:0010961) |
| 0.0 | 0.1 | GO:0007084 | mitotic nuclear envelope reassembly(GO:0007084) |
| 0.0 | 0.1 | GO:0043951 | negative regulation of cAMP-mediated signaling(GO:0043951) |
| 0.0 | 0.1 | GO:0030070 | insulin processing(GO:0030070) |
| 0.0 | 0.1 | GO:1900273 | positive regulation of long-term synaptic potentiation(GO:1900273) |
| 0.0 | 0.1 | GO:0006556 | S-adenosylmethionine biosynthetic process(GO:0006556) |
| 0.0 | 0.0 | GO:1901534 | positive regulation of hematopoietic progenitor cell differentiation(GO:1901534) |
| 0.0 | 0.1 | GO:0043584 | nose development(GO:0043584) |
| 0.0 | 0.0 | GO:0045869 | negative regulation of single stranded viral RNA replication via double stranded DNA intermediate(GO:0045869) |
| 0.0 | 0.3 | GO:0006491 | N-glycan processing(GO:0006491) |
| 0.0 | 0.1 | GO:0001180 | transcription initiation from RNA polymerase I promoter for nuclear large rRNA transcript(GO:0001180) |
| 0.0 | 0.1 | GO:2000427 | positive regulation of apoptotic cell clearance(GO:2000427) |
| 0.0 | 0.2 | GO:0006895 | Golgi to endosome transport(GO:0006895) |
| 0.0 | 0.5 | GO:0046834 | lipid phosphorylation(GO:0046834) |
| 0.0 | 0.0 | GO:0006267 | pre-replicative complex assembly involved in nuclear cell cycle DNA replication(GO:0006267) pre-replicative complex assembly(GO:0036388) pre-replicative complex assembly involved in cell cycle DNA replication(GO:1902299) |
| 0.0 | 0.3 | GO:0006415 | translational termination(GO:0006415) |
| 0.0 | 0.1 | GO:1902774 | late endosome to lysosome transport(GO:1902774) |
| 0.0 | 0.1 | GO:0070544 | histone H3-K36 demethylation(GO:0070544) |
| 0.0 | 0.1 | GO:0016576 | histone dephosphorylation(GO:0016576) |
| 0.0 | 0.1 | GO:0002035 | brain renin-angiotensin system(GO:0002035) |
| 0.0 | 0.0 | GO:0060939 | cardiac fibroblast cell differentiation(GO:0060935) cardiac fibroblast cell development(GO:0060936) epicardium-derived cardiac fibroblast cell differentiation(GO:0060938) epicardium-derived cardiac fibroblast cell development(GO:0060939) |
| 0.0 | 0.2 | GO:0009226 | nucleotide-sugar biosynthetic process(GO:0009226) |
| 0.0 | 0.1 | GO:0048172 | regulation of short-term neuronal synaptic plasticity(GO:0048172) |
| 0.0 | 0.0 | GO:0032439 | endosome localization(GO:0032439) |
| 0.0 | 0.1 | GO:0003374 | dynamin polymerization involved in membrane fission(GO:0003373) dynamin polymerization involved in mitochondrial fission(GO:0003374) |
| 0.0 | 0.0 | GO:1902659 | regulation of glucose mediated signaling pathway(GO:1902659) |
| 0.0 | 0.1 | GO:0016584 | nucleosome positioning(GO:0016584) |
| 0.0 | 0.1 | GO:0090274 | positive regulation of somatostatin secretion(GO:0090274) |
| 0.0 | 0.3 | GO:0007257 | activation of JUN kinase activity(GO:0007257) |
| 0.0 | 0.1 | GO:0035562 | negative regulation of chromatin binding(GO:0035562) |
| 0.0 | 0.0 | GO:0070681 | glutaminyl-tRNAGln biosynthesis via transamidation(GO:0070681) |
| 0.0 | 0.0 | GO:0097070 | ductus arteriosus closure(GO:0097070) |
| 0.0 | 0.2 | GO:0032534 | regulation of microvillus assembly(GO:0032534) |
| 0.0 | 0.0 | GO:0032430 | positive regulation of phospholipase A2 activity(GO:0032430) |
| 0.0 | 0.1 | GO:0090267 | positive regulation of spindle checkpoint(GO:0090232) positive regulation of mitotic cell cycle spindle assembly checkpoint(GO:0090267) |
| 0.0 | 0.0 | GO:0035426 | extracellular matrix-cell signaling(GO:0035426) |
| 0.0 | 0.0 | GO:0090148 | membrane fission(GO:0090148) |
| 0.0 | 0.0 | GO:2000667 | positive regulation of interleukin-5 secretion(GO:2000664) positive regulation of interleukin-13 secretion(GO:2000667) |
| 0.0 | 0.1 | GO:0090367 | negative regulation of mRNA modification(GO:0090367) |
| 0.0 | 0.0 | GO:1904017 | cellular response to Thyroglobulin triiodothyronine(GO:1904017) |
| 0.0 | 0.1 | GO:0097211 | response to gonadotropin-releasing hormone(GO:0097210) cellular response to gonadotropin-releasing hormone(GO:0097211) |
| 0.0 | 0.0 | GO:0043415 | positive regulation of skeletal muscle tissue regeneration(GO:0043415) |
| 0.0 | 0.1 | GO:0061370 | testosterone biosynthetic process(GO:0061370) |
| 0.0 | 0.2 | GO:0007512 | adult heart development(GO:0007512) |
| 0.0 | 0.0 | GO:0055064 | chloride ion homeostasis(GO:0055064) |
| 0.0 | 0.0 | GO:0036118 | hyaluranon cable assembly(GO:0036118) regulation of hyaluranon cable assembly(GO:1900104) positive regulation of hyaluranon cable assembly(GO:1900106) |
| 0.0 | 0.1 | GO:0033148 | positive regulation of intracellular estrogen receptor signaling pathway(GO:0033148) |
| 0.0 | 0.2 | GO:2000010 | positive regulation of protein localization to cell surface(GO:2000010) |
| 0.0 | 0.2 | GO:0046886 | positive regulation of hormone biosynthetic process(GO:0046886) |
| 0.0 | 0.1 | GO:0018026 | peptidyl-lysine monomethylation(GO:0018026) |
| 0.0 | 0.1 | GO:0060707 | trophoblast giant cell differentiation(GO:0060707) |
| 0.0 | 0.1 | GO:0021957 | corticospinal tract morphogenesis(GO:0021957) |
| 0.0 | 0.1 | GO:1904058 | positive regulation of sensory perception of pain(GO:1904058) |
| 0.0 | 0.1 | GO:2000973 | regulation of pro-B cell differentiation(GO:2000973) |
| 0.0 | 0.1 | GO:0000722 | telomere maintenance via recombination(GO:0000722) |
| 0.0 | 0.0 | GO:0098939 | dendritic transport of mitochondrion(GO:0098939) anterograde dendritic transport of mitochondrion(GO:0098972) |
| 0.0 | 0.2 | GO:0070072 | vacuolar proton-transporting V-type ATPase complex assembly(GO:0070072) |
| 0.0 | 0.1 | GO:0016266 | O-glycan processing(GO:0016266) |
| 0.0 | 0.0 | GO:0038030 | non-canonical Wnt signaling pathway via MAPK cascade(GO:0038030) non-canonical Wnt signaling pathway via JNK cascade(GO:0038031) |
| 0.0 | 0.1 | GO:0045351 | type I interferon biosynthetic process(GO:0045351) |
| 0.0 | 0.0 | GO:2000051 | negative regulation of non-canonical Wnt signaling pathway(GO:2000051) |
| 0.0 | 0.1 | GO:2000052 | positive regulation of non-canonical Wnt signaling pathway(GO:2000052) |
| 0.0 | 0.1 | GO:0048664 | neuron fate determination(GO:0048664) |
| 0.0 | 0.1 | GO:0006177 | GMP biosynthetic process(GO:0006177) |
| 0.0 | 0.6 | GO:0043966 | histone H3 acetylation(GO:0043966) |
| 0.0 | 0.1 | GO:0060074 | synapse maturation(GO:0060074) |
| 0.0 | 0.1 | GO:0032494 | response to peptidoglycan(GO:0032494) |
| 0.0 | 0.1 | GO:1901994 | negative regulation of meiotic cell cycle phase transition(GO:1901994) |
| 0.0 | 0.1 | GO:0070272 | proton-transporting ATP synthase complex assembly(GO:0043461) proton-transporting ATP synthase complex biogenesis(GO:0070272) |
| 0.0 | 0.0 | GO:0031547 | brain-derived neurotrophic factor receptor signaling pathway(GO:0031547) |
| 0.0 | 0.1 | GO:0035524 | proline transmembrane transport(GO:0035524) |
| 0.0 | 0.1 | GO:0006428 | isoleucyl-tRNA aminoacylation(GO:0006428) |
| 0.0 | 0.1 | GO:1904491 | protein localization to ciliary transition zone(GO:1904491) |
| 0.0 | 0.2 | GO:0099514 | anterograde synaptic vesicle transport(GO:0048490) synaptic vesicle cytoskeletal transport(GO:0099514) synaptic vesicle transport along microtubule(GO:0099517) |
| 0.0 | 0.0 | GO:0060449 | bud elongation involved in lung branching(GO:0060449) |
| 0.0 | 0.2 | GO:0050908 | detection of light stimulus involved in visual perception(GO:0050908) detection of light stimulus involved in sensory perception(GO:0050962) |
| 0.0 | 0.2 | GO:0090161 | Golgi ribbon formation(GO:0090161) |
| 0.0 | 0.1 | GO:0003406 | retinal pigment epithelium development(GO:0003406) |
| 0.0 | 0.1 | GO:0097150 | neuronal stem cell population maintenance(GO:0097150) |
| 0.0 | 0.0 | GO:0031427 | response to methotrexate(GO:0031427) |
| 0.0 | 0.2 | GO:0007413 | axonal fasciculation(GO:0007413) |
| 0.0 | 0.0 | GO:0060903 | positive regulation of meiosis I(GO:0060903) |
| 0.0 | 0.1 | GO:0070327 | thyroid hormone transport(GO:0070327) |
| 0.0 | 0.0 | GO:0015015 | heparan sulfate proteoglycan biosynthetic process, enzymatic modification(GO:0015015) |
| 0.0 | 0.1 | GO:1900246 | positive regulation of RIG-I signaling pathway(GO:1900246) |
| 0.0 | 0.0 | GO:0032484 | Ral protein signal transduction(GO:0032484) |
| 0.0 | 0.0 | GO:1903911 | positive regulation of receptor clustering(GO:1903911) positive regulation of neuromuscular junction development(GO:1904398) |
| 0.0 | 0.1 | GO:0010820 | positive regulation of T cell chemotaxis(GO:0010820) |
| 0.0 | 0.0 | GO:0071283 | cellular response to iron(III) ion(GO:0071283) |
| 0.0 | 0.0 | GO:0016078 | tRNA catabolic process(GO:0016078) |
| 0.0 | 0.1 | GO:0010760 | negative regulation of macrophage chemotaxis(GO:0010760) |
| 0.0 | 0.0 | GO:0060526 | prostate glandular acinus morphogenesis(GO:0060526) prostate epithelial cord arborization involved in prostate glandular acinus morphogenesis(GO:0060527) |
| 0.0 | 0.1 | GO:0006528 | asparagine metabolic process(GO:0006528) |
| 0.0 | 0.0 | GO:0015014 | heparan sulfate proteoglycan biosynthetic process, polysaccharide chain biosynthetic process(GO:0015014) |
| 0.0 | 0.1 | GO:0042118 | endothelial cell activation(GO:0042118) |
| 0.0 | 0.1 | GO:1903012 | positive regulation of bone development(GO:1903012) |
| 0.0 | 0.1 | GO:0035414 | negative regulation of catenin import into nucleus(GO:0035414) |
| 0.0 | 0.0 | GO:0002032 | vasodilation by norepinephrine-epinephrine involved in regulation of systemic arterial blood pressure(GO:0002025) desensitization of G-protein coupled receptor protein signaling pathway by arrestin(GO:0002032) |
| 0.0 | 0.1 | GO:0051684 | maintenance of Golgi location(GO:0051684) |
| 0.0 | 0.1 | GO:0098908 | regulation of neuronal action potential(GO:0098908) |
| 0.0 | 0.1 | GO:0002803 | positive regulation of antimicrobial peptide production(GO:0002225) positive regulation of antibacterial peptide production(GO:0002803) |
| 0.0 | 0.0 | GO:2001181 | positive regulation of interleukin-10 secretion(GO:2001181) |
| 0.0 | 0.0 | GO:0042339 | keratan sulfate metabolic process(GO:0042339) |
| 0.0 | 0.1 | GO:0060081 | membrane hyperpolarization(GO:0060081) |
| 0.0 | 0.1 | GO:0045056 | transcytosis(GO:0045056) |
| 0.0 | 0.0 | GO:2000211 | regulation of glutamate metabolic process(GO:2000211) |
| 0.0 | 0.0 | GO:0042699 | follicle-stimulating hormone signaling pathway(GO:0042699) |
| 0.0 | 0.1 | GO:0071787 | endoplasmic reticulum tubular network assembly(GO:0071787) |
| 0.0 | 0.0 | GO:0002148 | hypochlorous acid metabolic process(GO:0002148) hypochlorous acid biosynthetic process(GO:0002149) |
| 0.0 | 0.1 | GO:0015886 | heme transport(GO:0015886) |
| 0.0 | 0.0 | GO:0010694 | positive regulation of alkaline phosphatase activity(GO:0010694) |
| 0.0 | 0.0 | GO:2001023 | regulation of response to drug(GO:2001023) |
| 0.0 | 0.0 | GO:0009838 | abscission(GO:0009838) |
| 0.0 | 0.0 | GO:1990573 | potassium ion import across plasma membrane(GO:1990573) |
| 0.0 | 0.0 | GO:1902510 | regulation of apoptotic DNA fragmentation(GO:1902510) |
| 0.0 | 0.1 | GO:2000676 | positive regulation of type B pancreatic cell apoptotic process(GO:2000676) |
| 0.0 | 0.0 | GO:0044376 | RNA polymerase II complex import to nucleus(GO:0044376) RNA polymerase III complex localization to nucleus(GO:1990022) |
| 0.0 | 0.1 | GO:0046599 | regulation of centriole replication(GO:0046599) |
| 0.0 | 0.0 | GO:0006680 | glucosylceramide catabolic process(GO:0006680) |
| 0.0 | 0.0 | GO:0070172 | positive regulation of tooth mineralization(GO:0070172) |
| 0.0 | 0.0 | GO:2000002 | negative regulation of cell cycle checkpoint(GO:1901977) negative regulation of DNA damage checkpoint(GO:2000002) |
| 0.0 | 0.0 | GO:1904428 | negative regulation of tubulin deacetylation(GO:1904428) |
| 0.0 | 0.1 | GO:0010824 | regulation of centrosome duplication(GO:0010824) |
| 0.0 | 0.4 | GO:0018345 | protein palmitoylation(GO:0018345) |
| 0.0 | 0.1 | GO:0042420 | dopamine catabolic process(GO:0042420) |
| 0.0 | 0.2 | GO:0031935 | regulation of chromatin silencing(GO:0031935) |
| 0.0 | 0.1 | GO:0043508 | negative regulation of JUN kinase activity(GO:0043508) |
| 0.0 | 0.1 | GO:1901096 | regulation of autophagosome maturation(GO:1901096) |
| 0.0 | 0.0 | GO:0071918 | urea transmembrane transport(GO:0071918) |
| 0.0 | 0.1 | GO:0051024 | positive regulation of immunoglobulin secretion(GO:0051024) |
| 0.0 | 0.1 | GO:0048096 | chromatin-mediated maintenance of transcription(GO:0048096) |
| 0.0 | 0.2 | GO:0034260 | negative regulation of GTPase activity(GO:0034260) |
| 0.0 | 0.1 | GO:0097338 | response to clozapine(GO:0097338) |
| 0.0 | 0.1 | GO:0008295 | spermidine biosynthetic process(GO:0008295) |
| 0.0 | 0.1 | GO:2000766 | negative regulation of cytoplasmic translation(GO:2000766) |
| 0.0 | 0.1 | GO:0071313 | cellular response to caffeine(GO:0071313) |
| 0.0 | 0.1 | GO:0033314 | mitotic DNA replication checkpoint(GO:0033314) |
| 0.0 | 0.0 | GO:1904749 | regulation of protein localization to nucleolus(GO:1904749) |
| 0.0 | 0.0 | GO:2000564 | regulation of CD8-positive, alpha-beta T cell proliferation(GO:2000564) |
| 0.0 | 0.0 | GO:0071393 | trabecular meshwork development(GO:0002930) cellular response to progesterone stimulus(GO:0071393) |
| 0.0 | 0.0 | GO:0042939 | glutathione transport(GO:0034635) tripeptide transport(GO:0042939) |
| 0.0 | 0.3 | GO:0016180 | snRNA processing(GO:0016180) |
| 0.0 | 0.0 | GO:0000738 | DNA catabolic process, exonucleolytic(GO:0000738) |
| 0.0 | 0.2 | GO:0032506 | cytokinetic process(GO:0032506) |
| 0.0 | 0.0 | GO:0042732 | D-xylose metabolic process(GO:0042732) |
| 0.0 | 0.1 | GO:0002024 | diet induced thermogenesis(GO:0002024) |
| 0.0 | 0.0 | GO:1903595 | positive regulation of histamine secretion by mast cell(GO:1903595) |
| 0.0 | 0.0 | GO:0003365 | establishment of cell polarity involved in ameboidal cell migration(GO:0003365) |
| 0.0 | 0.0 | GO:2000682 | positive regulation of rubidium ion transport(GO:2000682) positive regulation of rubidium ion transmembrane transporter activity(GO:2000688) |
| 0.0 | 0.1 | GO:1904424 | regulation of GTP binding(GO:1904424) |
| 0.0 | 0.0 | GO:0044336 | canonical Wnt signaling pathway involved in negative regulation of apoptotic process(GO:0044336) |
| 0.0 | 0.0 | GO:0097411 | hypoxia-inducible factor-1alpha signaling pathway(GO:0097411) |
| 0.0 | 0.1 | GO:0002943 | tRNA dihydrouridine synthesis(GO:0002943) |
| 0.0 | 0.1 | GO:0015074 | DNA integration(GO:0015074) |
| 0.0 | 0.1 | GO:0061086 | negative regulation of histone H3-K27 methylation(GO:0061086) |
| 0.0 | 0.0 | GO:1904938 | dopaminergic neuron axon guidance(GO:0036514) planar cell polarity pathway involved in axon guidance(GO:1904938) |
| 0.0 | 0.2 | GO:0006376 | mRNA splice site selection(GO:0006376) |
| 0.0 | 0.1 | GO:0008343 | adult feeding behavior(GO:0008343) |
| 0.0 | 0.2 | GO:0006198 | cAMP catabolic process(GO:0006198) |
| 0.0 | 0.0 | GO:0019626 | short-chain fatty acid catabolic process(GO:0019626) |
| 0.0 | 0.0 | GO:0019417 | sulfur oxidation(GO:0019417) |
| 0.0 | 0.3 | GO:0033120 | positive regulation of RNA splicing(GO:0033120) |
| 0.0 | 0.0 | GO:1990167 | protein K27-linked deubiquitination(GO:1990167) |
| 0.0 | 0.0 | GO:0060179 | male mating behavior(GO:0060179) |
| 0.0 | 0.1 | GO:0001573 | ganglioside metabolic process(GO:0001573) |
| 0.0 | 0.0 | GO:0034240 | negative regulation of macrophage fusion(GO:0034240) |
| 0.0 | 0.0 | GO:1904707 | positive regulation of vascular smooth muscle cell proliferation(GO:1904707) |
Gene overrepresentation in cellular component category:
| Log-likelihood per target | Total log-likelihood | Term | Description |
|---|---|---|---|
| 0.2 | 0.5 | GO:0005592 | collagen type XI trimer(GO:0005592) |
| 0.1 | 0.4 | GO:0071149 | TEAD-2-YAP complex(GO:0071149) |
| 0.1 | 0.4 | GO:0097444 | spine apparatus(GO:0097444) |
| 0.1 | 0.3 | GO:0002944 | cyclin K-CDK12 complex(GO:0002944) |
| 0.1 | 0.5 | GO:0030015 | CCR4-NOT core complex(GO:0030015) |
| 0.1 | 0.3 | GO:0044302 | dentate gyrus mossy fiber(GO:0044302) |
| 0.1 | 0.4 | GO:0070695 | FHF complex(GO:0070695) |
| 0.1 | 0.2 | GO:0048788 | cytoskeleton of presynaptic active zone(GO:0048788) |
| 0.1 | 1.4 | GO:0031235 | intrinsic component of the cytoplasmic side of the plasma membrane(GO:0031235) |
| 0.1 | 0.2 | GO:0044317 | rod spherule(GO:0044317) |
| 0.1 | 0.2 | GO:0061673 | mitotic spindle astral microtubule(GO:0061673) |
| 0.1 | 0.4 | GO:0097422 | tubular endosome(GO:0097422) |
| 0.1 | 0.3 | GO:0035363 | histone locus body(GO:0035363) |
| 0.1 | 0.8 | GO:1990454 | L-type voltage-gated calcium channel complex(GO:1990454) |
| 0.1 | 0.2 | GO:0034686 | integrin alphav-beta8 complex(GO:0034686) |
| 0.1 | 0.2 | GO:0033165 | interphotoreceptor matrix(GO:0033165) |
| 0.1 | 0.3 | GO:0097427 | microtubule bundle(GO:0097427) |
| 0.1 | 0.3 | GO:0005606 | laminin-1 complex(GO:0005606) |
| 0.1 | 0.2 | GO:0000839 | Hrd1p ubiquitin ligase ERAD-L complex(GO:0000839) |
| 0.1 | 0.3 | GO:0098831 | presynaptic active zone cytoplasmic component(GO:0098831) |
| 0.1 | 0.3 | GO:0070876 | SOSS complex(GO:0070876) |
| 0.1 | 0.6 | GO:0070775 | H3 histone acetyltransferase complex(GO:0070775) MOZ/MORF histone acetyltransferase complex(GO:0070776) |
| 0.1 | 0.4 | GO:0030289 | protein phosphatase 4 complex(GO:0030289) |
| 0.1 | 0.2 | GO:0045203 | intrinsic component of cell outer membrane(GO:0031230) integral component of cell outer membrane(GO:0045203) |
| 0.1 | 0.2 | GO:0002193 | MAML1-RBP-Jkappa- ICN1 complex(GO:0002193) |
| 0.1 | 0.2 | GO:0070022 | transforming growth factor beta receptor homodimeric complex(GO:0070022) |
| 0.1 | 0.1 | GO:0038039 | G-protein coupled receptor heterodimeric complex(GO:0038039) |
| 0.1 | 0.2 | GO:0005943 | phosphatidylinositol 3-kinase complex, class IA(GO:0005943) |
| 0.1 | 0.6 | GO:0032009 | early phagosome(GO:0032009) |
| 0.1 | 0.2 | GO:0044316 | cone cell pedicle(GO:0044316) |
| 0.1 | 0.3 | GO:0044614 | nuclear pore cytoplasmic filaments(GO:0044614) |
| 0.1 | 0.2 | GO:0097124 | cyclin A2-CDK2 complex(GO:0097124) |
| 0.0 | 0.2 | GO:0005588 | collagen type V trimer(GO:0005588) |
| 0.0 | 0.3 | GO:0044300 | cerebellar mossy fiber(GO:0044300) |
| 0.0 | 0.0 | GO:0097504 | Gemini of coiled bodies(GO:0097504) |
| 0.0 | 0.6 | GO:0000124 | SAGA complex(GO:0000124) |
| 0.0 | 0.2 | GO:0072487 | MSL complex(GO:0072487) |
| 0.0 | 0.1 | GO:0097629 | extrinsic component of omegasome membrane(GO:0097629) |
| 0.0 | 0.1 | GO:0044611 | nuclear pore inner ring(GO:0044611) |
| 0.0 | 0.2 | GO:0031315 | extrinsic component of mitochondrial outer membrane(GO:0031315) |
| 0.0 | 0.3 | GO:0001940 | male pronucleus(GO:0001940) |
| 0.0 | 0.1 | GO:0097543 | ciliary inversin compartment(GO:0097543) |
| 0.0 | 0.3 | GO:1990357 | terminal web(GO:1990357) |
| 0.0 | 0.1 | GO:0032937 | SREBP-SCAP-Insig complex(GO:0032937) |
| 0.0 | 0.7 | GO:0017146 | NMDA selective glutamate receptor complex(GO:0017146) |
| 0.0 | 0.2 | GO:0034455 | t-UTP complex(GO:0034455) |
| 0.0 | 1.3 | GO:0032839 | dendrite cytoplasm(GO:0032839) |
| 0.0 | 0.3 | GO:0000796 | condensin complex(GO:0000796) |
| 0.0 | 0.0 | GO:0005818 | astral microtubule(GO:0000235) aster(GO:0005818) |
| 0.0 | 0.3 | GO:0035068 | micro-ribonucleoprotein complex(GO:0035068) |
| 0.0 | 0.5 | GO:0097431 | mitotic spindle pole(GO:0097431) |
| 0.0 | 0.2 | GO:1990909 | Wnt signalosome(GO:1990909) |
| 0.0 | 0.1 | GO:0016533 | cyclin-dependent protein kinase 5 holoenzyme complex(GO:0016533) |
| 0.0 | 0.2 | GO:0036449 | microtubule minus-end(GO:0036449) |
| 0.0 | 0.4 | GO:0032300 | mismatch repair complex(GO:0032300) |
| 0.0 | 0.3 | GO:0044327 | dendritic spine head(GO:0044327) |
| 0.0 | 0.3 | GO:0032584 | growth cone membrane(GO:0032584) |
| 0.0 | 0.7 | GO:0030056 | hemidesmosome(GO:0030056) |
| 0.0 | 0.1 | GO:0008275 | gamma-tubulin small complex(GO:0008275) |
| 0.0 | 0.2 | GO:0070847 | core mediator complex(GO:0070847) |
| 0.0 | 0.3 | GO:0097197 | tetraspanin-enriched microdomain(GO:0097197) |
| 0.0 | 2.6 | GO:0043198 | dendritic shaft(GO:0043198) |
| 0.0 | 0.2 | GO:0036396 | MIS complex(GO:0036396) |
| 0.0 | 0.2 | GO:0070044 | synaptobrevin 2-SNAP-25-syntaxin-1a complex(GO:0070044) |
| 0.0 | 0.4 | GO:0033643 | host cell part(GO:0033643) |
| 0.0 | 0.2 | GO:0008024 | cyclin/CDK positive transcription elongation factor complex(GO:0008024) |
| 0.0 | 0.2 | GO:0016602 | CCAAT-binding factor complex(GO:0016602) |
| 0.0 | 0.1 | GO:0005968 | Rab-protein geranylgeranyltransferase complex(GO:0005968) |
| 0.0 | 0.0 | GO:0002945 | cyclin K-CDK13 complex(GO:0002945) |
| 0.0 | 0.1 | GO:0048269 | methionine adenosyltransferase complex(GO:0048269) |
| 0.0 | 0.2 | GO:0000137 | Golgi cis cisterna(GO:0000137) |
| 0.0 | 0.7 | GO:0043194 | axon initial segment(GO:0043194) |
| 0.0 | 0.1 | GO:0043190 | ATP-binding cassette (ABC) transporter complex(GO:0043190) |
| 0.0 | 0.1 | GO:0031436 | BRCA1-BARD1 complex(GO:0031436) |
| 0.0 | 0.2 | GO:0031264 | death-inducing signaling complex(GO:0031264) |
| 0.0 | 0.2 | GO:0033276 | transcription factor TFTC complex(GO:0033276) |
| 0.0 | 0.3 | GO:0042405 | nuclear inclusion body(GO:0042405) |
| 0.0 | 0.9 | GO:0035861 | site of double-strand break(GO:0035861) |
| 0.0 | 0.6 | GO:0016327 | apicolateral plasma membrane(GO:0016327) |
| 0.0 | 0.1 | GO:0098592 | cytoplasmic side of apical plasma membrane(GO:0098592) |
| 0.0 | 0.1 | GO:0097025 | MPP7-DLG1-LIN7 complex(GO:0097025) |
| 0.0 | 0.2 | GO:0070531 | BRCA1-A complex(GO:0070531) |
| 0.0 | 0.1 | GO:1990130 | Iml1 complex(GO:1990130) |
| 0.0 | 0.2 | GO:0030991 | intraciliary transport particle A(GO:0030991) |
| 0.0 | 0.2 | GO:0005826 | actomyosin contractile ring(GO:0005826) |
| 0.0 | 0.1 | GO:0044530 | supraspliceosomal complex(GO:0044530) |
| 0.0 | 0.1 | GO:0014701 | junctional sarcoplasmic reticulum membrane(GO:0014701) |
| 0.0 | 0.2 | GO:0097443 | sorting endosome(GO:0097443) |
| 0.0 | 0.3 | GO:0030014 | CCR4-NOT complex(GO:0030014) |
| 0.0 | 0.0 | GO:0071148 | TEAD-1-YAP complex(GO:0071148) |
| 0.0 | 0.2 | GO:0070937 | CRD-mediated mRNA stability complex(GO:0070937) |
| 0.0 | 0.1 | GO:1990111 | spermatoproteasome complex(GO:1990111) |
| 0.0 | 0.1 | GO:0031428 | box C/D snoRNP complex(GO:0031428) |
| 0.0 | 0.3 | GO:0005847 | mRNA cleavage and polyadenylation specificity factor complex(GO:0005847) |
| 0.0 | 0.1 | GO:1990589 | ATF4-CREB1 transcription factor complex(GO:1990589) |
| 0.0 | 0.1 | GO:0033553 | rDNA heterochromatin(GO:0033553) |
| 0.0 | 0.1 | GO:0043293 | apoptosome(GO:0043293) |
| 0.0 | 0.1 | GO:0070545 | PeBoW complex(GO:0070545) |
| 0.0 | 0.1 | GO:0071144 | SMAD2-SMAD3 protein complex(GO:0071144) |
| 0.0 | 0.3 | GO:0031045 | dense core granule(GO:0031045) |
| 0.0 | 0.3 | GO:0032039 | integrator complex(GO:0032039) |
| 0.0 | 0.2 | GO:0036056 | filtration diaphragm(GO:0036056) slit diaphragm(GO:0036057) |
| 0.0 | 0.0 | GO:0030690 | Noc1p-Noc2p complex(GO:0030690) |
| 0.0 | 0.1 | GO:0048787 | presynaptic active zone membrane(GO:0048787) |
| 0.0 | 0.1 | GO:0005952 | cAMP-dependent protein kinase complex(GO:0005952) |
| 0.0 | 0.1 | GO:0005677 | chromatin silencing complex(GO:0005677) |
| 0.0 | 0.1 | GO:0090571 | RNA polymerase II transcription repressor complex(GO:0090571) |
| 0.0 | 0.3 | GO:0030061 | mitochondrial crista(GO:0030061) |
| 0.0 | 0.1 | GO:0097136 | Bcl-2 family protein complex(GO:0097136) |
| 0.0 | 0.1 | GO:0044666 | MLL3/4 complex(GO:0044666) |
| 0.0 | 0.1 | GO:0016593 | Cdc73/Paf1 complex(GO:0016593) |
| 0.0 | 0.1 | GO:0016035 | zeta DNA polymerase complex(GO:0016035) |
| 0.0 | 0.0 | GO:0044307 | dendritic branch(GO:0044307) |
| 0.0 | 0.3 | GO:0008250 | oligosaccharyltransferase complex(GO:0008250) |
| 0.0 | 0.3 | GO:0048188 | Set1C/COMPASS complex(GO:0048188) |
| 0.0 | 0.3 | GO:0097440 | apical dendrite(GO:0097440) |
| 0.0 | 0.1 | GO:0005899 | insulin receptor complex(GO:0005899) |
| 0.0 | 0.1 | GO:0009279 | cell outer membrane(GO:0009279) external encapsulating structure(GO:0030312) cell envelope(GO:0030313) external encapsulating structure part(GO:0044462) |
| 0.0 | 0.1 | GO:0032059 | bleb(GO:0032059) |
| 0.0 | 0.1 | GO:0044294 | dendritic growth cone(GO:0044294) |
| 0.0 | 0.1 | GO:0034751 | aryl hydrocarbon receptor complex(GO:0034751) |
| 0.0 | 0.3 | GO:0071004 | U2-type prespliceosome(GO:0071004) |
| 0.0 | 0.3 | GO:0032045 | guanyl-nucleotide exchange factor complex(GO:0032045) |
| 0.0 | 0.1 | GO:0097524 | sperm plasma membrane(GO:0097524) |
| 0.0 | 0.0 | GO:0034750 | Scrib-APC-beta-catenin complex(GO:0034750) |
| 0.0 | 0.5 | GO:0000159 | protein phosphatase type 2A complex(GO:0000159) |
| 0.0 | 0.1 | GO:0071564 | npBAF complex(GO:0071564) |
| 0.0 | 0.1 | GO:1990635 | proximal dendrite(GO:1990635) |
| 0.0 | 0.0 | GO:0005656 | nuclear pre-replicative complex(GO:0005656) pre-replicative complex(GO:0036387) |
| 0.0 | 0.1 | GO:0030981 | cortical microtubule cytoskeleton(GO:0030981) |
| 0.0 | 0.0 | GO:0030956 | glutamyl-tRNA(Gln) amidotransferase complex(GO:0030956) |
| 0.0 | 0.1 | GO:0016589 | NURF complex(GO:0016589) |
| 0.0 | 0.2 | GO:0017119 | Golgi transport complex(GO:0017119) |
| 0.0 | 0.4 | GO:0005721 | pericentric heterochromatin(GO:0005721) |
| 0.0 | 0.0 | GO:0036195 | muscle cell projection(GO:0036194) muscle cell projection membrane(GO:0036195) |
| 0.0 | 0.0 | GO:0036117 | hyaluranon cable(GO:0036117) |
| 0.0 | 0.0 | GO:0030893 | meiotic cohesin complex(GO:0030893) |
| 0.0 | 0.1 | GO:0000798 | nuclear cohesin complex(GO:0000798) |
| 0.0 | 0.1 | GO:0031983 | vesicle lumen(GO:0031983) |
| 0.0 | 0.3 | GO:0035371 | microtubule plus-end(GO:0035371) |
| 0.0 | 0.0 | GO:0034657 | GID complex(GO:0034657) |
| 0.0 | 0.1 | GO:0002079 | inner acrosomal membrane(GO:0002079) |
| 0.0 | 0.2 | GO:0071565 | nBAF complex(GO:0071565) |
| 0.0 | 0.2 | GO:0038201 | TOR complex(GO:0038201) |
| 0.0 | 0.2 | GO:0016580 | Sin3 complex(GO:0016580) |
| 0.0 | 0.3 | GO:1902711 | GABA-A receptor complex(GO:1902711) |
| 0.0 | 0.1 | GO:0031074 | nucleocytoplasmic shuttling complex(GO:0031074) |
| 0.0 | 0.1 | GO:0070822 | Sin3-type complex(GO:0070822) |
| 0.0 | 0.0 | GO:0005896 | interleukin-6 receptor complex(GO:0005896) |
| 0.0 | 0.1 | GO:1990316 | ATG1/ULK1 kinase complex(GO:1990316) |
| 0.0 | 0.0 | GO:1990682 | CSF1-CSF1R complex(GO:1990682) |
| 0.0 | 0.2 | GO:0097449 | astrocyte projection(GO:0097449) |
| 0.0 | 0.2 | GO:0032433 | filopodium tip(GO:0032433) |
| 0.0 | 0.1 | GO:1990712 | HFE-transferrin receptor complex(GO:1990712) |
| 0.0 | 0.1 | GO:0030485 | smooth muscle contractile fiber(GO:0030485) |
| 0.0 | 0.1 | GO:0034388 | Pwp2p-containing subcomplex of 90S preribosome(GO:0034388) |
| 0.0 | 0.1 | GO:0005658 | alpha DNA polymerase:primase complex(GO:0005658) |
| 0.0 | 0.0 | GO:0070421 | DNA ligase III-XRCC1 complex(GO:0070421) |
| 0.0 | 0.0 | GO:0005960 | glycine cleavage complex(GO:0005960) |
| 0.0 | 0.7 | GO:0005871 | kinesin complex(GO:0005871) |
| 0.0 | 0.2 | GO:0042622 | photoreceptor outer segment membrane(GO:0042622) |
| 0.0 | 0.1 | GO:0072534 | perineuronal net(GO:0072534) |
| 0.0 | 0.0 | GO:0000836 | ER ubiquitin ligase complex(GO:0000835) Hrd1p ubiquitin ligase complex(GO:0000836) |
| 0.0 | 0.5 | GO:0016592 | mediator complex(GO:0016592) |
| 0.0 | 0.0 | GO:0035253 | ciliary rootlet(GO:0035253) |
| 0.0 | 0.2 | GO:0032040 | small-subunit processome(GO:0032040) |
| 0.0 | 0.1 | GO:0044232 | organelle membrane contact site(GO:0044232) |
| 0.0 | 0.1 | GO:0005796 | Golgi lumen(GO:0005796) |
| 0.0 | 0.1 | GO:0005849 | mRNA cleavage factor complex(GO:0005849) |
| 0.0 | 0.1 | GO:0071203 | WASH complex(GO:0071203) |
| 0.0 | 0.2 | GO:0016010 | dystrophin-associated glycoprotein complex(GO:0016010) glycoprotein complex(GO:0090665) |
| 0.0 | 0.2 | GO:0035102 | PRC1 complex(GO:0035102) |
| 0.0 | 0.1 | GO:1990246 | uniplex complex(GO:1990246) |
| 0.0 | 1.5 | GO:0001650 | fibrillar center(GO:0001650) |
| 0.0 | 0.1 | GO:0008290 | F-actin capping protein complex(GO:0008290) |
| 0.0 | 0.1 | GO:0042788 | polysomal ribosome(GO:0042788) |
| 0.0 | 0.3 | GO:0034364 | high-density lipoprotein particle(GO:0034364) |
| 0.0 | 0.0 | GO:0000923 | equatorial microtubule organizing center(GO:0000923) |
| 0.0 | 0.1 | GO:0031390 | Ctf18 RFC-like complex(GO:0031390) |
| 0.0 | 0.1 | GO:0031209 | SCAR complex(GO:0031209) |
| 0.0 | 0.6 | GO:0005643 | nuclear pore(GO:0005643) |
| 0.0 | 0.1 | GO:0032797 | SMN complex(GO:0032797) |
| 0.0 | 0.0 | GO:0032983 | kainate selective glutamate receptor complex(GO:0032983) |
Gene overrepresentation in molecular function category:
| Log-likelihood per target | Total log-likelihood | Term | Description |
|---|---|---|---|
| 0.2 | 0.6 | GO:0016309 | 1-phosphatidylinositol-5-phosphate 4-kinase activity(GO:0016309) |
| 0.2 | 0.5 | GO:0004874 | aryl hydrocarbon receptor activity(GO:0004874) |
| 0.2 | 0.5 | GO:0060002 | plus-end directed microfilament motor activity(GO:0060002) |
| 0.2 | 1.2 | GO:0030160 | GKAP/Homer scaffold activity(GO:0030160) |
| 0.2 | 0.5 | GO:0004605 | phosphatidate cytidylyltransferase activity(GO:0004605) |
| 0.1 | 0.5 | GO:0005324 | long-chain fatty acid transporter activity(GO:0005324) |
| 0.1 | 0.5 | GO:0019237 | centromeric DNA binding(GO:0019237) |
| 0.1 | 0.4 | GO:0005171 | hepatocyte growth factor receptor binding(GO:0005171) |
| 0.1 | 0.6 | GO:0038132 | neuregulin binding(GO:0038132) |
| 0.1 | 0.3 | GO:0035403 | histone kinase activity (H3-T6 specific)(GO:0035403) |
| 0.1 | 0.8 | GO:0005173 | stem cell factor receptor binding(GO:0005173) |
| 0.1 | 0.4 | GO:0001225 | RNA polymerase II transcription coactivator binding(GO:0001225) |
| 0.1 | 0.3 | GO:0086057 | voltage-gated calcium channel activity involved in bundle of His cell action potential(GO:0086057) |
| 0.1 | 0.3 | GO:0015292 | uniporter activity(GO:0015292) |
| 0.1 | 0.3 | GO:0070012 | oligopeptidase activity(GO:0070012) |
| 0.1 | 0.3 | GO:0004999 | vasoactive intestinal polypeptide receptor activity(GO:0004999) |
| 0.1 | 0.3 | GO:0042799 | histone methyltransferase activity (H4-K20 specific)(GO:0042799) |
| 0.1 | 0.7 | GO:0035033 | histone deacetylase regulator activity(GO:0035033) |
| 0.1 | 0.4 | GO:0099583 | neurotransmitter receptor activity involved in regulation of postsynaptic cytosolic calcium ion concentration(GO:0099583) |
| 0.1 | 0.3 | GO:0016149 | translation release factor activity, codon specific(GO:0016149) |
| 0.1 | 0.5 | GO:0086059 | voltage-gated calcium channel activity involved SA node cell action potential(GO:0086059) |
| 0.1 | 0.3 | GO:0047184 | 1-acylglycerophosphocholine O-acyltransferase activity(GO:0047184) |
| 0.1 | 0.2 | GO:0004704 | NF-kappaB-inducing kinase activity(GO:0004704) |
| 0.1 | 0.3 | GO:0004045 | aminoacyl-tRNA hydrolase activity(GO:0004045) |
| 0.1 | 0.1 | GO:1903924 | estradiol binding(GO:1903924) |
| 0.1 | 0.3 | GO:0070579 | methylcytosine dioxygenase activity(GO:0070579) |
| 0.1 | 0.2 | GO:0016316 | phosphatidylinositol-3,4-bisphosphate 4-phosphatase activity(GO:0016316) |
| 0.1 | 0.2 | GO:0035939 | microsatellite binding(GO:0035939) |
| 0.1 | 0.2 | GO:0031826 | type 2A serotonin receptor binding(GO:0031826) |
| 0.1 | 0.2 | GO:0004359 | glutaminase activity(GO:0004359) |
| 0.1 | 0.3 | GO:0000822 | inositol hexakisphosphate binding(GO:0000822) |
| 0.1 | 0.2 | GO:0001641 | group II metabotropic glutamate receptor activity(GO:0001641) |
| 0.1 | 0.4 | GO:0034647 | histone demethylase activity (H3-trimethyl-K4 specific)(GO:0034647) |
| 0.1 | 0.5 | GO:0071253 | connexin binding(GO:0071253) |
| 0.1 | 0.3 | GO:0008093 | cytoskeletal adaptor activity(GO:0008093) |
| 0.1 | 0.8 | GO:0035497 | cAMP response element binding(GO:0035497) |
| 0.1 | 0.2 | GO:0003831 | beta-N-acetylglucosaminylglycopeptide beta-1,4-galactosyltransferase activity(GO:0003831) |
| 0.1 | 0.7 | GO:0003708 | retinoic acid receptor activity(GO:0003708) |
| 0.1 | 0.6 | GO:0030306 | ADP-ribosylation factor binding(GO:0030306) |
| 0.1 | 0.2 | GO:1902379 | chemoattractant activity involved in axon guidance(GO:1902379) |
| 0.1 | 0.3 | GO:0010385 | double-stranded methylated DNA binding(GO:0010385) |
| 0.1 | 0.2 | GO:0070548 | L-glutamine aminotransferase activity(GO:0070548) |
| 0.1 | 0.2 | GO:0003828 | alpha-N-acetylneuraminate alpha-2,8-sialyltransferase activity(GO:0003828) |
| 0.1 | 0.3 | GO:0016907 | G-protein coupled acetylcholine receptor activity(GO:0016907) |
| 0.1 | 0.2 | GO:0043404 | corticotrophin-releasing factor receptor activity(GO:0015056) corticotropin-releasing hormone receptor activity(GO:0043404) |
| 0.1 | 0.2 | GO:0004515 | nicotinamide-nucleotide adenylyltransferase activity(GO:0000309) nicotinate-nucleotide adenylyltransferase activity(GO:0004515) |
| 0.1 | 0.2 | GO:0004724 | magnesium-dependent protein serine/threonine phosphatase activity(GO:0004724) |
| 0.0 | 0.3 | GO:0061578 | Lys63-specific deubiquitinase activity(GO:0061578) |
| 0.0 | 0.2 | GO:0047623 | AMP deaminase activity(GO:0003876) adenosine-phosphate deaminase activity(GO:0047623) |
| 0.0 | 0.1 | GO:0003941 | L-serine ammonia-lyase activity(GO:0003941) |
| 0.0 | 0.4 | GO:0032184 | SUMO polymer binding(GO:0032184) |
| 0.0 | 0.5 | GO:0016176 | superoxide-generating NADPH oxidase activator activity(GO:0016176) |
| 0.0 | 0.1 | GO:0001011 | transcription factor activity, sequence-specific DNA binding, RNA polymerase recruiting(GO:0001011) transcription factor activity, TFIIB-class binding(GO:0001087) |
| 0.0 | 0.5 | GO:0016929 | SUMO-specific protease activity(GO:0016929) |
| 0.0 | 0.1 | GO:0004698 | calcium-dependent protein kinase C activity(GO:0004698) |
| 0.0 | 0.4 | GO:0005169 | neurotrophin TRKB receptor binding(GO:0005169) |
| 0.0 | 0.3 | GO:0004652 | polynucleotide adenylyltransferase activity(GO:0004652) |
| 0.0 | 0.1 | GO:0004827 | proline-tRNA ligase activity(GO:0004827) |
| 0.0 | 0.1 | GO:0008332 | low voltage-gated calcium channel activity(GO:0008332) |
| 0.0 | 0.3 | GO:0004118 | cGMP-stimulated cyclic-nucleotide phosphodiesterase activity(GO:0004118) |
| 0.0 | 0.5 | GO:0016004 | phospholipase activator activity(GO:0016004) |
| 0.0 | 0.3 | GO:0031697 | beta-1 adrenergic receptor binding(GO:0031697) |
| 0.0 | 0.1 | GO:0033222 | xylose binding(GO:0033222) |
| 0.0 | 0.2 | GO:0031802 | type 5 metabotropic glutamate receptor binding(GO:0031802) |
| 0.0 | 0.1 | GO:0008502 | melatonin receptor activity(GO:0008502) |
| 0.0 | 0.2 | GO:0071558 | histone demethylase activity (H3-K27 specific)(GO:0071558) |
| 0.0 | 0.1 | GO:0051916 | granulocyte colony-stimulating factor binding(GO:0051916) |
| 0.0 | 0.3 | GO:0035252 | UDP-xylosyltransferase activity(GO:0035252) |
| 0.0 | 0.3 | GO:0052832 | inositol monophosphate 1-phosphatase activity(GO:0008934) inositol monophosphate 3-phosphatase activity(GO:0052832) |
| 0.0 | 0.2 | GO:0015184 | L-cystine transmembrane transporter activity(GO:0015184) |
| 0.0 | 0.3 | GO:0005007 | fibroblast growth factor-activated receptor activity(GO:0005007) |
| 0.0 | 0.1 | GO:0001588 | dopamine neurotransmitter receptor activity, coupled via Gs(GO:0001588) |
| 0.0 | 0.1 | GO:0070878 | primary miRNA binding(GO:0070878) |
| 0.0 | 0.3 | GO:0043208 | glycosphingolipid binding(GO:0043208) |
| 0.0 | 0.6 | GO:0070411 | I-SMAD binding(GO:0070411) |
| 0.0 | 0.2 | GO:0015467 | G-protein activated inward rectifier potassium channel activity(GO:0015467) |
| 0.0 | 0.2 | GO:0008499 | UDP-galactose:beta-N-acetylglucosamine beta-1,3-galactosyltransferase activity(GO:0008499) |
| 0.0 | 0.2 | GO:0016151 | nickel cation binding(GO:0016151) |
| 0.0 | 0.3 | GO:0005078 | MAP-kinase scaffold activity(GO:0005078) |
| 0.0 | 0.1 | GO:0047635 | L-alanine:2-oxoglutarate aminotransferase activity(GO:0004021) alanine-oxo-acid transaminase activity(GO:0047635) |
| 0.0 | 0.1 | GO:0070883 | pre-miRNA binding(GO:0070883) |
| 0.0 | 0.2 | GO:0004416 | hydroxyacylglutathione hydrolase activity(GO:0004416) |
| 0.0 | 0.1 | GO:0004307 | ethanolaminephosphotransferase activity(GO:0004307) |
| 0.0 | 0.2 | GO:0047696 | beta-adrenergic receptor kinase activity(GO:0047696) |
| 0.0 | 0.3 | GO:0015386 | potassium:proton antiporter activity(GO:0015386) |
| 0.0 | 0.1 | GO:0030626 | U12 snRNA binding(GO:0030626) |
| 0.0 | 0.7 | GO:0032794 | GTPase activating protein binding(GO:0032794) |
| 0.0 | 0.4 | GO:0005522 | profilin binding(GO:0005522) |
| 0.0 | 0.4 | GO:0015095 | magnesium ion transmembrane transporter activity(GO:0015095) |
| 0.0 | 0.3 | GO:0035374 | chondroitin sulfate binding(GO:0035374) |
| 0.0 | 0.2 | GO:0036033 | mediator complex binding(GO:0036033) |
| 0.0 | 0.2 | GO:0043199 | sulfate binding(GO:0043199) |
| 0.0 | 0.2 | GO:0008349 | MAP kinase kinase kinase kinase activity(GO:0008349) |
| 0.0 | 0.3 | GO:0005113 | patched binding(GO:0005113) |
| 0.0 | 0.8 | GO:0070577 | lysine-acetylated histone binding(GO:0070577) |
| 0.0 | 0.4 | GO:0004708 | MAP kinase kinase activity(GO:0004708) |
| 0.0 | 0.1 | GO:0032357 | oxidized DNA binding(GO:0032356) oxidized purine DNA binding(GO:0032357) |
| 0.0 | 0.1 | GO:0001847 | opsonin receptor activity(GO:0001847) |
| 0.0 | 0.2 | GO:0008526 | phosphatidylinositol transporter activity(GO:0008526) |
| 0.0 | 0.2 | GO:0004720 | protein-lysine 6-oxidase activity(GO:0004720) |
| 0.0 | 0.2 | GO:0004468 | lysine N-acetyltransferase activity, acting on acetyl phosphate as donor(GO:0004468) |
| 0.0 | 0.4 | GO:0004143 | diacylglycerol kinase activity(GO:0004143) |
| 0.0 | 0.1 | GO:0001069 | regulatory region RNA binding(GO:0001069) |
| 0.0 | 0.1 | GO:0061628 | H3K27me3 modified histone binding(GO:0061628) |
| 0.0 | 0.2 | GO:0015093 | ferrous iron transmembrane transporter activity(GO:0015093) |
| 0.0 | 0.1 | GO:0061676 | importin-alpha family protein binding(GO:0061676) |
| 0.0 | 0.3 | GO:0008046 | axon guidance receptor activity(GO:0008046) |
| 0.0 | 0.1 | GO:0004920 | interleukin-10 receptor activity(GO:0004920) |
| 0.0 | 0.0 | GO:0004040 | amidase activity(GO:0004040) |
| 0.0 | 0.9 | GO:0008139 | nuclear localization sequence binding(GO:0008139) |
| 0.0 | 0.1 | GO:0004719 | protein-L-isoaspartate (D-aspartate) O-methyltransferase activity(GO:0004719) |
| 0.0 | 0.4 | GO:0019869 | chloride channel inhibitor activity(GO:0019869) |
| 0.0 | 0.2 | GO:0047499 | calcium-independent phospholipase A2 activity(GO:0047499) |
| 0.0 | 0.1 | GO:0004839 | ubiquitin activating enzyme activity(GO:0004839) |
| 0.0 | 0.1 | GO:0004832 | valine-tRNA ligase activity(GO:0004832) |
| 0.0 | 0.1 | GO:0004478 | methionine adenosyltransferase activity(GO:0004478) |
| 0.0 | 0.1 | GO:0004971 | AMPA glutamate receptor activity(GO:0004971) |
| 0.0 | 0.1 | GO:0005487 | nucleocytoplasmic transporter activity(GO:0005487) |
| 0.0 | 0.1 | GO:0004897 | ciliary neurotrophic factor receptor activity(GO:0004897) |
| 0.0 | 0.2 | GO:0045294 | alpha-catenin binding(GO:0045294) |
| 0.0 | 0.2 | GO:0045545 | syndecan binding(GO:0045545) |
| 0.0 | 0.1 | GO:0015321 | sodium-dependent phosphate transmembrane transporter activity(GO:0015321) |
| 0.0 | 0.1 | GO:0004830 | tryptophan-tRNA ligase activity(GO:0004830) |
| 0.0 | 0.1 | GO:0015440 | peptide-transporting ATPase activity(GO:0015440) |
| 0.0 | 0.3 | GO:0019992 | diacylglycerol binding(GO:0019992) |
| 0.0 | 0.4 | GO:0042043 | neurexin family protein binding(GO:0042043) |
| 0.0 | 0.4 | GO:0004579 | oligosaccharyl transferase activity(GO:0004576) dolichyl-diphosphooligosaccharide-protein glycotransferase activity(GO:0004579) |
| 0.0 | 0.2 | GO:0090554 | phosphatidylcholine-translocating ATPase activity(GO:0090554) |
| 0.0 | 0.1 | GO:0004706 | JUN kinase kinase kinase activity(GO:0004706) |
| 0.0 | 0.1 | GO:0043262 | adenosine-diphosphatase activity(GO:0043262) |
| 0.0 | 0.2 | GO:0005168 | neurotrophin TRK receptor binding(GO:0005167) neurotrophin TRKA receptor binding(GO:0005168) |
| 0.0 | 0.1 | GO:0008508 | bile acid:sodium symporter activity(GO:0008508) |
| 0.0 | 0.3 | GO:0070097 | delta-catenin binding(GO:0070097) |
| 0.0 | 0.1 | GO:0008559 | xenobiotic-transporting ATPase activity(GO:0008559) |
| 0.0 | 0.1 | GO:0070016 | armadillo repeat domain binding(GO:0070016) |
| 0.0 | 0.1 | GO:0071553 | uridine nucleotide receptor activity(GO:0015065) G-protein coupled pyrimidinergic nucleotide receptor activity(GO:0071553) |
| 0.0 | 0.3 | GO:0035198 | miRNA binding(GO:0035198) |
| 0.0 | 0.1 | GO:0016715 | oxidoreductase activity, acting on paired donors, with incorporation or reduction of molecular oxygen, reduced ascorbate as one donor, and incorporation of one atom of oxygen(GO:0016715) |
| 0.0 | 0.6 | GO:0070064 | proline-rich region binding(GO:0070064) |
| 0.0 | 0.5 | GO:0043395 | heparan sulfate proteoglycan binding(GO:0043395) |
| 0.0 | 0.1 | GO:0008330 | protein tyrosine/threonine phosphatase activity(GO:0008330) |
| 0.0 | 0.1 | GO:0008263 | pyrimidine-specific mismatch base pair DNA N-glycosylase activity(GO:0008263) |
| 0.0 | 1.1 | GO:0045182 | translation regulator activity(GO:0045182) |
| 0.0 | 0.2 | GO:0022851 | GABA-gated chloride ion channel activity(GO:0022851) |
| 0.0 | 0.1 | GO:0060072 | large conductance calcium-activated potassium channel activity(GO:0060072) |
| 0.0 | 0.1 | GO:0031433 | telethonin binding(GO:0031433) |
| 0.0 | 0.6 | GO:0005086 | ARF guanyl-nucleotide exchange factor activity(GO:0005086) |
| 0.0 | 0.1 | GO:0034618 | arginine binding(GO:0034618) |
| 0.0 | 0.0 | GO:1990269 | RNA polymerase II C-terminal domain phosphoserine binding(GO:1990269) |
| 0.0 | 0.3 | GO:0050321 | tau-protein kinase activity(GO:0050321) |
| 0.0 | 0.1 | GO:0048763 | calcium-induced calcium release activity(GO:0048763) |
| 0.0 | 0.3 | GO:0008331 | high voltage-gated calcium channel activity(GO:0008331) |
| 0.0 | 0.1 | GO:0005042 | netrin receptor activity(GO:0005042) |
| 0.0 | 0.1 | GO:0004301 | epoxide hydrolase activity(GO:0004301) |
| 0.0 | 0.1 | GO:0004430 | 1-phosphatidylinositol 4-kinase activity(GO:0004430) |
| 0.0 | 0.3 | GO:0070700 | BMP receptor binding(GO:0070700) |
| 0.0 | 0.3 | GO:0052744 | phosphatidylinositol monophosphate phosphatase activity(GO:0052744) |
| 0.0 | 0.7 | GO:0046875 | ephrin receptor binding(GO:0046875) |
| 0.0 | 0.1 | GO:0015016 | [heparan sulfate]-glucosamine N-sulfotransferase activity(GO:0015016) |
| 0.0 | 0.2 | GO:0004385 | guanylate kinase activity(GO:0004385) |
| 0.0 | 0.2 | GO:0004931 | extracellular ATP-gated cation channel activity(GO:0004931) ATP-gated ion channel activity(GO:0035381) |
| 0.0 | 0.1 | GO:0005148 | prolactin receptor binding(GO:0005148) |
| 0.0 | 2.3 | GO:0004702 | receptor signaling protein serine/threonine kinase activity(GO:0004702) |
| 0.0 | 0.2 | GO:0090482 | vitamin transmembrane transporter activity(GO:0090482) |
| 0.0 | 0.2 | GO:0000340 | RNA 7-methylguanosine cap binding(GO:0000340) |
| 0.0 | 0.2 | GO:0051011 | microtubule minus-end binding(GO:0051011) |
| 0.0 | 0.1 | GO:0009384 | N-acylmannosamine kinase activity(GO:0009384) |
| 0.0 | 0.1 | GO:0005131 | growth hormone receptor binding(GO:0005131) |
| 0.0 | 0.2 | GO:0008432 | JUN kinase binding(GO:0008432) |
| 0.0 | 0.1 | GO:0047276 | N-acetyllactosaminide 3-alpha-galactosyltransferase activity(GO:0047276) |
| 0.0 | 0.3 | GO:0017154 | semaphorin receptor activity(GO:0017154) |
| 0.0 | 0.1 | GO:0035529 | NADH pyrophosphatase activity(GO:0035529) |
| 0.0 | 0.2 | GO:0045503 | dynein light chain binding(GO:0045503) |
| 0.0 | 0.1 | GO:0097322 | 7SK snRNA binding(GO:0097322) |
| 0.0 | 0.2 | GO:0046975 | histone methyltransferase activity (H3-K36 specific)(GO:0046975) |
| 0.0 | 0.1 | GO:0015616 | DNA translocase activity(GO:0015616) |
| 0.0 | 0.1 | GO:0008184 | glycogen phosphorylase activity(GO:0008184) |
| 0.0 | 0.1 | GO:0005128 | erythropoietin receptor binding(GO:0005128) |
| 0.0 | 0.3 | GO:0008574 | ATP-dependent microtubule motor activity, plus-end-directed(GO:0008574) |
| 0.0 | 1.6 | GO:0008013 | beta-catenin binding(GO:0008013) |
| 0.0 | 1.6 | GO:0004843 | thiol-dependent ubiquitin-specific protease activity(GO:0004843) |
| 0.0 | 5.5 | GO:0005096 | GTPase activator activity(GO:0005096) |
| 0.0 | 0.1 | GO:0034056 | estrogen response element binding(GO:0034056) |
| 0.0 | 0.1 | GO:0010484 | H3 histone acetyltransferase activity(GO:0010484) |
| 0.0 | 0.3 | GO:0008484 | sulfuric ester hydrolase activity(GO:0008484) |
| 0.0 | 0.0 | GO:0001083 | transcription factor activity, RNA polymerase II basal transcription factor binding(GO:0001083) |
| 0.0 | 0.1 | GO:0071791 | chemokine (C-C motif) ligand 5 binding(GO:0071791) |
| 0.0 | 0.1 | GO:0002114 | interleukin-33 receptor activity(GO:0002114) |
| 0.0 | 0.1 | GO:0005006 | epidermal growth factor-activated receptor activity(GO:0005006) |
| 0.0 | 0.1 | GO:0070410 | co-SMAD binding(GO:0070410) |
| 0.0 | 0.1 | GO:0032296 | ribonuclease III activity(GO:0004525) double-stranded RNA-specific ribonuclease activity(GO:0032296) |
| 0.0 | 0.1 | GO:0051373 | FATZ binding(GO:0051373) |
| 0.0 | 0.4 | GO:0070530 | K63-linked polyubiquitin binding(GO:0070530) |
| 0.0 | 0.3 | GO:0015924 | mannosyl-oligosaccharide mannosidase activity(GO:0015924) |
| 0.0 | 0.0 | GO:0005087 | Ran guanyl-nucleotide exchange factor activity(GO:0005087) |
| 0.0 | 0.2 | GO:0051959 | dynein light intermediate chain binding(GO:0051959) |
| 0.0 | 0.1 | GO:0009378 | four-way junction helicase activity(GO:0009378) |
| 0.0 | 1.3 | GO:0003777 | microtubule motor activity(GO:0003777) |
| 0.0 | 0.2 | GO:0046974 | histone methyltransferase activity (H3-K9 specific)(GO:0046974) |
| 0.0 | 0.1 | GO:0001042 | RNA polymerase I core binding(GO:0001042) |
| 0.0 | 0.1 | GO:0051864 | histone demethylase activity (H3-K36 specific)(GO:0051864) |
| 0.0 | 0.1 | GO:0015272 | ATP-activated inward rectifier potassium channel activity(GO:0015272) |
| 0.0 | 0.1 | GO:0004095 | carnitine O-palmitoyltransferase activity(GO:0004095) O-palmitoyltransferase activity(GO:0016416) |
| 0.0 | 0.0 | GO:0042610 | CD8 receptor binding(GO:0042610) |
| 0.0 | 0.1 | GO:0030274 | LIM domain binding(GO:0030274) |
| 0.0 | 0.1 | GO:0070290 | N-acylphosphatidylethanolamine-specific phospholipase D activity(GO:0070290) |
| 0.0 | 0.4 | GO:0005247 | voltage-gated chloride channel activity(GO:0005247) |
| 0.0 | 0.6 | GO:0030552 | cAMP binding(GO:0030552) |
| 0.0 | 0.4 | GO:0003950 | NAD+ ADP-ribosyltransferase activity(GO:0003950) |
| 0.0 | 0.2 | GO:0080025 | phosphatidylinositol-3,5-bisphosphate binding(GO:0080025) |
| 0.0 | 0.5 | GO:0004693 | cyclin-dependent protein serine/threonine kinase activity(GO:0004693) |
| 0.0 | 0.1 | GO:0016433 | rRNA (adenine) methyltransferase activity(GO:0016433) |
| 0.0 | 0.1 | GO:0045322 | unmethylated CpG binding(GO:0045322) |
| 0.0 | 0.1 | GO:0070181 | small ribosomal subunit rRNA binding(GO:0070181) |
| 0.0 | 0.1 | GO:0031544 | peptidyl-proline 3-dioxygenase activity(GO:0031544) |
| 0.0 | 0.1 | GO:0015349 | thyroid hormone transmembrane transporter activity(GO:0015349) |
| 0.0 | 0.1 | GO:0015193 | L-proline transmembrane transporter activity(GO:0015193) |
| 0.0 | 0.1 | GO:0043237 | laminin-1 binding(GO:0043237) |
| 0.0 | 0.1 | GO:0001884 | pyrimidine nucleoside binding(GO:0001884) |
| 0.0 | 0.3 | GO:0005229 | intracellular calcium activated chloride channel activity(GO:0005229) |
| 0.0 | 0.3 | GO:0005537 | mannose binding(GO:0005537) |
| 0.0 | 0.2 | GO:0000146 | microfilament motor activity(GO:0000146) |
| 0.0 | 0.3 | GO:0042800 | histone methyltransferase activity (H3-K4 specific)(GO:0042800) |
| 0.0 | 0.1 | GO:0050656 | 3'-phosphoadenosine 5'-phosphosulfate binding(GO:0050656) |
| 0.0 | 0.3 | GO:0070412 | R-SMAD binding(GO:0070412) |
| 0.0 | 0.2 | GO:0015379 | potassium:chloride symporter activity(GO:0015379) potassium ion symporter activity(GO:0022820) |
| 0.0 | 0.1 | GO:0004809 | tRNA (guanine-N2-)-methyltransferase activity(GO:0004809) |
| 0.0 | 0.1 | GO:2001070 | starch binding(GO:2001070) |
| 0.0 | 0.3 | GO:0055106 | ubiquitin-protein transferase regulator activity(GO:0055106) |
| 0.0 | 0.1 | GO:0004594 | pantothenate kinase activity(GO:0004594) |
| 0.0 | 0.2 | GO:0018024 | histone-lysine N-methyltransferase activity(GO:0018024) |
| 0.0 | 0.1 | GO:0036310 | annealing helicase activity(GO:0036310) |
| 0.0 | 0.0 | GO:0004105 | choline-phosphate cytidylyltransferase activity(GO:0004105) |
| 0.0 | 0.2 | GO:0043996 | histone acetyltransferase activity (H4-K5 specific)(GO:0043995) histone acetyltransferase activity (H4-K8 specific)(GO:0043996) histone acetyltransferase activity (H4-K16 specific)(GO:0046972) |
| 0.0 | 0.0 | GO:0004937 | alpha1-adrenergic receptor activity(GO:0004937) |
| 0.0 | 0.1 | GO:0042289 | MHC class II protein binding(GO:0042289) |
| 0.0 | 0.3 | GO:0004535 | poly(A)-specific ribonuclease activity(GO:0004535) |
| 0.0 | 0.1 | GO:0098518 | polynucleotide phosphatase activity(GO:0098518) |
| 0.0 | 0.3 | GO:0004890 | GABA-A receptor activity(GO:0004890) |
| 0.0 | 0.1 | GO:0016406 | carnitine O-acyltransferase activity(GO:0016406) |
| 0.0 | 0.1 | GO:0035005 | 1-phosphatidylinositol-4-phosphate 3-kinase activity(GO:0035005) |
| 0.0 | 0.1 | GO:0070915 | lysophosphatidic acid receptor activity(GO:0070915) |
| 0.0 | 0.9 | GO:0005544 | calcium-dependent phospholipid binding(GO:0005544) |
| 0.0 | 0.0 | GO:0050567 | glutaminyl-tRNA synthase (glutamine-hydrolyzing) activity(GO:0050567) |
| 0.0 | 0.0 | GO:0043140 | ATP-dependent 3'-5' DNA helicase activity(GO:0043140) |
| 0.0 | 1.3 | GO:0019208 | phosphatase regulator activity(GO:0019208) |
| 0.0 | 0.1 | GO:0008190 | eukaryotic initiation factor 4E binding(GO:0008190) |
| 0.0 | 0.1 | GO:0097001 | ceramide binding(GO:0097001) |
| 0.0 | 0.1 | GO:0032183 | SUMO binding(GO:0032183) |
| 0.0 | 0.0 | GO:0015265 | urea channel activity(GO:0015265) |
| 0.0 | 0.0 | GO:0015203 | polyamine transmembrane transporter activity(GO:0015203) putrescine transmembrane transporter activity(GO:0015489) |
| 0.0 | 0.1 | GO:0008467 | [heparan sulfate]-glucosamine 3-sulfotransferase 1 activity(GO:0008467) |
| 0.0 | 0.0 | GO:0003844 | 1,4-alpha-glucan branching enzyme activity(GO:0003844) |
| 0.0 | 0.2 | GO:0022889 | L-serine transmembrane transporter activity(GO:0015194) serine transmembrane transporter activity(GO:0022889) |
| 0.0 | 0.2 | GO:0097200 | cysteine-type endopeptidase activity involved in apoptotic process(GO:0097153) cysteine-type endopeptidase activity involved in execution phase of apoptosis(GO:0097200) |
| 0.0 | 0.2 | GO:0003995 | acyl-CoA dehydrogenase activity(GO:0003995) |
| 0.0 | 0.8 | GO:0005201 | extracellular matrix structural constituent(GO:0005201) |
| 0.0 | 0.1 | GO:0032453 | histone demethylase activity (H3-K4 specific)(GO:0032453) |
| 0.0 | 0.5 | GO:0004683 | calmodulin-dependent protein kinase activity(GO:0004683) |
| 0.0 | 0.2 | GO:0017166 | vinculin binding(GO:0017166) |
| 0.0 | 0.0 | GO:0000026 | alpha-1,2-mannosyltransferase activity(GO:0000026) |
| 0.0 | 0.0 | GO:0050265 | RNA uridylyltransferase activity(GO:0050265) |
| 0.0 | 0.1 | GO:0004679 | AMP-activated protein kinase activity(GO:0004679) |
| 0.0 | 0.1 | GO:0033170 | DNA clamp loader activity(GO:0003689) protein-DNA loading ATPase activity(GO:0033170) |
| 0.0 | 0.1 | GO:0004822 | isoleucine-tRNA ligase activity(GO:0004822) |
| 0.0 | 0.0 | GO:0005017 | platelet-derived growth factor-activated receptor activity(GO:0005017) |
| 0.0 | 0.0 | GO:0030350 | iron-responsive element binding(GO:0030350) |
| 0.0 | 0.0 | GO:0005157 | macrophage colony-stimulating factor receptor binding(GO:0005157) |
| 0.0 | 0.5 | GO:0004715 | non-membrane spanning protein tyrosine kinase activity(GO:0004715) |
| 0.0 | 0.1 | GO:0017151 | DEAD/H-box RNA helicase binding(GO:0017151) |
| 0.0 | 0.1 | GO:0015277 | kainate selective glutamate receptor activity(GO:0015277) |
| 0.0 | 0.6 | GO:0035064 | methylated histone binding(GO:0035064) |
| 0.0 | 0.3 | GO:0005547 | phosphatidylinositol-3,4,5-trisphosphate binding(GO:0005547) |
| 0.0 | 0.0 | GO:0005381 | iron ion transmembrane transporter activity(GO:0005381) |
| 0.0 | 0.1 | GO:0004887 | thyroid hormone receptor activity(GO:0004887) |
| 0.0 | 0.1 | GO:0043008 | ATP-dependent protein binding(GO:0043008) |
| 0.0 | 0.2 | GO:0001134 | transcription factor activity, transcription factor recruiting(GO:0001134) |
| 0.0 | 0.2 | GO:0051010 | microtubule plus-end binding(GO:0051010) |
| 0.0 | 0.1 | GO:0001972 | retinoic acid binding(GO:0001972) |
| 0.0 | 0.2 | GO:0003688 | DNA replication origin binding(GO:0003688) |
| 0.0 | 0.1 | GO:0043325 | phosphatidylinositol-3,4-bisphosphate binding(GO:0043325) |
| 0.0 | 0.1 | GO:0071936 | coreceptor activity involved in Wnt signaling pathway(GO:0071936) |
| 0.0 | 0.0 | GO:0004591 | oxoglutarate dehydrogenase (succinyl-transferring) activity(GO:0004591) |
| 0.0 | 0.0 | GO:0072320 | volume-sensitive chloride channel activity(GO:0072320) |
| 0.0 | 0.1 | GO:0046912 | transferase activity, transferring acyl groups, acyl groups converted into alkyl on transfer(GO:0046912) |
| 0.0 | 0.1 | GO:0003951 | NAD+ kinase activity(GO:0003951) |
| 0.0 | 0.1 | GO:0015232 | heme transporter activity(GO:0015232) |
| 0.0 | 0.0 | GO:0050682 | AF-2 domain binding(GO:0050682) |
| 0.0 | 0.1 | GO:1990247 | N6-methyladenosine-containing RNA binding(GO:1990247) |
| 0.0 | 0.1 | GO:0016423 | tRNA (guanine) methyltransferase activity(GO:0016423) |
| 0.0 | 0.3 | GO:0005385 | zinc ion transmembrane transporter activity(GO:0005385) |
| 0.0 | 0.0 | GO:1990599 | 3' overhang single-stranded DNA endodeoxyribonuclease activity(GO:1990599) |
| 0.0 | 0.1 | GO:0008321 | Ral guanyl-nucleotide exchange factor activity(GO:0008321) |
| 0.0 | 0.2 | GO:0017056 | structural constituent of nuclear pore(GO:0017056) |
| 0.0 | 0.2 | GO:0008187 | poly-pyrimidine tract binding(GO:0008187) |
| 0.0 | 0.0 | GO:0030297 | transmembrane receptor protein tyrosine kinase activator activity(GO:0030297) |
| 0.0 | 0.1 | GO:0005092 | GDP-dissociation inhibitor activity(GO:0005092) |
| 0.0 | 0.0 | GO:0042392 | sphingosine-1-phosphate phosphatase activity(GO:0042392) |
| 0.0 | 0.0 | GO:0034485 | phosphatidylinositol-3,4,5-trisphosphate 5-phosphatase activity(GO:0034485) phosphatidylinositol trisphosphate phosphatase activity(GO:0034594) |
| 0.0 | 0.6 | GO:0048306 | calcium-dependent protein binding(GO:0048306) |
| 0.0 | 0.0 | GO:0017128 | phospholipid scramblase activity(GO:0017128) |
| 0.0 | 0.8 | GO:0005089 | Rho guanyl-nucleotide exchange factor activity(GO:0005089) |
| 0.0 | 0.1 | GO:0016742 | hydroxymethyl-, formyl- and related transferase activity(GO:0016742) |
| 0.0 | 0.0 | GO:0004066 | asparagine synthase (glutamine-hydrolyzing) activity(GO:0004066) |
| 0.0 | 0.1 | GO:0016286 | small conductance calcium-activated potassium channel activity(GO:0016286) |
| 0.0 | 0.1 | GO:0035325 | Toll-like receptor binding(GO:0035325) |
| 0.0 | 0.2 | GO:0019789 | SUMO transferase activity(GO:0019789) |
| 0.0 | 0.4 | GO:0030374 | ligand-dependent nuclear receptor transcription coactivator activity(GO:0030374) |
| 0.0 | 0.3 | GO:0019707 | protein-cysteine S-palmitoyltransferase activity(GO:0019706) protein-cysteine S-acyltransferase activity(GO:0019707) |
| 0.0 | 0.1 | GO:1990405 | protein antigen binding(GO:1990405) |
| 0.0 | 0.1 | GO:0008294 | calcium- and calmodulin-responsive adenylate cyclase activity(GO:0008294) |
| 0.0 | 0.2 | GO:0008536 | Ran GTPase binding(GO:0008536) |
| 0.0 | 1.0 | GO:0017124 | SH3 domain binding(GO:0017124) |
| 0.0 | 0.0 | GO:0016936 | galactoside binding(GO:0016936) |
| 0.0 | 0.1 | GO:0008297 | single-stranded DNA exodeoxyribonuclease activity(GO:0008297) |
| 0.0 | 0.1 | GO:0017150 | tRNA dihydrouridine synthase activity(GO:0017150) |
| 0.0 | 0.1 | GO:0005432 | calcium:sodium antiporter activity(GO:0005432) |
| 0.0 | 0.1 | GO:0071532 | ankyrin repeat binding(GO:0071532) |
| 0.0 | 0.1 | GO:0042030 | ATPase inhibitor activity(GO:0042030) |
| 0.0 | 0.2 | GO:0008568 | microtubule-severing ATPase activity(GO:0008568) |
| 0.0 | 0.1 | GO:0004128 | cytochrome-b5 reductase activity, acting on NAD(P)H(GO:0004128) |
| 0.0 | 0.2 | GO:0004198 | calcium-dependent cysteine-type endopeptidase activity(GO:0004198) |
| 0.0 | 0.0 | GO:0003726 | double-stranded RNA adenosine deaminase activity(GO:0003726) |
| 0.0 | 0.0 | GO:0004694 | eukaryotic translation initiation factor 2alpha kinase activity(GO:0004694) |
Gene overrepresentation in curated gene sets: canonical pathways category:
| Log-likelihood per target | Total log-likelihood | Term | Description |
|---|---|---|---|
| 0.1 | 0.1 | PID ER NONGENOMIC PATHWAY | Plasma membrane estrogen receptor signaling |
| 0.1 | 1.1 | PID TCR JNK PATHWAY | JNK signaling in the CD4+ TCR pathway |
| 0.1 | 0.8 | PID TCR RAS PATHWAY | Ras signaling in the CD4+ TCR pathway |
| 0.0 | 0.0 | PID EPO PATHWAY | EPO signaling pathway |
| 0.0 | 0.1 | PID NFAT 3PATHWAY | Role of Calcineurin-dependent NFAT signaling in lymphocytes |
| 0.0 | 0.2 | PID TCR CALCIUM PATHWAY | Calcium signaling in the CD4+ TCR pathway |
| 0.0 | 0.7 | PID INTEGRIN4 PATHWAY | Alpha6 beta4 integrin-ligand interactions |
| 0.0 | 0.2 | PID EPHA2 FWD PATHWAY | EPHA2 forward signaling |
| 0.0 | 0.1 | PID BETA CATENIN DEG PATHWAY | Degradation of beta catenin |
| 0.0 | 0.5 | PID THROMBIN PAR4 PATHWAY | PAR4-mediated thrombin signaling events |
| 0.0 | 0.2 | ST TYPE I INTERFERON PATHWAY | Type I Interferon (alpha/beta IFN) Pathway |
| 0.0 | 0.3 | PID IL6 7 PATHWAY | IL6-mediated signaling events |
| 0.0 | 1.3 | PID NETRIN PATHWAY | Netrin-mediated signaling events |
| 0.0 | 1.3 | PID ERBB4 PATHWAY | ErbB4 signaling events |
| 0.0 | 0.4 | PID ANTHRAX PATHWAY | Cellular roles of Anthrax toxin |
| 0.0 | 0.1 | PID VEGFR1 PATHWAY | VEGFR1 specific signals |
| 0.0 | 0.8 | PID RET PATHWAY | Signaling events regulated by Ret tyrosine kinase |
| 0.0 | 0.7 | SA CASPASE CASCADE | Apoptosis is mediated by caspases, cysteine proteases arranged in a proteolytic cascade. |
| 0.0 | 0.3 | PID PDGFRA PATHWAY | PDGFR-alpha signaling pathway |
| 0.0 | 0.3 | ST STAT3 PATHWAY | STAT3 Pathway |
| 0.0 | 0.6 | PID EPHB FWD PATHWAY | EPHB forward signaling |
| 0.0 | 0.7 | PID RAS PATHWAY | Regulation of Ras family activation |
| 0.0 | 1.0 | ST T CELL SIGNAL TRANSDUCTION | T Cell Signal Transduction |
| 0.0 | 1.2 | PID AR TF PATHWAY | Regulation of Androgen receptor activity |
| 0.0 | 1.0 | PID RXR VDR PATHWAY | RXR and RAR heterodimerization with other nuclear receptor |
| 0.0 | 0.8 | PID IL2 1PATHWAY | IL2-mediated signaling events |
| 0.0 | 0.5 | NABA BASEMENT MEMBRANES | Genes encoding structural components of basement membranes |
| 0.0 | 1.0 | PID IL12 2PATHWAY | IL12-mediated signaling events |
| 0.0 | 0.5 | PID HIV NEF PATHWAY | HIV-1 Nef: Negative effector of Fas and TNF-alpha |
| 0.0 | 0.3 | PID ALK1 PATHWAY | ALK1 signaling events |
| 0.0 | 0.1 | PID NEPHRIN NEPH1 PATHWAY | Nephrin/Neph1 signaling in the kidney podocyte |
| 0.0 | 0.1 | PID CD8 TCR DOWNSTREAM PATHWAY | Downstream signaling in naïve CD8+ T cells |
| 0.0 | 0.4 | ST WNT CA2 CYCLIC GMP PATHWAY | Wnt/Ca2+/cyclic GMP signaling. |
| 0.0 | 0.2 | PID IL12 STAT4 PATHWAY | IL12 signaling mediated by STAT4 |
| 0.0 | 0.2 | PID SYNDECAN 3 PATHWAY | Syndecan-3-mediated signaling events |
| 0.0 | 0.4 | PID ERBB1 INTERNALIZATION PATHWAY | Internalization of ErbB1 |
| 0.0 | 0.2 | PID SMAD2 3PATHWAY | Regulation of cytoplasmic and nuclear SMAD2/3 signaling |
| 0.0 | 0.3 | PID ERBB2 ERBB3 PATHWAY | ErbB2/ErbB3 signaling events |
| 0.0 | 0.3 | PID CIRCADIAN PATHWAY | Circadian rhythm pathway |
| 0.0 | 0.3 | PID EPHA FWDPATHWAY | EPHA forward signaling |
| 0.0 | 0.7 | PID ECADHERIN NASCENT AJ PATHWAY | E-cadherin signaling in the nascent adherens junction |
| 0.0 | 0.5 | PID PS1 PATHWAY | Presenilin action in Notch and Wnt signaling |
| 0.0 | 0.2 | ST MYOCYTE AD PATHWAY | Myocyte Adrenergic Pathway is a specific case of the generalized Adrenergic Pathway. |
| 0.0 | 0.4 | PID RAC1 REG PATHWAY | Regulation of RAC1 activity |
| 0.0 | 0.6 | PID BCR 5PATHWAY | BCR signaling pathway |
| 0.0 | 0.0 | ST JAK STAT PATHWAY | Jak-STAT Pathway |
| 0.0 | 1.0 | PID RHOA REG PATHWAY | Regulation of RhoA activity |
| 0.0 | 0.3 | PID HEDGEHOG GLI PATHWAY | Hedgehog signaling events mediated by Gli proteins |
| 0.0 | 0.1 | SA PROGRAMMED CELL DEATH | Programmed cell death, or apoptosis, eliminates damaged or unneeded cells. |
| 0.0 | 0.4 | PID ECADHERIN STABILIZATION PATHWAY | Stabilization and expansion of the E-cadherin adherens junction |
| 0.0 | 0.6 | PID BMP PATHWAY | BMP receptor signaling |
| 0.0 | 0.2 | ST GA12 PATHWAY | G alpha 12 Pathway |
| 0.0 | 0.6 | PID HES HEY PATHWAY | Notch-mediated HES/HEY network |
| 0.0 | 0.7 | NABA COLLAGENS | Genes encoding collagen proteins |
| 0.0 | 0.4 | PID AJDISS 2PATHWAY | Posttranslational regulation of adherens junction stability and dissassembly |
| 0.0 | 0.1 | PID PRL SIGNALING EVENTS PATHWAY | Signaling events mediated by PRL |
| 0.0 | 0.0 | ST TUMOR NECROSIS FACTOR PATHWAY | Tumor Necrosis Factor Pathway. |
| 0.0 | 0.0 | PID PI3KCI AKT PATHWAY | Class I PI3K signaling events mediated by Akt |
| 0.0 | 0.4 | PID ATM PATHWAY | ATM pathway |
| 0.0 | 0.3 | PID RHOA PATHWAY | RhoA signaling pathway |
| 0.0 | 0.1 | PID MAPK TRK PATHWAY | Trk receptor signaling mediated by the MAPK pathway |
| 0.0 | 0.2 | PID TNF PATHWAY | TNF receptor signaling pathway |
| 0.0 | 0.2 | PID WNT SIGNALING PATHWAY | Wnt signaling network |
| 0.0 | 0.1 | PID ERB GENOMIC PATHWAY | Validated nuclear estrogen receptor beta network |
Gene overrepresentation in curated gene sets: REACTOME pathways category:
| Log-likelihood per target | Total log-likelihood | Term | Description |
|---|---|---|---|
| 0.1 | 0.1 | REACTOME TRANSPORT OF MATURE MRNA DERIVED FROM AN INTRONLESS TRANSCRIPT | Genes involved in Transport of Mature mRNA Derived from an Intronless Transcript |
| 0.1 | 1.7 | REACTOME ACTIVATION OF THE AP1 FAMILY OF TRANSCRIPTION FACTORS | Genes involved in Activation of the AP-1 family of transcription factors |
| 0.1 | 0.1 | REACTOME PECAM1 INTERACTIONS | Genes involved in PECAM1 interactions |
| 0.1 | 1.3 | REACTOME GLUTAMATE NEUROTRANSMITTER RELEASE CYCLE | Genes involved in Glutamate Neurotransmitter Release Cycle |
| 0.1 | 0.5 | REACTOME ALPHA LINOLENIC ACID ALA METABOLISM | Genes involved in alpha-linolenic acid (ALA) metabolism |
| 0.1 | 0.1 | REACTOME PLATELET CALCIUM HOMEOSTASIS | Genes involved in Platelet calcium homeostasis |
| 0.0 | 1.1 | REACTOME SIGNALING BY HIPPO | Genes involved in Signaling by Hippo |
| 0.0 | 0.2 | REACTOME DOPAMINE NEUROTRANSMITTER RELEASE CYCLE | Genes involved in Dopamine Neurotransmitter Release Cycle |
| 0.0 | 0.7 | REACTOME N GLYCAN ANTENNAE ELONGATION | Genes involved in N-Glycan antennae elongation |
| 0.0 | 0.3 | REACTOME TRANSPORT OF ORGANIC ANIONS | Genes involved in Transport of organic anions |
| 0.0 | 0.7 | REACTOME CREB PHOSPHORYLATION THROUGH THE ACTIVATION OF CAMKII | Genes involved in CREB phosphorylation through the activation of CaMKII |
| 0.0 | 0.4 | REACTOME REGULATION OF INSULIN SECRETION BY ACETYLCHOLINE | Genes involved in Regulation of Insulin Secretion by Acetylcholine |
| 0.0 | 1.5 | REACTOME SYNTHESIS OF PIPS AT THE PLASMA MEMBRANE | Genes involved in Synthesis of PIPs at the plasma membrane |
| 0.0 | 0.6 | REACTOME GABA A RECEPTOR ACTIVATION | Genes involved in GABA A receptor activation |
| 0.0 | 0.0 | REACTOME INHIBITION OF INSULIN SECRETION BY ADRENALINE NORADRENALINE | Genes involved in Inhibition of Insulin Secretion by Adrenaline/Noradrenaline |
| 0.0 | 0.3 | REACTOME SPRY REGULATION OF FGF SIGNALING | Genes involved in Spry regulation of FGF signaling |
| 0.0 | 0.4 | REACTOME ERKS ARE INACTIVATED | Genes involved in ERKs are inactivated |
| 0.0 | 0.6 | REACTOME JNK C JUN KINASES PHOSPHORYLATION AND ACTIVATION MEDIATED BY ACTIVATED HUMAN TAK1 | Genes involved in JNK (c-Jun kinases) phosphorylation and activation mediated by activated human TAK1 |
| 0.0 | 0.1 | REACTOME ACTIVATION OF NMDA RECEPTOR UPON GLUTAMATE BINDING AND POSTSYNAPTIC EVENTS | Genes involved in Activation of NMDA receptor upon glutamate binding and postsynaptic events |
| 0.0 | 0.1 | REACTOME DSCAM INTERACTIONS | Genes involved in DSCAM interactions |
| 0.0 | 0.9 | REACTOME TRAFFICKING OF AMPA RECEPTORS | Genes involved in Trafficking of AMPA receptors |
| 0.0 | 0.8 | REACTOME PRE NOTCH TRANSCRIPTION AND TRANSLATION | Genes involved in Pre-NOTCH Transcription and Translation |
| 0.0 | 0.4 | REACTOME SIGNAL ATTENUATION | Genes involved in Signal attenuation |
| 0.0 | 0.6 | REACTOME DOWNREGULATION OF SMAD2 3 SMAD4 TRANSCRIPTIONAL ACTIVITY | Genes involved in Downregulation of SMAD2/3:SMAD4 transcriptional activity |
| 0.0 | 1.5 | REACTOME NRAGE SIGNALS DEATH THROUGH JNK | Genes involved in NRAGE signals death through JNK |
| 0.0 | 0.1 | REACTOME DESTABILIZATION OF MRNA BY BRF1 | Genes involved in Destabilization of mRNA by Butyrate Response Factor 1 (BRF1) |
| 0.0 | 0.6 | REACTOME SIGNALING BY FGFR1 FUSION MUTANTS | Genes involved in Signaling by FGFR1 fusion mutants |
| 0.0 | 0.4 | REACTOME CS DS DEGRADATION | Genes involved in CS/DS degradation |
| 0.0 | 0.5 | REACTOME OTHER SEMAPHORIN INTERACTIONS | Genes involved in Other semaphorin interactions |
| 0.0 | 0.3 | REACTOME PLATELET ADHESION TO EXPOSED COLLAGEN | Genes involved in Platelet Adhesion to exposed collagen |
| 0.0 | 0.2 | REACTOME REGULATION OF SIGNALING BY CBL | Genes involved in Regulation of signaling by CBL |
| 0.0 | 0.5 | REACTOME ACTIVATION OF RAC | Genes involved in Activation of Rac |
| 0.0 | 0.0 | REACTOME PD1 SIGNALING | Genes involved in PD-1 signaling |
| 0.0 | 0.2 | REACTOME ROLE OF DCC IN REGULATING APOPTOSIS | Genes involved in Role of DCC in regulating apoptosis |
| 0.0 | 0.0 | REACTOME ACYL CHAIN REMODELLING OF PG | Genes involved in Acyl chain remodelling of PG |
| 0.0 | 0.5 | REACTOME NEPHRIN INTERACTIONS | Genes involved in Nephrin interactions |
| 0.0 | 0.2 | REACTOME SIGNAL REGULATORY PROTEIN SIRP FAMILY INTERACTIONS | Genes involved in Signal regulatory protein (SIRP) family interactions |
| 0.0 | 0.5 | REACTOME SIGNALING BY BMP | Genes involved in Signaling by BMP |
| 0.0 | 0.2 | REACTOME PHOSPHORYLATION OF CD3 AND TCR ZETA CHAINS | Genes involved in Phosphorylation of CD3 and TCR zeta chains |
| 0.0 | 0.6 | REACTOME SIGNALING BY ROBO RECEPTOR | Genes involved in Signaling by Robo receptor |
| 0.0 | 0.5 | REACTOME ACYL CHAIN REMODELLING OF PC | Genes involved in Acyl chain remodelling of PC |
| 0.0 | 0.3 | REACTOME EGFR DOWNREGULATION | Genes involved in EGFR downregulation |
| 0.0 | 0.4 | REACTOME EFFECTS OF PIP2 HYDROLYSIS | Genes involved in Effects of PIP2 hydrolysis |
| 0.0 | 0.3 | REACTOME GLUCURONIDATION | Genes involved in Glucuronidation |
| 0.0 | 0.0 | REACTOME RNA POL I TRANSCRIPTION TERMINATION | Genes involved in RNA Polymerase I Transcription Termination |
| 0.0 | 0.4 | REACTOME CD28 DEPENDENT PI3K AKT SIGNALING | Genes involved in CD28 dependent PI3K/Akt signaling |
| 0.0 | 0.1 | REACTOME N GLYCAN ANTENNAE ELONGATION IN THE MEDIAL TRANS GOLGI | Genes involved in N-glycan antennae elongation in the medial/trans-Golgi |
| 0.0 | 0.1 | REACTOME SIGNALING BY CONSTITUTIVELY ACTIVE EGFR | Genes involved in Signaling by constitutively active EGFR |
| 0.0 | 0.1 | REACTOME REGULATORY RNA PATHWAYS | Genes involved in Regulatory RNA pathways |
| 0.0 | 0.3 | REACTOME REGULATION OF COMPLEMENT CASCADE | Genes involved in Regulation of Complement cascade |
| 0.0 | 0.6 | REACTOME KINESINS | Genes involved in Kinesins |
| 0.0 | 0.0 | REACTOME NOREPINEPHRINE NEUROTRANSMITTER RELEASE CYCLE | Genes involved in Norepinephrine Neurotransmitter Release Cycle |
| 0.0 | 0.3 | REACTOME DEADENYLATION OF MRNA | Genes involved in Deadenylation of mRNA |
| 0.0 | 0.1 | REACTOME IL 6 SIGNALING | Genes involved in Interleukin-6 signaling |
| 0.0 | 0.3 | REACTOME RAP1 SIGNALLING | Genes involved in Rap1 signalling |
| 0.0 | 0.3 | REACTOME A TETRASACCHARIDE LINKER SEQUENCE IS REQUIRED FOR GAG SYNTHESIS | Genes involved in A tetrasaccharide linker sequence is required for GAG synthesis |
| 0.0 | 0.4 | REACTOME PROCESSING OF INTRONLESS PRE MRNAS | Genes involved in Processing of Intronless Pre-mRNAs |
| 0.0 | 0.2 | REACTOME PRE NOTCH EXPRESSION AND PROCESSING | Genes involved in Pre-NOTCH Expression and Processing |
| 0.0 | 0.2 | REACTOME G ALPHA1213 SIGNALLING EVENTS | Genes involved in G alpha (12/13) signalling events |
| 0.0 | 0.1 | REACTOME INFLUENZA VIRAL RNA TRANSCRIPTION AND REPLICATION | Genes involved in Influenza Viral RNA Transcription and Replication |
| 0.0 | 0.2 | REACTOME IONOTROPIC ACTIVITY OF KAINATE RECEPTORS | Genes involved in Ionotropic activity of Kainate Receptors |
| 0.0 | 0.1 | REACTOME CTLA4 INHIBITORY SIGNALING | Genes involved in CTLA4 inhibitory signaling |
| 0.0 | 0.4 | REACTOME TRANSPORT TO THE GOLGI AND SUBSEQUENT MODIFICATION | Genes involved in Transport to the Golgi and subsequent modification |
| 0.0 | 0.1 | REACTOME REGULATION OF INSULIN SECRETION BY GLUCAGON LIKE PEPTIDE1 | Genes involved in Regulation of Insulin Secretion by Glucagon-like Peptide-1 |
| 0.0 | 0.2 | REACTOME INTRINSIC PATHWAY | Genes involved in Intrinsic Pathway |
| 0.0 | 0.2 | REACTOME DCC MEDIATED ATTRACTIVE SIGNALING | Genes involved in DCC mediated attractive signaling |
| 0.0 | 0.2 | REACTOME REGULATION OF AMPK ACTIVITY VIA LKB1 | Genes involved in Regulation of AMPK activity via LKB1 |
| 0.0 | 0.2 | REACTOME CRMPS IN SEMA3A SIGNALING | Genes involved in CRMPs in Sema3A signaling |
| 0.0 | 0.3 | REACTOME NCAM1 INTERACTIONS | Genes involved in NCAM1 interactions |
| 0.0 | 1.1 | REACTOME ANTIVIRAL MECHANISM BY IFN STIMULATED GENES | Genes involved in Antiviral mechanism by IFN-stimulated genes |
| 0.0 | 0.4 | REACTOME MYOGENESIS | Genes involved in Myogenesis |
| 0.0 | 0.3 | REACTOME INSULIN SYNTHESIS AND PROCESSING | Genes involved in Insulin Synthesis and Processing |
| 0.0 | 0.3 | REACTOME HS GAG BIOSYNTHESIS | Genes involved in HS-GAG biosynthesis |
| 0.0 | 0.3 | REACTOME MITOCHONDRIAL TRNA AMINOACYLATION | Genes involved in Mitochondrial tRNA aminoacylation |
| 0.0 | 0.1 | REACTOME APOPTOTIC CLEAVAGE OF CELL ADHESION PROTEINS | Genes involved in Apoptotic cleavage of cell adhesion proteins |
| 0.0 | 0.2 | REACTOME ZINC TRANSPORTERS | Genes involved in Zinc transporters |
| 0.0 | 0.0 | REACTOME MRNA CAPPING | Genes involved in mRNA Capping |
| 0.0 | 0.2 | REACTOME SYNTHESIS OF SUBSTRATES IN N GLYCAN BIOSYTHESIS | Genes involved in Synthesis of substrates in N-glycan biosythesis |
| 0.0 | 0.5 | REACTOME INTERFERON ALPHA BETA SIGNALING | Genes involved in Interferon alpha/beta signaling |
| 0.0 | 0.3 | REACTOME NETRIN1 SIGNALING | Genes involved in Netrin-1 signaling |
| 0.0 | 0.2 | REACTOME VITAMIN B5 PANTOTHENATE METABOLISM | Genes involved in Vitamin B5 (pantothenate) metabolism |
| 0.0 | 0.7 | REACTOME COLLAGEN FORMATION | Genes involved in Collagen formation |
| 0.0 | 0.1 | REACTOME DESTABILIZATION OF MRNA BY KSRP | Genes involved in Destabilization of mRNA by KSRP |
| 0.0 | 0.2 | REACTOME REGULATION OF PYRUVATE DEHYDROGENASE PDH COMPLEX | Genes involved in Regulation of pyruvate dehydrogenase (PDH) complex |
| 0.0 | 0.2 | REACTOME DEGRADATION OF THE EXTRACELLULAR MATRIX | Genes involved in Degradation of the extracellular matrix |
| 0.0 | 0.3 | REACTOME INHIBITION OF VOLTAGE GATED CA2 CHANNELS VIA GBETA GAMMA SUBUNITS | Genes involved in Inhibition of voltage gated Ca2+ channels via Gbeta/gamma subunits |
| 0.0 | 0.2 | REACTOME MRNA DECAY BY 5 TO 3 EXORIBONUCLEASE | Genes involved in mRNA Decay by 5' to 3' Exoribonuclease |
| 0.0 | 0.1 | REACTOME INHIBITION OF REPLICATION INITIATION OF DAMAGED DNA BY RB1 E2F1 | Genes involved in Inhibition of replication initiation of damaged DNA by RB1/E2F1 |