Project
GSE49485: Hypoxia transcriptome sequencing of rat brain.
Navigation
Downloads
Results for Sox6_Sox9
Z-value: 0.49
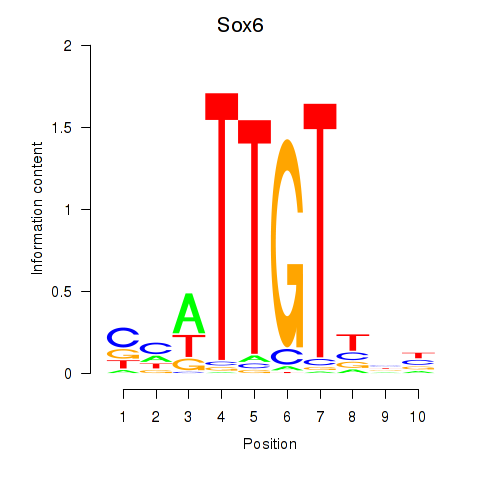
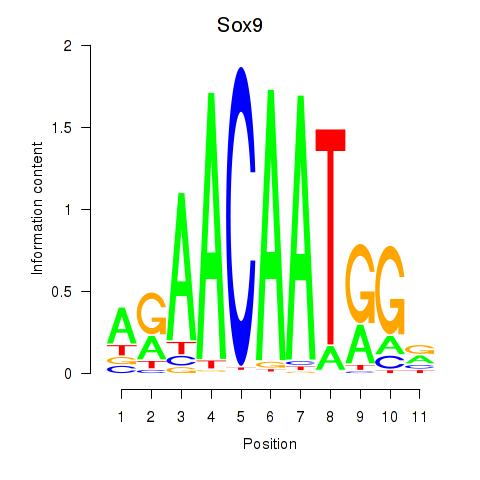
Motif logo
Transcription factors associated with Sox6_Sox9
| Gene Symbol | Gene ID | Gene Info |
|---|---|---|
|
Sox6
|
ENSRNOG00000020514 | SRY box 6 |
|
Sox9
|
ENSRNOG00000002607 | SRY box 9 |
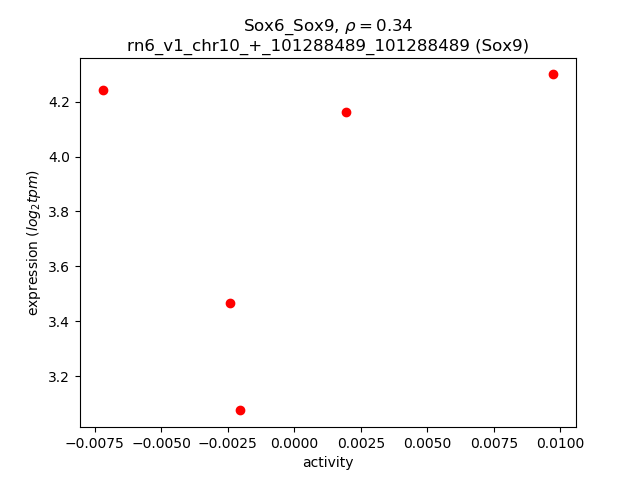
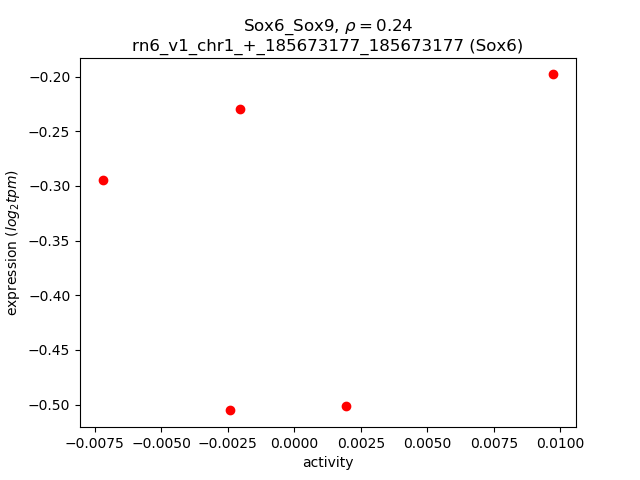
Activity-expression correlation:
| Gene | Promoter | Pearson corr. coef. | P-value | Plot |
|---|---|---|---|---|
| Sox9 | rn6_v1_chr10_+_101288489_101288489 | 0.34 | 5.8e-01 | Click! |
| Sox6 | rn6_v1_chr1_+_185673177_185673177 | 0.24 | 6.9e-01 | Click! |
Activity profile of Sox6_Sox9 motif
Sorted Z-values of Sox6_Sox9 motif
| Promoter | Log-likelihood | Transcript | Gene | Gene Info |
|---|---|---|---|---|
| chr18_-_26211445 | 0.31 |
ENSRNOT00000027739
|
Nrep
|
neuronal regeneration related protein |
| chr17_-_57394985 | 0.22 |
ENSRNOT00000019968
|
Epc1
|
enhancer of polycomb homolog 1 |
| chr3_+_155160481 | 0.22 |
ENSRNOT00000021133
|
Ppp1r16b
|
protein phosphatase 1, regulatory subunit 16B |
| chr1_-_190965115 | 0.20 |
ENSRNOT00000023483
|
AC103221.1
|
|
| chr8_+_5967463 | 0.19 |
ENSRNOT00000086251
|
Tmem123
|
transmembrane protein 123 |
| chr4_+_84423653 | 0.18 |
ENSRNOT00000012655
|
Chn2
|
chimerin 2 |
| chr8_-_68038533 | 0.18 |
ENSRNOT00000018756
|
Skor1
|
SKI family transcriptional corepressor 1 |
| chr18_+_30562178 | 0.15 |
ENSRNOT00000040998
|
LOC108348771
|
protocadherin beta-16-like |
| chr18_+_30890869 | 0.15 |
ENSRNOT00000060466
|
Pcdhgb6
|
protocadherin gamma subfamily B, 6 |
| chr6_+_110624856 | 0.13 |
ENSRNOT00000014017
|
Vash1
|
vasohibin 1 |
| chr7_+_99954492 | 0.13 |
ENSRNOT00000005885
|
Trib1
|
tribbles pseudokinase 1 |
| chr10_+_14547172 | 0.13 |
ENSRNOT00000092043
|
Unkl
|
unkempt family like zinc finger |
| chr1_-_277902279 | 0.13 |
ENSRNOT00000078416
|
Ablim1
|
actin-binding LIM protein 1 |
| chr11_+_16826399 | 0.13 |
ENSRNOT00000050701
|
Cxadr
|
coxsackie virus and adenovirus receptor |
| chr9_+_46657575 | 0.12 |
ENSRNOT00000083322
|
Map4k4
|
mitogen-activated protein kinase kinase kinase kinase 4 |
| chr10_+_82823918 | 0.12 |
ENSRNOT00000005519
|
Samd14
|
sterile alpha motif domain containing 14 |
| chr16_-_71319449 | 0.12 |
ENSRNOT00000029284
|
Fgfr1
|
Fibroblast growth factor receptor 1 |
| chr8_-_6203515 | 0.12 |
ENSRNOT00000087278
ENSRNOT00000031189 ENSRNOT00000008074 ENSRNOT00000085285 ENSRNOT00000007866 |
Yap1
|
yes-associated protein 1 |
| chr9_-_100253609 | 0.12 |
ENSRNOT00000036061
|
Kif1a
|
kinesin family member 1A |
| chr3_+_103773459 | 0.12 |
ENSRNOT00000079727
|
Slc12a6
|
solute carrier family 12, member 6 |
| chr1_+_236580034 | 0.11 |
ENSRNOT00000074939
|
Gcnt1
|
glucosaminyl (N-acetyl) transferase 1, core 2 |
| chrX_-_73778595 | 0.11 |
ENSRNOT00000076081
ENSRNOT00000075926 ENSRNOT00000003782 |
Rlim
|
ring finger protein, LIM domain interacting |
| chr6_+_147876237 | 0.11 |
ENSRNOT00000056649
|
Tmem196
|
transmembrane protein 196 |
| chr18_+_30826260 | 0.11 |
ENSRNOT00000065235
|
Pcdhgb1
|
protocadherin gamma subfamily B, 1 |
| chr10_-_18131562 | 0.10 |
ENSRNOT00000006676
|
Tlx3
|
T-cell leukemia, homeobox 3 |
| chr2_+_2729829 | 0.10 |
ENSRNOT00000017068
|
Spata9
|
spermatogenesis associated 9 |
| chr3_-_9936352 | 0.10 |
ENSRNOT00000011224
ENSRNOT00000042798 |
Fnbp1
|
formin binding protein 1 |
| chr3_+_48082935 | 0.09 |
ENSRNOT00000087711
ENSRNOT00000067545 |
Slc4a10
|
solute carrier family 4 member 10 |
| chr6_+_106052212 | 0.09 |
ENSRNOT00000010626
|
Sipa1l1
|
signal-induced proliferation-associated 1 like 1 |
| chr4_-_88565292 | 0.09 |
ENSRNOT00000008948
|
Lancl2
|
LanC like 2 |
| chr19_-_26053762 | 0.09 |
ENSRNOT00000004646
|
MAST1
|
microtubule associated serine/threonine kinase 1 |
| chr6_-_79306443 | 0.09 |
ENSRNOT00000030706
|
Clec14a
|
C-type lectin domain family 14, member A |
| chr18_+_30435119 | 0.09 |
ENSRNOT00000027190
|
Pcdhb8
|
protocadherin beta 8 |
| chr16_-_7538201 | 0.09 |
ENSRNOT00000082172
|
Sh3bp5
|
SH3-domain binding protein 5 |
| chr4_+_145264462 | 0.09 |
ENSRNOT00000011246
|
Brpf1
|
bromodomain and PHD finger containing, 1 |
| chr8_+_69971778 | 0.09 |
ENSRNOT00000058007
ENSRNOT00000037941 ENSRNOT00000050649 |
Megf11
|
multiple EGF-like-domains 11 |
| chr5_+_21830882 | 0.09 |
ENSRNOT00000008901
|
Chd7
|
chromodomain helicase DNA binding protein 7 |
| chr1_+_177093387 | 0.09 |
ENSRNOT00000021858
|
Mical2
|
microtubule associated monooxygenase, calponin and LIM domain containing 2 |
| chr17_+_18151982 | 0.09 |
ENSRNOT00000066447
|
Kif13a
|
kinesin family member 13A |
| chr7_-_114305896 | 0.09 |
ENSRNOT00000067327
ENSRNOT00000038172 |
Trappc9
|
trafficking protein particle complex 9 |
| chr4_+_68656928 | 0.09 |
ENSRNOT00000016232
|
Tas2r108
|
taste receptor, type 2, member 108 |
| chr10_+_23661013 | 0.08 |
ENSRNOT00000076664
|
Ebf1
|
early B-cell factor 1 |
| chr5_-_153625869 | 0.08 |
ENSRNOT00000024464
|
Clic4
|
chloride intracellular channel 4 |
| chr17_+_70684134 | 0.08 |
ENSRNOT00000025731
ENSRNOT00000068354 |
Pfkfb3
|
6-phosphofructo-2-kinase/fructose-2,6-biphosphatase 3 |
| chr7_-_107768072 | 0.08 |
ENSRNOT00000093189
|
Ndrg1
|
N-myc downstream regulated 1 |
| chr14_-_81399353 | 0.08 |
ENSRNOT00000018340
|
Add1
|
adducin 1 |
| chr17_+_70684539 | 0.08 |
ENSRNOT00000025700
|
Pfkfb3
|
6-phosphofructo-2-kinase/fructose-2,6-biphosphatase 3 |
| chr8_+_59457018 | 0.08 |
ENSRNOT00000017900
|
Ireb2
|
iron responsive element binding protein 2 |
| chr4_-_123713319 | 0.07 |
ENSRNOT00000012875
ENSRNOT00000086982 |
Slc6a6
|
solute carrier family 6 member 6 |
| chr9_+_14551758 | 0.07 |
ENSRNOT00000017157
|
Nfya
|
nuclear transcription factor Y subunit alpha |
| chr1_+_31124825 | 0.07 |
ENSRNOT00000092105
|
AABR07000989.1
|
|
| chr4_-_11610518 | 0.07 |
ENSRNOT00000066643
|
Magi2
|
membrane associated guanylate kinase, WW and PDZ domain containing 2 |
| chr2_+_104744461 | 0.07 |
ENSRNOT00000016083
ENSRNOT00000082627 |
Cp
|
ceruloplasmin |
| chr7_-_70467915 | 0.07 |
ENSRNOT00000088995
|
Slc26a10
|
solute carrier family 26, member 10 |
| chr10_-_90393317 | 0.07 |
ENSRNOT00000028563
|
Fam171a2
|
family with sequence similarity 171, member A2 |
| chr8_-_62987182 | 0.07 |
ENSRNOT00000070885
|
Islr2
|
immunoglobulin superfamily containing leucine-rich repeat 2 |
| chr18_+_30913842 | 0.07 |
ENSRNOT00000026947
|
Pcdhgc3
|
protocadherin gamma subfamily C, 3 |
| chr13_-_70922245 | 0.07 |
ENSRNOT00000064860
|
Dhx9
|
DExH-box helicase 9 |
| chr5_+_152606847 | 0.07 |
ENSRNOT00000089070
|
Pafah2
|
platelet-activating factor acetylhydrolase 2 |
| chr14_+_17492081 | 0.07 |
ENSRNOT00000003346
|
G3bp2
|
G3BP stress granule assembly factor 2 |
| chr3_-_156777999 | 0.07 |
ENSRNOT00000032588
ENSRNOT00000091208 |
Zhx3
|
zinc fingers and homeoboxes 3 |
| chr5_-_86696388 | 0.06 |
ENSRNOT00000007812
|
Megf9
|
multiple EGF-like-domains 9 |
| chr3_+_116899878 | 0.06 |
ENSRNOT00000090802
ENSRNOT00000066101 |
Sema6d
|
semaphorin 6D |
| chr18_+_30869628 | 0.06 |
ENSRNOT00000060470
|
Pcdhgb4
|
protocadherin gamma subfamily B, 4 |
| chr12_+_38303624 | 0.06 |
ENSRNOT00000001668
|
Zcchc8
|
zinc finger CCHC-type containing 8 |
| chr3_+_162357356 | 0.06 |
ENSRNOT00000030119
|
Eya2
|
EYA transcriptional coactivator and phosphatase 2 |
| chr5_-_139748489 | 0.06 |
ENSRNOT00000078741
|
Nfyc
|
nuclear transcription factor Y subunit gamma |
| chr18_+_15467870 | 0.06 |
ENSRNOT00000091696
|
B4galt6
|
beta-1,4-galactosyltransferase 6 |
| chr9_+_6966908 | 0.06 |
ENSRNOT00000072796
|
St6gal2
|
ST6 beta-galactoside alpha-2,6-sialyltransferase 2 |
| chr1_+_13595295 | 0.06 |
ENSRNOT00000079250
|
Nhsl1
|
NHS-like 1 |
| chr4_-_180234804 | 0.06 |
ENSRNOT00000070957
|
Bhlhe41
|
basic helix-loop-helix family, member e41 |
| chr9_-_85528860 | 0.06 |
ENSRNOT00000063834
ENSRNOT00000088963 |
Wdfy1
|
WD repeat and FYVE domain containing 1 |
| chr6_-_42473738 | 0.06 |
ENSRNOT00000033327
|
Kcnf1
|
potassium voltage-gated channel modifier subfamily F member 1 |
| chr14_+_11198896 | 0.06 |
ENSRNOT00000079767
|
Hnrnpdl
|
heterogeneous nuclear ribonucleoprotein D-like |
| chr16_-_71319052 | 0.06 |
ENSRNOT00000050980
|
Fgfr1
|
Fibroblast growth factor receptor 1 |
| chr12_+_23473270 | 0.06 |
ENSRNOT00000001935
|
Sh2b2
|
SH2B adaptor protein 2 |
| chr14_-_84106997 | 0.06 |
ENSRNOT00000065501
|
Osbp2
|
oxysterol binding protein 2 |
| chr4_+_44774741 | 0.06 |
ENSRNOT00000086902
|
Met
|
MET proto-oncogene, receptor tyrosine kinase |
| chr14_-_104960141 | 0.06 |
ENSRNOT00000056944
|
Aftph
|
aftiphilin |
| chr15_-_3773340 | 0.06 |
ENSRNOT00000063831
|
LOC103689945
|
zinc finger SWIM domain-containing protein 8-like |
| chr14_-_82287108 | 0.06 |
ENSRNOT00000023144
|
Fgfr3
|
fibroblast growth factor receptor 3 |
| chr18_+_30900291 | 0.06 |
ENSRNOT00000060461
|
Pcdhgb7
|
protocadherin gamma subfamily B, 7 |
| chr15_-_24374753 | 0.05 |
ENSRNOT00000016274
|
Atg14
|
autophagy related 14 |
| chr7_+_141702038 | 0.05 |
ENSRNOT00000086577
|
Dip2b
|
disco-interacting protein 2 homolog B |
| chr18_-_16497886 | 0.05 |
ENSRNOT00000021624
|
Rprd1a
|
regulation of nuclear pre-mRNA domain containing 1A |
| chr14_+_2613406 | 0.05 |
ENSRNOT00000000083
|
Tmed5
|
transmembrane p24 trafficking protein 5 |
| chr4_+_170518673 | 0.05 |
ENSRNOT00000011803
|
Atf7ip
|
activating transcription factor 7 interacting protein |
| chr18_+_30880020 | 0.05 |
ENSRNOT00000060468
|
Pcdhgb5
|
protocadherin gamma subfamily B, 5 |
| chr6_-_125723732 | 0.05 |
ENSRNOT00000084815
|
Fbln5
|
fibulin 5 |
| chr8_-_82533689 | 0.05 |
ENSRNOT00000014124
|
Tmod2
|
tropomodulin 2 |
| chr7_-_117587103 | 0.05 |
ENSRNOT00000035423
|
Scrt1
|
scratch family transcriptional repressor 1 |
| chr8_+_128824508 | 0.05 |
ENSRNOT00000025343
|
Mobp
|
myelin-associated oligodendrocyte basic protein |
| chr3_+_14990652 | 0.05 |
ENSRNOT00000090735
|
Dab2ip
|
DAB2 interacting protein |
| chr19_+_39543242 | 0.05 |
ENSRNOT00000018837
|
Wwp2
|
WW domain containing E3 ubiquitin protein ligase 2 |
| chr12_-_13668515 | 0.05 |
ENSRNOT00000086847
|
Fscn1
|
fascin actin-bundling protein 1 |
| chr1_-_89042176 | 0.05 |
ENSRNOT00000080842
|
Kmt2b
|
lysine methyltransferase 2B |
| chr2_-_62634785 | 0.05 |
ENSRNOT00000017937
|
Pdzd2
|
PDZ domain containing 2 |
| chr4_+_155321553 | 0.05 |
ENSRNOT00000089614
|
Mfap5
|
microfibrillar associated protein 5 |
| chr8_+_129617812 | 0.05 |
ENSRNOT00000079085
|
Ctnnb1
|
catenin beta 1 |
| chr5_+_78483893 | 0.05 |
ENSRNOT00000059183
ENSRNOT00000059181 |
Rgs3
|
regulator of G-protein signaling 3 |
| chr12_+_40018937 | 0.05 |
ENSRNOT00000001697
|
Cux2
|
cut-like homeobox 2 |
| chr3_+_148510779 | 0.05 |
ENSRNOT00000012156
|
Xkr7
|
XK related 7 |
| chr10_+_109773890 | 0.04 |
ENSRNOT00000071823
|
AC131537.1
|
|
| chrX_+_65271366 | 0.04 |
ENSRNOT00000093499
|
Msn
|
moesin |
| chr9_+_62291809 | 0.04 |
ENSRNOT00000090621
|
Plcl1
|
phospholipase C-like 1 |
| chr16_+_74237001 | 0.04 |
ENSRNOT00000026039
|
Polb
|
DNA polymerase beta |
| chr4_+_118207862 | 0.04 |
ENSRNOT00000085787
ENSRNOT00000023103 |
Tia1
|
TIA1 cytotoxic granule-associated RNA binding protein |
| chr10_+_47930633 | 0.04 |
ENSRNOT00000003515
|
Grap
|
GRB2-related adaptor protein |
| chr7_-_15301382 | 0.04 |
ENSRNOT00000081512
|
Zfp763
|
zinc finger protein 763 |
| chr17_+_35435079 | 0.04 |
ENSRNOT00000074800
|
Exoc2
|
exocyst complex component 2 |
| chr16_-_19791832 | 0.04 |
ENSRNOT00000040393
|
Ushbp1
|
USH1 protein network component harmonin binding protein 1 |
| chrX_+_62727755 | 0.04 |
ENSRNOT00000077055
|
Pcyt1b
|
phosphate cytidylyltransferase 1, choline, beta |
| chr9_-_28972835 | 0.04 |
ENSRNOT00000086967
ENSRNOT00000079684 |
Rims1
|
regulating synaptic membrane exocytosis 1 |
| chr6_-_125723944 | 0.04 |
ENSRNOT00000007004
|
Fbln5
|
fibulin 5 |
| chr1_+_264741911 | 0.04 |
ENSRNOT00000019956
|
Sema4g
|
semaphorin 4G |
| chr2_+_198006316 | 0.04 |
ENSRNOT00000081383
ENSRNOT00000056289 |
Aph1a
|
aph-1 homolog A, gamma secretase subunit |
| chr2_+_188087486 | 0.04 |
ENSRNOT00000027455
|
Rit1
|
Ras-like without CAAX 1 |
| chr10_-_103340922 | 0.04 |
ENSRNOT00000004191
|
Btbd17
|
BTB domain containing 17 |
| chr18_+_30875011 | 0.04 |
ENSRNOT00000027009
|
Pcdhga8
|
protocadherin gamma subfamily A, 8 |
| chr10_+_81913689 | 0.04 |
ENSRNOT00000003780
|
Tob1
|
transducer of ErbB-2.1 |
| chr4_-_125929002 | 0.04 |
ENSRNOT00000083271
|
Magi1
|
membrane associated guanylate kinase, WW and PDZ domain containing 1 |
| chr1_-_174289647 | 0.04 |
ENSRNOT00000064902
|
St5
|
suppression of tumorigenicity 5 |
| chr7_+_12144162 | 0.04 |
ENSRNOT00000077122
|
Tcf3
|
transcription factor 3 |
| chr18_-_38088457 | 0.04 |
ENSRNOT00000077814
|
Jakmip2
|
janus kinase and microtubule interacting protein 2 |
| chr4_+_158088505 | 0.04 |
ENSRNOT00000026643
|
Vwf
|
von Willebrand factor |
| chr3_+_3767394 | 0.04 |
ENSRNOT00000067840
|
Gpsm1
|
G-protein signaling modulator 1 |
| chr9_-_80167033 | 0.03 |
ENSRNOT00000023530
|
Igfbp5
|
insulin-like growth factor binding protein 5 |
| chr2_-_187401786 | 0.03 |
ENSRNOT00000025624
|
Hapln2
|
hyaluronan and proteoglycan link protein 2 |
| chr2_+_77868412 | 0.03 |
ENSRNOT00000065897
ENSRNOT00000014022 |
Myo10
|
myosin X |
| chr13_+_24823488 | 0.03 |
ENSRNOT00000019907
|
Cdh20
|
cadherin 20 |
| chr5_+_113725717 | 0.03 |
ENSRNOT00000032248
|
Tek
|
TEK receptor tyrosine kinase |
| chr3_-_72052990 | 0.03 |
ENSRNOT00000064009
ENSRNOT00000081400 |
Ctnnd1
|
catenin delta 1 |
| chr18_+_79773608 | 0.03 |
ENSRNOT00000088484
|
Zfp516
|
zinc finger protein 516 |
| chr10_-_35800120 | 0.03 |
ENSRNOT00000004361
|
Maml1
|
mastermind-like transcriptional coactivator 1 |
| chr7_-_120490061 | 0.03 |
ENSRNOT00000016247
|
Slc16a8
|
solute carrier family 16 member 8 |
| chr20_+_10123651 | 0.03 |
ENSRNOT00000001559
|
Pde9a
|
phosphodiesterase 9A |
| chr2_-_165739874 | 0.03 |
ENSRNOT00000014384
|
Kpna4
|
karyopherin subunit alpha 4 |
| chr18_+_30574627 | 0.03 |
ENSRNOT00000060484
|
Pcdhb19
|
protocadherin beta 19 |
| chr12_-_29743705 | 0.03 |
ENSRNOT00000001185
|
Caln1
|
calneuron 1 |
| chr14_+_84150908 | 0.03 |
ENSRNOT00000005516
|
Dusp18
|
dual specificity phosphatase 18 |
| chr7_-_63407241 | 0.03 |
ENSRNOT00000024679
|
Tbc1d30
|
TBC1 domain family, member 30 |
| chr18_+_30550877 | 0.03 |
ENSRNOT00000027164
|
LOC108348201
|
protocadherin beta-7-like |
| chr7_-_18612118 | 0.03 |
ENSRNOT00000078122
ENSRNOT00000010197 |
Rab11b
|
RAB11B, member RAS oncogene family |
| chr5_+_104394119 | 0.03 |
ENSRNOT00000093557
ENSRNOT00000093462 |
Adamtsl1
|
ADAMTS-like 1 |
| chr10_-_16731898 | 0.03 |
ENSRNOT00000028186
|
Crebrf
|
CREB3 regulatory factor |
| chr15_+_41927241 | 0.03 |
ENSRNOT00000012035
|
Trim13
|
tripartite motif-containing 13 |
| chr18_+_30474947 | 0.03 |
ENSRNOT00000027188
|
Pcdhb9
|
protocadherin beta 9 |
| chr12_+_30198822 | 0.03 |
ENSRNOT00000041645
|
Gusb
|
glucuronidase, beta |
| chr20_-_38985036 | 0.02 |
ENSRNOT00000001066
|
Serinc1
|
serine incorporator 1 |
| chr2_+_58448917 | 0.02 |
ENSRNOT00000082562
|
Ranbp3l
|
RAN binding protein 3-like |
| chr2_-_104133985 | 0.02 |
ENSRNOT00000088167
ENSRNOT00000067725 |
Pde7a
|
phosphodiesterase 7A |
| chr14_+_11199404 | 0.02 |
ENSRNOT00000003106
|
Hnrnpdl
|
heterogeneous nuclear ribonucleoprotein D-like |
| chr4_-_51199570 | 0.02 |
ENSRNOT00000010788
|
Slc13a1
|
solute carrier family 13 member 1 |
| chr18_+_30909490 | 0.02 |
ENSRNOT00000026967
|
Pcdhgb8
|
protocadherin gamma subfamily B, 8 |
| chr4_+_78240385 | 0.02 |
ENSRNOT00000011041
|
Zfp775
|
zinc finger protein 775 |
| chr6_-_105518725 | 0.02 |
ENSRNOT00000009693
ENSRNOT00000083488 |
Map3k9
|
mitogen-activated protein kinase kinase kinase 9 |
| chr8_-_39551700 | 0.02 |
ENSRNOT00000091894
ENSRNOT00000076025 |
Pknox2
|
PBX/knotted 1 homeobox 2 |
| chr4_-_184096806 | 0.02 |
ENSRNOT00000055433
|
LOC100362344
|
mKIAA1238 protein-like |
| chr19_-_43714418 | 0.02 |
ENSRNOT00000047179
|
Wdr59
|
WD repeat domain 59 |
| chr4_-_115157263 | 0.02 |
ENSRNOT00000015296
|
Tet3
|
tet methylcytosine dioxygenase 3 |
| chr13_-_72789841 | 0.02 |
ENSRNOT00000004694
|
Mr1
|
major histocompatibility complex, class I-related |
| chr1_+_65564173 | 0.02 |
ENSRNOT00000038860
|
Zbtb45
|
zinc finger and BTB domain containing 45 |
| chr5_-_124642569 | 0.02 |
ENSRNOT00000010680
|
Prkaa2
|
protein kinase AMP-activated catalytic subunit alpha 2 |
| chr3_-_11417546 | 0.02 |
ENSRNOT00000018776
|
Lcn2
|
lipocalin 2 |
| chr6_+_111180108 | 0.02 |
ENSRNOT00000082027
|
Gstz1
|
glutathione S-transferase zeta 1 |
| chr10_+_36715565 | 0.02 |
ENSRNOT00000005048
|
Clk4
|
CDC-like kinase 4 |
| chr8_-_111101416 | 0.02 |
ENSRNOT00000084413
|
Cep63
|
centrosomal protein 63 |
| chr14_-_36208278 | 0.02 |
ENSRNOT00000045050
ENSRNOT00000088448 |
Fip1l1
|
factor interacting with PAPOLA and CPSF1 |
| chr2_+_123617794 | 0.02 |
ENSRNOT00000080632
|
RGD1307100
|
similar to RIKEN cDNA D630029K19 |
| chr13_+_113692131 | 0.02 |
ENSRNOT00000057160
|
Cd34
|
CD34 molecule |
| chr1_+_221236773 | 0.02 |
ENSRNOT00000051979
|
Slc25a45
|
solute carrier family 25, member 45 |
| chr6_+_134844676 | 0.02 |
ENSRNOT00000007595
|
Ppp2r5c
|
protein phosphatase 2, regulatory subunit B', gamma |
| chr2_-_117454769 | 0.02 |
ENSRNOT00000068381
|
Mecom
|
MDS1 and EVI1 complex locus |
| chr15_-_29369504 | 0.02 |
ENSRNOT00000060297
|
AABR07017624.1
|
|
| chr1_-_126211439 | 0.02 |
ENSRNOT00000014988
|
Tjp1
|
tight junction protein 1 |
| chr2_+_205553163 | 0.02 |
ENSRNOT00000039572
|
Nras
|
neuroblastoma RAS viral oncogene homolog |
| chr7_+_66717267 | 0.02 |
ENSRNOT00000005654
|
Mon2
|
MON2 homolog, regulator of endosome-to-Golgi trafficking |
| chr9_-_16795887 | 0.02 |
ENSRNOT00000071609
|
Cd79al
|
Cd79a molecule-like |
| chr9_-_28973246 | 0.02 |
ENSRNOT00000091865
ENSRNOT00000015453 |
Rims1
|
regulating synaptic membrane exocytosis 1 |
| chr18_+_76559811 | 0.02 |
ENSRNOT00000084621
|
Pard6g
|
par-6 family cell polarity regulator gamma |
| chr10_+_19366793 | 0.02 |
ENSRNOT00000050610
|
Fam196b
|
family with sequence similarity 196, member B |
| chr4_-_164051812 | 0.02 |
ENSRNOT00000085719
|
AABR07062183.1
|
|
| chr1_-_167911961 | 0.02 |
ENSRNOT00000025097
|
Olr59
|
olfactory receptor 59 |
| chr8_+_117620317 | 0.02 |
ENSRNOT00000084220
|
Celsr3
|
cadherin, EGF LAG seven-pass G-type receptor 3 |
| chrX_+_65566047 | 0.02 |
ENSRNOT00000092103
|
Heph
|
hephaestin |
| chr10_-_104482838 | 0.02 |
ENSRNOT00000007246
|
Recql5
|
RecQ like helicase 5 |
| chr2_+_248715281 | 0.02 |
ENSRNOT00000089648
|
Gtf2b
|
general transcription factor IIB |
| chr1_+_267359830 | 0.02 |
ENSRNOT00000015495
|
Slk
|
STE20-like kinase |
| chr4_-_72143748 | 0.01 |
ENSRNOT00000024428
|
Tcaf1
|
TRPM8 channel-associated factor 1 |
| chr15_-_2731462 | 0.01 |
ENSRNOT00000018023
|
Samd8
|
sterile alpha motif domain containing 8 |
| chr4_-_77489535 | 0.01 |
ENSRNOT00000008728
|
Pdia4
|
protein disulfide isomerase family A, member 4 |
| chr6_-_1622196 | 0.01 |
ENSRNOT00000007492
|
Prkd3
|
protein kinase D3 |
| chr8_-_87158368 | 0.01 |
ENSRNOT00000077071
|
Col12a1
|
collagen type XII alpha 1 chain |
| chr5_-_79222687 | 0.01 |
ENSRNOT00000010516
|
Akna
|
AT-hook transcription factor |
| chr16_-_71203609 | 0.01 |
ENSRNOT00000088458
|
Nsd3
|
nuclear receptor binding SET domain protein 3 |
| chr9_-_15582556 | 0.01 |
ENSRNOT00000020516
|
RGD1561662
|
similar to AI661453 protein |
| chr6_+_147876557 | 0.01 |
ENSRNOT00000080090
|
Tmem196
|
transmembrane protein 196 |
| chr1_+_13261876 | 0.01 |
ENSRNOT00000090703
|
Reps1
|
RALBP1 associated Eps domain containing 1 |
| chr5_+_160095427 | 0.01 |
ENSRNOT00000077609
|
AABR07050298.1
|
|
| chr1_-_185569190 | 0.01 |
ENSRNOT00000090773
|
RGD1311703
|
similar to sid2057p |
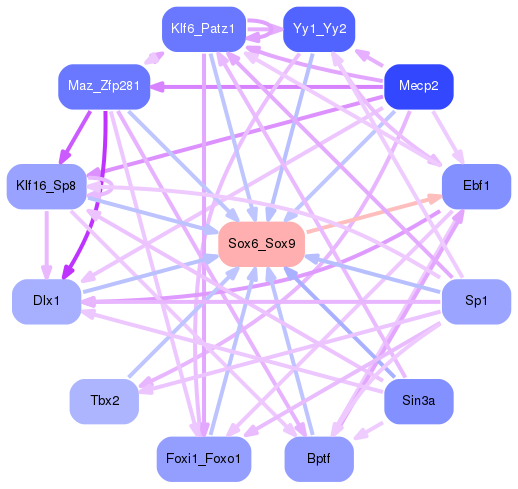
Network of associatons between targets according to the STRING database.

First level regulatory network of Sox6_Sox9
Gene Ontology Analysis
Gene overrepresentation in biological process category:
| Log-likelihood per target | Total log-likelihood | Term | Description |
|---|---|---|---|
| 0.1 | 0.2 | GO:1902309 | negative regulation of peptidyl-serine dephosphorylation(GO:1902309) |
| 0.1 | 0.2 | GO:0035607 | ventricular zone neuroblast division(GO:0021847) fibroblast growth factor receptor signaling pathway involved in orbitofrontal cortex development(GO:0035607) |
| 0.0 | 0.1 | GO:0071477 | hypotonic salinity response(GO:0042539) cellular hypotonic salinity response(GO:0071477) |
| 0.0 | 0.1 | GO:1900095 | random inactivation of X chromosome(GO:0060816) regulation of dosage compensation by inactivation of X chromosome(GO:1900095) |
| 0.0 | 0.1 | GO:1901491 | negative regulation of lymphangiogenesis(GO:1901491) |
| 0.0 | 0.1 | GO:1901421 | positive regulation of response to alcohol(GO:1901421) |
| 0.0 | 0.1 | GO:0019417 | sulfur oxidation(GO:0019417) |
| 0.0 | 0.1 | GO:0045658 | regulation of neutrophil differentiation(GO:0045658) |
| 0.0 | 0.1 | GO:0031632 | positive regulation of synaptic vesicle fusion to presynaptic membrane(GO:0031632) |
| 0.0 | 0.1 | GO:0060665 | regulation of branching involved in salivary gland morphogenesis by mesenchymal-epithelial signaling(GO:0060665) |
| 0.0 | 0.1 | GO:0098904 | regulation of AV node cell action potential(GO:0098904) |
| 0.0 | 0.1 | GO:0060449 | bud elongation involved in lung branching(GO:0060449) |
| 0.0 | 0.1 | GO:1903608 | protein localization to cytoplasmic stress granule(GO:1903608) |
| 0.0 | 0.1 | GO:1904798 | positive regulation of core promoter binding(GO:1904798) |
| 0.0 | 0.1 | GO:0072383 | plus-end-directed vesicle transport along microtubule(GO:0072383) plus-end-directed organelle transport along microtubule(GO:0072386) |
| 0.0 | 0.1 | GO:0016240 | autophagosome docking(GO:0016240) |
| 0.0 | 0.1 | GO:1901552 | positive regulation of endothelial cell development(GO:1901552) positive regulation of establishment of endothelial barrier(GO:1903142) |
| 0.0 | 0.0 | GO:0036324 | vascular endothelial growth factor receptor-2 signaling pathway(GO:0036324) |
| 0.0 | 0.1 | GO:0034141 | positive regulation of toll-like receptor 3 signaling pathway(GO:0034141) |
| 0.0 | 0.2 | GO:0043968 | histone H2A acetylation(GO:0043968) |
| 0.0 | 0.1 | GO:0061144 | alveolar secondary septum development(GO:0061144) |
| 0.0 | 0.2 | GO:0001675 | acrosome assembly(GO:0001675) |
| 0.0 | 0.1 | GO:0003223 | ventricular compact myocardium morphogenesis(GO:0003223) atrioventricular canal development(GO:0036302) semicircular canal morphogenesis(GO:0048752) |
| 0.0 | 0.2 | GO:0006003 | fructose 2,6-bisphosphate metabolic process(GO:0006003) |
| 0.0 | 0.0 | GO:0048014 | Tie signaling pathway(GO:0048014) |
| 0.0 | 0.1 | GO:0070940 | dephosphorylation of RNA polymerase II C-terminal domain(GO:0070940) |
| 0.0 | 0.1 | GO:0060352 | cell adhesion molecule production(GO:0060352) |
Gene overrepresentation in cellular component category:
| Log-likelihood per target | Total log-likelihood | Term | Description |
|---|---|---|---|
| 0.1 | 0.2 | GO:0032777 | Piccolo NuA4 histone acetyltransferase complex(GO:0032777) |
| 0.0 | 0.1 | GO:0071148 | TEAD-1-YAP complex(GO:0071148) |
| 0.0 | 0.1 | GO:0097165 | nuclear stress granule(GO:0097165) |
| 0.0 | 0.1 | GO:0016602 | CCAAT-binding factor complex(GO:0016602) |
| 0.0 | 0.1 | GO:0071953 | elastic fiber(GO:0071953) |
| 0.0 | 0.0 | GO:1990032 | parallel fiber(GO:1990032) |
| 0.0 | 0.0 | GO:0097629 | extrinsic component of omegasome membrane(GO:0097629) |
| 0.0 | 0.1 | GO:0097441 | basilar dendrite(GO:0097441) |
| 0.0 | 0.0 | GO:1990907 | Scrib-APC-beta-catenin complex(GO:0034750) beta-catenin-TCF complex(GO:1990907) |
| 0.0 | 0.1 | GO:0030121 | AP-1 adaptor complex(GO:0030121) |
| 0.0 | 0.0 | GO:0044393 | microspike(GO:0044393) |
| 0.0 | 0.0 | GO:0002193 | MAML1-RBP-Jkappa- ICN1 complex(GO:0002193) |
Gene overrepresentation in molecular function category:
| Log-likelihood per target | Total log-likelihood | Term | Description |
|---|---|---|---|
| 0.1 | 0.2 | GO:0001565 | phorbol ester receptor activity(GO:0001565) |
| 0.0 | 0.2 | GO:0005007 | fibroblast growth factor-activated receptor activity(GO:0005007) |
| 0.0 | 0.1 | GO:0035827 | rubidium ion transmembrane transporter activity(GO:0035827) |
| 0.0 | 0.1 | GO:0030977 | taurine binding(GO:0030977) |
| 0.0 | 0.1 | GO:0030350 | iron-responsive element binding(GO:0030350) |
| 0.0 | 0.1 | GO:0071253 | connexin binding(GO:0071253) |
| 0.0 | 0.1 | GO:0070699 | type II activin receptor binding(GO:0070699) |
| 0.0 | 0.1 | GO:0008489 | UDP-galactose:glucosylceramide beta-1,4-galactosyltransferase activity(GO:0008489) |
| 0.0 | 0.1 | GO:0003835 | beta-galactoside alpha-2,6-sialyltransferase activity(GO:0003835) |
| 0.0 | 0.1 | GO:0004322 | ferroxidase activity(GO:0004322) oxidoreductase activity, oxidizing metal ions, oxygen as acceptor(GO:0016724) |
| 0.0 | 0.1 | GO:0004111 | creatine kinase activity(GO:0004111) |
| 0.0 | 0.2 | GO:0004331 | 6-phosphofructo-2-kinase activity(GO:0003873) fructose-2,6-bisphosphate 2-phosphatase activity(GO:0004331) |
| 0.0 | 0.1 | GO:0003847 | 1-alkyl-2-acetylglycerophosphocholine esterase activity(GO:0003847) |
| 0.0 | 0.1 | GO:0008527 | taste receptor activity(GO:0008527) |
| 0.0 | 0.0 | GO:0060002 | plus-end directed microfilament motor activity(GO:0060002) |
| 0.0 | 0.1 | GO:0034046 | poly(G) binding(GO:0034046) |
| 0.0 | 0.1 | GO:0043426 | MRF binding(GO:0043426) |
Gene overrepresentation in curated gene sets: REACTOME pathways category:
| Log-likelihood per target | Total log-likelihood | Term | Description |
|---|---|---|---|
| 0.0 | 0.1 | REACTOME SIGNALING BY FGFR3 MUTANTS | Genes involved in Signaling by FGFR3 mutants |
| 0.0 | 0.2 | REACTOME SIGNALING BY ACTIVATED POINT MUTANTS OF FGFR1 | Genes involved in Signaling by activated point mutants of FGFR1 |