Project
GSE49485: Hypoxia transcriptome sequencing of rat brain.
Navigation
Downloads
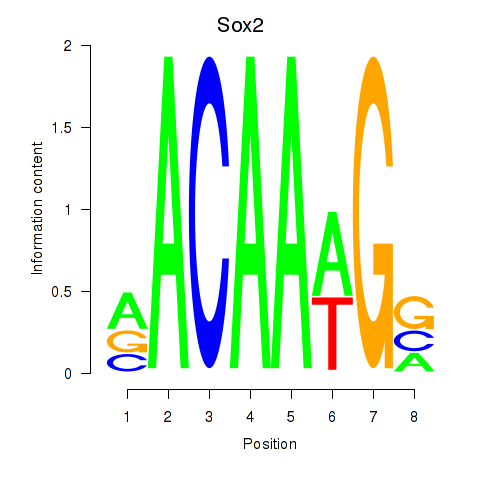
Results for Sox2
Z-value: 1.13
Motif logo
Transcription factors associated with Sox2
| Gene Symbol | Gene ID | Gene Info |
|---|---|---|
|
Sox2
|
ENSRNOG00000012199 | SRY box 2 |
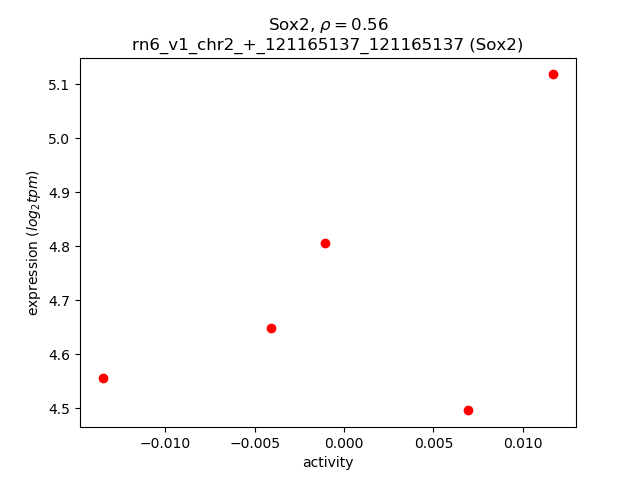
Activity-expression correlation:
| Gene | Promoter | Pearson corr. coef. | P-value | Plot |
|---|---|---|---|---|
| Sox2 | rn6_v1_chr2_+_121165137_121165137 | 0.56 | 3.2e-01 | Click! |
Activity profile of Sox2 motif
Sorted Z-values of Sox2 motif
| Promoter | Log-likelihood | Transcript | Gene | Gene Info |
|---|---|---|---|---|
| chr7_-_93826665 | 0.72 |
ENSRNOT00000011344
|
Tnfrsf11b
|
TNF receptor superfamily member 11B |
| chr3_+_155160481 | 0.71 |
ENSRNOT00000021133
|
Ppp1r16b
|
protein phosphatase 1, regulatory subunit 16B |
| chr10_+_36715565 | 0.61 |
ENSRNOT00000005048
|
Clk4
|
CDC-like kinase 4 |
| chr14_+_81819799 | 0.59 |
ENSRNOT00000076840
|
Mxd4
|
Max dimerization protein 4 |
| chr10_-_47453442 | 0.58 |
ENSRNOT00000050061
|
Usp22
|
ubiquitin specific peptidase 22 |
| chr5_+_172364421 | 0.58 |
ENSRNOT00000018769
|
Hes5
|
hes family bHLH transcription factor 5 |
| chr18_+_15467870 | 0.55 |
ENSRNOT00000091696
|
B4galt6
|
beta-1,4-galactosyltransferase 6 |
| chr5_-_86696388 | 0.53 |
ENSRNOT00000007812
|
Megf9
|
multiple EGF-like-domains 9 |
| chr7_+_141702038 | 0.51 |
ENSRNOT00000086577
|
Dip2b
|
disco-interacting protein 2 homolog B |
| chr2_-_183213228 | 0.51 |
ENSRNOT00000067618
|
Trim2
|
tripartite motif-containing 2 |
| chr12_+_28381982 | 0.48 |
ENSRNOT00000076101
|
Wbscr17
|
Williams-Beuren syndrome chromosome region 17 |
| chrX_+_80213332 | 0.47 |
ENSRNOT00000042827
|
Sh3bgrl
|
SH3 domain binding glutamate-rich protein like |
| chr7_-_12275609 | 0.47 |
ENSRNOT00000086061
|
Apc2
|
APC2, WNT signaling pathway regulator |
| chr12_-_25638797 | 0.45 |
ENSRNOT00000002033
|
Gatsl2
|
GATS protein-like 2 |
| chr14_-_81399353 | 0.45 |
ENSRNOT00000018340
|
Add1
|
adducin 1 |
| chr10_+_62674561 | 0.41 |
ENSRNOT00000019946
ENSRNOT00000056110 |
Ankrd13b
|
ankyrin repeat domain 13B |
| chr1_+_217345545 | 0.38 |
ENSRNOT00000071741
|
Shank2
|
SH3 and multiple ankyrin repeat domains 2 |
| chr7_-_70577147 | 0.38 |
ENSRNOT00000008854
|
Mbd6
|
methyl-CpG binding domain protein 6 |
| chr1_-_82004538 | 0.37 |
ENSRNOT00000087572
|
Pou2f2
|
POU class 2 homeobox 2 |
| chr1_+_45923222 | 0.37 |
ENSRNOT00000092976
ENSRNOT00000084454 ENSRNOT00000022939 |
Arid1b
|
AT-rich interaction domain 1B |
| chr3_+_152571121 | 0.37 |
ENSRNOT00000087289
ENSRNOT00000080543 ENSRNOT00000083476 |
Epb41l1
|
erythrocyte membrane protein band 4.1-like 1 |
| chr13_+_90533365 | 0.37 |
ENSRNOT00000082469
|
Dcaf8
|
DDB1 and CUL4 associated factor 8 |
| chrX_-_115175299 | 0.36 |
ENSRNOT00000074322
|
Dcx
|
doublecortin |
| chr15_+_41927241 | 0.36 |
ENSRNOT00000012035
|
Trim13
|
tripartite motif-containing 13 |
| chr5_-_48165317 | 0.35 |
ENSRNOT00000088179
|
Ankrd6
|
ankyrin repeat domain 6 |
| chr18_+_30562178 | 0.35 |
ENSRNOT00000040998
|
LOC108348771
|
protocadherin beta-16-like |
| chr9_+_50925619 | 0.35 |
ENSRNOT00000076248
ENSRNOT00000059349 |
Ercc5
|
ERCC excision repair 5, endonuclease |
| chr2_-_142686577 | 0.34 |
ENSRNOT00000014562
|
Nhlrc3
|
NHL repeat containing 3 |
| chr16_+_74237001 | 0.34 |
ENSRNOT00000026039
|
Polb
|
DNA polymerase beta |
| chr19_+_740028 | 0.33 |
ENSRNOT00000076604
|
Dync1li2
|
dynein, cytoplasmic 1 light intermediate chain 2 |
| chr17_-_77687456 | 0.33 |
ENSRNOT00000045765
ENSRNOT00000081645 |
Frmd4a
|
FERM domain containing 4A |
| chr1_+_266380973 | 0.33 |
ENSRNOT00000080509
|
Wbp1l
|
WW domain binding protein 1-like |
| chr3_+_95715193 | 0.33 |
ENSRNOT00000089525
|
Pax6
|
paired box 6 |
| chr15_+_41448064 | 0.33 |
ENSRNOT00000019551
|
Sacs
|
sacsin molecular chaperone |
| chr9_-_15274917 | 0.32 |
ENSRNOT00000019650
|
Pgc
|
progastricsin |
| chr7_-_98098268 | 0.32 |
ENSRNOT00000010361
|
Fbxo32
|
F-box protein 32 |
| chr5_-_79222687 | 0.31 |
ENSRNOT00000010516
|
Akna
|
AT-hook transcription factor |
| chr18_+_30900291 | 0.31 |
ENSRNOT00000060461
|
Pcdhgb7
|
protocadherin gamma subfamily B, 7 |
| chr8_-_6203515 | 0.31 |
ENSRNOT00000087278
ENSRNOT00000031189 ENSRNOT00000008074 ENSRNOT00000085285 ENSRNOT00000007866 |
Yap1
|
yes-associated protein 1 |
| chr2_+_179952227 | 0.31 |
ENSRNOT00000015081
|
Pdgfc
|
platelet derived growth factor C |
| chr20_-_6257604 | 0.31 |
ENSRNOT00000092489
|
Stk38
|
serine/threonine kinase 38 |
| chr15_+_40665041 | 0.31 |
ENSRNOT00000018300
|
Amer2
|
APC membrane recruitment protein 2 |
| chr10_+_71536533 | 0.30 |
ENSRNOT00000088138
|
Acaca
|
acetyl-CoA carboxylase alpha |
| chr5_-_147412705 | 0.30 |
ENSRNOT00000010688
|
RGD1561149
|
similar to mKIAA1522 protein |
| chr17_+_70684539 | 0.30 |
ENSRNOT00000025700
|
Pfkfb3
|
6-phosphofructo-2-kinase/fructose-2,6-biphosphatase 3 |
| chr13_+_52976507 | 0.29 |
ENSRNOT00000090599
ENSRNOT00000011324 |
Kif21b
|
kinesin family member 21B |
| chr16_+_31734944 | 0.29 |
ENSRNOT00000059673
|
Palld
|
palladin, cytoskeletal associated protein |
| chr1_+_140998240 | 0.29 |
ENSRNOT00000023506
ENSRNOT00000090897 |
Abhd2
|
abhydrolase domain containing 2 |
| chr20_+_4993560 | 0.29 |
ENSRNOT00000081628
ENSRNOT00000087861 ENSRNOT00000001160 |
Vars
|
valyl-tRNA synthetase |
| chr3_+_131351587 | 0.29 |
ENSRNOT00000010835
|
Btbd3
|
BTB domain containing 3 |
| chr10_+_14547172 | 0.28 |
ENSRNOT00000092043
|
Unkl
|
unkempt family like zinc finger |
| chr17_-_89881919 | 0.28 |
ENSRNOT00000090982
|
LOC100910957
|
acyl-CoA-binding domain-containing protein 5-like |
| chr6_+_106052212 | 0.28 |
ENSRNOT00000010626
|
Sipa1l1
|
signal-induced proliferation-associated 1 like 1 |
| chr10_-_83128297 | 0.28 |
ENSRNOT00000082160
|
Kat7
|
lysine acetyltransferase 7 |
| chr9_+_6966908 | 0.28 |
ENSRNOT00000072796
|
St6gal2
|
ST6 beta-galactoside alpha-2,6-sialyltransferase 2 |
| chr13_+_41802697 | 0.27 |
ENSRNOT00000046719
|
LOC100362110
|
LRRGT00155-like |
| chr9_+_14551758 | 0.27 |
ENSRNOT00000017157
|
Nfya
|
nuclear transcription factor Y subunit alpha |
| chr3_+_175426752 | 0.27 |
ENSRNOT00000085718
|
Ss18l1
|
SS18L1, nBAF chromatin remodeling complex subunit |
| chr14_+_2613406 | 0.27 |
ENSRNOT00000000083
|
Tmed5
|
transmembrane p24 trafficking protein 5 |
| chr8_-_78655856 | 0.27 |
ENSRNOT00000081185
|
Tcf12
|
transcription factor 12 |
| chr7_-_118332577 | 0.27 |
ENSRNOT00000090370
|
Rbfox2
|
RNA binding protein, fox-1 homolog 2 |
| chr5_-_147867583 | 0.27 |
ENSRNOT00000000139
|
Kpna6
|
karyopherin subunit alpha 6 |
| chr18_+_30909490 | 0.27 |
ENSRNOT00000026967
|
Pcdhgb8
|
protocadherin gamma subfamily B, 8 |
| chr8_+_114866768 | 0.27 |
ENSRNOT00000076731
|
Wdr82
|
WD repeat domain 82 |
| chr6_-_65319527 | 0.27 |
ENSRNOT00000005618
|
Stxbp6
|
syntaxin binding protein 6 |
| chr2_-_140618405 | 0.26 |
ENSRNOT00000017736
|
Setd7
|
SET domain containing (lysine methyltransferase) 7 |
| chr10_-_17075139 | 0.26 |
ENSRNOT00000039398
|
Neurl1b
|
neuralized E3 ubiquitin protein ligase 1B |
| chr6_-_28464118 | 0.26 |
ENSRNOT00000068214
|
Efr3b
|
EFR3 homolog B |
| chr9_-_100253609 | 0.26 |
ENSRNOT00000036061
|
Kif1a
|
kinesin family member 1A |
| chr10_+_6975244 | 0.26 |
ENSRNOT00000046232
|
Usp7
|
ubiquitin specific peptidase 7 |
| chr10_-_35187416 | 0.26 |
ENSRNOT00000084509
|
Cnot6
|
CCR4-NOT transcription complex, subunit 6 |
| chr10_-_109604899 | 0.26 |
ENSRNOT00000080188
|
Nploc4
|
NPL4 homolog, ubiquitin recognition factor |
| chr2_+_77868412 | 0.26 |
ENSRNOT00000065897
ENSRNOT00000014022 |
Myo10
|
myosin X |
| chr1_-_18058055 | 0.26 |
ENSRNOT00000020988
|
Ptprk
|
protein tyrosine phosphatase, receptor type, K |
| chr12_-_22245100 | 0.26 |
ENSRNOT00000001912
|
Gigyf1
|
GRB10 interacting GYF protein 1 |
| chr4_-_119131202 | 0.25 |
ENSRNOT00000011675
|
Antxr1
|
anthrax toxin receptor 1 |
| chr1_-_88989552 | 0.25 |
ENSRNOT00000034001
|
Arhgap33
|
Rho GTPase activating protein 33 |
| chr4_+_163358009 | 0.25 |
ENSRNOT00000082064
|
Klrd1
|
killer cell lectin like receptor D1 |
| chr5_-_153625869 | 0.25 |
ENSRNOT00000024464
|
Clic4
|
chloride intracellular channel 4 |
| chr4_+_95884743 | 0.24 |
ENSRNOT00000008585
|
Smarcad1
|
SWI/SNF-related, matrix-associated actin-dependent regulator of chromatin, subfamily a, containing DEAD/H box 1` |
| chr8_-_62987182 | 0.24 |
ENSRNOT00000070885
|
Islr2
|
immunoglobulin superfamily containing leucine-rich repeat 2 |
| chrX_+_124393332 | 0.24 |
ENSRNOT00000049424
|
Zbtb33
|
zinc finger and BTB domain containing 33 |
| chr4_-_155740193 | 0.24 |
ENSRNOT00000043229
|
LOC102550396
|
LRRGT00188 |
| chr15_-_43542939 | 0.24 |
ENSRNOT00000012996
|
Dpysl2
|
dihydropyrimidinase-like 2 |
| chr8_-_116532169 | 0.24 |
ENSRNOT00000085364
|
Rbm5
|
RNA binding motif protein 5 |
| chr1_-_73732118 | 0.24 |
ENSRNOT00000077964
|
Leng8
|
leukocyte receptor cluster member 8 |
| chr9_+_53627208 | 0.24 |
ENSRNOT00000083487
|
Mfsd6
|
major facilitator superfamily domain containing 6 |
| chr18_+_30435119 | 0.24 |
ENSRNOT00000027190
|
Pcdhb8
|
protocadherin beta 8 |
| chr17_+_45199178 | 0.24 |
ENSRNOT00000080047
|
Zscan26
|
zinc finger and SCAN domain containing 26 |
| chr10_-_85435016 | 0.24 |
ENSRNOT00000079921
|
4933428G20Rik
|
RIKEN cDNA 4933428G20 gene |
| chr14_+_63405408 | 0.24 |
ENSRNOT00000086658
|
AABR07015559.1
|
|
| chr7_+_34952011 | 0.24 |
ENSRNOT00000077666
|
Fgd6
|
FYVE, RhoGEF and PH domain containing 6 |
| chr9_+_2202511 | 0.23 |
ENSRNOT00000017556
|
Satb1
|
SATB homeobox 1 |
| chr2_-_183031214 | 0.23 |
ENSRNOT00000013260
|
LOC679811
|
similar to RIKEN cDNA D930015E06 |
| chr5_+_5616483 | 0.23 |
ENSRNOT00000011026
|
Ncoa2
|
nuclear receptor coactivator 2 |
| chrX_+_62754634 | 0.23 |
ENSRNOT00000016669
|
Pcyt1b
|
phosphate cytidylyltransferase 1, choline, beta |
| chr6_-_147172022 | 0.23 |
ENSRNOT00000080675
|
Itgb8
|
integrin subunit beta 8 |
| chr15_-_52399074 | 0.23 |
ENSRNOT00000018440
|
Xpo7
|
exportin 7 |
| chr4_+_88695590 | 0.23 |
ENSRNOT00000087835
|
Ppm1k
|
protein phosphatase, Mg2+/Mn2+ dependent, 1K |
| chr11_-_65759581 | 0.23 |
ENSRNOT00000034334
|
Lrrc58
|
leucine rich repeat containing 58 |
| chr10_-_15125408 | 0.23 |
ENSRNOT00000026395
|
Msln
|
mesothelin |
| chr15_+_105851542 | 0.23 |
ENSRNOT00000086959
|
Rap2a
|
RAS related protein 2a |
| chr3_+_148541909 | 0.23 |
ENSRNOT00000012187
|
Ccm2l
|
CCM2 like scaffolding protein |
| chr5_+_59348639 | 0.23 |
ENSRNOT00000084031
ENSRNOT00000060264 |
Reck
|
reversion-inducing-cysteine-rich protein with kazal motifs |
| chr14_+_64686793 | 0.22 |
ENSRNOT00000005894
ENSRNOT00000036646 |
Adgra3
|
adhesion G protein-coupled receptor A3 |
| chr18_+_27424328 | 0.22 |
ENSRNOT00000033784
|
Kif20a
|
kinesin family member 20A |
| chr17_+_9596957 | 0.22 |
ENSRNOT00000017349
|
Fam193b
|
family with sequence similarity 193, member B |
| chr3_+_151508361 | 0.22 |
ENSRNOT00000055251
|
Cep250
|
centrosomal protein 250 |
| chr1_-_13915594 | 0.22 |
ENSRNOT00000015927
|
Arfgef3
|
ARFGEF family member 3 |
| chr1_+_217345154 | 0.22 |
ENSRNOT00000092516
|
Shank2
|
SH3 and multiple ankyrin repeat domains 2 |
| chr4_-_176026133 | 0.22 |
ENSRNOT00000043374
ENSRNOT00000046598 |
Slco1a4
|
solute carrier organic anion transporter family, member 1a4 |
| chr17_+_13670520 | 0.22 |
ENSRNOT00000019442
|
Shc3
|
SHC adaptor protein 3 |
| chr4_-_34194764 | 0.22 |
ENSRNOT00000045270
|
Col28a1
|
collagen type XXVIII alpha 1 chain |
| chr10_+_67862054 | 0.22 |
ENSRNOT00000031746
|
Cdk5r1
|
cyclin-dependent kinase 5 regulatory subunit 1 |
| chr13_-_86451002 | 0.22 |
ENSRNOT00000043004
ENSRNOT00000027996 |
Pbx1
|
PBX homeobox 1 |
| chr2_+_142686724 | 0.22 |
ENSRNOT00000014614
|
Proser1
|
proline and serine rich 1 |
| chr2_+_187512164 | 0.22 |
ENSRNOT00000051394
|
Mef2d
|
myocyte enhancer factor 2D |
| chr1_-_14412807 | 0.22 |
ENSRNOT00000074583
|
Tnfaip3
|
TNF alpha induced protein 3 |
| chr2_+_151685251 | 0.21 |
ENSRNOT00000019340
|
Rap2b
|
RAP2B, member of RAS oncogene family |
| chr11_+_69484293 | 0.21 |
ENSRNOT00000049292
|
Kalrn
|
kalirin, RhoGEF kinase |
| chr14_+_71542057 | 0.21 |
ENSRNOT00000082592
ENSRNOT00000083701 ENSRNOT00000084322 |
Prom1
|
prominin 1 |
| chr1_-_222628596 | 0.21 |
ENSRNOT00000083157
ENSRNOT00000034477 |
RGD1308106
|
LOC361719 |
| chr7_-_11223649 | 0.21 |
ENSRNOT00000061191
|
Mfsd12
|
major facilitator superfamily domain containing 12 |
| chr11_+_16826399 | 0.21 |
ENSRNOT00000050701
|
Cxadr
|
coxsackie virus and adenovirus receptor |
| chr2_-_96668222 | 0.21 |
ENSRNOT00000016567
|
Pkia
|
cAMP-dependent protein kinase inhibitor alpha |
| chr3_+_41019898 | 0.21 |
ENSRNOT00000007335
|
Kcnj3
|
potassium voltage-gated channel subfamily J member 3 |
| chr20_-_26589209 | 0.21 |
ENSRNOT00000049437
|
Ctnna3
|
catenin alpha 3 |
| chr15_+_83703791 | 0.21 |
ENSRNOT00000090637
|
Klf5
|
Kruppel-like factor 5 |
| chr4_+_6282278 | 0.21 |
ENSRNOT00000010349
|
Kmt2c
|
lysine methyltransferase 2C |
| chr5_+_134679713 | 0.21 |
ENSRNOT00000067566
|
Mob3c
|
MOB kinase activator 3C |
| chr1_+_142679345 | 0.21 |
ENSRNOT00000034267
|
Zscan2
|
zinc finger and SCAN domain containing 2 |
| chr11_-_60882379 | 0.21 |
ENSRNOT00000002799
|
Cd200r1
|
CD200 receptor 1 |
| chr12_+_38303624 | 0.21 |
ENSRNOT00000001668
|
Zcchc8
|
zinc finger CCHC-type containing 8 |
| chr2_-_117666683 | 0.21 |
ENSRNOT00000015479
|
AABR07009931.1
|
|
| chr18_+_30904498 | 0.21 |
ENSRNOT00000026969
|
Pcdhga11
|
protocadherin gamma subfamily A, 11 |
| chr13_+_34400170 | 0.21 |
ENSRNOT00000061516
ENSRNOT00000061515 ENSRNOT00000061513 ENSRNOT00000084506 ENSRNOT00000086641 |
Clasp1
|
cytoplasmic linker associated protein 1 |
| chr10_+_103934797 | 0.21 |
ENSRNOT00000035865
|
Cdr2l
|
cerebellar degeneration-related protein 2-like |
| chr3_+_58965552 | 0.21 |
ENSRNOT00000002068
|
Map3k20
|
mitogen-activated protein kinase kinase kinase 20 |
| chr13_-_70922245 | 0.21 |
ENSRNOT00000064860
|
Dhx9
|
DExH-box helicase 9 |
| chr1_-_57815038 | 0.20 |
ENSRNOT00000075401
|
Rgmb
|
repulsive guidance molecule family member B |
| chr4_+_170518673 | 0.20 |
ENSRNOT00000011803
|
Atf7ip
|
activating transcription factor 7 interacting protein |
| chr20_+_6205903 | 0.20 |
ENSRNOT00000092333
ENSRNOT00000092655 |
Kctd20
|
potassium channel tetramerization domain containing 20 |
| chr19_-_55490426 | 0.20 |
ENSRNOT00000081800
|
Cbfa2t3
|
CBFA2/RUNX1 translocation partner 3 |
| chr16_-_19791832 | 0.20 |
ENSRNOT00000040393
|
Ushbp1
|
USH1 protein network component harmonin binding protein 1 |
| chr12_+_27155587 | 0.20 |
ENSRNOT00000044800
|
AABR07035916.1
|
|
| chr20_+_3558827 | 0.20 |
ENSRNOT00000088130
|
Ddr1
|
discoidin domain receptor tyrosine kinase 1 |
| chr5_+_116421894 | 0.20 |
ENSRNOT00000080577
ENSRNOT00000086628 ENSRNOT00000004017 |
Nfia
|
nuclear factor I/A |
| chr1_+_277459200 | 0.20 |
ENSRNOT00000086008
|
AABR07007023.1
|
|
| chr6_-_21112734 | 0.20 |
ENSRNOT00000079819
|
Rasgrp3
|
RAS guanyl releasing protein 3 |
| chr3_-_80601410 | 0.20 |
ENSRNOT00000022841
|
Atg13
|
autophagy related 13 |
| chr5_-_166133491 | 0.20 |
ENSRNOT00000087739
ENSRNOT00000089099 |
Kif1b
|
kinesin family member 1B |
| chr8_-_39460844 | 0.20 |
ENSRNOT00000048875
|
Pknox2
|
PBX/knotted 1 homeobox 2 |
| chr2_-_34452895 | 0.20 |
ENSRNOT00000079385
|
AABR07007905.2
|
|
| chrX_-_26376467 | 0.20 |
ENSRNOT00000051655
ENSRNOT00000036502 |
Arhgap6
|
Rho GTPase activating protein 6 |
| chr13_-_73055631 | 0.20 |
ENSRNOT00000081892
|
Xpr1
|
xenotropic and polytropic retrovirus receptor 1 |
| chr4_-_11497531 | 0.20 |
ENSRNOT00000078799
|
Magi2
|
membrane associated guanylate kinase, WW and PDZ domain containing 2 |
| chr18_+_15856801 | 0.20 |
ENSRNOT00000071548
|
Zfp397
|
zinc finger protein 397 |
| chr2_+_22909569 | 0.19 |
ENSRNOT00000073871
|
Homer1
|
homer scaffolding protein 1 |
| chr2_+_205553163 | 0.19 |
ENSRNOT00000039572
|
Nras
|
neuroblastoma RAS viral oncogene homolog |
| chr7_+_2795901 | 0.19 |
ENSRNOT00000047462
|
Ankrd52
|
ankyrin repeat domain 52 |
| chr8_+_117620317 | 0.19 |
ENSRNOT00000084220
|
Celsr3
|
cadherin, EGF LAG seven-pass G-type receptor 3 |
| chr11_+_83868655 | 0.19 |
ENSRNOT00000072402
|
NEWGENE_621438
|
thrombopoietin |
| chr12_-_13668515 | 0.19 |
ENSRNOT00000086847
|
Fscn1
|
fascin actin-bundling protein 1 |
| chr7_-_34951644 | 0.19 |
ENSRNOT00000030015
|
Vezt
|
vezatin, adherens junctions transmembrane protein |
| chr9_-_50884596 | 0.19 |
ENSRNOT00000016285
|
Kdelc1
|
KDEL motif containing 1 |
| chr3_-_48372583 | 0.19 |
ENSRNOT00000040482
ENSRNOT00000077788 ENSRNOT00000085426 |
Dpp4
|
dipeptidylpeptidase 4 |
| chr13_-_79744939 | 0.19 |
ENSRNOT00000076706
|
Suco
|
SUN domain containing ossification factor |
| chr9_-_110225486 | 0.19 |
ENSRNOT00000045096
|
Efna5
|
ephrin A5 |
| chr9_-_43454078 | 0.19 |
ENSRNOT00000023550
|
Tmem131
|
transmembrane protein 131 |
| chr16_+_35573058 | 0.19 |
ENSRNOT00000059580
|
Galntl6
|
polypeptide N-acetylgalactosaminyltransferase-like 6 |
| chr6_+_110624856 | 0.19 |
ENSRNOT00000014017
|
Vash1
|
vasohibin 1 |
| chr18_-_40134504 | 0.19 |
ENSRNOT00000022294
|
Trim36
|
tripartite motif-containing 36 |
| chr11_+_84396033 | 0.19 |
ENSRNOT00000002316
|
Abcc5
|
ATP binding cassette subfamily C member 5 |
| chr5_+_25168295 | 0.19 |
ENSRNOT00000020245
|
Fsbp
|
fibrinogen silencer binding protein |
| chr5_+_135074297 | 0.19 |
ENSRNOT00000000157
|
Pik3r3
|
phosphoinositide-3-kinase regulatory subunit 3 |
| chr6_+_73553210 | 0.19 |
ENSRNOT00000006562
|
Akap6
|
A-kinase anchoring protein 6 |
| chr13_+_95589668 | 0.19 |
ENSRNOT00000005849
|
Zfp238
|
zinc finger protein 238 |
| chr4_-_115157263 | 0.18 |
ENSRNOT00000015296
|
Tet3
|
tet methylcytosine dioxygenase 3 |
| chr1_+_248228496 | 0.18 |
ENSRNOT00000015406
|
Uhrf2
|
ubiquitin like with PHD and ring finger domains 2 |
| chr4_-_43096399 | 0.18 |
ENSRNOT00000087167
|
Cttnbp2
|
cortactin binding protein 2 |
| chr11_-_84633504 | 0.18 |
ENSRNOT00000052120
|
Klhl24
|
kelch-like family member 24 |
| chr6_+_99625306 | 0.18 |
ENSRNOT00000008573
|
Plekhg3
|
pleckstrin homology and RhoGEF domain containing G3 |
| chr8_-_48634797 | 0.18 |
ENSRNOT00000012868
|
Hinfp
|
histone H4 transcription factor |
| chrX_+_68771100 | 0.18 |
ENSRNOT00000043872
|
Stard8
|
StAR-related lipid transfer domain containing 8 |
| chr16_+_59564419 | 0.18 |
ENSRNOT00000083434
|
Lonrf1
|
LON peptidase N-terminal domain and ring finger 1 |
| chr13_+_49870976 | 0.18 |
ENSRNOT00000090170
|
Pik3c2b
|
phosphatidylinositol-4-phosphate 3-kinase, catalytic subunit type 2 beta |
| chr2_-_165739874 | 0.18 |
ENSRNOT00000014384
|
Kpna4
|
karyopherin subunit alpha 4 |
| chr4_-_183544850 | 0.18 |
ENSRNOT00000071407
|
Dennd5b
|
DENN/MADD domain containing 5B |
| chr7_+_58419197 | 0.18 |
ENSRNOT00000085829
|
Zfc3h1
|
zinc finger, C3H1-type containing |
| chr20_-_13571364 | 0.17 |
ENSRNOT00000081733
|
Zfp280b
|
zinc finger protein 280B |
| chr3_-_43119159 | 0.17 |
ENSRNOT00000041394
|
Nr4a2
|
nuclear receptor subfamily 4, group A, member 2 |
| chr3_+_175408629 | 0.17 |
ENSRNOT00000081344
|
Lsm14b
|
LSM family member 14B |
| chr1_+_1545134 | 0.17 |
ENSRNOT00000044523
|
AABR07000156.1
|
|
| chr14_+_84150908 | 0.17 |
ENSRNOT00000005516
|
Dusp18
|
dual specificity phosphatase 18 |
| chr7_-_116201756 | 0.17 |
ENSRNOT00000091401
|
Cyp11b2
|
cytochrome P450, family 11, subfamily b, polypeptide 2 |
| chr11_+_86512797 | 0.17 |
ENSRNOT00000051680
|
Gp1bb
|
glycoprotein Ib platelet beta subunit |
| chr3_+_164665532 | 0.17 |
ENSRNOT00000014309
|
Ptpn1
|
protein tyrosine phosphatase, non-receptor type 1 |
| chr4_-_125929002 | 0.17 |
ENSRNOT00000083271
|
Magi1
|
membrane associated guanylate kinase, WW and PDZ domain containing 1 |
| chr8_+_5967463 | 0.17 |
ENSRNOT00000086251
|
Tmem123
|
transmembrane protein 123 |
| chr8_-_49158971 | 0.17 |
ENSRNOT00000020573
|
Kmt2a
|
lysine methyltransferase 2A |
Network of associatons between targets according to the STRING database.

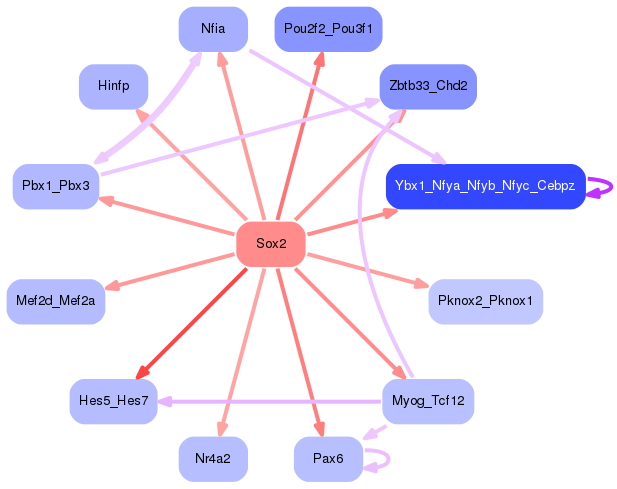
First level regulatory network of Sox2
Gene Ontology Analysis
Gene overrepresentation in biological process category:
| Log-likelihood per target | Total log-likelihood | Term | Description |
|---|---|---|---|
| 0.2 | 0.7 | GO:0042489 | negative regulation of odontogenesis of dentin-containing tooth(GO:0042489) |
| 0.2 | 0.7 | GO:1902309 | negative regulation of peptidyl-serine dephosphorylation(GO:1902309) |
| 0.2 | 0.6 | GO:2000974 | auditory receptor cell fate determination(GO:0042668) negative regulation of pro-B cell differentiation(GO:2000974) negative regulation of forebrain neuron differentiation(GO:2000978) |
| 0.2 | 0.2 | GO:0072240 | DCT cell differentiation(GO:0072069) metanephric DCT cell differentiation(GO:0072240) |
| 0.1 | 0.4 | GO:0002380 | immunoglobulin secretion involved in immune response(GO:0002380) |
| 0.1 | 0.4 | GO:0030997 | regulation of centriole-centriole cohesion(GO:0030997) |
| 0.1 | 0.5 | GO:0014878 | response to electrical stimulus involved in regulation of muscle adaptation(GO:0014878) |
| 0.1 | 0.3 | GO:0021917 | pancreatic A cell development(GO:0003322) forebrain-midbrain boundary formation(GO:0021905) somatic motor neuron fate commitment(GO:0021917) regulation of transcription from RNA polymerase II promoter involved in somatic motor neuron fate commitment(GO:0021918) sensory neuron migration(GO:1904937) |
| 0.1 | 0.2 | GO:1903116 | positive regulation of actin filament-based movement(GO:1903116) |
| 0.1 | 0.3 | GO:2000312 | regulation of kainate selective glutamate receptor activity(GO:2000312) |
| 0.1 | 0.3 | GO:0006438 | valyl-tRNA aminoacylation(GO:0006438) |
| 0.1 | 0.3 | GO:1903210 | transitional stage B cell differentiation(GO:0002332) transitional one stage B cell differentiation(GO:0002333) glomerular visceral epithelial cell apoptotic process(GO:1903210) positive regulation of actin filament binding(GO:1904531) positive regulation of actin binding(GO:1904618) |
| 0.1 | 0.4 | GO:0097026 | dendritic cell dendrite assembly(GO:0097026) |
| 0.1 | 0.3 | GO:0072720 | response to dithiothreitol(GO:0072720) |
| 0.1 | 0.5 | GO:1903142 | positive regulation of endothelial cell development(GO:1901552) positive regulation of establishment of endothelial barrier(GO:1903142) |
| 0.1 | 0.3 | GO:0006295 | nucleotide-excision repair, DNA incision, 3'-to lesion(GO:0006295) |
| 0.1 | 0.3 | GO:0002225 | positive regulation of antimicrobial peptide production(GO:0002225) positive regulation of antibacterial peptide production(GO:0002803) |
| 0.1 | 0.2 | GO:1900135 | positive regulation of renin secretion into blood stream(GO:1900135) |
| 0.1 | 0.3 | GO:2001295 | malonyl-CoA biosynthetic process(GO:2001295) |
| 0.1 | 0.2 | GO:0090271 | positive regulation of fibroblast growth factor production(GO:0090271) |
| 0.1 | 0.2 | GO:0034140 | negative regulation of toll-like receptor 3 signaling pathway(GO:0034140) toll-like receptor 5 signaling pathway(GO:0034146) negative regulation of nucleotide-binding oligomerization domain containing signaling pathway(GO:0070425) negative regulation of nucleotide-binding oligomerization domain containing 2 signaling pathway(GO:0070433) protein deubiquitination involved in ubiquitin-dependent protein catabolic process(GO:0071947) |
| 0.1 | 0.2 | GO:0003220 | left ventricular cardiac muscle tissue morphogenesis(GO:0003220) cell proliferation involved in heart valve morphogenesis(GO:0003249) regulation of cell proliferation involved in heart valve morphogenesis(GO:0003250) gonad morphogenesis(GO:0035262) nephrogenic mesenchyme morphogenesis(GO:0072134) |
| 0.1 | 0.3 | GO:1903300 | negative regulation of glucokinase activity(GO:0033132) negative regulation of hexokinase activity(GO:1903300) |
| 0.1 | 0.2 | GO:0071579 | regulation of zinc ion transport(GO:0071579) |
| 0.1 | 0.1 | GO:1903760 | regulation of voltage-gated potassium channel activity involved in ventricular cardiac muscle cell action potential repolarization(GO:1903760) |
| 0.1 | 0.3 | GO:0070086 | ubiquitin-dependent endocytosis(GO:0070086) |
| 0.1 | 0.3 | GO:0035616 | histone H2B conserved C-terminal lysine deubiquitination(GO:0035616) |
| 0.1 | 0.2 | GO:0038163 | thrombopoietin-mediated signaling pathway(GO:0038163) |
| 0.1 | 0.2 | GO:0061744 | motor behavior(GO:0061744) |
| 0.1 | 0.2 | GO:1902261 | positive regulation of delayed rectifier potassium channel activity(GO:1902261) |
| 0.1 | 0.2 | GO:0044725 | chromatin reprogramming in the zygote(GO:0044725) |
| 0.1 | 0.2 | GO:0045925 | positive regulation of female receptivity(GO:0045925) |
| 0.1 | 0.2 | GO:0021986 | epithalamus development(GO:0021538) habenula development(GO:0021986) |
| 0.1 | 0.2 | GO:0043974 | histone H3-K27 acetylation(GO:0043974) regulation of histone H3-K27 acetylation(GO:1901674) regulation of cellular response to drug(GO:2001038) |
| 0.1 | 0.3 | GO:0006287 | base-excision repair, gap-filling(GO:0006287) |
| 0.1 | 0.2 | GO:0021847 | ventricular zone neuroblast division(GO:0021847) fibroblast growth factor receptor signaling pathway involved in orbitofrontal cortex development(GO:0035607) lateral mesodermal cell fate commitment(GO:0048372) lateral mesodermal cell fate specification(GO:0048377) regulation of lateral mesodermal cell fate specification(GO:0048378) |
| 0.1 | 0.2 | GO:0032915 | positive regulation of transforming growth factor beta2 production(GO:0032915) |
| 0.1 | 0.2 | GO:0021586 | pons maturation(GO:0021586) |
| 0.1 | 0.3 | GO:0051365 | cellular response to potassium ion starvation(GO:0051365) |
| 0.1 | 0.3 | GO:2000327 | positive regulation of ligand-dependent nuclear receptor transcription coactivator activity(GO:2000327) |
| 0.1 | 0.3 | GO:0055118 | negative regulation of cardiac muscle contraction(GO:0055118) |
| 0.1 | 0.4 | GO:2000096 | positive regulation of Wnt signaling pathway, planar cell polarity pathway(GO:2000096) |
| 0.0 | 0.3 | GO:1990573 | potassium ion import across plasma membrane(GO:1990573) |
| 0.0 | 0.2 | GO:0030035 | microspike assembly(GO:0030035) |
| 0.0 | 0.1 | GO:0043314 | negative regulation of neutrophil degranulation(GO:0043314) |
| 0.0 | 0.2 | GO:1901491 | negative regulation of lymphangiogenesis(GO:1901491) |
| 0.0 | 0.1 | GO:0060816 | random inactivation of X chromosome(GO:0060816) regulation of dosage compensation by inactivation of X chromosome(GO:1900095) |
| 0.0 | 0.6 | GO:0099562 | maintenance of postsynaptic specialization structure(GO:0098880) maintenance of postsynaptic density structure(GO:0099562) |
| 0.0 | 0.2 | GO:1904684 | negative regulation of metalloendopeptidase activity(GO:1904684) |
| 0.0 | 0.3 | GO:0006975 | DNA damage induced protein phosphorylation(GO:0006975) metanephric nephron tubule epithelial cell differentiation(GO:0072257) regulation of metanephric nephron tubule epithelial cell differentiation(GO:0072307) |
| 0.0 | 0.1 | GO:0070358 | actin polymerization-dependent cell motility(GO:0070358) |
| 0.0 | 0.2 | GO:0098989 | behavioral response to chemical pain(GO:0061366) behavioral response to formalin induced pain(GO:0061368) NMDA selective glutamate receptor signaling pathway(GO:0098989) |
| 0.0 | 0.1 | GO:0034499 | late endosome to Golgi transport(GO:0034499) |
| 0.0 | 0.2 | GO:1903898 | negative regulation of PERK-mediated unfolded protein response(GO:1903898) |
| 0.0 | 0.3 | GO:1903054 | negative regulation of extracellular matrix organization(GO:1903054) |
| 0.0 | 0.1 | GO:0071929 | alpha-tubulin acetylation(GO:0071929) |
| 0.0 | 0.0 | GO:2000111 | positive regulation of macrophage apoptotic process(GO:2000111) |
| 0.0 | 0.4 | GO:1904116 | response to vasopressin(GO:1904116) |
| 0.0 | 0.1 | GO:0072156 | distal tubule morphogenesis(GO:0072156) |
| 0.0 | 0.2 | GO:0019520 | aldonic acid metabolic process(GO:0019520) D-gluconate metabolic process(GO:0019521) |
| 0.0 | 0.1 | GO:0021773 | striatal medium spiny neuron differentiation(GO:0021773) |
| 0.0 | 0.7 | GO:0016578 | histone deubiquitination(GO:0016578) |
| 0.0 | 0.2 | GO:0006546 | glycine catabolic process(GO:0006546) glycine decarboxylation via glycine cleavage system(GO:0019464) |
| 0.0 | 0.1 | GO:2000541 | positive regulation of synaptic growth at neuromuscular junction(GO:0045887) regulation of sodium:potassium-exchanging ATPase activity(GO:1903406) regulation of protein geranylgeranylation(GO:2000539) positive regulation of protein geranylgeranylation(GO:2000541) |
| 0.0 | 0.1 | GO:1903847 | regulation of aorta morphogenesis(GO:1903847) positive regulation of aorta morphogenesis(GO:1903849) |
| 0.0 | 0.3 | GO:0010724 | regulation of definitive erythrocyte differentiation(GO:0010724) |
| 0.0 | 0.1 | GO:0060082 | eye blink reflex(GO:0060082) |
| 0.0 | 0.6 | GO:0032486 | Rap protein signal transduction(GO:0032486) |
| 0.0 | 0.1 | GO:0032916 | positive regulation of transforming growth factor beta3 production(GO:0032916) |
| 0.0 | 0.1 | GO:0060838 | lymphatic endothelial cell fate commitment(GO:0060838) regulation of transcription involved in lymphatic endothelial cell fate commitment(GO:0060849) |
| 0.0 | 0.1 | GO:0051037 | regulation of transcription involved in meiotic cell cycle(GO:0051037) |
| 0.0 | 0.3 | GO:0039536 | negative regulation of RIG-I signaling pathway(GO:0039536) |
| 0.0 | 0.1 | GO:1990009 | retinal cell apoptotic process(GO:1990009) |
| 0.0 | 0.5 | GO:0035414 | negative regulation of catenin import into nucleus(GO:0035414) |
| 0.0 | 0.3 | GO:0086042 | cardiac muscle cell-cardiac muscle cell adhesion(GO:0086042) |
| 0.0 | 0.1 | GO:0046340 | diacylglycerol catabolic process(GO:0046340) |
| 0.0 | 0.3 | GO:0070934 | CRD-mediated mRNA stabilization(GO:0070934) |
| 0.0 | 0.2 | GO:1901898 | negative regulation of relaxation of cardiac muscle(GO:1901898) |
| 0.0 | 0.0 | GO:2001160 | regulation of histone H3-K79 methylation(GO:2001160) |
| 0.0 | 0.1 | GO:0002572 | pro-T cell differentiation(GO:0002572) type I interferon secretion(GO:0072641) interferon-alpha secretion(GO:0072642) regulation of interferon-alpha secretion(GO:1902739) positive regulation of interferon-alpha secretion(GO:1902741) |
| 0.0 | 0.1 | GO:0071918 | urea transmembrane transport(GO:0071918) |
| 0.0 | 0.0 | GO:1905072 | cardiac jelly development(GO:1905072) |
| 0.0 | 0.1 | GO:1905218 | cellular response to astaxanthin(GO:1905218) |
| 0.0 | 0.1 | GO:0001920 | negative regulation of receptor recycling(GO:0001920) |
| 0.0 | 0.4 | GO:0043374 | CD8-positive, alpha-beta T cell differentiation(GO:0043374) |
| 0.0 | 0.2 | GO:1990414 | replication-born double-strand break repair via sister chromatid exchange(GO:1990414) |
| 0.0 | 0.2 | GO:0033088 | negative regulation of immature T cell proliferation in thymus(GO:0033088) |
| 0.0 | 0.2 | GO:0036515 | serotonergic neuron axon guidance(GO:0036515) |
| 0.0 | 0.1 | GO:0030473 | nucleokinesis involved in cell motility in cerebral cortex radial glia guided migration(GO:0021817) nuclear migration along microtubule(GO:0030473) nuclear matrix anchoring at nuclear membrane(GO:0090292) |
| 0.0 | 0.3 | GO:0090084 | negative regulation of inclusion body assembly(GO:0090084) |
| 0.0 | 0.1 | GO:1902809 | regulation of skeletal muscle fiber differentiation(GO:1902809) |
| 0.0 | 0.4 | GO:0030953 | astral microtubule organization(GO:0030953) |
| 0.0 | 0.1 | GO:1903774 | positive regulation of viral budding via host ESCRT complex(GO:1903774) |
| 0.0 | 0.3 | GO:0018026 | peptidyl-lysine monomethylation(GO:0018026) |
| 0.0 | 0.2 | GO:0072697 | protein localization to cell cortex(GO:0072697) |
| 0.0 | 0.2 | GO:0071557 | histone H3-K27 demethylation(GO:0071557) |
| 0.0 | 0.2 | GO:0051612 | negative regulation of neurotransmitter uptake(GO:0051581) regulation of serotonin uptake(GO:0051611) negative regulation of serotonin uptake(GO:0051612) |
| 0.0 | 0.1 | GO:0048003 | antigen processing and presentation of lipid antigen via MHC class Ib(GO:0048003) antigen processing and presentation, exogenous lipid antigen via MHC class Ib(GO:0048007) |
| 0.0 | 0.2 | GO:0038180 | nerve growth factor signaling pathway(GO:0038180) |
| 0.0 | 0.1 | GO:0060988 | lipid tube assembly(GO:0060988) |
| 0.0 | 0.3 | GO:0035542 | regulation of SNARE complex assembly(GO:0035542) |
| 0.0 | 0.1 | GO:0007056 | spindle assembly involved in female meiosis(GO:0007056) positive regulation of oocyte maturation(GO:1900195) |
| 0.0 | 0.1 | GO:0046864 | isoprenoid transport(GO:0046864) terpenoid transport(GO:0046865) |
| 0.0 | 0.5 | GO:0008090 | retrograde axonal transport(GO:0008090) |
| 0.0 | 0.1 | GO:0003365 | establishment of cell polarity involved in ameboidal cell migration(GO:0003365) |
| 0.0 | 0.1 | GO:0036066 | protein O-linked fucosylation(GO:0036066) |
| 0.0 | 0.3 | GO:0001886 | endothelial cell morphogenesis(GO:0001886) |
| 0.0 | 0.1 | GO:0034971 | histone H3-R17 methylation(GO:0034971) |
| 0.0 | 0.1 | GO:0090234 | regulation of kinetochore assembly(GO:0090234) |
| 0.0 | 0.1 | GO:0099553 | trans-synaptic signaling by lipid(GO:0099541) trans-synaptic signaling by endocannabinoid(GO:0099542) trans-synaptic signaling by lipid, modulating synaptic transmission(GO:0099552) trans-synaptic signaling by endocannabinoid, modulating synaptic transmission(GO:0099553) |
| 0.0 | 0.1 | GO:0035696 | monocyte extravasation(GO:0035696) |
| 0.0 | 0.1 | GO:0051562 | negative regulation of mitochondrial calcium ion concentration(GO:0051562) |
| 0.0 | 0.4 | GO:0006688 | glycosphingolipid biosynthetic process(GO:0006688) |
| 0.0 | 0.1 | GO:0048691 | positive regulation of sprouting of injured axon(GO:0048687) positive regulation of axon extension involved in regeneration(GO:0048691) |
| 0.0 | 0.2 | GO:0033227 | dsRNA transport(GO:0033227) |
| 0.0 | 0.1 | GO:0061113 | pancreas morphogenesis(GO:0061113) |
| 0.0 | 0.1 | GO:0034141 | positive regulation of toll-like receptor 3 signaling pathway(GO:0034141) |
| 0.0 | 0.2 | GO:0000012 | single strand break repair(GO:0000012) |
| 0.0 | 0.2 | GO:0061029 | eyelid development in camera-type eye(GO:0061029) |
| 0.0 | 0.2 | GO:0010216 | maintenance of DNA methylation(GO:0010216) |
| 0.0 | 0.5 | GO:0006607 | NLS-bearing protein import into nucleus(GO:0006607) |
| 0.0 | 0.3 | GO:0021819 | layer formation in cerebral cortex(GO:0021819) |
| 0.0 | 0.1 | GO:0030263 | apoptotic chromosome condensation(GO:0030263) |
| 0.0 | 0.3 | GO:2000480 | negative regulation of cAMP-dependent protein kinase activity(GO:2000480) |
| 0.0 | 0.1 | GO:0097324 | melanocyte migration(GO:0097324) |
| 0.0 | 0.1 | GO:0032687 | negative regulation of interferon-alpha production(GO:0032687) |
| 0.0 | 0.1 | GO:0014908 | myotube differentiation involved in skeletal muscle regeneration(GO:0014908) |
| 0.0 | 0.1 | GO:0072513 | positive regulation of secondary heart field cardioblast proliferation(GO:0072513) |
| 0.0 | 0.1 | GO:0033030 | negative regulation of neutrophil apoptotic process(GO:0033030) |
| 0.0 | 0.1 | GO:0009957 | epidermal cell fate specification(GO:0009957) response to chlorate(GO:0010157) neural plate axis specification(GO:0021997) |
| 0.0 | 0.1 | GO:0061343 | cell adhesion involved in heart morphogenesis(GO:0061343) |
| 0.0 | 0.1 | GO:0090625 | mRNA cleavage involved in gene silencing by siRNA(GO:0090625) |
| 0.0 | 0.1 | GO:0045218 | zonula adherens maintenance(GO:0045218) |
| 0.0 | 0.1 | GO:0018344 | protein geranylgeranylation(GO:0018344) |
| 0.0 | 0.0 | GO:0033552 | response to vitamin B3(GO:0033552) |
| 0.0 | 0.3 | GO:0010839 | negative regulation of keratinocyte proliferation(GO:0010839) |
| 0.0 | 0.5 | GO:0031954 | positive regulation of protein autophosphorylation(GO:0031954) |
| 0.0 | 0.3 | GO:0001573 | ganglioside metabolic process(GO:0001573) |
| 0.0 | 0.1 | GO:0043382 | positive regulation of memory T cell differentiation(GO:0043382) |
| 0.0 | 0.0 | GO:1904339 | negative regulation of dopaminergic neuron differentiation(GO:1904339) |
| 0.0 | 0.2 | GO:1903715 | regulation of aerobic respiration(GO:1903715) |
| 0.0 | 0.1 | GO:1904217 | regulation of CDP-diacylglycerol-serine O-phosphatidyltransferase activity(GO:1904217) positive regulation of CDP-diacylglycerol-serine O-phosphatidyltransferase activity(GO:1904219) positive regulation of serine C-palmitoyltransferase activity(GO:1904222) |
| 0.0 | 0.4 | GO:1902187 | negative regulation of viral release from host cell(GO:1902187) |
| 0.0 | 0.1 | GO:0030505 | inorganic diphosphate transport(GO:0030505) |
| 0.0 | 0.2 | GO:0038028 | insulin receptor signaling pathway via phosphatidylinositol 3-kinase(GO:0038028) |
| 0.0 | 0.2 | GO:0072502 | cellular phosphate ion homeostasis(GO:0030643) cellular trivalent inorganic anion homeostasis(GO:0072502) |
| 0.0 | 0.1 | GO:0060708 | spongiotrophoblast differentiation(GO:0060708) |
| 0.0 | 0.1 | GO:0015691 | cadmium ion transport(GO:0015691) cadmium ion transmembrane transport(GO:0070574) |
| 0.0 | 0.3 | GO:0036092 | phosphatidylinositol-3-phosphate biosynthetic process(GO:0036092) |
| 0.0 | 0.1 | GO:0009157 | deoxyribonucleoside monophosphate biosynthetic process(GO:0009157) |
| 0.0 | 0.3 | GO:0035970 | peptidyl-threonine dephosphorylation(GO:0035970) |
| 0.0 | 0.2 | GO:0018095 | protein polyglutamylation(GO:0018095) |
| 0.0 | 0.4 | GO:0043968 | histone H2A acetylation(GO:0043968) |
| 0.0 | 0.1 | GO:2000074 | regulation of type B pancreatic cell development(GO:2000074) |
| 0.0 | 0.1 | GO:0006449 | regulation of translational termination(GO:0006449) |
| 0.0 | 0.4 | GO:0097503 | sialylation(GO:0097503) |
| 0.0 | 0.1 | GO:0070432 | regulation of nucleotide-binding oligomerization domain containing signaling pathway(GO:0070424) positive regulation of nucleotide-binding oligomerization domain containing signaling pathway(GO:0070426) regulation of nucleotide-binding oligomerization domain containing 1 signaling pathway(GO:0070428) regulation of nucleotide-binding oligomerization domain containing 2 signaling pathway(GO:0070432) positive regulation of nucleotide-binding oligomerization domain containing 2 signaling pathway(GO:0070434) |
| 0.0 | 0.2 | GO:0051382 | kinetochore assembly(GO:0051382) |
| 0.0 | 0.6 | GO:0007340 | acrosome reaction(GO:0007340) |
| 0.0 | 0.2 | GO:0022027 | interkinetic nuclear migration(GO:0022027) |
| 0.0 | 0.2 | GO:0032534 | regulation of microvillus assembly(GO:0032534) |
| 0.0 | 0.1 | GO:2000973 | regulation of pro-B cell differentiation(GO:2000973) |
| 0.0 | 0.2 | GO:1904322 | response to forskolin(GO:1904321) cellular response to forskolin(GO:1904322) |
| 0.0 | 0.1 | GO:0035609 | C-terminal protein deglutamylation(GO:0035609) |
| 0.0 | 0.1 | GO:0034773 | histone H4-K20 trimethylation(GO:0034773) |
| 0.0 | 0.1 | GO:1904424 | regulation of GTP binding(GO:1904424) |
| 0.0 | 0.1 | GO:0045054 | constitutive secretory pathway(GO:0045054) |
| 0.0 | 0.1 | GO:0002326 | B cell lineage commitment(GO:0002326) |
| 0.0 | 0.3 | GO:0080182 | histone H3-K4 trimethylation(GO:0080182) |
| 0.0 | 0.1 | GO:0048752 | semicircular canal morphogenesis(GO:0048752) |
| 0.0 | 0.1 | GO:2001184 | positive regulation of interleukin-12 secretion(GO:2001184) |
| 0.0 | 0.1 | GO:0001555 | oocyte growth(GO:0001555) |
| 0.0 | 0.2 | GO:0003334 | keratinocyte development(GO:0003334) |
| 0.0 | 0.1 | GO:0034454 | microtubule anchoring at centrosome(GO:0034454) |
| 0.0 | 0.6 | GO:0046854 | phosphatidylinositol phosphorylation(GO:0046854) |
| 0.0 | 0.1 | GO:0072592 | oxygen metabolic process(GO:0072592) |
| 0.0 | 0.1 | GO:0060327 | cytoplasmic actin-based contraction involved in cell motility(GO:0060327) |
| 0.0 | 0.1 | GO:1904674 | positive regulation of somatic stem cell population maintenance(GO:1904674) |
| 0.0 | 0.1 | GO:0042796 | snRNA transcription from RNA polymerase III promoter(GO:0042796) |
| 0.0 | 0.2 | GO:0040016 | embryonic cleavage(GO:0040016) |
| 0.0 | 0.1 | GO:0001682 | tRNA 5'-leader removal(GO:0001682) |
| 0.0 | 0.2 | GO:0007512 | adult heart development(GO:0007512) |
| 0.0 | 0.0 | GO:0048319 | axial mesoderm morphogenesis(GO:0048319) |
| 0.0 | 0.1 | GO:0016240 | autophagosome docking(GO:0016240) |
| 0.0 | 0.1 | GO:0046606 | negative regulation of centrosome duplication(GO:0010826) negative regulation of centrosome cycle(GO:0046606) |
| 0.0 | 0.2 | GO:0007258 | JUN phosphorylation(GO:0007258) |
| 0.0 | 0.3 | GO:2000114 | regulation of establishment of cell polarity(GO:2000114) |
| 0.0 | 0.0 | GO:1903334 | positive regulation of protein folding(GO:1903334) |
| 0.0 | 0.1 | GO:0001180 | transcription initiation from RNA polymerase I promoter for nuclear large rRNA transcript(GO:0001180) |
| 0.0 | 0.0 | GO:0045077 | negative regulation of interferon-gamma biosynthetic process(GO:0045077) |
| 0.0 | 0.1 | GO:0010606 | positive regulation of cytoplasmic mRNA processing body assembly(GO:0010606) |
| 0.0 | 0.1 | GO:0060926 | positive regulation of transcription of Notch receptor target(GO:0007221) cardiac pacemaker cell development(GO:0060926) |
| 0.0 | 0.1 | GO:0098789 | pre-mRNA cleavage required for polyadenylation(GO:0098789) |
| 0.0 | 0.0 | GO:0042631 | cellular response to water deprivation(GO:0042631) |
| 0.0 | 0.1 | GO:0070562 | regulation of vitamin D receptor signaling pathway(GO:0070562) |
| 0.0 | 0.1 | GO:0030050 | vesicle transport along actin filament(GO:0030050) |
| 0.0 | 0.1 | GO:0035507 | regulation of myosin-light-chain-phosphatase activity(GO:0035507) |
| 0.0 | 0.2 | GO:0072189 | ureter development(GO:0072189) |
| 0.0 | 0.0 | GO:0021898 | regulation of transcription from RNA polymerase II promoter involved in forebrain neuron fate commitment(GO:0021882) commitment of multipotent stem cells to neuronal lineage in forebrain(GO:0021898) |
| 0.0 | 0.2 | GO:1902083 | negative regulation of peptidyl-cysteine S-nitrosylation(GO:1902083) regulation of peptidyl-cysteine S-nitrosylation(GO:2000169) |
| 0.0 | 0.0 | GO:1902037 | negative regulation of hematopoietic stem cell differentiation(GO:1902037) |
| 0.0 | 0.2 | GO:0072600 | establishment of protein localization to Golgi(GO:0072600) |
| 0.0 | 0.1 | GO:0021798 | forebrain dorsal/ventral pattern formation(GO:0021798) |
| 0.0 | 0.0 | GO:0070649 | formin-nucleated actin cable assembly(GO:0070649) |
| 0.0 | 0.3 | GO:0090161 | Golgi ribbon formation(GO:0090161) |
| 0.0 | 0.0 | GO:0007037 | vacuolar phosphate transport(GO:0007037) positive regulation of parathyroid hormone secretion(GO:2000830) |
| 0.0 | 0.1 | GO:0060017 | parathyroid gland development(GO:0060017) |
| 0.0 | 0.1 | GO:0002002 | regulation of angiotensin levels in blood(GO:0002002) |
| 0.0 | 0.1 | GO:0070777 | D-aspartate transport(GO:0070777) D-aspartate import(GO:0070779) |
| 0.0 | 0.0 | GO:0006579 | amino-acid betaine catabolic process(GO:0006579) |
| 0.0 | 0.2 | GO:0000920 | cell separation after cytokinesis(GO:0000920) |
| 0.0 | 0.2 | GO:0009954 | proximal/distal pattern formation(GO:0009954) |
| 0.0 | 0.1 | GO:0071000 | response to magnetism(GO:0071000) |
| 0.0 | 0.1 | GO:0060178 | regulation of exocyst localization(GO:0060178) |
| 0.0 | 0.1 | GO:0060398 | regulation of growth hormone receptor signaling pathway(GO:0060398) |
| 0.0 | 0.1 | GO:0031053 | primary miRNA processing(GO:0031053) |
| 0.0 | 0.2 | GO:0070933 | histone H4 deacetylation(GO:0070933) |
| 0.0 | 0.4 | GO:0030866 | cortical actin cytoskeleton organization(GO:0030866) |
| 0.0 | 0.2 | GO:0016127 | cholesterol catabolic process(GO:0006707) sterol catabolic process(GO:0016127) |
| 0.0 | 0.1 | GO:0006020 | inositol metabolic process(GO:0006020) |
| 0.0 | 0.2 | GO:0048148 | behavioral response to cocaine(GO:0048148) |
| 0.0 | 0.3 | GO:0090162 | establishment of epithelial cell polarity(GO:0090162) |
| 0.0 | 0.0 | GO:2000124 | endocannabinoid signaling pathway(GO:0071926) regulation of endocannabinoid signaling pathway(GO:2000124) |
| 0.0 | 0.1 | GO:0072431 | DNA damage response, signal transduction by p53 class mediator resulting in cell cycle arrest(GO:0006977) signal transduction involved in mitotic G1 DNA damage checkpoint(GO:0072431) intracellular signal transduction involved in G1 DNA damage checkpoint(GO:1902400) |
| 0.0 | 0.0 | GO:0060354 | negative regulation of cell adhesion molecule production(GO:0060354) |
| 0.0 | 0.1 | GO:0071787 | endoplasmic reticulum tubular network assembly(GO:0071787) |
| 0.0 | 0.6 | GO:0000245 | spliceosomal complex assembly(GO:0000245) |
| 0.0 | 0.0 | GO:1990926 | short-term synaptic potentiation(GO:1990926) |
| 0.0 | 0.0 | GO:0070213 | protein auto-ADP-ribosylation(GO:0070213) |
| 0.0 | 0.0 | GO:0000414 | regulation of histone H3-K36 methylation(GO:0000414) |
| 0.0 | 0.0 | GO:0090074 | negative regulation of protein homodimerization activity(GO:0090074) |
| 0.0 | 0.1 | GO:0014894 | response to muscle inactivity involved in regulation of muscle adaptation(GO:0014877) response to denervation involved in regulation of muscle adaptation(GO:0014894) |
| 0.0 | 0.2 | GO:0051895 | negative regulation of focal adhesion assembly(GO:0051895) |
| 0.0 | 0.1 | GO:0051988 | regulation of attachment of spindle microtubules to kinetochore(GO:0051988) |
| 0.0 | 0.1 | GO:0060134 | prepulse inhibition(GO:0060134) |
| 0.0 | 0.1 | GO:2000819 | regulation of nucleotide-excision repair(GO:2000819) |
| 0.0 | 0.1 | GO:2000310 | regulation of N-methyl-D-aspartate selective glutamate receptor activity(GO:2000310) |
| 0.0 | 0.1 | GO:0006828 | manganese ion transport(GO:0006828) |
| 0.0 | 0.0 | GO:0045590 | negative regulation of regulatory T cell differentiation(GO:0045590) regulation of monocyte aggregation(GO:1900623) positive regulation of monocyte aggregation(GO:1900625) |
| 0.0 | 0.2 | GO:0032012 | regulation of ARF protein signal transduction(GO:0032012) |
| 0.0 | 0.1 | GO:1903361 | protein localization to basolateral plasma membrane(GO:1903361) |
| 0.0 | 0.2 | GO:0006003 | fructose 2,6-bisphosphate metabolic process(GO:0006003) |
| 0.0 | 0.1 | GO:1990440 | positive regulation of transcription from RNA polymerase II promoter in response to endoplasmic reticulum stress(GO:1990440) |
| 0.0 | 0.0 | GO:0002378 | immunoglobulin biosynthetic process(GO:0002378) |
| 0.0 | 0.1 | GO:0010715 | regulation of extracellular matrix disassembly(GO:0010715) |
| 0.0 | 0.4 | GO:0048013 | ephrin receptor signaling pathway(GO:0048013) |
| 0.0 | 0.1 | GO:0043982 | histone H4-K5 acetylation(GO:0043981) histone H4-K8 acetylation(GO:0043982) |
| 0.0 | 0.1 | GO:0014842 | regulation of skeletal muscle satellite cell proliferation(GO:0014842) |
| 0.0 | 0.1 | GO:0010040 | response to iron(II) ion(GO:0010040) |
| 0.0 | 0.1 | GO:0050915 | sensory perception of sour taste(GO:0050915) |
| 0.0 | 0.1 | GO:0070102 | interleukin-6-mediated signaling pathway(GO:0070102) |
Gene overrepresentation in cellular component category:
| Log-likelihood per target | Total log-likelihood | Term | Description |
|---|---|---|---|
| 0.1 | 0.4 | GO:0071149 | TEAD-2-YAP complex(GO:0071149) |
| 0.1 | 0.3 | GO:0034686 | integrin alphav-beta8 complex(GO:0034686) |
| 0.1 | 0.2 | GO:0016533 | cyclin-dependent protein kinase 5 holoenzyme complex(GO:0016533) |
| 0.1 | 0.3 | GO:0031592 | centrosomal corona(GO:0031592) |
| 0.1 | 0.2 | GO:0044393 | microspike(GO:0044393) |
| 0.1 | 0.2 | GO:0014701 | junctional sarcoplasmic reticulum membrane(GO:0014701) |
| 0.1 | 0.9 | GO:0031258 | lamellipodium membrane(GO:0031258) |
| 0.1 | 0.2 | GO:0071914 | prominosome(GO:0071914) |
| 0.1 | 0.2 | GO:0005960 | glycine cleavage complex(GO:0005960) |
| 0.1 | 0.4 | GO:0036449 | microtubule minus-end(GO:0036449) |
| 0.0 | 0.4 | GO:0008290 | F-actin capping protein complex(GO:0008290) |
| 0.0 | 0.1 | GO:1990907 | Scrib-APC-beta-catenin complex(GO:0034750) beta-catenin-TCF complex(GO:1990907) |
| 0.0 | 0.2 | GO:0097165 | nuclear stress granule(GO:0097165) |
| 0.0 | 0.3 | GO:0016602 | CCAAT-binding factor complex(GO:0016602) |
| 0.0 | 0.6 | GO:0000124 | SAGA complex(GO:0000124) |
| 0.0 | 0.3 | GO:0097524 | sperm plasma membrane(GO:0097524) |
| 0.0 | 0.6 | GO:0071565 | nBAF complex(GO:0071565) |
| 0.0 | 0.1 | GO:0002944 | cyclin K-CDK12 complex(GO:0002944) |
| 0.0 | 0.3 | GO:1990316 | ATG1/ULK1 kinase complex(GO:1990316) |
| 0.0 | 0.1 | GO:0043511 | inhibin complex(GO:0043511) |
| 0.0 | 0.1 | GO:1990589 | ATF4-CREB1 transcription factor complex(GO:1990589) |
| 0.0 | 0.2 | GO:0009330 | DNA topoisomerase complex (ATP-hydrolyzing)(GO:0009330) |
| 0.0 | 0.2 | GO:0005726 | perichromatin fibrils(GO:0005726) |
| 0.0 | 0.6 | GO:0005883 | neurofilament(GO:0005883) |
| 0.0 | 0.1 | GO:0005968 | Rab-protein geranylgeranyltransferase complex(GO:0005968) |
| 0.0 | 0.2 | GO:0032444 | activin responsive factor complex(GO:0032444) |
| 0.0 | 0.1 | GO:0097025 | MPP7-DLG1-LIN7 complex(GO:0097025) |
| 0.0 | 0.1 | GO:0097427 | microtubule bundle(GO:0097427) |
| 0.0 | 0.4 | GO:0044666 | MLL3/4 complex(GO:0044666) |
| 0.0 | 0.4 | GO:0031616 | spindle pole centrosome(GO:0031616) |
| 0.0 | 0.3 | GO:0034098 | VCP-NPL4-UFD1 AAA ATPase complex(GO:0034098) |
| 0.0 | 0.2 | GO:0097443 | sorting endosome(GO:0097443) |
| 0.0 | 0.1 | GO:0098855 | HCN channel complex(GO:0098855) |
| 0.0 | 0.4 | GO:0005675 | holo TFIIH complex(GO:0005675) |
| 0.0 | 0.1 | GO:0061574 | ASAP complex(GO:0061574) |
| 0.0 | 0.1 | GO:0035363 | histone locus body(GO:0035363) |
| 0.0 | 0.1 | GO:0044614 | nuclear pore cytoplasmic filaments(GO:0044614) |
| 0.0 | 0.1 | GO:0044317 | rod spherule(GO:0044317) |
| 0.0 | 0.2 | GO:0031314 | extrinsic component of mitochondrial inner membrane(GO:0031314) |
| 0.0 | 0.5 | GO:0005942 | phosphatidylinositol 3-kinase complex(GO:0005942) |
| 0.0 | 0.1 | GO:0002142 | stereocilia ankle link complex(GO:0002142) |
| 0.0 | 0.3 | GO:0048188 | Set1C/COMPASS complex(GO:0048188) |
| 0.0 | 0.4 | GO:0031527 | filopodium membrane(GO:0031527) |
| 0.0 | 0.1 | GO:0000120 | RNA polymerase I transcription factor complex(GO:0000120) |
| 0.0 | 0.1 | GO:0000172 | ribonuclease MRP complex(GO:0000172) |
| 0.0 | 0.2 | GO:0071821 | FANCM-MHF complex(GO:0071821) |
| 0.0 | 0.1 | GO:0060053 | neurofilament cytoskeleton(GO:0060053) |
| 0.0 | 0.1 | GO:0000444 | MIS12/MIND type complex(GO:0000444) |
| 0.0 | 0.1 | GO:0002193 | MAML1-RBP-Jkappa- ICN1 complex(GO:0002193) |
| 0.0 | 0.0 | GO:0097629 | extrinsic component of omegasome membrane(GO:0097629) |
| 0.0 | 0.2 | GO:0001940 | male pronucleus(GO:0001940) |
| 0.0 | 0.1 | GO:0002079 | inner acrosomal membrane(GO:0002079) |
| 0.0 | 0.2 | GO:0036057 | filtration diaphragm(GO:0036056) slit diaphragm(GO:0036057) |
| 0.0 | 0.1 | GO:0071008 | U2-type post-mRNA release spliceosomal complex(GO:0071008) |
| 0.0 | 0.1 | GO:0035101 | FACT complex(GO:0035101) |
| 0.0 | 0.1 | GO:0030914 | STAGA complex(GO:0030914) |
| 0.0 | 0.0 | GO:0016514 | SWI/SNF complex(GO:0016514) |
| 0.0 | 0.1 | GO:0097136 | Bcl-2 family protein complex(GO:0097136) |
| 0.0 | 0.1 | GO:0008282 | ATP-sensitive potassium channel complex(GO:0008282) |
| 0.0 | 0.1 | GO:0032777 | Piccolo NuA4 histone acetyltransferase complex(GO:0032777) |
| 0.0 | 1.1 | GO:0032580 | Golgi cisterna membrane(GO:0032580) |
| 0.0 | 0.1 | GO:0070436 | Grb2-EGFR complex(GO:0070436) |
| 0.0 | 0.2 | GO:0044294 | dendritic growth cone(GO:0044294) |
| 0.0 | 0.1 | GO:0034992 | microtubule organizing center attachment site(GO:0034992) LINC complex(GO:0034993) |
| 0.0 | 0.3 | GO:0001741 | XY body(GO:0001741) |
| 0.0 | 0.1 | GO:0031209 | SCAR complex(GO:0031209) |
| 0.0 | 0.1 | GO:0097425 | smooth endoplasmic reticulum membrane(GO:0030868) smooth endoplasmic reticulum part(GO:0097425) |
| 0.0 | 0.2 | GO:0071437 | invadopodium(GO:0071437) |
| 0.0 | 0.3 | GO:0097038 | perinuclear endoplasmic reticulum(GO:0097038) |
| 0.0 | 0.0 | GO:1990836 | lysosomal matrix(GO:1990836) |
| 0.0 | 0.2 | GO:0070971 | endoplasmic reticulum exit site(GO:0070971) |
| 0.0 | 0.1 | GO:0097512 | cardiac myofibril(GO:0097512) |
| 0.0 | 0.2 | GO:0032045 | guanyl-nucleotide exchange factor complex(GO:0032045) |
| 0.0 | 0.2 | GO:0048787 | presynaptic active zone membrane(GO:0048787) |
| 0.0 | 0.1 | GO:0000813 | ESCRT I complex(GO:0000813) |
| 0.0 | 0.1 | GO:1990023 | mitotic spindle midzone(GO:1990023) |
| 0.0 | 0.4 | GO:0080008 | Cul4-RING E3 ubiquitin ligase complex(GO:0080008) |
| 0.0 | 0.8 | GO:0005871 | kinesin complex(GO:0005871) |
| 0.0 | 0.3 | GO:0016327 | apicolateral plasma membrane(GO:0016327) |
| 0.0 | 0.1 | GO:0035068 | micro-ribonucleoprotein complex(GO:0035068) |
| 0.0 | 0.4 | GO:0035861 | site of double-strand break(GO:0035861) |
| 0.0 | 0.1 | GO:0032389 | MutLalpha complex(GO:0032389) |
| 0.0 | 0.2 | GO:0032593 | insulin-responsive compartment(GO:0032593) |
| 0.0 | 0.1 | GO:0000137 | Golgi cis cisterna(GO:0000137) |
| 0.0 | 0.2 | GO:0005916 | fascia adherens(GO:0005916) |
| 0.0 | 0.3 | GO:0000145 | exocyst(GO:0000145) |
| 0.0 | 0.3 | GO:1990752 | microtubule end(GO:1990752) |
| 0.0 | 0.1 | GO:0070775 | H3 histone acetyltransferase complex(GO:0070775) MOZ/MORF histone acetyltransferase complex(GO:0070776) |
| 0.0 | 0.1 | GO:0016012 | sarcoglycan complex(GO:0016012) |
| 0.0 | 0.1 | GO:0031315 | extrinsic component of mitochondrial outer membrane(GO:0031315) |
| 0.0 | 0.2 | GO:0030014 | CCR4-NOT complex(GO:0030014) |
| 0.0 | 0.2 | GO:0035102 | PRC1 complex(GO:0035102) |
| 0.0 | 0.3 | GO:0097440 | apical dendrite(GO:0097440) |
Gene overrepresentation in molecular function category:
| Log-likelihood per target | Total log-likelihood | Term | Description |
|---|---|---|---|
| 0.1 | 0.6 | GO:0008489 | UDP-galactose:glucosylceramide beta-1,4-galactosyltransferase activity(GO:0008489) |
| 0.1 | 0.3 | GO:0047783 | steroid 11-beta-monooxygenase activity(GO:0004507) corticosterone 18-monooxygenase activity(GO:0047783) |
| 0.1 | 0.3 | GO:0004832 | valine-tRNA ligase activity(GO:0004832) |
| 0.1 | 0.4 | GO:0003835 | beta-galactoside alpha-2,6-sialyltransferase activity(GO:0003835) |
| 0.1 | 0.3 | GO:0060002 | plus-end directed microfilament motor activity(GO:0060002) |
| 0.1 | 0.2 | GO:0023030 | MHC class Ib protein complex binding(GO:0023025) MHC class Ib protein binding, via antigen binding groove(GO:0023030) |
| 0.1 | 0.3 | GO:0003989 | acetyl-CoA carboxylase activity(GO:0003989) |
| 0.1 | 0.3 | GO:0000822 | inositol hexakisphosphate binding(GO:0000822) |
| 0.1 | 0.3 | GO:0070699 | type II activin receptor binding(GO:0070699) |
| 0.1 | 0.4 | GO:0004105 | choline-phosphate cytidylyltransferase activity(GO:0004105) |
| 0.1 | 0.3 | GO:0033142 | progesterone receptor binding(GO:0033142) |
| 0.1 | 0.2 | GO:0009378 | four-way junction helicase activity(GO:0009378) |
| 0.1 | 0.3 | GO:0036435 | K48-linked polyubiquitin binding(GO:0036435) |
| 0.1 | 0.2 | GO:0015222 | serotonin transmembrane transporter activity(GO:0015222) |
| 0.1 | 0.2 | GO:0008396 | oxysterol 7-alpha-hydroxylase activity(GO:0008396) |
| 0.0 | 0.4 | GO:0071253 | connexin binding(GO:0071253) |
| 0.0 | 0.3 | GO:0000405 | bubble DNA binding(GO:0000405) |
| 0.0 | 0.2 | GO:0045322 | unmethylated CpG binding(GO:0045322) |
| 0.0 | 0.1 | GO:0015265 | urea channel activity(GO:0015265) |
| 0.0 | 0.6 | GO:0098919 | structural constituent of postsynaptic specialization(GO:0098879) structural constituent of postsynaptic density(GO:0098919) |
| 0.0 | 0.2 | GO:0070579 | methylcytosine dioxygenase activity(GO:0070579) |
| 0.0 | 0.7 | GO:0035497 | cAMP response element binding(GO:0035497) |
| 0.0 | 0.4 | GO:0035005 | 1-phosphatidylinositol-4-phosphate 3-kinase activity(GO:0035005) |
| 0.0 | 0.2 | GO:0019784 | NEDD8-specific protease activity(GO:0019784) |
| 0.0 | 0.1 | GO:0042799 | histone methyltransferase activity (H4-K20 specific)(GO:0042799) |
| 0.0 | 0.5 | GO:0042608 | T cell receptor binding(GO:0042608) |
| 0.0 | 0.2 | GO:0015467 | G-protein activated inward rectifier potassium channel activity(GO:0015467) |
| 0.0 | 0.1 | GO:0050265 | RNA uridylyltransferase activity(GO:0050265) |
| 0.0 | 0.3 | GO:0045504 | dynein heavy chain binding(GO:0045504) |
| 0.0 | 0.4 | GO:0003680 | AT DNA binding(GO:0003680) |
| 0.0 | 0.8 | GO:0010485 | H4 histone acetyltransferase activity(GO:0010485) |
| 0.0 | 0.3 | GO:0005007 | fibroblast growth factor-activated receptor activity(GO:0005007) |
| 0.0 | 0.2 | GO:0071558 | histone demethylase activity (H3-K27 specific)(GO:0071558) |
| 0.0 | 0.2 | GO:0031802 | type 5 metabotropic glutamate receptor binding(GO:0031802) |
| 0.0 | 0.1 | GO:0000829 | inositol heptakisphosphate kinase activity(GO:0000829) |
| 0.0 | 0.1 | GO:0019136 | pyrimidine nucleoside binding(GO:0001884) deoxynucleoside kinase activity(GO:0019136) |
| 0.0 | 0.2 | GO:0061578 | Lys63-specific deubiquitinase activity(GO:0061578) |
| 0.0 | 1.3 | GO:0046875 | ephrin receptor binding(GO:0046875) |
| 0.0 | 0.0 | GO:0005072 | transforming growth factor beta receptor, cytoplasmic mediator activity(GO:0005072) |
| 0.0 | 0.1 | GO:0031697 | beta-1 adrenergic receptor binding(GO:0031697) |
| 0.0 | 0.4 | GO:0047372 | acylglycerol lipase activity(GO:0047372) |
| 0.0 | 0.2 | GO:0004616 | phosphogluconate dehydrogenase (decarboxylating) activity(GO:0004616) |
| 0.0 | 0.2 | GO:0097016 | L27 domain binding(GO:0097016) |
| 0.0 | 0.2 | GO:0046935 | 1-phosphatidylinositol-3-kinase regulator activity(GO:0046935) |
| 0.0 | 0.2 | GO:0008332 | low voltage-gated calcium channel activity(GO:0008332) |
| 0.0 | 0.1 | GO:0060072 | large conductance calcium-activated potassium channel activity(GO:0060072) |
| 0.0 | 0.1 | GO:0031849 | olfactory receptor binding(GO:0031849) |
| 0.0 | 0.1 | GO:0005146 | leukemia inhibitory factor receptor binding(GO:0005146) |
| 0.0 | 0.1 | GO:0005166 | neurotrophin p75 receptor binding(GO:0005166) |
| 0.0 | 0.2 | GO:0043199 | sulfate binding(GO:0043199) |
| 0.0 | 0.2 | GO:0035374 | chondroitin sulfate binding(GO:0035374) |
| 0.0 | 0.1 | GO:0005030 | neurotrophin receptor activity(GO:0005030) |
| 0.0 | 0.5 | GO:0042800 | histone methyltransferase activity (H3-K4 specific)(GO:0042800) |
| 0.0 | 0.1 | GO:0030350 | iron-responsive element binding(GO:0030350) |
| 0.0 | 0.2 | GO:0003917 | DNA topoisomerase type I activity(GO:0003917) |
| 0.0 | 0.3 | GO:0070513 | death domain binding(GO:0070513) |
| 0.0 | 0.1 | GO:0070644 | vitamin D response element binding(GO:0070644) |
| 0.0 | 0.3 | GO:0070097 | delta-catenin binding(GO:0070097) |
| 0.0 | 0.2 | GO:0043515 | kinetochore binding(GO:0043515) |
| 0.0 | 0.1 | GO:0005119 | smoothened binding(GO:0005119) |
| 0.0 | 0.2 | GO:0005049 | nuclear export signal receptor activity(GO:0005049) |
| 0.0 | 0.3 | GO:0045295 | gamma-catenin binding(GO:0045295) |
| 0.0 | 0.3 | GO:0004862 | cAMP-dependent protein kinase inhibitor activity(GO:0004862) |
| 0.0 | 0.2 | GO:0086080 | protein binding involved in heterotypic cell-cell adhesion(GO:0086080) |
| 0.0 | 0.1 | GO:0032795 | heterotrimeric G-protein binding(GO:0032795) |
| 0.0 | 0.2 | GO:0008273 | calcium, potassium:sodium antiporter activity(GO:0008273) |
| 0.0 | 0.1 | GO:0008281 | sulfonylurea receptor activity(GO:0008281) |
| 0.0 | 0.2 | GO:0051011 | microtubule minus-end binding(GO:0051011) |
| 0.0 | 0.1 | GO:0000171 | ribonuclease MRP activity(GO:0000171) |
| 0.0 | 0.1 | GO:0070012 | oligopeptidase activity(GO:0070012) |
| 0.0 | 0.1 | GO:0008330 | protein tyrosine/threonine phosphatase activity(GO:0008330) |
| 0.0 | 0.1 | GO:0004949 | cannabinoid receptor activity(GO:0004949) |
| 0.0 | 0.1 | GO:0016300 | tRNA (uracil) methyltransferase activity(GO:0016300) |
| 0.0 | 0.9 | GO:0061733 | peptide-lysine-N-acetyltransferase activity(GO:0061733) |
| 0.0 | 0.4 | GO:0005035 | tumor necrosis factor-activated receptor activity(GO:0005031) death receptor activity(GO:0005035) |
| 0.0 | 0.2 | GO:0043495 | protein anchor(GO:0043495) |
| 0.0 | 0.1 | GO:0044736 | acid-sensing ion channel activity(GO:0044736) |
| 0.0 | 0.1 | GO:0015016 | [heparan sulfate]-glucosamine N-sulfotransferase activity(GO:0015016) |
| 0.0 | 0.2 | GO:0046974 | histone methyltransferase activity (H3-K9 specific)(GO:0046974) |
| 0.0 | 0.2 | GO:0045294 | alpha-catenin binding(GO:0045294) |
| 0.0 | 0.1 | GO:0004322 | ferroxidase activity(GO:0004322) oxidoreductase activity, oxidizing metal ions, oxygen as acceptor(GO:0016724) |
| 0.0 | 0.1 | GO:0061665 | SUMO ligase activity(GO:0061665) |
| 0.0 | 0.4 | GO:0005161 | platelet-derived growth factor receptor binding(GO:0005161) |
| 0.0 | 0.1 | GO:0031127 | galactoside 2-alpha-L-fucosyltransferase activity(GO:0008107) alpha-(1,2)-fucosyltransferase activity(GO:0031127) |
| 0.0 | 0.5 | GO:0008139 | nuclear localization sequence binding(GO:0008139) |
| 0.0 | 0.1 | GO:1990430 | extracellular matrix protein binding(GO:1990430) |
| 0.0 | 0.1 | GO:0004663 | Rab geranylgeranyltransferase activity(GO:0004663) |
| 0.0 | 0.2 | GO:0016909 | JUN kinase activity(GO:0004705) SAP kinase activity(GO:0016909) |
| 0.0 | 0.3 | GO:0004535 | poly(A)-specific ribonuclease activity(GO:0004535) |
| 0.0 | 0.1 | GO:0035650 | AP-1 adaptor complex binding(GO:0035650) |
| 0.0 | 0.3 | GO:0015279 | store-operated calcium channel activity(GO:0015279) |
| 0.0 | 0.1 | GO:0001030 | RNA polymerase III type 1 promoter DNA binding(GO:0001030) RNA polymerase III type 2 promoter DNA binding(GO:0001031) 5S rDNA binding(GO:0080084) |
| 0.0 | 0.4 | GO:0035259 | glucocorticoid receptor binding(GO:0035259) |
| 0.0 | 0.2 | GO:0016004 | phospholipase activator activity(GO:0016004) |
| 0.0 | 0.3 | GO:0070628 | proteasome binding(GO:0070628) |
| 0.0 | 0.1 | GO:0001042 | RNA polymerase I core binding(GO:0001042) |
| 0.0 | 0.1 | GO:0035612 | AP-2 adaptor complex binding(GO:0035612) |
| 0.0 | 0.4 | GO:0004709 | MAP kinase kinase kinase activity(GO:0004709) |
| 0.0 | 0.1 | GO:0034056 | estrogen response element binding(GO:0034056) |
| 0.0 | 0.1 | GO:0005113 | patched binding(GO:0005113) |
| 0.0 | 0.1 | GO:0038062 | protein tyrosine kinase collagen receptor activity(GO:0038062) |
| 0.0 | 0.1 | GO:0015198 | oligopeptide transporter activity(GO:0015198) |
| 0.0 | 0.1 | GO:0098518 | polynucleotide phosphatase activity(GO:0098518) |
| 0.0 | 0.1 | GO:0005314 | high-affinity glutamate transmembrane transporter activity(GO:0005314) |
| 0.0 | 0.3 | GO:0004190 | aspartic-type endopeptidase activity(GO:0004190) |
| 0.0 | 1.1 | GO:0008013 | beta-catenin binding(GO:0008013) |
| 0.0 | 0.1 | GO:0008239 | dipeptidyl-peptidase activity(GO:0008239) |
| 0.0 | 0.1 | GO:0004525 | ribonuclease III activity(GO:0004525) double-stranded RNA-specific ribonuclease activity(GO:0032296) |
| 0.0 | 0.1 | GO:0035242 | protein-arginine omega-N asymmetric methyltransferase activity(GO:0035242) |
| 0.0 | 0.1 | GO:0005315 | inorganic phosphate transmembrane transporter activity(GO:0005315) |
| 0.0 | 0.2 | GO:0003873 | 6-phosphofructo-2-kinase activity(GO:0003873) fructose-2,6-bisphosphate 2-phosphatase activity(GO:0004331) |
| 0.0 | 1.2 | GO:0005089 | Rho guanyl-nucleotide exchange factor activity(GO:0005089) |
| 0.0 | 0.1 | GO:0008440 | inositol-1,4,5-trisphosphate 3-kinase activity(GO:0008440) |
| 0.0 | 0.2 | GO:0017017 | MAP kinase tyrosine/serine/threonine phosphatase activity(GO:0017017) |
| 0.0 | 0.2 | GO:0016594 | glycine binding(GO:0016594) |
| 0.0 | 0.1 | GO:0016308 | 1-phosphatidylinositol-4-phosphate 5-kinase activity(GO:0016308) |
| 0.0 | 0.1 | GO:0017034 | Rap guanyl-nucleotide exchange factor activity(GO:0017034) |
| 0.0 | 0.2 | GO:0046527 | glucosyltransferase activity(GO:0046527) |
| 0.0 | 0.2 | GO:0017166 | vinculin binding(GO:0017166) |
| 0.0 | 0.2 | GO:0030215 | semaphorin receptor binding(GO:0030215) |
| 0.0 | 0.1 | GO:0036033 | mediator complex binding(GO:0036033) |
| 0.0 | 0.4 | GO:0003887 | DNA-directed DNA polymerase activity(GO:0003887) |
| 0.0 | 0.0 | GO:0005078 | MAP-kinase scaffold activity(GO:0005078) |
| 0.0 | 0.0 | GO:0031686 | A1 adenosine receptor binding(GO:0031686) |
| 0.0 | 0.1 | GO:0030898 | actin-dependent ATPase activity(GO:0030898) |
| 0.0 | 0.7 | GO:0005088 | Ras guanyl-nucleotide exchange factor activity(GO:0005088) |
| 0.0 | 0.1 | GO:0070410 | co-SMAD binding(GO:0070410) |
| 0.0 | 0.3 | GO:0043015 | gamma-tubulin binding(GO:0043015) |
| 0.0 | 0.1 | GO:0005025 | transforming growth factor beta receptor activity, type I(GO:0005025) |
| 0.0 | 0.1 | GO:0034511 | U3 snoRNA binding(GO:0034511) |
| 0.0 | 0.1 | GO:0015349 | thyroid hormone transmembrane transporter activity(GO:0015349) |
| 0.0 | 0.2 | GO:0080025 | phosphatidylinositol-3,5-bisphosphate binding(GO:0080025) |
| 0.0 | 0.2 | GO:0015026 | coreceptor activity(GO:0015026) |
| 0.0 | 0.1 | GO:0047555 | 3',5'-cyclic-GMP phosphodiesterase activity(GO:0047555) |
| 0.0 | 0.1 | GO:0051010 | microtubule plus-end binding(GO:0051010) |
| 0.0 | 0.7 | GO:0003777 | microtubule motor activity(GO:0003777) |
| 0.0 | 0.2 | GO:0031435 | mitogen-activated protein kinase kinase kinase binding(GO:0031435) |
| 0.0 | 0.2 | GO:0018024 | histone-lysine N-methyltransferase activity(GO:0018024) |
Gene overrepresentation in curated gene sets: canonical pathways category:
| Log-likelihood per target | Total log-likelihood | Term | Description |
|---|---|---|---|
| 0.0 | 0.2 | PID ARF6 DOWNSTREAM PATHWAY | Arf6 downstream pathway |
| 0.0 | 0.2 | PID ALK2 PATHWAY | ALK2 signaling events |
| 0.0 | 0.3 | PID ANTHRAX PATHWAY | Cellular roles of Anthrax toxin |
| 0.0 | 0.1 | ST PAC1 RECEPTOR PATHWAY | PAC1 Receptor Pathway |
| 0.0 | 0.6 | ST WNT BETA CATENIN PATHWAY | Wnt/beta-catenin Pathway |
| 0.0 | 1.3 | PID CDC42 PATHWAY | CDC42 signaling events |
| 0.0 | 0.4 | ST ADRENERGIC | Adrenergic Pathway |
| 0.0 | 0.5 | PID LIS1 PATHWAY | Lissencephaly gene (LIS1) in neuronal migration and development |
| 0.0 | 0.7 | PID ERBB1 RECEPTOR PROXIMAL PATHWAY | EGF receptor (ErbB1) signaling pathway |
| 0.0 | 0.4 | PID HDAC CLASSIII PATHWAY | Signaling events mediated by HDAC Class III |
| 0.0 | 0.1 | ST TYPE I INTERFERON PATHWAY | Type I Interferon (alpha/beta IFN) Pathway |
| 0.0 | 0.3 | PID INTEGRIN5 PATHWAY | Beta5 beta6 beta7 and beta8 integrin cell surface interactions |
| 0.0 | 0.4 | PID CD40 PATHWAY | CD40/CD40L signaling |
| 0.0 | 0.3 | PID NETRIN PATHWAY | Netrin-mediated signaling events |
| 0.0 | 0.8 | PID AR TF PATHWAY | Regulation of Androgen receptor activity |
| 0.0 | 0.4 | PID ERBB4 PATHWAY | ErbB4 signaling events |
| 0.0 | 0.1 | PID FOXO PATHWAY | FoxO family signaling |
| 0.0 | 0.2 | PID PI3K PLC TRK PATHWAY | Trk receptor signaling mediated by PI3K and PLC-gamma |
| 0.0 | 0.2 | PID P38 MKK3 6PATHWAY | p38 MAPK signaling pathway |
| 0.0 | 0.3 | ST B CELL ANTIGEN RECEPTOR | B Cell Antigen Receptor |
| 0.0 | 0.1 | PID S1P S1P2 PATHWAY | S1P2 pathway |
| 0.0 | 0.8 | PID MYC REPRESS PATHWAY | Validated targets of C-MYC transcriptional repression |
| 0.0 | 0.6 | PID CASPASE PATHWAY | Caspase cascade in apoptosis |
| 0.0 | 0.2 | PID ERBB2 ERBB3 PATHWAY | ErbB2/ErbB3 signaling events |
| 0.0 | 0.1 | ST TUMOR NECROSIS FACTOR PATHWAY | Tumor Necrosis Factor Pathway. |
| 0.0 | 0.5 | PID TRKR PATHWAY | Neurotrophic factor-mediated Trk receptor signaling |
| 0.0 | 0.3 | PID EPHA FWDPATHWAY | EPHA forward signaling |
| 0.0 | 0.3 | PID NCADHERIN PATHWAY | N-cadherin signaling events |
| 0.0 | 0.4 | PID AJDISS 2PATHWAY | Posttranslational regulation of adherens junction stability and dissassembly |
| 0.0 | 0.1 | PID S1P META PATHWAY | Sphingosine 1-phosphate (S1P) pathway |
Gene overrepresentation in curated gene sets: REACTOME pathways category:
| Log-likelihood per target | Total log-likelihood | Term | Description |
|---|---|---|---|
| 0.0 | 0.1 | REACTOME APC C CDH1 MEDIATED DEGRADATION OF CDC20 AND OTHER APC C CDH1 TARGETED PROTEINS IN LATE MITOSIS EARLY G1 | Genes involved in APC/C:Cdh1 mediated degradation of Cdc20 and other APC/C:Cdh1 targeted proteins in late mitosis/early G1 |
| 0.0 | 0.4 | REACTOME ACTIVATION OF CHAPERONE GENES BY ATF6 ALPHA | Genes involved in Activation of Chaperone Genes by ATF6-alpha |
| 0.0 | 0.5 | REACTOME SYNTHESIS SECRETION AND INACTIVATION OF GIP | Genes involved in Synthesis, Secretion, and Inactivation of Glucose-dependent Insulinotropic Polypeptide (GIP) |
| 0.0 | 1.2 | REACTOME MYOGENESIS | Genes involved in Myogenesis |
| 0.0 | 0.5 | REACTOME N GLYCAN ANTENNAE ELONGATION | Genes involved in N-Glycan antennae elongation |
| 0.0 | 0.3 | REACTOME VEGF LIGAND RECEPTOR INTERACTIONS | Genes involved in VEGF ligand-receptor interactions |
| 0.0 | 0.3 | REACTOME ACTIVATION OF THE AP1 FAMILY OF TRANSCRIPTION FACTORS | Genes involved in Activation of the AP-1 family of transcription factors |
| 0.0 | 0.5 | REACTOME CRMPS IN SEMA3A SIGNALING | Genes involved in CRMPs in Sema3A signaling |
| 0.0 | 0.4 | REACTOME ENDOGENOUS STEROLS | Genes involved in Endogenous sterols |
| 0.0 | 0.6 | REACTOME SIGNALING BY HIPPO | Genes involved in Signaling by Hippo |
| 0.0 | 0.4 | REACTOME SHC MEDIATED SIGNALLING | Genes involved in SHC-mediated signalling |
| 0.0 | 0.3 | REACTOME FGFR1 LIGAND BINDING AND ACTIVATION | Genes involved in FGFR1 ligand binding and activation |
| 0.0 | 0.5 | REACTOME CASPASE MEDIATED CLEAVAGE OF CYTOSKELETAL PROTEINS | Genes involved in Caspase-mediated cleavage of cytoskeletal proteins |
| 0.0 | 0.1 | REACTOME SIGNALING BY CONSTITUTIVELY ACTIVE EGFR | Genes involved in Signaling by constitutively active EGFR |
| 0.0 | 0.4 | REACTOME INTRINSIC PATHWAY | Genes involved in Intrinsic Pathway |
| 0.0 | 0.3 | REACTOME REGULATION OF SIGNALING BY CBL | Genes involved in Regulation of signaling by CBL |
| 0.0 | 0.3 | REACTOME HYALURONAN METABOLISM | Genes involved in Hyaluronan metabolism |
| 0.0 | 0.5 | REACTOME CIRCADIAN REPRESSION OF EXPRESSION BY REV ERBA | Genes involved in Circadian Repression of Expression by REV-ERBA |
| 0.0 | 0.0 | REACTOME ARMS MEDIATED ACTIVATION | Genes involved in ARMS-mediated activation |
| 0.0 | 0.4 | REACTOME FORMATION OF INCISION COMPLEX IN GG NER | Genes involved in Formation of incision complex in GG-NER |
| 0.0 | 0.1 | REACTOME DSCAM INTERACTIONS | Genes involved in DSCAM interactions |
| 0.0 | 0.7 | REACTOME O LINKED GLYCOSYLATION OF MUCINS | Genes involved in O-linked glycosylation of mucins |
| 0.0 | 0.4 | REACTOME DOWNREGULATION OF SMAD2 3 SMAD4 TRANSCRIPTIONAL ACTIVITY | Genes involved in Downregulation of SMAD2/3:SMAD4 transcriptional activity |
| 0.0 | 0.2 | REACTOME NEPHRIN INTERACTIONS | Genes involved in Nephrin interactions |
| 0.0 | 0.7 | REACTOME NETRIN1 SIGNALING | Genes involved in Netrin-1 signaling |
| 0.0 | 0.6 | REACTOME NOTCH1 INTRACELLULAR DOMAIN REGULATES TRANSCRIPTION | Genes involved in NOTCH1 Intracellular Domain Regulates Transcription |
| 0.0 | 0.2 | REACTOME OTHER SEMAPHORIN INTERACTIONS | Genes involved in Other semaphorin interactions |
| 0.0 | 0.1 | REACTOME ROLE OF DCC IN REGULATING APOPTOSIS | Genes involved in Role of DCC in regulating apoptosis |
| 0.0 | 0.6 | REACTOME IMMUNOREGULATORY INTERACTIONS BETWEEN A LYMPHOID AND A NON LYMPHOID CELL | Genes involved in Immunoregulatory interactions between a Lymphoid and a non-Lymphoid cell |
| 0.0 | 0.1 | REACTOME GLYCOPROTEIN HORMONES | Genes involved in Glycoprotein hormones |
| 0.0 | 0.2 | REACTOME GABA A RECEPTOR ACTIVATION | Genes involved in GABA A receptor activation |
| 0.0 | 0.3 | REACTOME SYNTHESIS OF PC | Genes involved in Synthesis of PC |
| 0.0 | 0.0 | REACTOME SIGNALLING TO P38 VIA RIT AND RIN | Genes involved in Signalling to p38 via RIT and RIN |
| 0.0 | 0.2 | REACTOME SIGNALING BY FGFR1 MUTANTS | Genes involved in Signaling by FGFR1 mutants |
| 0.0 | 0.4 | REACTOME SYNTHESIS OF PIPS AT THE PLASMA MEMBRANE | Genes involved in Synthesis of PIPs at the plasma membrane |
| 0.0 | 0.1 | REACTOME CS DS DEGRADATION | Genes involved in CS/DS degradation |
| 0.0 | 0.1 | REACTOME BASE FREE SUGAR PHOSPHATE REMOVAL VIA THE SINGLE NUCLEOTIDE REPLACEMENT PATHWAY | Genes involved in Base-free sugar-phosphate removal via the single-nucleotide replacement pathway |
| 0.0 | 0.3 | REACTOME KINESINS | Genes involved in Kinesins |
| 0.0 | 0.3 | REACTOME CYTOSOLIC TRNA AMINOACYLATION | Genes involved in Cytosolic tRNA aminoacylation |
| 0.0 | 0.2 | REACTOME RNA POL I TRANSCRIPTION INITIATION | Genes involved in RNA Polymerase I Transcription Initiation |
| 0.0 | 0.0 | REACTOME FGFR4 LIGAND BINDING AND ACTIVATION | Genes involved in FGFR4 ligand binding and activation |