Project
GSE49485: Hypoxia transcriptome sequencing of rat brain.
Navigation
Downloads
Results for Sox18_Sox12
Z-value: 0.85
Motif logo
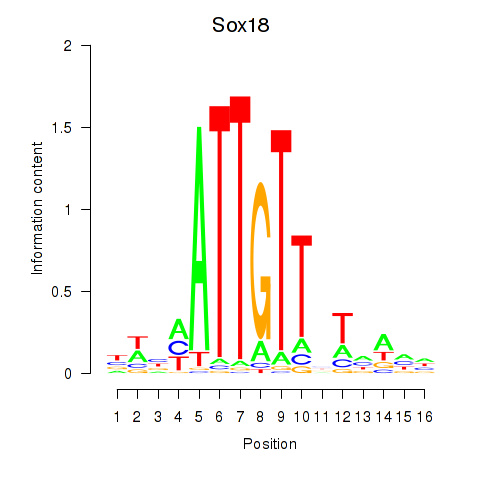
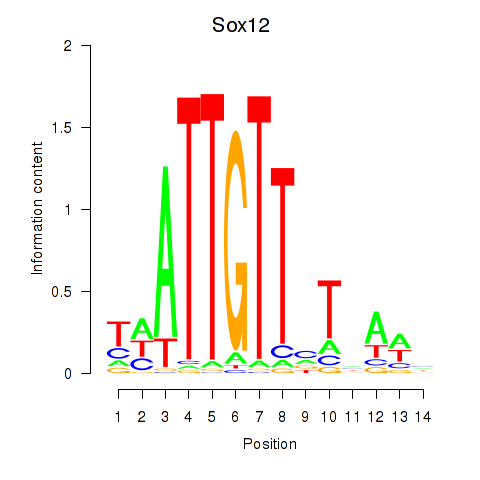
Transcription factors associated with Sox18_Sox12
| Gene Symbol | Gene ID | Gene Info |
|---|---|---|
|
Sox18
|
ENSRNOG00000016248 | SRY box 18 |
|
Sox12
|
ENSRNOG00000007514 | SRY box 12 |
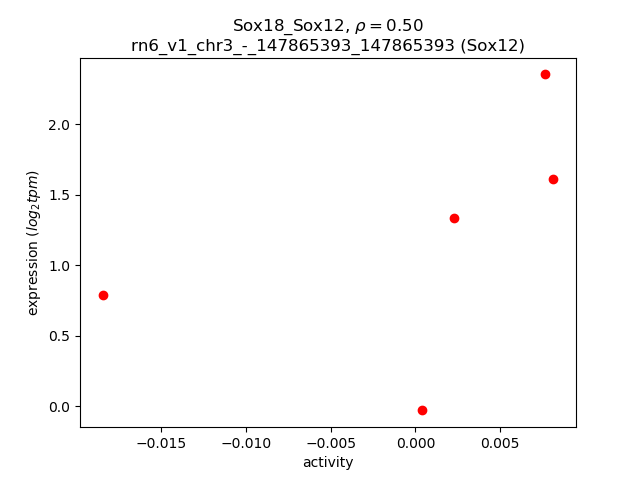
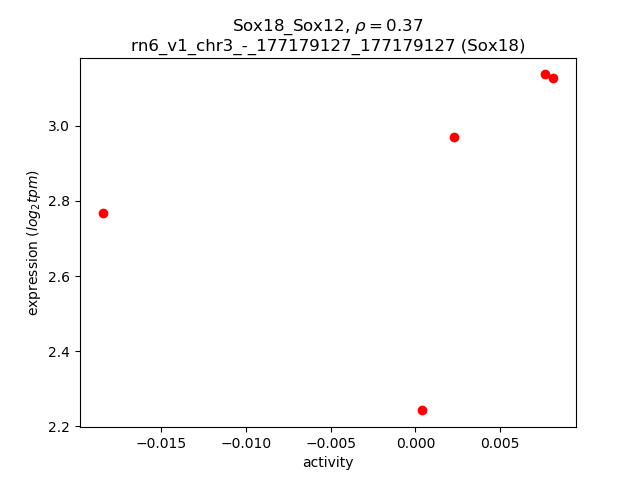
Activity-expression correlation:
| Gene | Promoter | Pearson corr. coef. | P-value | Plot |
|---|---|---|---|---|
| Sox12 | rn6_v1_chr3_-_147865393_147865393 | 0.50 | 3.9e-01 | Click! |
| Sox18 | rn6_v1_chr3_-_177179127_177179127 | 0.37 | 5.4e-01 | Click! |
Activity profile of Sox18_Sox12 motif
Sorted Z-values of Sox18_Sox12 motif
| Promoter | Log-likelihood | Transcript | Gene | Gene Info |
|---|---|---|---|---|
| chr3_+_155160481 | 0.67 |
ENSRNOT00000021133
|
Ppp1r16b
|
protein phosphatase 1, regulatory subunit 16B |
| chr3_+_103773459 | 0.47 |
ENSRNOT00000079727
|
Slc12a6
|
solute carrier family 12, member 6 |
| chr18_+_30562178 | 0.44 |
ENSRNOT00000040998
|
LOC108348771
|
protocadherin beta-16-like |
| chr14_-_81399353 | 0.44 |
ENSRNOT00000018340
|
Add1
|
adducin 1 |
| chr1_-_128287151 | 0.43 |
ENSRNOT00000084946
ENSRNOT00000089723 |
Mef2a
|
myocyte enhancer factor 2a |
| chr10_+_14547172 | 0.41 |
ENSRNOT00000092043
|
Unkl
|
unkempt family like zinc finger |
| chr18_+_30900291 | 0.34 |
ENSRNOT00000060461
|
Pcdhgb7
|
protocadherin gamma subfamily B, 7 |
| chr2_+_22950018 | 0.32 |
ENSRNOT00000071804
|
Homer1
|
homer scaffolding protein 1 |
| chr1_+_98627372 | 0.31 |
ENSRNOT00000030370
|
Dzf17
|
zinc finger protein 17 |
| chr8_+_109455786 | 0.30 |
ENSRNOT00000039593
|
Msl2
|
male-specific lethal 2 homolog (Drosophila) |
| chr4_-_183544850 | 0.29 |
ENSRNOT00000071407
|
Dennd5b
|
DENN/MADD domain containing 5B |
| chr2_-_38110567 | 0.29 |
ENSRNOT00000072212
|
Ipo11
|
importin 11 |
| chr4_-_11610518 | 0.29 |
ENSRNOT00000066643
|
Magi2
|
membrane associated guanylate kinase, WW and PDZ domain containing 2 |
| chr12_-_43576754 | 0.27 |
ENSRNOT00000042331
ENSRNOT00000081780 |
Med13l
|
mediator complex subunit 13-like |
| chr9_-_112027155 | 0.26 |
ENSRNOT00000021258
ENSRNOT00000080962 |
Pja2
|
praja ring finger ubiquitin ligase 2 |
| chr18_+_30435119 | 0.26 |
ENSRNOT00000027190
|
Pcdhb8
|
protocadherin beta 8 |
| chr19_-_21970103 | 0.26 |
ENSRNOT00000074210
|
AABR07043115.1
|
|
| chr4_-_88565292 | 0.26 |
ENSRNOT00000008948
|
Lancl2
|
LanC like 2 |
| chr15_-_93868292 | 0.26 |
ENSRNOT00000093546
ENSRNOT00000014583 |
Mycbp2
|
MYC binding protein 2, E3 ubiquitin protein ligase |
| chr7_-_139675245 | 0.26 |
ENSRNOT00000030943
|
Senp1
|
SUMO1/sentrin specific peptidase 1 |
| chr13_+_91054974 | 0.26 |
ENSRNOT00000091089
|
Crp
|
C-reactive protein |
| chr5_-_133959447 | 0.25 |
ENSRNOT00000011985
|
Cyp4x1
|
cytochrome P450, family 4, subfamily x, polypeptide 1 |
| chr1_-_167911961 | 0.24 |
ENSRNOT00000025097
|
Olr59
|
olfactory receptor 59 |
| chr4_+_96562725 | 0.24 |
ENSRNOT00000009094
|
Ndnf
|
neuron-derived neurotrophic factor |
| chrX_+_137934484 | 0.24 |
ENSRNOT00000049046
|
LOC317588
|
hypothetical protein LOC317588 |
| chr1_-_169513537 | 0.24 |
ENSRNOT00000078058
|
Trim30c
|
tripartite motif-containing 30C |
| chr6_+_110624856 | 0.24 |
ENSRNOT00000014017
|
Vash1
|
vasohibin 1 |
| chr12_-_10335499 | 0.24 |
ENSRNOT00000071567
|
Wasf3
|
WAS protein family, member 3 |
| chr2_+_122368265 | 0.23 |
ENSRNOT00000078321
|
Atp11b
|
ATPase phospholipid transporting 11B (putative) |
| chr13_+_57243877 | 0.23 |
ENSRNOT00000083693
|
Kcnt2
|
potassium sodium-activated channel subfamily T member 2 |
| chr12_-_11808977 | 0.23 |
ENSRNOT00000071795
|
AABR07035375.1
|
|
| chr3_+_48082935 | 0.22 |
ENSRNOT00000087711
ENSRNOT00000067545 |
Slc4a10
|
solute carrier family 4 member 10 |
| chr5_-_168734296 | 0.22 |
ENSRNOT00000066120
|
Camta1
|
calmodulin binding transcription activator 1 |
| chr2_+_56052643 | 0.22 |
ENSRNOT00000029565
|
Rictor
|
RPTOR independent companion of MTOR, complex 2 |
| chr16_+_31734944 | 0.21 |
ENSRNOT00000059673
|
Palld
|
palladin, cytoskeletal associated protein |
| chr3_+_2872031 | 0.21 |
ENSRNOT00000023062
|
Lcn8
|
lipocalin 8 |
| chr3_-_94182714 | 0.21 |
ENSRNOT00000015073
|
LOC100362814
|
hypothetical protein LOC100362814 |
| chr14_+_79205466 | 0.21 |
ENSRNOT00000085534
|
Tbc1d14
|
TBC1 domain family, member 14 |
| chr11_-_11213821 | 0.20 |
ENSRNOT00000093706
|
Robo2
|
roundabout guidance receptor 2 |
| chr18_+_30890869 | 0.20 |
ENSRNOT00000060466
|
Pcdhgb6
|
protocadherin gamma subfamily B, 6 |
| chr15_-_52399074 | 0.20 |
ENSRNOT00000018440
|
Xpo7
|
exportin 7 |
| chr15_-_40542495 | 0.19 |
ENSRNOT00000063943
|
Nup58
|
nucleoporin 58 |
| chr18_-_75207306 | 0.19 |
ENSRNOT00000021717
|
Setbp1
|
SET binding protein 1 |
| chr15_+_46008613 | 0.19 |
ENSRNOT00000066864
ENSRNOT00000080537 |
Wdfy2
|
WD repeat and FYVE domain containing 2 |
| chr9_+_49479023 | 0.19 |
ENSRNOT00000050922
ENSRNOT00000077111 |
Pou3f3
|
POU class 3 homeobox 3 |
| chr4_-_108717309 | 0.19 |
ENSRNOT00000085062
|
AABR07061178.1
|
|
| chr4_+_88695590 | 0.19 |
ENSRNOT00000087835
|
Ppm1k
|
protein phosphatase, Mg2+/Mn2+ dependent, 1K |
| chr3_+_128155069 | 0.18 |
ENSRNOT00000051184
ENSRNOT00000006389 |
Plcb1
|
phospholipase C beta 1 |
| chr6_+_73553210 | 0.18 |
ENSRNOT00000006562
|
Akap6
|
A-kinase anchoring protein 6 |
| chr11_+_61083757 | 0.18 |
ENSRNOT00000002790
|
Boc
|
BOC cell adhesion associated, oncogene regulated |
| chr2_-_183213228 | 0.18 |
ENSRNOT00000067618
|
Trim2
|
tripartite motif-containing 2 |
| chr6_-_54020406 | 0.17 |
ENSRNOT00000086038
|
Hdac9
|
histone deacetylase 9 |
| chr10_-_62184874 | 0.17 |
ENSRNOT00000004229
|
Rpa1
|
replication protein A1 |
| chr4_-_161658519 | 0.17 |
ENSRNOT00000007634
ENSRNOT00000067895 |
Tulp3
|
tubby-like protein 3 |
| chr5_+_152606847 | 0.17 |
ENSRNOT00000089070
|
Pafah2
|
platelet-activating factor acetylhydrolase 2 |
| chr3_-_176197753 | 0.17 |
ENSRNOT00000013189
|
Dido1
|
death inducer-obliterator 1 |
| chrX_+_71174699 | 0.17 |
ENSRNOT00000076957
ENSRNOT00000090192 ENSRNOT00000040334 |
Med12
|
mediator complex subunit 12 |
| chr2_-_113345577 | 0.17 |
ENSRNOT00000034096
|
Fndc3b
|
fibronectin type III domain containing 3B |
| chr17_+_45078556 | 0.16 |
ENSRNOT00000088280
|
Zfp192
|
zinc finger protein 192 |
| chr7_+_141666111 | 0.16 |
ENSRNOT00000083250
|
AABR07058886.1
|
|
| chr18_-_16497886 | 0.16 |
ENSRNOT00000021624
|
Rprd1a
|
regulation of nuclear pre-mRNA domain containing 1A |
| chr18_+_30496318 | 0.16 |
ENSRNOT00000027179
|
Pcdhb11
|
protocadherin beta 11 |
| chr3_-_123376455 | 0.16 |
ENSRNOT00000028842
|
RGD1565616
|
RGD1565616 |
| chr5_-_105579959 | 0.16 |
ENSRNOT00000010827
|
Slc24a2
|
solute carrier family 24 member 2 |
| chr2_-_96509424 | 0.15 |
ENSRNOT00000090866
|
Zc2hc1a
|
zinc finger, C2HC-type containing 1A |
| chr18_+_30875011 | 0.15 |
ENSRNOT00000027009
|
Pcdhga8
|
protocadherin gamma subfamily A, 8 |
| chrX_+_116399611 | 0.15 |
ENSRNOT00000050854
|
Zcchc16
|
zinc finger CCHC-type containing 16 |
| chrX_+_54062935 | 0.15 |
ENSRNOT00000004854
|
Tab3
|
TGF-beta activated kinase 1/MAP3K7 binding protein 3 |
| chr11_+_34865532 | 0.15 |
ENSRNOT00000050342
|
Dyrk1a
|
dual specificity tyrosine phosphorylation regulated kinase 1A |
| chr9_+_81631409 | 0.15 |
ENSRNOT00000089580
|
Pnkd
|
paroxysmal nonkinesigenic dyskinesia |
| chr1_+_177093387 | 0.15 |
ENSRNOT00000021858
|
Mical2
|
microtubule associated monooxygenase, calponin and LIM domain containing 2 |
| chr10_+_82775691 | 0.15 |
ENSRNOT00000030737
|
Hils1
|
histone linker H1 domain, spermatid-specific 1 |
| chr10_+_106712127 | 0.15 |
ENSRNOT00000040629
|
Tnrc6c
|
trinucleotide repeat containing 6C |
| chr7_+_141702038 | 0.14 |
ENSRNOT00000086577
|
Dip2b
|
disco-interacting protein 2 homolog B |
| chr20_+_5262946 | 0.14 |
ENSRNOT00000082900
|
Brd2
|
bromodomain containing 2 |
| chr2_-_86475096 | 0.14 |
ENSRNOT00000075247
ENSRNOT00000075062 |
LOC100909688
|
zinc finger protein 43-like |
| chr7_-_15301382 | 0.14 |
ENSRNOT00000081512
|
Zfp763
|
zinc finger protein 763 |
| chr5_-_86696388 | 0.14 |
ENSRNOT00000007812
|
Megf9
|
multiple EGF-like-domains 9 |
| chr2_+_104020955 | 0.13 |
ENSRNOT00000045586
|
Mtfr1
|
mitochondrial fission regulator 1 |
| chr11_-_47027667 | 0.13 |
ENSRNOT00000044177
|
Senp7
|
SUMO1/sentrin specific peptidase 7 |
| chr5_-_127878792 | 0.13 |
ENSRNOT00000014436
|
Zyg11b
|
zyg-11 family member B, cell cycle regulator |
| chr2_+_149899836 | 0.13 |
ENSRNOT00000086481
|
RGD1560324
|
similar to hypothetical protein C130079G13 |
| chr3_-_119330345 | 0.12 |
ENSRNOT00000077398
ENSRNOT00000079191 |
Trpm7
|
transient receptor potential cation channel, subfamily M, member 7 |
| chr18_+_30487264 | 0.12 |
ENSRNOT00000040125
|
Pcdhb10
|
protocadherin beta 10 |
| chr10_+_11786121 | 0.12 |
ENSRNOT00000033919
|
Slx4
|
SLX4 structure-specific endonuclease subunit |
| chr10_-_15211325 | 0.12 |
ENSRNOT00000027083
|
Rhot2
|
ras homolog family member T2 |
| chr6_-_102472926 | 0.12 |
ENSRNOT00000079351
|
Zfyve26
|
zinc finger FYVE-type containing 26 |
| chr3_-_148312791 | 0.12 |
ENSRNOT00000091419
|
Bcl2l1
|
Bcl2-like 1 |
| chr3_-_93789617 | 0.12 |
ENSRNOT00000078616
|
Caprin1
|
cell cycle associated protein 1 |
| chr18_+_30550877 | 0.11 |
ENSRNOT00000027164
|
LOC108348201
|
protocadherin beta-7-like |
| chr13_+_24823488 | 0.11 |
ENSRNOT00000019907
|
Cdh20
|
cadherin 20 |
| chr5_+_116420690 | 0.11 |
ENSRNOT00000087089
|
Nfia
|
nuclear factor I/A |
| chr3_+_171832500 | 0.11 |
ENSRNOT00000007554
|
Vapb
|
VAMP associated protein B and C |
| chr6_-_126710854 | 0.11 |
ENSRNOT00000081127
ENSRNOT00000064914 |
Btbd7
|
BTB domain containing 7 |
| chr2_-_117454769 | 0.11 |
ENSRNOT00000068381
|
Mecom
|
MDS1 and EVI1 complex locus |
| chr3_+_48106099 | 0.11 |
ENSRNOT00000007218
|
Slc4a10
|
solute carrier family 4 member 10 |
| chr10_-_104482838 | 0.11 |
ENSRNOT00000007246
|
Recql5
|
RecQ like helicase 5 |
| chrX_+_10042893 | 0.11 |
ENSRNOT00000084218
|
LOC100910506
|
peripheral plasma membrane protein CASK-like |
| chr14_+_23507628 | 0.11 |
ENSRNOT00000037509
|
Uba6
|
ubiquitin-like modifier activating enzyme 6 |
| chr3_+_80556668 | 0.11 |
ENSRNOT00000079118
|
Arhgap1
|
Rho GTPase activating protein 1 |
| chr10_+_65552897 | 0.11 |
ENSRNOT00000056217
|
Spag5
|
sperm associated antigen 5 |
| chr2_+_248178389 | 0.11 |
ENSRNOT00000037339
|
Gbp5
|
guanylate binding protein 5 |
| chr2_+_211460373 | 0.11 |
ENSRNOT00000027617
|
Clcc1
|
chloride channel CLIC-like 1 |
| chr2_-_40386669 | 0.11 |
ENSRNOT00000014074
|
Elovl7
|
ELOVL fatty acid elongase 7 |
| chr16_-_19791832 | 0.11 |
ENSRNOT00000040393
|
Ushbp1
|
USH1 protein network component harmonin binding protein 1 |
| chr10_+_62566732 | 0.11 |
ENSRNOT00000021368
|
Taok1
|
TAO kinase 1 |
| chr4_+_21462779 | 0.10 |
ENSRNOT00000089747
|
Grm3
|
glutamate metabotropic receptor 3 |
| chr3_-_148312420 | 0.10 |
ENSRNOT00000047416
ENSRNOT00000081272 |
Bcl2l1
|
Bcl2-like 1 |
| chr13_+_87986240 | 0.10 |
ENSRNOT00000003705
|
Rgs5
|
regulator of G-protein signaling 5 |
| chr1_+_13595295 | 0.10 |
ENSRNOT00000079250
|
Nhsl1
|
NHS-like 1 |
| chr18_-_32670665 | 0.10 |
ENSRNOT00000019409
|
Nr3c1
|
nuclear receptor subfamily 3, group C, member 1 |
| chr16_-_83438561 | 0.10 |
ENSRNOT00000057461
|
Col4a2
|
collagen type IV alpha 2 chain |
| chr4_+_78310379 | 0.10 |
ENSRNOT00000032802
|
Gimap9
|
GTPase, IMAP family member 9 |
| chr14_-_28967980 | 0.10 |
ENSRNOT00000048175
|
Adgrl3
|
adhesion G protein-coupled receptor L3 |
| chr13_-_83202864 | 0.10 |
ENSRNOT00000003976
|
Xcl1
|
X-C motif chemokine ligand 1 |
| chr3_+_81134505 | 0.10 |
ENSRNOT00000067664
|
Phf21a
|
PHD finger protein 21A |
| chr17_-_89163113 | 0.10 |
ENSRNOT00000050445
|
LOC100360843
|
ribosomal protein S19-like |
| chr8_-_93390305 | 0.10 |
ENSRNOT00000056930
|
Ibtk
|
inhibitor of Bruton tyrosine kinase |
| chr7_+_141642777 | 0.09 |
ENSRNOT00000079811
|
AABR07058884.2
|
|
| chrX_+_43881246 | 0.09 |
ENSRNOT00000005153
|
LOC317456
|
hypothetical LOC317456 |
| chr3_+_122308025 | 0.09 |
ENSRNOT00000008071
|
Stk35
|
serine/threonine kinase 35 |
| chr9_+_2190915 | 0.09 |
ENSRNOT00000077417
|
Satb1
|
SATB homeobox 1 |
| chr8_+_82037977 | 0.09 |
ENSRNOT00000082288
|
Myo5a
|
myosin VA |
| chr18_+_29951094 | 0.09 |
ENSRNOT00000027402
|
LOC102553180
|
protocadherin alpha-1-like |
| chr1_+_199323628 | 0.09 |
ENSRNOT00000036187
|
Zfp646
|
zinc finger protein 646 |
| chr7_-_114573900 | 0.09 |
ENSRNOT00000011219
|
Ptk2
|
protein tyrosine kinase 2 |
| chr11_+_42259761 | 0.09 |
ENSRNOT00000047310
|
Epha6
|
Eph receptor A6 |
| chr16_+_23553647 | 0.09 |
ENSRNOT00000041994
|
Psd3
|
pleckstrin and Sec7 domain containing 3 |
| chr2_+_66940057 | 0.09 |
ENSRNOT00000043050
|
Cdh9
|
cadherin 9 |
| chrX_+_84064427 | 0.09 |
ENSRNOT00000046364
|
Zfp711
|
zinc finger protein 711 |
| chr1_+_61733805 | 0.09 |
ENSRNOT00000086029
|
LOC682206
|
similar to Zinc finger protein 208 |
| chr13_+_100817359 | 0.09 |
ENSRNOT00000004330
|
Tp53bp2
|
tumor protein p53 binding protein, 2 |
| chrX_+_22313028 | 0.09 |
ENSRNOT00000082725
|
Kdm5c
|
lysine demethylase 5C |
| chr1_-_61872975 | 0.09 |
ENSRNOT00000078809
|
AABR07001910.1
|
|
| chr3_-_25212049 | 0.09 |
ENSRNOT00000040023
|
Lrp1b
|
LDL receptor related protein 1B |
| chrX_+_9956370 | 0.09 |
ENSRNOT00000082316
|
LOC100910506
|
peripheral plasma membrane protein CASK-like |
| chr8_-_84522588 | 0.09 |
ENSRNOT00000076213
|
Mlip
|
muscular LMNA-interacting protein |
| chr11_-_67702955 | 0.09 |
ENSRNOT00000084540
ENSRNOT00000078285 |
Kpna1
|
karyopherin subunit alpha 1 |
| chr3_+_60024013 | 0.09 |
ENSRNOT00000025255
|
Scrn3
|
secernin 3 |
| chr7_-_69104950 | 0.09 |
ENSRNOT00000049063
|
LOC500846
|
hypothetical protein LOC500846 |
| chr7_+_58419197 | 0.09 |
ENSRNOT00000085829
|
Zfc3h1
|
zinc finger, C3H1-type containing |
| chr8_+_131965134 | 0.09 |
ENSRNOT00000078308
|
Znf660
|
zinc finger protein 660 |
| chr8_-_62987182 | 0.09 |
ENSRNOT00000070885
|
Islr2
|
immunoglobulin superfamily containing leucine-rich repeat 2 |
| chr5_-_136965191 | 0.09 |
ENSRNOT00000056842
|
St3gal3
|
ST3 beta-galactoside alpha-2,3-sialyltransferase 3 |
| chr17_+_5225835 | 0.08 |
ENSRNOT00000022373
|
Zcchc6
|
zinc finger CCHC-type containing 6 |
| chrX_-_76708878 | 0.08 |
ENSRNOT00000045534
|
Atrx
|
ATRX, chromatin remodeler |
| chrX_-_115175299 | 0.08 |
ENSRNOT00000074322
|
Dcx
|
doublecortin |
| chr18_+_30381322 | 0.08 |
ENSRNOT00000027216
|
Pcdhb3
|
protocadherin beta 3 |
| chr13_+_6679368 | 0.08 |
ENSRNOT00000067198
ENSRNOT00000092965 |
Cntnap5c
|
contactin associated protein-like 5C |
| chr14_+_113867209 | 0.08 |
ENSRNOT00000067591
|
Ccdc88a
|
coiled coil domain containing 88A |
| chr4_-_6978073 | 0.08 |
ENSRNOT00000045311
|
Nub1
|
negative regulator of ubiquitin-like proteins 1 |
| chr9_+_111233147 | 0.08 |
ENSRNOT00000056439
|
Ppip5k2
|
diphosphoinositol pentakisphosphate kinase 2 |
| chr17_+_9746485 | 0.08 |
ENSRNOT00000072298
|
Pfn3
|
profilin 3 |
| chr6_+_22696397 | 0.08 |
ENSRNOT00000011630
|
Alk
|
anaplastic lymphoma receptor tyrosine kinase |
| chr17_-_60946426 | 0.08 |
ENSRNOT00000058852
|
Wac
|
WW domain containing adaptor with coiled-coil |
| chr7_-_59957228 | 0.08 |
ENSRNOT00000081599
ENSRNOT00000007258 |
Rab3ip
|
RAB3A interacting protein |
| chr11_-_31772984 | 0.08 |
ENSRNOT00000002771
|
Dnajc28
|
DnaJ heat shock protein family (Hsp40) member C28 |
| chrX_-_138148967 | 0.07 |
ENSRNOT00000033968
|
Frmd7
|
FERM domain containing 7 |
| chr2_+_195996521 | 0.07 |
ENSRNOT00000082849
|
Pogz
|
pogo transposable element with ZNF domain |
| chr4_+_183896303 | 0.07 |
ENSRNOT00000055437
|
RGD1309621
|
similar to hypothetical protein FLJ10652 |
| chr13_-_111581018 | 0.07 |
ENSRNOT00000083072
ENSRNOT00000077981 |
Sertad4
|
SERTA domain containing 4 |
| chr13_+_98615287 | 0.07 |
ENSRNOT00000004032
|
Itpkb
|
inositol-trisphosphate 3-kinase B |
| chr14_-_114484127 | 0.07 |
ENSRNOT00000056706
|
Eml6
|
echinoderm microtubule associated protein like 6 |
| chr11_-_1983513 | 0.07 |
ENSRNOT00000000907
|
Htr1f
|
5-hydroxytryptamine receptor 1F |
| chr7_-_15072703 | 0.07 |
ENSRNOT00000087294
|
Zfp799
|
zinc finger protein 799 |
| chr11_+_66316606 | 0.07 |
ENSRNOT00000041715
|
Stxbp5l
|
syntaxin binding protein 5-like |
| chr3_+_112390106 | 0.07 |
ENSRNOT00000081197
|
LOC691918
|
similar to Centrosomal protein of 27 kDa (Cep27 protein) |
| chr17_+_35435079 | 0.07 |
ENSRNOT00000074800
|
Exoc2
|
exocyst complex component 2 |
| chr8_+_32452885 | 0.07 |
ENSRNOT00000010423
|
Prdm10
|
PR/SET domain 10 |
| chr9_+_118842787 | 0.07 |
ENSRNOT00000090512
|
Dlgap1
|
DLG associated protein 1 |
| chr2_+_93520734 | 0.07 |
ENSRNOT00000083909
|
Snx16
|
sorting nexin 16 |
| chr1_-_82266727 | 0.07 |
ENSRNOT00000027910
|
Lipe
|
lipase E, hormone sensitive type |
| chr14_+_37435654 | 0.07 |
ENSRNOT00000002991
|
Ociad2
|
OCIA domain containing 2 |
| chr17_+_60059949 | 0.07 |
ENSRNOT00000025458
|
Mpp7
|
membrane palmitoylated protein 7 |
| chr2_-_18531210 | 0.07 |
ENSRNOT00000088313
|
Vcan
|
versican |
| chr12_+_46869836 | 0.07 |
ENSRNOT00000084421
|
Sirt4
|
sirtuin 4 |
| chr13_-_80775230 | 0.06 |
ENSRNOT00000091389
ENSRNOT00000004762 |
Fmo2
|
flavin containing monooxygenase 2 |
| chr9_+_60039297 | 0.06 |
ENSRNOT00000016262
|
Slc39a10
|
solute carrier family 39 member 10 |
| chr1_+_201438447 | 0.06 |
ENSRNOT00000078244
|
Plekha1
|
pleckstrin homology domain containing A1 |
| chr12_+_37603986 | 0.06 |
ENSRNOT00000088006
|
Sbno1
|
strawberry notch homolog 1 |
| chr2_+_2903492 | 0.06 |
ENSRNOT00000062017
|
Ttc37
|
tetratricopeptide repeat domain 37 |
| chr1_-_275882444 | 0.06 |
ENSRNOT00000083215
|
Gpam
|
glycerol-3-phosphate acyltransferase, mitochondrial |
| chr17_-_54714914 | 0.06 |
ENSRNOT00000024336
|
Zeb1
|
zinc finger E-box binding homeobox 1 |
| chr16_-_71237118 | 0.06 |
ENSRNOT00000066974
|
Nsd3
|
nuclear receptor binding SET domain protein 3 |
| chr1_+_240355149 | 0.06 |
ENSRNOT00000018521
|
Trpm3
|
transient receptor potential cation channel, subfamily M, member 3 |
| chr16_+_50152008 | 0.06 |
ENSRNOT00000019237
|
Klkb1
|
kallikrein B1 |
| chr1_+_190852985 | 0.06 |
ENSRNOT00000040963
|
Polr3e
|
RNA polymerase III subunit E |
| chr15_-_88670349 | 0.06 |
ENSRNOT00000012881
|
Rnf219
|
ring finger protein 219 |
| chr20_+_47494424 | 0.06 |
ENSRNOT00000087718
|
Sec63
|
SEC63 homolog, protein translocation regulator |
| chr14_-_104960141 | 0.06 |
ENSRNOT00000056944
|
Aftph
|
aftiphilin |
| chr6_+_29106141 | 0.06 |
ENSRNOT00000084560
|
Atad2b
|
ATPase family, AAA domain containing 2B |
| chr2_+_23289374 | 0.06 |
ENSRNOT00000090666
ENSRNOT00000032783 |
Dmgdh
|
dimethylglycine dehydrogenase |
| chr1_-_280015358 | 0.06 |
ENSRNOT00000024548
|
Hspa12a
|
heat shock protein family A (Hsp70) member 12A |
| chr16_-_32421005 | 0.06 |
ENSRNOT00000082712
|
Nek1
|
NIMA-related kinase 1 |
| chr7_-_98735192 | 0.06 |
ENSRNOT00000051430
|
AABR07058017.1
|
|
| chr4_-_108008484 | 0.06 |
ENSRNOT00000007971
|
Ctnna2
|
catenin alpha 2 |
| chr1_+_236580034 | 0.06 |
ENSRNOT00000074939
|
Gcnt1
|
glucosaminyl (N-acetyl) transferase 1, core 2 |
| chr18_+_17091310 | 0.06 |
ENSRNOT00000093285
|
Fhod3
|
formin homology 2 domain containing 3 |
| chr18_-_70924708 | 0.06 |
ENSRNOT00000025257
|
Lipg
|
lipase G, endothelial type |
| chr3_-_22500765 | 0.05 |
ENSRNOT00000025443
|
Dennd1a
|
DENN domain containing 1A |
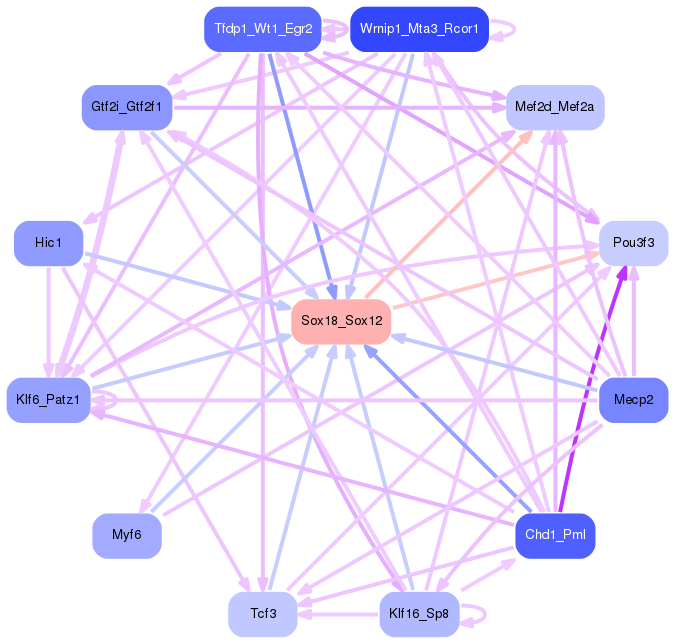
Network of associatons between targets according to the STRING database.

First level regulatory network of Sox18_Sox12
Gene Ontology Analysis
Gene overrepresentation in biological process category:
| Log-likelihood per target | Total log-likelihood | Term | Description |
|---|---|---|---|
| 0.2 | 0.7 | GO:1902309 | negative regulation of peptidyl-serine dephosphorylation(GO:1902309) |
| 0.2 | 0.5 | GO:0042539 | hypotonic salinity response(GO:0042539) cellular hypotonic salinity response(GO:0071477) |
| 0.1 | 0.4 | GO:0055005 | ventricular cardiac myofibril assembly(GO:0055005) |
| 0.1 | 0.3 | GO:1901421 | positive regulation of response to alcohol(GO:1901421) |
| 0.1 | 0.2 | GO:1900135 | positive regulation of renin secretion into blood stream(GO:1900135) |
| 0.1 | 0.2 | GO:0032197 | transposition, RNA-mediated(GO:0032197) |
| 0.1 | 0.2 | GO:1905218 | cellular response to astaxanthin(GO:1905218) |
| 0.1 | 0.4 | GO:1901552 | positive regulation of endothelial cell development(GO:1901552) positive regulation of establishment of endothelial barrier(GO:1903142) |
| 0.1 | 0.2 | GO:0071349 | monocyte extravasation(GO:0035696) interleukin-12-mediated signaling pathway(GO:0035722) interleukin-15-mediated signaling pathway(GO:0035723) cellular response to interleukin-12(GO:0071349) cellular response to interleukin-15(GO:0071350) |
| 0.1 | 0.2 | GO:1901491 | negative regulation of lymphangiogenesis(GO:1901491) |
| 0.1 | 0.3 | GO:0032929 | negative regulation of superoxide anion generation(GO:0032929) |
| 0.0 | 0.1 | GO:0019417 | sulfur oxidation(GO:0019417) |
| 0.0 | 0.3 | GO:0048702 | embryonic neurocranium morphogenesis(GO:0048702) |
| 0.0 | 0.2 | GO:0072218 | ascending thin limb development(GO:0072021) metanephric ascending thin limb development(GO:0072218) |
| 0.0 | 0.1 | GO:0007172 | signal complex assembly(GO:0007172) |
| 0.0 | 0.2 | GO:1902261 | positive regulation of delayed rectifier potassium channel activity(GO:1902261) |
| 0.0 | 0.3 | GO:0006610 | ribosomal protein import into nucleus(GO:0006610) |
| 0.0 | 0.3 | GO:2000809 | positive regulation of synaptic vesicle clustering(GO:2000809) |
| 0.0 | 0.2 | GO:1904431 | positive regulation of t-circle formation(GO:1904431) |
| 0.0 | 0.2 | GO:0071955 | recycling endosome to Golgi transport(GO:0071955) |
| 0.0 | 0.2 | GO:0050925 | negative regulation of negative chemotaxis(GO:0050925) |
| 0.0 | 0.3 | GO:0010724 | regulation of definitive erythrocyte differentiation(GO:0010724) |
| 0.0 | 0.2 | GO:0030950 | establishment or maintenance of actin cytoskeleton polarity(GO:0030950) |
| 0.0 | 0.1 | GO:0046340 | diacylglycerol catabolic process(GO:0046340) |
| 0.0 | 0.2 | GO:0070940 | dephosphorylation of RNA polymerase II C-terminal domain(GO:0070940) |
| 0.0 | 0.1 | GO:0071613 | immunoglobulin production in mucosal tissue(GO:0002426) T-helper 1 cell activation(GO:0035711) granzyme B production(GO:0071613) regulation of granzyme B production(GO:0071661) positive regulation of granzyme B production(GO:0071663) regulation of thymocyte migration(GO:2000410) regulation of B cell chemotaxis(GO:2000537) positive regulation of B cell chemotaxis(GO:2000538) |
| 0.0 | 0.2 | GO:0046725 | negative regulation by virus of viral protein levels in host cell(GO:0046725) |
| 0.0 | 0.2 | GO:0019800 | peptide cross-linking via chondroitin 4-sulfate glycosaminoglycan(GO:0019800) |
| 0.0 | 0.1 | GO:0019243 | methylglyoxal catabolic process to D-lactate via S-lactoyl-glutathione(GO:0019243) methylglyoxal catabolic process(GO:0051596) methylglyoxal catabolic process to lactate(GO:0061727) |
| 0.0 | 0.1 | GO:0035120 | post-embryonic appendage morphogenesis(GO:0035120) post-embryonic limb morphogenesis(GO:0035127) post-embryonic forelimb morphogenesis(GO:0035128) telomeric repeat-containing RNA transcription(GO:0097393) telomeric repeat-containing RNA transcription from RNA pol II promoter(GO:0097394) regulation of telomeric RNA transcription from RNA pol II promoter(GO:1901580) negative regulation of telomeric RNA transcription from RNA pol II promoter(GO:1901581) positive regulation of telomeric RNA transcription from RNA pol II promoter(GO:1901582) |
| 0.0 | 0.1 | GO:1903566 | positive regulation of protein localization to cilium(GO:1903566) |
| 0.0 | 0.1 | GO:1990414 | replication-born double-strand break repair via sister chromatid exchange(GO:1990414) |
| 0.0 | 0.1 | GO:0090648 | response to environmental enrichment(GO:0090648) |
| 0.0 | 0.4 | GO:0007216 | G-protein coupled glutamate receptor signaling pathway(GO:0007216) |
| 0.0 | 0.1 | GO:1900170 | negative regulation of glucocorticoid mediated signaling pathway(GO:1900170) |
| 0.0 | 0.3 | GO:0021785 | branchiomotor neuron axon guidance(GO:0021785) |
| 0.0 | 0.1 | GO:0051643 | endoplasmic reticulum localization(GO:0051643) |
| 0.0 | 0.0 | GO:0099553 | trans-synaptic signaling by lipid(GO:0099541) trans-synaptic signaling by endocannabinoid(GO:0099542) trans-synaptic signaling by lipid, modulating synaptic transmission(GO:0099552) trans-synaptic signaling by endocannabinoid, modulating synaptic transmission(GO:0099553) |
| 0.0 | 0.4 | GO:0021860 | pyramidal neuron development(GO:0021860) |
| 0.0 | 0.1 | GO:1903336 | negative regulation of vacuolar transport(GO:1903336) |
| 0.0 | 0.1 | GO:0034626 | fatty acid elongation, polyunsaturated fatty acid(GO:0034626) |
| 0.0 | 0.0 | GO:0060666 | dichotomous subdivision of terminal units involved in salivary gland branching(GO:0060666) |
| 0.0 | 0.1 | GO:0010961 | cellular magnesium ion homeostasis(GO:0010961) |
| 0.0 | 0.1 | GO:0031204 | posttranslational protein targeting to membrane, translocation(GO:0031204) |
| 0.0 | 0.1 | GO:0006579 | amino-acid betaine catabolic process(GO:0006579) |
| 0.0 | 0.2 | GO:0034983 | peptidyl-lysine deacetylation(GO:0034983) |
| 0.0 | 0.1 | GO:0010986 | regulation of high-density lipoprotein particle clearance(GO:0010982) positive regulation of lipoprotein particle clearance(GO:0010986) |
| 0.0 | 0.1 | GO:0071896 | protein localization to adherens junction(GO:0071896) |
| 0.0 | 0.2 | GO:0060510 | Type II pneumocyte differentiation(GO:0060510) |
| 0.0 | 0.1 | GO:0035426 | extracellular matrix-cell signaling(GO:0035426) |
| 0.0 | 0.1 | GO:0072592 | oxygen metabolic process(GO:0072592) |
| 0.0 | 0.1 | GO:0051490 | negative regulation of filopodium assembly(GO:0051490) |
| 0.0 | 0.0 | GO:0097156 | fasciculation of motor neuron axon(GO:0097156) |
| 0.0 | 0.0 | GO:0043490 | malate-aspartate shuttle(GO:0043490) |
| 0.0 | 0.1 | GO:0033030 | negative regulation of neutrophil apoptotic process(GO:0033030) |
| 0.0 | 0.0 | GO:1903564 | regulation of protein localization to cilium(GO:1903564) |
| 0.0 | 0.2 | GO:0031643 | positive regulation of myelination(GO:0031643) |
| 0.0 | 0.1 | GO:0060693 | regulation of branching involved in salivary gland morphogenesis(GO:0060693) |
| 0.0 | 0.1 | GO:0090336 | positive regulation of brown fat cell differentiation(GO:0090336) |
| 0.0 | 0.1 | GO:0042940 | D-amino acid transport(GO:0042940) |
| 0.0 | 0.1 | GO:0060213 | regulation of nuclear-transcribed mRNA poly(A) tail shortening(GO:0060211) positive regulation of nuclear-transcribed mRNA poly(A) tail shortening(GO:0060213) |
| 0.0 | 0.1 | GO:0032621 | interleukin-18 production(GO:0032621) |
| 0.0 | 0.2 | GO:0060707 | trophoblast giant cell differentiation(GO:0060707) |
| 0.0 | 1.6 | GO:0007156 | homophilic cell adhesion via plasma membrane adhesion molecules(GO:0007156) |
| 0.0 | 0.2 | GO:0043518 | negative regulation of DNA damage response, signal transduction by p53 class mediator(GO:0043518) |
| 0.0 | 0.0 | GO:0071947 | protein deubiquitination involved in ubiquitin-dependent protein catabolic process(GO:0071947) protein K33-linked deubiquitination(GO:1990168) |
| 0.0 | 0.1 | GO:0070842 | aggresome assembly(GO:0070842) |
Gene overrepresentation in cellular component category:
| Log-likelihood per target | Total log-likelihood | Term | Description |
|---|---|---|---|
| 0.1 | 0.3 | GO:0072487 | MSL complex(GO:0072487) |
| 0.1 | 0.2 | GO:0014701 | junctional sarcoplasmic reticulum membrane(GO:0014701) |
| 0.1 | 0.3 | GO:0097441 | basilar dendrite(GO:0097441) |
| 0.1 | 0.2 | GO:0033557 | Slx1-Slx4 complex(GO:0033557) |
| 0.0 | 0.4 | GO:0008290 | F-actin capping protein complex(GO:0008290) |
| 0.0 | 0.2 | GO:0097136 | Bcl-2 family protein complex(GO:0097136) |
| 0.0 | 0.1 | GO:0042642 | actomyosin, myosin complex part(GO:0042642) |
| 0.0 | 0.3 | GO:0036056 | filtration diaphragm(GO:0036056) slit diaphragm(GO:0036057) |
| 0.0 | 0.1 | GO:1990421 | subtelomeric heterochromatin(GO:1990421) nuclear subtelomeric heterochromatin(GO:1990707) |
| 0.0 | 0.2 | GO:0030991 | intraciliary transport particle A(GO:0030991) |
| 0.0 | 0.1 | GO:0055087 | Ski complex(GO:0055087) |
| 0.0 | 0.1 | GO:0097025 | MPP7-DLG1-LIN7 complex(GO:0097025) |
| 0.0 | 0.2 | GO:0031932 | TORC2 complex(GO:0031932) |
| 0.0 | 0.1 | GO:0030121 | AP-1 adaptor complex(GO:0030121) |
| 0.0 | 0.3 | GO:0001673 | male germ cell nucleus(GO:0001673) |
| 0.0 | 0.1 | GO:0097443 | sorting endosome(GO:0097443) |
| 0.0 | 0.1 | GO:0005593 | FACIT collagen trimer(GO:0005593) |
| 0.0 | 0.1 | GO:0098645 | collagen type IV trimer(GO:0005587) network-forming collagen trimer(GO:0098642) collagen network(GO:0098645) |
Gene overrepresentation in molecular function category:
| Log-likelihood per target | Total log-likelihood | Term | Description |
|---|---|---|---|
| 0.1 | 0.5 | GO:0035827 | rubidium ion transmembrane transporter activity(GO:0035827) |
| 0.1 | 0.3 | GO:0070699 | type II activin receptor binding(GO:0070699) |
| 0.1 | 0.3 | GO:0031802 | type 5 metabotropic glutamate receptor binding(GO:0031802) |
| 0.1 | 0.3 | GO:0070139 | ubiquitin-like protein-specific endopeptidase activity(GO:0070137) SUMO-specific endopeptidase activity(GO:0070139) |
| 0.1 | 0.3 | GO:0001849 | complement component C1q binding(GO:0001849) |
| 0.0 | 0.4 | GO:0042608 | T cell receptor binding(GO:0042608) |
| 0.0 | 0.2 | GO:0051434 | BH3 domain binding(GO:0051434) |
| 0.0 | 0.1 | GO:0004839 | ubiquitin activating enzyme activity(GO:0004839) |
| 0.0 | 0.1 | GO:0001641 | group II metabotropic glutamate receptor activity(GO:0001641) |
| 0.0 | 0.1 | GO:0004416 | hydroxyacylglutathione hydrolase activity(GO:0004416) |
| 0.0 | 0.2 | GO:0003847 | 1-alkyl-2-acetylglycerophosphocholine esterase activity(GO:0003847) |
| 0.0 | 0.1 | GO:0050265 | RNA uridylyltransferase activity(GO:0050265) |
| 0.0 | 0.1 | GO:0033149 | FFAT motif binding(GO:0033149) |
| 0.0 | 0.2 | GO:0005049 | nuclear export signal receptor activity(GO:0005049) |
| 0.0 | 0.2 | GO:0017108 | 5'-flap endonuclease activity(GO:0017108) |
| 0.0 | 0.2 | GO:0008273 | calcium, potassium:sodium antiporter activity(GO:0008273) |
| 0.0 | 0.1 | GO:0047708 | biotinidase activity(GO:0047708) |
| 0.0 | 0.1 | GO:0003836 | beta-galactoside (CMP) alpha-2,3-sialyltransferase activity(GO:0003836) |
| 0.0 | 0.2 | GO:0043495 | protein anchor(GO:0043495) |
| 0.0 | 0.3 | GO:0010314 | phosphatidylinositol-5-phosphate binding(GO:0010314) |
| 0.0 | 0.1 | GO:0000829 | inositol heptakisphosphate kinase activity(GO:0000829) |
| 0.0 | 0.1 | GO:0009378 | four-way junction helicase activity(GO:0009378) |
| 0.0 | 0.2 | GO:0008046 | axon guidance receptor activity(GO:0008046) |
| 0.0 | 0.1 | GO:0042134 | rRNA primary transcript binding(GO:0042134) |
| 0.0 | 0.1 | GO:0015616 | DNA translocase activity(GO:0015616) |
| 0.0 | 0.0 | GO:0001011 | transcription factor activity, sequence-specific DNA binding, RNA polymerase recruiting(GO:0001011) transcription factor activity, TFIIB-class binding(GO:0001087) |
| 0.0 | 0.1 | GO:0030292 | protein tyrosine kinase inhibitor activity(GO:0030292) |
| 0.0 | 0.2 | GO:0005487 | nucleocytoplasmic transporter activity(GO:0005487) |
| 0.0 | 0.3 | GO:0005452 | inorganic anion exchanger activity(GO:0005452) |
| 0.0 | 0.6 | GO:0001105 | RNA polymerase II transcription coactivator activity(GO:0001105) |
| 0.0 | 0.1 | GO:0051377 | mannose-ethanolamine phosphotransferase activity(GO:0051377) |
| 0.0 | 0.0 | GO:0004949 | cannabinoid receptor activity(GO:0004949) |
| 0.0 | 0.3 | GO:0034237 | protein kinase A catalytic subunit binding(GO:0034236) protein kinase A regulatory subunit binding(GO:0034237) |
| 0.0 | 0.0 | GO:0003844 | 1,4-alpha-glucan branching enzyme activity(GO:0003844) |
| 0.0 | 0.0 | GO:0003831 | beta-N-acetylglucosaminylglycopeptide beta-1,4-galactosyltransferase activity(GO:0003831) |
| 0.0 | 0.2 | GO:0004012 | phospholipid-translocating ATPase activity(GO:0004012) |
| 0.0 | 0.1 | GO:0005003 | ephrin receptor activity(GO:0005003) |
| 0.0 | 0.1 | GO:0009922 | fatty acid elongase activity(GO:0009922) 3-oxo-arachidoyl-CoA synthase activity(GO:0102336) 3-oxo-cerotoyl-CoA synthase activity(GO:0102337) 3-oxo-lignoceronyl-CoA synthase activity(GO:0102338) |
| 0.0 | 0.1 | GO:0004366 | glycerol-3-phosphate O-acyltransferase activity(GO:0004366) |
Gene overrepresentation in curated gene sets: canonical pathways category:
| Log-likelihood per target | Total log-likelihood | Term | Description |
|---|---|---|---|
| 0.0 | 0.2 | SA PROGRAMMED CELL DEATH | Programmed cell death, or apoptosis, eliminates damaged or unneeded cells. |
| 0.0 | 0.1 | ST PAC1 RECEPTOR PATHWAY | PAC1 Receptor Pathway |
Gene overrepresentation in curated gene sets: REACTOME pathways category:
| Log-likelihood per target | Total log-likelihood | Term | Description |
|---|---|---|---|
| 0.0 | 0.3 | REACTOME CREATION OF C4 AND C2 ACTIVATORS | Genes involved in Creation of C4 and C2 activators |
| 0.0 | 0.2 | REACTOME REGULATION OF INSULIN SECRETION BY ACETYLCHOLINE | Genes involved in Regulation of Insulin Secretion by Acetylcholine |
| 0.0 | 0.6 | REACTOME MYOGENESIS | Genes involved in Myogenesis |
| 0.0 | 0.2 | REACTOME REMOVAL OF THE FLAP INTERMEDIATE FROM THE C STRAND | Genes involved in Removal of the Flap Intermediate from the C-strand |
| 0.0 | 0.4 | REACTOME CASPASE MEDIATED CLEAVAGE OF CYTOSKELETAL PROTEINS | Genes involved in Caspase-mediated cleavage of cytoskeletal proteins |
| 0.0 | 0.2 | REACTOME IRAK2 MEDIATED ACTIVATION OF TAK1 COMPLEX UPON TLR7 8 OR 9 STIMULATION | Genes involved in IRAK2 mediated activation of TAK1 complex upon TLR7/8 or 9 stimulation |
| 0.0 | 0.3 | REACTOME NEPHRIN INTERACTIONS | Genes involved in Nephrin interactions |
| 0.0 | 0.2 | REACTOME INFLAMMASOMES | Genes involved in Inflammasomes |
| 0.0 | 0.2 | REACTOME CD28 DEPENDENT PI3K AKT SIGNALING | Genes involved in CD28 dependent PI3K/Akt signaling |