Project
GSE49485: Hypoxia transcriptome sequencing of rat brain.
Navigation
Downloads
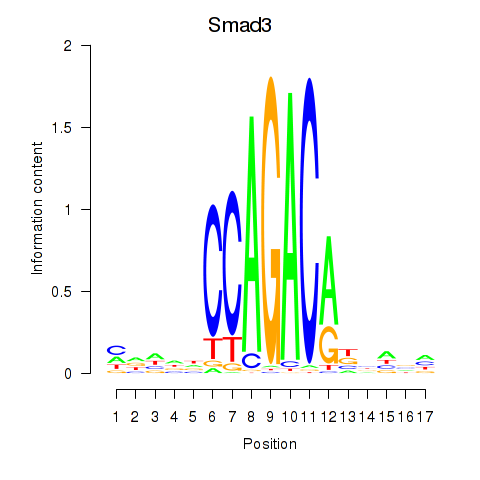
Results for Smad3
Z-value: 0.62
Motif logo
Transcription factors associated with Smad3
| Gene Symbol | Gene ID | Gene Info |
|---|---|---|
|
Smad3
|
ENSRNOG00000008620 | SMAD family member 3 |
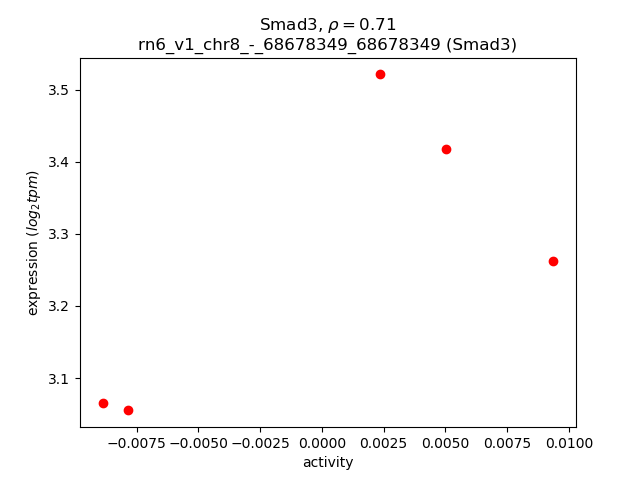
Activity-expression correlation:
| Gene | Promoter | Pearson corr. coef. | P-value | Plot |
|---|---|---|---|---|
| Smad3 | rn6_v1_chr8_-_68678349_68678349 | 0.71 | 1.8e-01 | Click! |
Activity profile of Smad3 motif
Sorted Z-values of Smad3 motif
| Promoter | Log-likelihood | Transcript | Gene | Gene Info |
|---|---|---|---|---|
| chr7_+_142905758 | 0.41 |
ENSRNOT00000078663
|
Nr4a1
|
nuclear receptor subfamily 4, group A, member 1 |
| chr3_-_94182714 | 0.30 |
ENSRNOT00000015073
|
LOC100362814
|
hypothetical protein LOC100362814 |
| chr13_+_90723092 | 0.27 |
ENSRNOT00000010146
|
Kcnj10
|
ATP-sensitive inward rectifier potassium channel 10 |
| chr10_+_106264434 | 0.24 |
ENSRNOT00000003891
|
Sept9
|
septin 9 |
| chr9_-_65737538 | 0.24 |
ENSRNOT00000014939
|
Trak2
|
trafficking kinesin protein 2 |
| chrX_+_80213332 | 0.24 |
ENSRNOT00000042827
|
Sh3bgrl
|
SH3 domain binding glutamate-rich protein like |
| chr12_-_44381289 | 0.22 |
ENSRNOT00000001493
|
Nos1
|
nitric oxide synthase 1 |
| chr3_-_79282493 | 0.21 |
ENSRNOT00000049832
|
Ptprj
|
protein tyrosine phosphatase, receptor type, J |
| chr10_-_65066612 | 0.20 |
ENSRNOT00000043448
|
Myo18a
|
myosin XVIIIa |
| chr10_-_90393317 | 0.20 |
ENSRNOT00000028563
|
Fam171a2
|
family with sequence similarity 171, member A2 |
| chr9_+_73319710 | 0.19 |
ENSRNOT00000092485
|
Map2
|
microtubule-associated protein 2 |
| chr10_-_45297385 | 0.19 |
ENSRNOT00000041187
|
Hist3h2bb
|
histone cluster 3 H2B family member b |
| chr18_+_55797198 | 0.19 |
ENSRNOT00000026334
ENSRNOT00000026394 |
Dctn4
|
dynactin subunit 4 |
| chr10_-_86554478 | 0.19 |
ENSRNOT00000049621
|
Ormdl3
|
ORMDL sphingolipid biosynthesis regulator 3 |
| chr17_-_44527801 | 0.16 |
ENSRNOT00000089643
|
Hist1h2bk
|
histone cluster 1 H2B family member k |
| chr12_+_18074033 | 0.16 |
ENSRNOT00000001727
|
LOC103689975
|
integrator complex subunit 1-like |
| chr2_-_198360678 | 0.15 |
ENSRNOT00000051917
|
Hist2h2ac
|
histone cluster 2 H2A family member c |
| chr10_+_55687050 | 0.14 |
ENSRNOT00000057136
|
Per1
|
period circadian clock 1 |
| chr1_+_167066516 | 0.14 |
ENSRNOT00000000474
|
Numa1
|
nuclear mitotic apparatus protein 1 |
| chr3_-_80000091 | 0.13 |
ENSRNOT00000079394
|
Madd
|
MAP-kinase activating death domain |
| chr5_-_60559329 | 0.13 |
ENSRNOT00000017046
|
Zbtb5
|
zinc finger and BTB domain containing 5 |
| chr12_+_16950728 | 0.12 |
ENSRNOT00000060370
|
Ints1
|
integrator complex subunit 1 |
| chr6_-_115513354 | 0.12 |
ENSRNOT00000005881
|
Ston2
|
stonin 2 |
| chr17_-_43770561 | 0.12 |
ENSRNOT00000088408
|
RGD1562378
|
histone H4 variant H4-v.1 |
| chr7_+_123168811 | 0.12 |
ENSRNOT00000007091
|
Csdc2
|
cold shock domain containing C2 |
| chr1_+_199037544 | 0.12 |
ENSRNOT00000025499
|
Rnf40
|
ring finger protein 40 |
| chr1_+_217345545 | 0.12 |
ENSRNOT00000071741
|
Shank2
|
SH3 and multiple ankyrin repeat domains 2 |
| chr8_+_117780891 | 0.11 |
ENSRNOT00000077236
|
Shisa5
|
shisa family member 5 |
| chr7_-_116106368 | 0.10 |
ENSRNOT00000035678
|
Ly6k
|
lymphocyte antigen 6 complex, locus K |
| chr1_-_128695796 | 0.10 |
ENSRNOT00000076329
|
Synm
|
synemin |
| chr18_-_57114545 | 0.10 |
ENSRNOT00000026495
|
Afap1l1
|
actin filament associated protein 1-like 1 |
| chr3_+_43255567 | 0.10 |
ENSRNOT00000044419
|
Gpd2
|
glycerol-3-phosphate dehydrogenase 2 |
| chr17_-_43821536 | 0.10 |
ENSRNOT00000072286
|
RGD1562378
|
histone H4 variant H4-v.1 |
| chr1_+_217345154 | 0.10 |
ENSRNOT00000092516
|
Shank2
|
SH3 and multiple ankyrin repeat domains 2 |
| chr8_-_115358046 | 0.10 |
ENSRNOT00000017607
|
Grm2
|
glutamate metabotropic receptor 2 |
| chr3_+_152752091 | 0.10 |
ENSRNOT00000037177
|
Dlgap4
|
DLG associated protein 4 |
| chr1_+_259958310 | 0.09 |
ENSRNOT00000019751
|
LOC103689954
|
ectonucleoside triphosphate diphosphohydrolase 1 |
| chr2_+_83393282 | 0.09 |
ENSRNOT00000044871
|
Ctnnd2
|
catenin delta 2 |
| chr3_-_112676556 | 0.09 |
ENSRNOT00000014664
|
Cdan1
|
codanin 1 |
| chr18_+_30398113 | 0.09 |
ENSRNOT00000027206
|
Pcdhb5
|
protocadherin beta 5 |
| chr5_+_145257714 | 0.09 |
ENSRNOT00000019214
|
Dlgap3
|
DLG associated protein 3 |
| chr1_+_185427736 | 0.09 |
ENSRNOT00000064706
|
Plekha7
|
pleckstrin homology domain containing A7 |
| chr14_-_33677031 | 0.08 |
ENSRNOT00000002908
|
RGD1311575
|
hypothetical LOC289568 |
| chr13_-_51076852 | 0.08 |
ENSRNOT00000078993
|
Adora1
|
adenosine A1 receptor |
| chr14_-_35149608 | 0.08 |
ENSRNOT00000003050
ENSRNOT00000090654 |
Kit
|
KIT proto-oncogene receptor tyrosine kinase |
| chr16_+_84465656 | 0.08 |
ENSRNOT00000043188
|
LOC689713
|
LRRGT00175 |
| chr7_+_11054333 | 0.08 |
ENSRNOT00000007202
|
Gna15
|
guanine nucleotide binding protein, alpha 15 |
| chr14_-_80355420 | 0.08 |
ENSRNOT00000049798
|
Acox3
|
acyl-CoA oxidase 3, pristanoyl |
| chr4_+_181315444 | 0.08 |
ENSRNOT00000044147
|
Ppfibp1
|
PPFIA binding protein 1 |
| chr9_-_82410904 | 0.08 |
ENSRNOT00000026081
|
Glb1l
|
galactosidase, beta 1-like |
| chr5_+_122100099 | 0.08 |
ENSRNOT00000007738
|
Pde4b
|
phosphodiesterase 4B |
| chr2_+_185590986 | 0.07 |
ENSRNOT00000088807
ENSRNOT00000088188 |
Lrba
|
LPS responsive beige-like anchor protein |
| chr6_-_38228379 | 0.07 |
ENSRNOT00000084924
|
Mycn
|
v-myc avian myelocytomatosis viral oncogene neuroblastoma derived homolog |
| chr2_-_40386669 | 0.06 |
ENSRNOT00000014074
|
Elovl7
|
ELOVL fatty acid elongase 7 |
| chr4_-_170117325 | 0.06 |
ENSRNOT00000074198
|
LOC100912564
|
histone H4-like |
| chr9_+_25410669 | 0.06 |
ENSRNOT00000030912
ENSRNOT00000090920 |
Tfap2b
|
transcription factor AP-2 beta |
| chr2_-_210282352 | 0.05 |
ENSRNOT00000075653
|
Slc6a17
|
solute carrier family 6 member 17 |
| chr16_-_62241361 | 0.05 |
ENSRNOT00000090036
|
Gsr
|
glutathione-disulfide reductase |
| chr5_+_167141875 | 0.05 |
ENSRNOT00000089314
|
Slc2a5
|
solute carrier family 2 member 5 |
| chr18_+_30424814 | 0.05 |
ENSRNOT00000073425
|
Pcdhb7
|
protocadherin beta 7 |
| chr2_-_189254628 | 0.05 |
ENSRNOT00000028234
|
Il6r
|
interleukin 6 receptor |
| chr17_+_44520537 | 0.05 |
ENSRNOT00000077985
|
hist1h2ail2
|
histone cluster 1, H2ai-like2 |
| chr1_-_80514728 | 0.05 |
ENSRNOT00000081565
|
Clasrp
|
CLK4-associating serine/arginine rich protein |
| chr11_-_84583542 | 0.04 |
ENSRNOT00000064212
|
Yeats2
|
YEATS domain containing 2 |
| chr13_-_60496511 | 0.04 |
ENSRNOT00000004495
|
Cdc73
|
cell division cycle 73 |
| chr4_-_7228675 | 0.04 |
ENSRNOT00000064386
|
Agap3
|
ArfGAP with GTPase domain, ankyrin repeat and PH domain 3 |
| chr18_+_30474947 | 0.03 |
ENSRNOT00000027188
|
Pcdhb9
|
protocadherin beta 9 |
| chr5_-_169499268 | 0.03 |
ENSRNOT00000046552
|
Rnf207
|
ring finger protein 207 |
| chr1_-_57555048 | 0.03 |
ENSRNOT00000066370
|
Prdm9
|
PR/SET domain 9 |
| chr5_+_48456757 | 0.03 |
ENSRNOT00000091482
|
Srsf12
|
serine and arginine rich splicing factor 12 |
| chr18_+_867048 | 0.02 |
ENSRNOT00000065494
|
Colec12
|
collectin sub-family member 12 |
| chr13_+_48287873 | 0.02 |
ENSRNOT00000068223
|
Fam72a
|
family with sequence similarity 72, member A |
| chr1_-_69743616 | 0.02 |
ENSRNOT00000030259
|
Zfp772
|
zinc finger protein 772 |
| chr9_+_82411013 | 0.02 |
ENSRNOT00000026194
|
Stk16
|
serine/threonine kinase 16 |
| chr8_-_72284852 | 0.02 |
ENSRNOT00000080319
ENSRNOT00000057739 |
Usp3
|
ubiquitin specific peptidase 3 |
| chr16_+_54358471 | 0.02 |
ENSRNOT00000047314
|
Mtus1
|
microtubule associated tumor suppressor 1 |
| chr7_-_93280009 | 0.02 |
ENSRNOT00000064877
|
Samd12
|
sterile alpha motif domain containing 12 |
| chr16_+_70644474 | 0.02 |
ENSRNOT00000045955
|
LOC100359503
|
ribosomal protein S28-like |
| chr1_-_226791773 | 0.02 |
ENSRNOT00000082482
ENSRNOT00000065376 ENSRNOT00000054812 ENSRNOT00000086669 |
LOC100911215
|
T-cell surface glycoprotein CD5-like |
| chr10_+_45297937 | 0.02 |
ENSRNOT00000066367
|
Trim17
|
tripartite motif-containing 17 |
| chr5_+_74941802 | 0.02 |
ENSRNOT00000015576
|
Akap2
|
A-kinase anchoring protein 2 |
| chr2_+_209839299 | 0.02 |
ENSRNOT00000092450
|
Kcna2
|
potassium voltage-gated channel subfamily A member 2 |
| chr10_+_104483042 | 0.02 |
ENSRNOT00000007362
|
Sap30bp
|
SAP30 binding protein |
| chr1_-_165997751 | 0.02 |
ENSRNOT00000050227
|
P2ry6
|
pyrimidinergic receptor P2Y6 |
| chr2_+_198360998 | 0.02 |
ENSRNOT00000046129
|
Hist2h2be
|
histone cluster 2, H2be |
| chr7_-_117289961 | 0.01 |
ENSRNOT00000042642
|
Plec
|
plectin |
| chr20_-_6960481 | 0.01 |
ENSRNOT00000093172
|
Mtch1
|
mitochondrial carrier 1 |
| chr18_+_3861539 | 0.01 |
ENSRNOT00000015363
|
Lama3
|
laminin subunit alpha 3 |
| chr7_+_123482255 | 0.01 |
ENSRNOT00000064487
|
LOC688613
|
hypothetical protein LOC688613 |
| chr4_+_79868442 | 0.01 |
ENSRNOT00000089973
|
Mpp6
|
membrane palmitoylated protein 6 |
| chr7_+_115956276 | 0.01 |
ENSRNOT00000007773
|
Them6
|
thioesterase superfamily member 6 |
| chr18_+_64008048 | 0.01 |
ENSRNOT00000083414
|
Ldlrad4
|
low density lipoprotein receptor class A domain containing 4 |
| chr5_+_173288447 | 0.01 |
ENSRNOT00000091205
ENSRNOT00000067252 |
Mxra8
|
matrix remodeling associated 8 |
| chr10_+_56453877 | 0.01 |
ENSRNOT00000031640
|
Plscr3
|
phospholipid scramblase 3 |
| chr5_+_148923098 | 0.01 |
ENSRNOT00000048781
|
Sdc3
|
syndecan 3 |
| chr2_-_59181863 | 0.00 |
ENSRNOT00000079636
|
Spef2
|
sperm flagellar 2 |
| chr1_-_199037267 | 0.00 |
ENSRNOT00000078779
|
Ccdc189
|
coiled-coil domain containing 189 |
| chr18_-_69780922 | 0.00 |
ENSRNOT00000079093
|
Me2
|
malic enzyme 2 |
| chr1_+_192233910 | 0.00 |
ENSRNOT00000016418
ENSRNOT00000016442 |
Prkcb
|
protein kinase C, beta |
| chr20_+_7484800 | 0.00 |
ENSRNOT00000081604
|
Anks1a
|
ankyrin repeat and sterile alpha motif domain containing 1A |
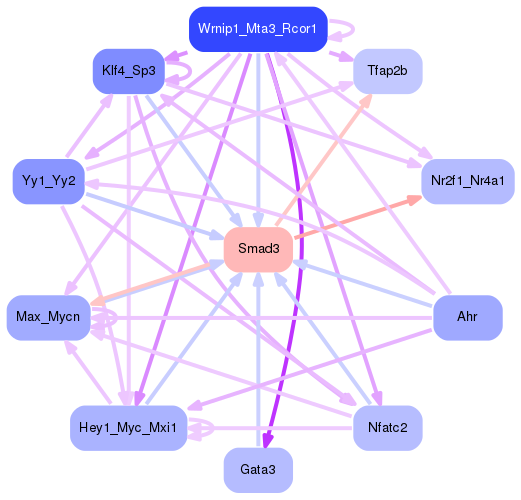
Network of associatons between targets according to the STRING database.

First level regulatory network of Smad3
Gene Ontology Analysis
Gene overrepresentation in biological process category:
| Log-likelihood per target | Total log-likelihood | Term | Description |
|---|---|---|---|
| 0.1 | 0.3 | GO:0051933 | amino acid neurotransmitter reuptake(GO:0051933) glutamate reuptake(GO:0051935) |
| 0.1 | 0.2 | GO:0098939 | dendritic transport of mitochondrion(GO:0098939) anterograde dendritic transport of mitochondrion(GO:0098972) |
| 0.1 | 0.4 | GO:0071376 | response to corticotropin-releasing hormone(GO:0043435) cellular response to corticotropin-releasing hormone stimulus(GO:0071376) |
| 0.1 | 0.2 | GO:0090164 | asymmetric Golgi ribbon formation(GO:0090164) |
| 0.1 | 0.2 | GO:1900060 | negative regulation of ceramide biosynthetic process(GO:1900060) |
| 0.1 | 0.2 | GO:0098923 | positive regulation of adrenergic receptor signaling pathway(GO:0071879) retrograde trans-synaptic signaling by soluble gas(GO:0098923) trans-synaptic signaling by soluble gas(GO:0099543) regulation of adrenergic receptor signaling pathway involved in heart process(GO:1901204) |
| 0.0 | 0.1 | GO:0097167 | circadian regulation of translation(GO:0097167) |
| 0.0 | 0.1 | GO:0036395 | pancreatic amylase secretion(GO:0036395) regulation of pancreatic amylase secretion(GO:1902276) |
| 0.0 | 0.1 | GO:2001166 | regulation of histone H2B ubiquitination(GO:2001166) positive regulation of histone H2B ubiquitination(GO:2001168) |
| 0.0 | 0.3 | GO:0034472 | snRNA 3'-end processing(GO:0034472) |
| 0.0 | 0.1 | GO:1900453 | regulation of nucleoside transport(GO:0032242) negative regulation of neurotrophin production(GO:0032900) negative regulation of circadian sleep/wake cycle, non-REM sleep(GO:0042323) negative regulation of mucus secretion(GO:0070256) negative regulation of long term synaptic depression(GO:1900453) |
| 0.0 | 0.1 | GO:0033540 | fatty acid beta-oxidation using acyl-CoA oxidase(GO:0033540) |
| 0.0 | 0.2 | GO:0010572 | positive regulation of platelet activation(GO:0010572) |
| 0.0 | 0.1 | GO:0097324 | Kit signaling pathway(GO:0038109) melanocyte migration(GO:0097324) positive regulation of vascular smooth muscle cell differentiation(GO:1905065) |
| 0.0 | 0.1 | GO:0019563 | glycerol catabolic process(GO:0019563) |
| 0.0 | 0.1 | GO:0045218 | zonula adherens maintenance(GO:0045218) |
| 0.0 | 0.1 | GO:0015820 | leucine transport(GO:0015820) |
| 0.0 | 0.1 | GO:0031443 | fast-twitch skeletal muscle fiber contraction(GO:0031443) |
| 0.0 | 0.2 | GO:0099562 | maintenance of postsynaptic specialization structure(GO:0098880) maintenance of postsynaptic density structure(GO:0099562) |
| 0.0 | 0.2 | GO:1902857 | positive regulation of nonmotile primary cilium assembly(GO:1902857) |
| 0.0 | 0.2 | GO:0007097 | nuclear migration(GO:0007097) |
| 0.0 | 0.1 | GO:1901898 | negative regulation of relaxation of cardiac muscle(GO:1901898) |
| 0.0 | 0.1 | GO:0034626 | fatty acid elongation, polyunsaturated fatty acid(GO:0034626) |
| 0.0 | 0.1 | GO:0097070 | ductus arteriosus closure(GO:0097070) |
| 0.0 | 0.2 | GO:0002227 | innate immune response in mucosa(GO:0002227) |
| 0.0 | 0.0 | GO:1903116 | positive regulation of actin filament-based movement(GO:1903116) regulation of voltage-gated potassium channel activity involved in ventricular cardiac muscle cell action potential repolarization(GO:1903760) |
Gene overrepresentation in cellular component category:
| Log-likelihood per target | Total log-likelihood | Term | Description |
|---|---|---|---|
| 0.0 | 0.2 | GO:0035339 | SPOTS complex(GO:0035339) |
| 0.0 | 0.1 | GO:0061673 | mitotic spindle astral microtubule(GO:0061673) |
| 0.0 | 0.1 | GO:0033503 | HULC complex(GO:0033503) |
| 0.0 | 0.2 | GO:0031105 | septin complex(GO:0031105) |
| 0.0 | 0.2 | GO:0005869 | dynactin complex(GO:0005869) |
| 0.0 | 0.2 | GO:0097442 | CA3 pyramidal cell dendrite(GO:0097442) |
| 0.0 | 0.1 | GO:0060053 | neurofilament cytoskeleton(GO:0060053) |
| 0.0 | 0.1 | GO:0009331 | glycerol-3-phosphate dehydrogenase complex(GO:0009331) |
| 0.0 | 0.3 | GO:0032039 | integrator complex(GO:0032039) |
| 0.0 | 0.0 | GO:0070110 | interleukin-6 receptor complex(GO:0005896) ciliary neurotrophic factor receptor complex(GO:0070110) |
| 0.0 | 0.2 | GO:0005883 | neurofilament(GO:0005883) |
| 0.0 | 0.3 | GO:0097449 | astrocyte projection(GO:0097449) |
| 0.0 | 0.2 | GO:0042582 | primary lysosome(GO:0005766) azurophil granule(GO:0042582) |
Gene overrepresentation in molecular function category:
| Log-likelihood per target | Total log-likelihood | Term | Description |
|---|---|---|---|
| 0.1 | 0.3 | GO:0015272 | ATP-activated inward rectifier potassium channel activity(GO:0015272) |
| 0.0 | 0.2 | GO:0004517 | nitric-oxide synthase activity(GO:0004517) |
| 0.0 | 0.1 | GO:0052591 | sn-glycerol-3-phosphate:ubiquinone oxidoreductase activity(GO:0052590) sn-glycerol-3-phosphate:ubiquinone-8 oxidoreductase activity(GO:0052591) |
| 0.0 | 0.1 | GO:0001641 | group II metabotropic glutamate receptor activity(GO:0001641) |
| 0.0 | 0.3 | GO:0070097 | delta-catenin binding(GO:0070097) |
| 0.0 | 0.1 | GO:0032795 | heterotrimeric G-protein binding(GO:0032795) |
| 0.0 | 0.2 | GO:0098919 | structural constituent of postsynaptic specialization(GO:0098879) structural constituent of postsynaptic density(GO:0098919) |
| 0.0 | 0.1 | GO:0003997 | acyl-CoA oxidase activity(GO:0003997) |
| 0.0 | 0.4 | GO:0035259 | glucocorticoid receptor binding(GO:0035259) |
| 0.0 | 0.2 | GO:0050811 | GABA receptor binding(GO:0050811) |
| 0.0 | 0.0 | GO:0004897 | ciliary neurotrophic factor receptor activity(GO:0004897) |
Gene overrepresentation in curated gene sets: REACTOME pathways category:
| Log-likelihood per target | Total log-likelihood | Term | Description |
|---|---|---|---|
| 0.0 | 0.4 | REACTOME RNA POL I PROMOTER OPENING | Genes involved in RNA Polymerase I Promoter Opening |
| 0.0 | 0.1 | REACTOME RECRUITMENT OF NUMA TO MITOTIC CENTROSOMES | Genes involved in Recruitment of NuMA to mitotic centrosomes |
| 0.0 | 0.4 | REACTOME PIP3 ACTIVATES AKT SIGNALING | Genes involved in PIP3 activates AKT signaling |