Project
GSE49485: Hypoxia transcriptome sequencing of rat brain.
Navigation
Downloads
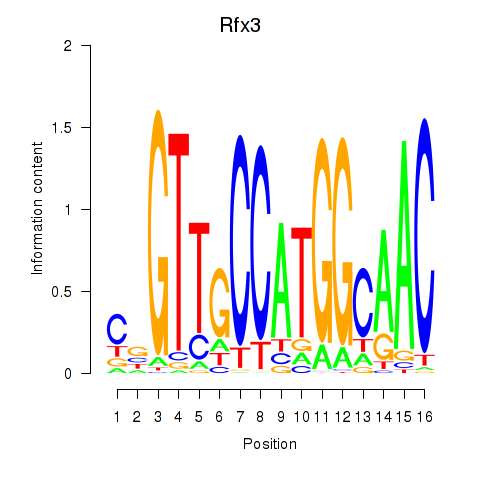
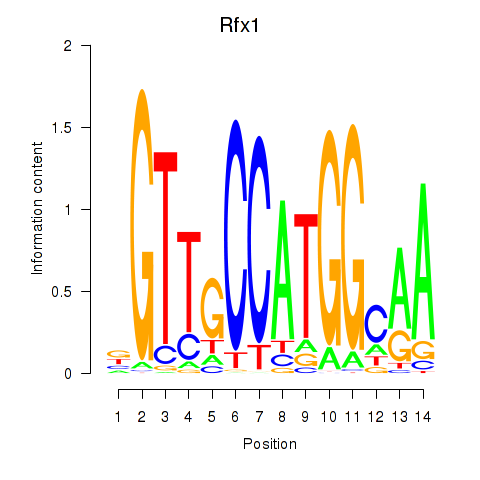
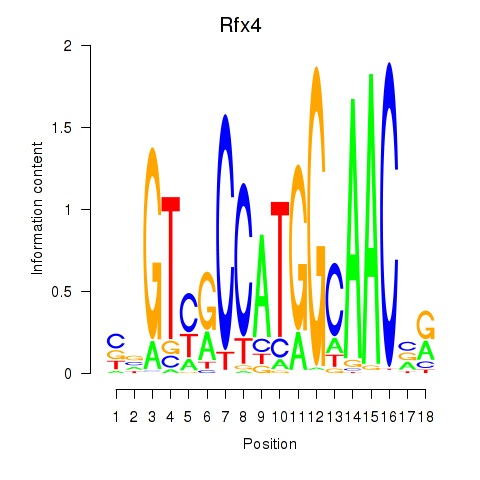
Results for Rfx3_Rfx1_Rfx4
Z-value: 2.01
Motif logo
Transcription factors associated with Rfx3_Rfx1_Rfx4
| Gene Symbol | Gene ID | Gene Info |
|---|---|---|
|
Rfx3
|
ENSRNOG00000014486 | regulatory factor X3 |
|
Rfx1
|
ENSRNOG00000006049 | regulatory factor X1 |
|
Rfx4
|
ENSRNOG00000051536 | regulatory factor X4 |
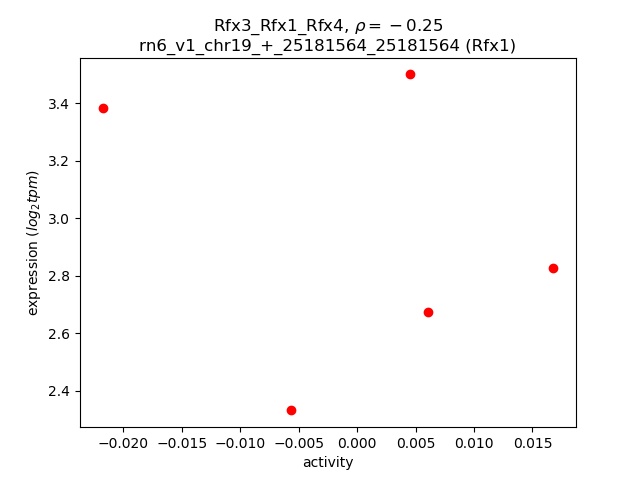
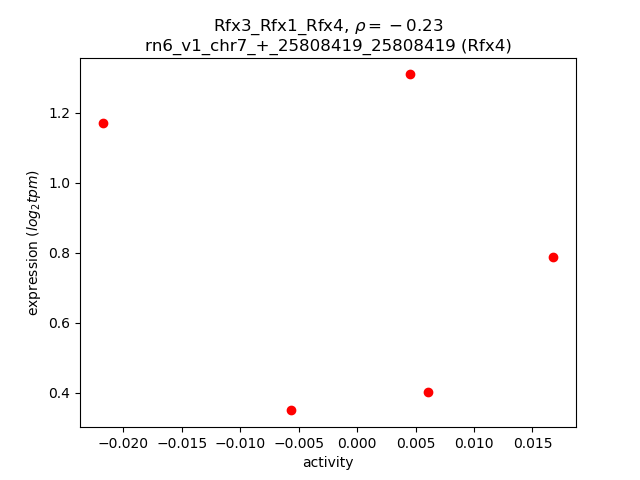
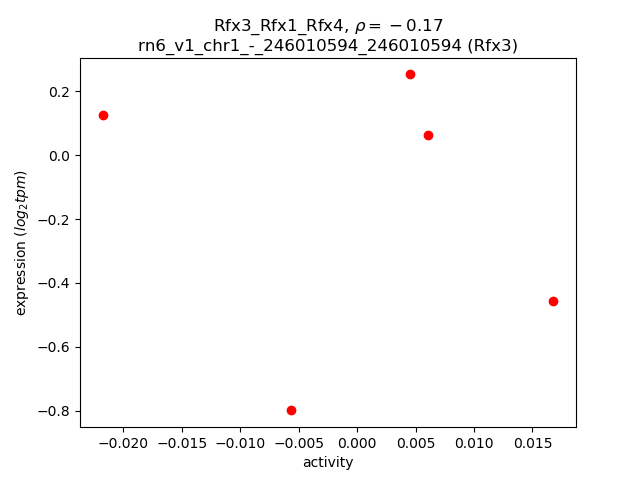
Activity-expression correlation:
| Gene | Promoter | Pearson corr. coef. | P-value | Plot |
|---|---|---|---|---|
| Rfx1 | rn6_v1_chr19_+_25181564_25181564 | -0.25 | 6.9e-01 | Click! |
| Rfx4 | rn6_v1_chr7_+_25808419_25808419 | -0.23 | 7.1e-01 | Click! |
| Rfx3 | rn6_v1_chr1_-_246010594_246010594 | -0.17 | 7.9e-01 | Click! |
Activity profile of Rfx3_Rfx1_Rfx4 motif
Sorted Z-values of Rfx3_Rfx1_Rfx4 motif
| Promoter | Log-likelihood | Transcript | Gene | Gene Info |
|---|---|---|---|---|
| chr20_-_14573519 | 0.94 |
ENSRNOT00000001772
|
Rab36
|
RAB36, member RAS oncogene family |
| chr6_+_8886591 | 0.92 |
ENSRNOT00000091510
ENSRNOT00000089174 |
Six3
|
SIX homeobox 3 |
| chr11_+_88424414 | 0.91 |
ENSRNOT00000022328
|
Spag6l
|
sperm associated antigen 6-like |
| chr17_-_88095729 | 0.90 |
ENSRNOT00000025140
|
Enkur
|
enkurin, TRPC channel interacting protein |
| chr2_+_164549455 | 0.78 |
ENSRNOT00000017151
|
Mlf1
|
myeloid leukemia factor 1 |
| chr2_-_195712461 | 0.78 |
ENSRNOT00000056449
|
Riiad1
|
regulatory subunit of type II PKA R-subunit (RIIa) domain containing 1 |
| chr12_+_22665112 | 0.78 |
ENSRNOT00000001918
|
Ap1s1
|
adaptor-related protein complex 1, sigma 1 subunit |
| chr10_+_96663740 | 0.76 |
ENSRNOT00000037067
|
Cep112
|
centrosomal protein 112 |
| chr2_-_208623314 | 0.75 |
ENSRNOT00000022731
|
Pifo
|
primary cilia formation |
| chr7_-_18577325 | 0.74 |
ENSRNOT00000084308
ENSRNOT00000090849 |
March2
|
membrane associated ring-CH-type finger 2 |
| chr1_-_199037267 | 0.73 |
ENSRNOT00000078779
|
Ccdc189
|
coiled-coil domain containing 189 |
| chr2_-_211322719 | 0.73 |
ENSRNOT00000027493
|
RGD1310209
|
similar to KIAA1324 protein |
| chr1_-_226501920 | 0.66 |
ENSRNOT00000050716
|
Lrrc10b
|
leucine rich repeat containing 10B |
| chr1_+_188571953 | 0.61 |
ENSRNOT00000055096
|
Iqck
|
IQ motif containing K |
| chr12_+_2534212 | 0.59 |
ENSRNOT00000001399
|
Ctxn1
|
cortexin 1 |
| chr16_-_21338771 | 0.59 |
ENSRNOT00000014265
|
Pbx4
|
PBX homeobox 4 |
| chr4_-_157304653 | 0.59 |
ENSRNOT00000051613
|
Lrrc23
|
leucine rich repeat containing 23 |
| chr1_+_78893271 | 0.59 |
ENSRNOT00000029825
|
Pnmal1
|
paraneoplastic Ma antigen family-like 1 |
| chr12_+_47074200 | 0.57 |
ENSRNOT00000014910
|
Dynll1
|
dynein light chain LC8-type 1 |
| chr9_-_94601852 | 0.55 |
ENSRNOT00000022485
|
Ngef
|
neuronal guanine nucleotide exchange factor |
| chr3_-_7632345 | 0.54 |
ENSRNOT00000049889
|
Cfap77
|
cilia and flagella associated protein 77 |
| chr10_+_57185347 | 0.54 |
ENSRNOT00000040488
ENSRNOT00000086374 |
Mink1
|
misshapen-like kinase 1 |
| chr9_+_20241062 | 0.52 |
ENSRNOT00000071593
|
LOC100911585
|
leucine-rich repeat-containing protein 23-like |
| chr1_-_145931583 | 0.51 |
ENSRNOT00000016433
|
Cfap161
|
cilia and flagella associated protein 161 |
| chr3_-_102151489 | 0.51 |
ENSRNOT00000006349
|
Ano3
|
anoctamin 3 |
| chr1_+_205842489 | 0.50 |
ENSRNOT00000081610
|
Fank1
|
fibronectin type 3 and ankyrin repeat domains 1 |
| chr7_-_120744602 | 0.49 |
ENSRNOT00000018564
|
Kcnj4
|
potassium voltage-gated channel subfamily J member 4 |
| chr15_+_27875911 | 0.49 |
ENSRNOT00000013582
|
Pnp
|
purine nucleoside phosphorylase |
| chr2_-_144467912 | 0.49 |
ENSRNOT00000040002
|
Ccna1
|
cyclin A1 |
| chr5_-_143062226 | 0.49 |
ENSRNOT00000029388
|
Dnali1
|
dynein, axonemal, light intermediate chain 1 |
| chr3_-_123702732 | 0.49 |
ENSRNOT00000028859
|
RGD1311739
|
similar to RIKEN cDNA 1700037H04 |
| chr5_+_61474000 | 0.47 |
ENSRNOT00000013930
|
Ccdc180
|
coiled-coil domain containing 180 |
| chr8_-_6235967 | 0.47 |
ENSRNOT00000068290
|
LOC654482
|
hypothetical protein LOC654482 |
| chr6_+_137953545 | 0.46 |
ENSRNOT00000006804
|
Crip2
|
cysteine-rich protein 2 |
| chr12_-_6703979 | 0.46 |
ENSRNOT00000061246
|
Tex26
|
testis expressed 26 |
| chr12_+_24803686 | 0.45 |
ENSRNOT00000033499
|
Wbscr28
|
Williams-Beuren syndrome chromosome region 28 |
| chr8_-_55491152 | 0.45 |
ENSRNOT00000014965
|
LOC100359479
|
rCG58364-like |
| chr7_+_139762614 | 0.45 |
ENSRNOT00000031157
|
Ccdc184
|
coiled-coil domain containing 184 |
| chr11_-_90234286 | 0.43 |
ENSRNOT00000071986
|
Efcab1
|
EF hand calcium binding domain 1 |
| chr10_-_57671080 | 0.42 |
ENSRNOT00000082511
|
LOC691995
|
hypothetical protein LOC691995 |
| chr20_-_10680283 | 0.42 |
ENSRNOT00000001579
|
Sik1
|
salt-inducible kinase 1 |
| chr1_+_265298868 | 0.41 |
ENSRNOT00000023278
|
Dpcd
|
deleted in primary ciliary dyskinesia |
| chr8_-_13290773 | 0.41 |
ENSRNOT00000012217
|
RGD1561795
|
similar to RIKEN cDNA 1700012B09 |
| chr10_-_54512169 | 0.41 |
ENSRNOT00000005066
|
Cfap52
|
cilia and flagella associated protein 52 |
| chr5_-_135994848 | 0.41 |
ENSRNOT00000067675
|
Btbd19
|
BTB domain containing 19 |
| chr7_+_12652415 | 0.40 |
ENSRNOT00000031315
|
Plppr3
|
phospholipid phosphatase related 3 |
| chr14_-_43584343 | 0.40 |
ENSRNOT00000039835
|
Nsun7
|
NOP2/Sun RNA methyltransferase family member 7 |
| chr7_-_144837583 | 0.39 |
ENSRNOT00000055289
|
Cbx5
|
chromobox 5 |
| chr19_-_10380809 | 0.39 |
ENSRNOT00000031064
|
Drc7
|
dynein regulatory complex subunit 7 |
| chr1_+_78739930 | 0.39 |
ENSRNOT00000021976
|
Strn4
|
striatin 4 |
| chr1_+_72874404 | 0.38 |
ENSRNOT00000058900
|
Dnaaf3
|
dynein, axonemal, assembly factor 3 |
| chr3_+_160047296 | 0.38 |
ENSRNOT00000051590
|
Pkig
|
cAMP-dependent protein kinase inhibitor gamma |
| chr1_-_266074181 | 0.38 |
ENSRNOT00000026378
|
Psd
|
pleckstrin and Sec7 domain containing |
| chr19_-_10653800 | 0.35 |
ENSRNOT00000022128
|
Cx3cl1
|
C-X3-C motif chemokine ligand 1 |
| chr10_-_61744976 | 0.35 |
ENSRNOT00000079926
ENSRNOT00000092314 ENSRNOT00000034298 |
Sgsm2
|
small G protein signaling modulator 2 |
| chr12_-_6341902 | 0.34 |
ENSRNOT00000001201
|
Hsph1
|
heat shock protein family H (Hsp110) member 1 |
| chr19_+_52225582 | 0.34 |
ENSRNOT00000020917
|
Dnaaf1
|
dynein, axonemal, assembly factor 1 |
| chr4_+_2053712 | 0.34 |
ENSRNOT00000045086
|
Rnf32
|
ring finger protein 32 |
| chr10_+_14062331 | 0.34 |
ENSRNOT00000029652
|
Noxo1
|
NADPH oxidase organizer 1 |
| chr1_+_220335254 | 0.34 |
ENSRNOT00000072261
|
Rin1
|
Ras and Rab interactor 1 |
| chr5_+_140712583 | 0.34 |
ENSRNOT00000019587
|
Trit1
|
tRNA isopentenyltransferase 1 |
| chr9_-_17114177 | 0.34 |
ENSRNOT00000061185
|
Lrrc73
|
leucine rich repeat containing 73 |
| chrX_+_135470915 | 0.33 |
ENSRNOT00000009637
|
Slc25a14
|
solute carrier family 25 member 14 |
| chr16_-_49820235 | 0.33 |
ENSRNOT00000029628
|
Sorbs2
|
sorbin and SH3 domain containing 2 |
| chr7_+_27240876 | 0.32 |
ENSRNOT00000091725
|
LOC362863
|
first gene upstream of Nt5dc3 |
| chr9_+_81644355 | 0.32 |
ENSRNOT00000071700
|
Catip
|
ciliogenesis associated TTC17 interacting protein |
| chr15_-_8914501 | 0.32 |
ENSRNOT00000008752
|
Thrb
|
thyroid hormone receptor beta |
| chr8_+_64364741 | 0.32 |
ENSRNOT00000082840
|
Celf6
|
CUGBP, Elav-like family member 6 |
| chr13_-_105684374 | 0.31 |
ENSRNOT00000073142
|
Spata17
|
spermatogenesis associated 17 |
| chr4_+_114854458 | 0.31 |
ENSRNOT00000013312
|
LOC500227
|
hypothetical gene supported by BC079424 |
| chr1_+_84070983 | 0.31 |
ENSRNOT00000090478
|
Numbl
|
NUMB-like, endocytic adaptor protein |
| chr8_-_130475320 | 0.30 |
ENSRNOT00000075439
|
Ccdc13
|
coiled-coil domain containing 13 |
| chrX_+_32495809 | 0.30 |
ENSRNOT00000020999
|
RGD1565844
|
similar to RIKEN cDNA 1700045I19 |
| chr19_-_38321528 | 0.30 |
ENSRNOT00000031977
|
Smpd3
|
sphingomyelin phosphodiesterase 3 |
| chr20_-_4392343 | 0.30 |
ENSRNOT00000080476
|
Ppt2
|
palmitoyl-protein thioesterase 2 |
| chr1_-_129780356 | 0.29 |
ENSRNOT00000077479
|
Arrdc4
|
arrestin domain containing 4 |
| chr10_-_89338739 | 0.29 |
ENSRNOT00000073923
|
Ptges3l
|
prostaglandin E synthase 3 like |
| chr8_-_106858543 | 0.29 |
ENSRNOT00000051939
|
LOC103690070
|
coxsackievirus and adenovirus receptor-like |
| chr8_+_79638696 | 0.29 |
ENSRNOT00000085959
|
Dyx1c1
|
dyslexia susceptibility 1 candidate 1 |
| chr10_+_55653946 | 0.29 |
ENSRNOT00000008787
|
Tmem107
|
transmembrane protein 107 |
| chr14_-_81100803 | 0.29 |
ENSRNOT00000014692
|
Msantd1
|
Myb/SANT DNA binding domain containing 1 |
| chr2_-_33841499 | 0.29 |
ENSRNOT00000040533
|
Srek1
|
splicing regulatory glutamic acid and lysine rich protein 1 |
| chr7_-_144837395 | 0.29 |
ENSRNOT00000089024
|
Cbx5
|
chromobox 5 |
| chr3_+_148438939 | 0.28 |
ENSRNOT00000064196
|
Ttll9
|
tubulin tyrosine ligase like 9 |
| chr1_+_214182830 | 0.28 |
ENSRNOT00000022867
|
Lrrc56
|
leucine rich repeat containing 56 |
| chr3_+_80833272 | 0.28 |
ENSRNOT00000023583
|
Chrm4
|
cholinergic receptor, muscarinic 4 |
| chr10_+_58776792 | 0.28 |
ENSRNOT00000019574
|
Txndc17
|
thioredoxin domain containing 17 |
| chr2_-_30340103 | 0.28 |
ENSRNOT00000024023
ENSRNOT00000067722 |
Bdp1
|
B double prime 1, subunit of RNA polymerase III transcription initiation factor IIIB |
| chr1_-_82120902 | 0.27 |
ENSRNOT00000027684
|
Erf
|
Ets2 repressor factor |
| chr8_+_90343154 | 0.27 |
ENSRNOT00000068482
|
Irak1bp1
|
interleukin-1 receptor-associated kinase 1 binding protein 1 |
| chr18_-_73360373 | 0.27 |
ENSRNOT00000048702
|
Katnal2
|
katanin catalytic subunit A1 like 2 |
| chr5_+_140870140 | 0.27 |
ENSRNOT00000074347
|
Hpcal4
|
hippocalcin-like 4 |
| chr2_+_206064179 | 0.27 |
ENSRNOT00000025953
|
Syt6
|
synaptotagmin 6 |
| chr8_-_79660439 | 0.27 |
ENSRNOT00000089949
|
Ccpg1os
|
cell cycle progression 1, opposite strand |
| chr9_+_88964525 | 0.26 |
ENSRNOT00000068236
|
Daw1
|
dynein assembly factor with WD repeats 1 |
| chr20_+_4959294 | 0.26 |
ENSRNOT00000074223
|
Hspa1l
|
heat shock protein family A (Hsp70) member 1 like |
| chr2_-_187820952 | 0.26 |
ENSRNOT00000092762
|
Sema4a
|
semaphorin 4A |
| chr1_-_188373571 | 0.26 |
ENSRNOT00000075020
|
Knop1
|
lysine-rich nucleolar protein 1 |
| chr6_-_27024129 | 0.26 |
ENSRNOT00000012273
|
Dpysl5
|
dihydropyrimidinase-like 5 |
| chr5_+_169519212 | 0.26 |
ENSRNOT00000024732
|
Chd5
|
chromodomain helicase DNA binding protein 5 |
| chr4_+_172709724 | 0.26 |
ENSRNOT00000010707
|
Igbp1b
|
immunoglobulin (CD79A) binding protein 1b |
| chr7_-_74901997 | 0.26 |
ENSRNOT00000039378
|
Rgs22
|
regulator of G-protein signaling 22 |
| chr19_+_56010085 | 0.25 |
ENSRNOT00000058216
|
Spata33
|
spermatogenesis associated 33 |
| chr1_-_281101438 | 0.25 |
ENSRNOT00000012734
|
Rab11fip2
|
RAB11 family interacting protein 2 |
| chr8_+_107699480 | 0.25 |
ENSRNOT00000048864
|
Nme9
|
NME/NM23 family member 9 |
| chr13_-_70174565 | 0.24 |
ENSRNOT00000067135
|
Rgl1
|
ral guanine nucleotide dissociation stimulator,-like 1 |
| chr5_+_153845094 | 0.24 |
ENSRNOT00000041600
|
Stpg1
|
sperm-tail PG-rich repeat containing 1 |
| chr3_-_110021149 | 0.24 |
ENSRNOT00000007808
|
Fsip1
|
fibrous sheath interacting protein 1 |
| chr6_+_109617596 | 0.24 |
ENSRNOT00000085031
ENSRNOT00000089972 ENSRNOT00000082402 |
Flvcr2
|
feline leukemia virus subgroup C cellular receptor family, member 2 |
| chr5_+_159735008 | 0.24 |
ENSRNOT00000064310
|
Rsg1
|
REM2 and RAB-like small GTPase 1 |
| chrX_+_122808605 | 0.24 |
ENSRNOT00000017567
|
Zcchc12
|
zinc finger CCHC-type containing 12 |
| chr4_-_126071261 | 0.24 |
ENSRNOT00000080234
|
LOC100361920
|
dynein light chain 1-like |
| chr13_+_83681322 | 0.24 |
ENSRNOT00000004206
|
Mpc2
|
mitochondrial pyruvate carrier 2 |
| chr4_-_100380578 | 0.24 |
ENSRNOT00000018251
|
Sh2d6
|
SH2 domain containing 6 |
| chr2_+_181331464 | 0.23 |
ENSRNOT00000017448
|
Map9
|
microtubule-associated protein 9 |
| chr17_-_78910671 | 0.23 |
ENSRNOT00000064609
|
Acbd7
|
acyl-CoA binding domain containing 7 |
| chr10_+_38919167 | 0.23 |
ENSRNOT00000077569
|
Kif3a
|
kinesin family member 3a |
| chr1_-_222495382 | 0.23 |
ENSRNOT00000028759
|
Naa40
|
N(alpha)-acetyltransferase 40, NatD catalytic subunit |
| chr10_-_56154548 | 0.23 |
ENSRNOT00000090809
|
Dnah2
|
dynein, axonemal, heavy chain 2 |
| chr8_+_67753279 | 0.23 |
ENSRNOT00000009716
|
Calml4
|
calmodulin-like 4 |
| chr1_+_213583606 | 0.23 |
ENSRNOT00000088899
|
AC109844.1
|
|
| chr19_+_37795658 | 0.23 |
ENSRNOT00000025686
|
Tsnaxip1
|
translin-associated factor X interacting protein 1 |
| chr4_+_147756553 | 0.23 |
ENSRNOT00000086549
ENSRNOT00000014733 |
Ift122
|
intraflagellar transport 122 |
| chr5_-_136706936 | 0.23 |
ENSRNOT00000081925
ENSRNOT00000068130 |
Ccdc24
|
coiled-coil domain containing 24 |
| chr5_+_159734838 | 0.22 |
ENSRNOT00000079905
|
Rsg1
|
REM2 and RAB-like small GTPase 1 |
| chr18_+_47740328 | 0.22 |
ENSRNOT00000025119
|
Sncaip
|
synuclein, alpha interacting protein |
| chr7_-_54855557 | 0.22 |
ENSRNOT00000039475
|
Glipr1l1
|
GLI pathogenesis-related 1 like 1 |
| chr16_-_39970532 | 0.22 |
ENSRNOT00000071331
|
Spata4
|
spermatogenesis associated 4 |
| chr9_-_13311924 | 0.22 |
ENSRNOT00000015584
|
Kif6
|
kinesin family member 6 |
| chr3_-_15379381 | 0.21 |
ENSRNOT00000084069
|
Ndufa8
|
NADH:ubiquinone oxidoreductase subunit A8 |
| chr1_+_91042635 | 0.21 |
ENSRNOT00000028211
|
LOC103690005
|
tubulin-folding cofactor B |
| chr12_-_2007516 | 0.21 |
ENSRNOT00000037564
|
Pex11g
|
peroxisomal biogenesis factor 11 gamma |
| chr3_-_123718432 | 0.21 |
ENSRNOT00000028861
|
Spef1
|
sperm flagellar 1 |
| chr1_-_88162583 | 0.21 |
ENSRNOT00000087411
|
Catsperg
|
cation channel sperm associated auxiliary subunit gamma |
| chr2_-_89310946 | 0.21 |
ENSRNOT00000015195
|
Ralyl
|
RALY RNA binding protein-like |
| chr9_+_82718709 | 0.21 |
ENSRNOT00000027256
ENSRNOT00000080524 |
Stk11ip
|
serine/threonine kinase 11 interacting protein |
| chr12_-_37425596 | 0.21 |
ENSRNOT00000084553
|
Tctn2
|
tectonic family member 2 |
| chr20_-_3299580 | 0.21 |
ENSRNOT00000050373
|
Gnl1
|
G protein nucleolar 1 |
| chr13_-_30800451 | 0.20 |
ENSRNOT00000046791
|
Rpl21
|
ribosomal protein L21 |
| chr16_+_26859397 | 0.20 |
ENSRNOT00000044171
|
Msmo1
|
methylsterol monooxygenase 1 |
| chr1_+_72874583 | 0.20 |
ENSRNOT00000077719
|
Dnaaf3
|
dynein, axonemal, assembly factor 3 |
| chr3_+_113251778 | 0.20 |
ENSRNOT00000083005
|
Map1a
|
microtubule-associated protein 1A |
| chr8_-_107272122 | 0.20 |
ENSRNOT00000041894
|
Cxadrl1
|
coxsackie virus and adenovirus receptor-like 1 |
| chr5_-_122642202 | 0.20 |
ENSRNOT00000046691
|
Wdr78
|
WD repeat domain 78 |
| chr7_-_120380200 | 0.19 |
ENSRNOT00000014878
|
RGD1359634
|
similar to RIKEN cDNA 1700088E04 |
| chr5_+_136406308 | 0.19 |
ENSRNOT00000072492
|
Eri3
|
ERI1 exoribonuclease family member 3 |
| chr19_+_10519493 | 0.19 |
ENSRNOT00000030229
|
Ccdc102a
|
coiled-coil domain containing 102A |
| chr13_-_90832469 | 0.19 |
ENSRNOT00000086508
|
Igsf9
|
immunoglobulin superfamily, member 9 |
| chr5_+_157165341 | 0.19 |
ENSRNOT00000087072
|
Pla2g2c
|
phospholipase A2, group IIC |
| chr6_+_1534594 | 0.19 |
ENSRNOT00000007000
|
Ndufaf7
|
NADH:ubiquinone oxidoreductase complex assembly factor 7 |
| chr13_+_82574966 | 0.19 |
ENSRNOT00000003844
|
Ccdc181
|
coiled-coil domain containing 181 |
| chr1_+_220325352 | 0.19 |
ENSRNOT00000027258
|
LOC108348098
|
breast cancer metastasis-suppressor 1 homolog |
| chr6_+_145770662 | 0.19 |
ENSRNOT00000088969
|
Cdca7l
|
cell division cycle associated 7 like |
| chr9_+_10446699 | 0.19 |
ENSRNOT00000075344
|
LOC301124
|
hypothetical LOC301124 |
| chr3_-_147849875 | 0.19 |
ENSRNOT00000081153
|
Nrsn2
|
neurensin 2 |
| chr5_+_157165888 | 0.19 |
ENSRNOT00000043029
|
Pla2g2c
|
phospholipase A2, group IIC |
| chr1_-_72674271 | 0.19 |
ENSRNOT00000023744
|
Kmt5c
|
lysine methyltransferase 5C |
| chr15_+_34584320 | 0.18 |
ENSRNOT00000048255
|
AABR07017917.1
|
|
| chr10_+_49472460 | 0.18 |
ENSRNOT00000038276
|
Tekt3
|
tektin 3 |
| chr3_+_110442637 | 0.18 |
ENSRNOT00000010471
|
Pak6
|
p21 (RAC1) activated kinase 6 |
| chr20_+_33945829 | 0.18 |
ENSRNOT00000064063
|
LOC103689994
|
radial spoke head protein 4 homolog A |
| chr2_+_189430041 | 0.18 |
ENSRNOT00000023567
ENSRNOT00000023605 |
Tpm3
|
tropomyosin 3 |
| chr11_-_64421248 | 0.18 |
ENSRNOT00000066997
|
Igsf11
|
immunoglobulin superfamily, member 11 |
| chr10_+_38918748 | 0.18 |
ENSRNOT00000009999
|
Kif3a
|
kinesin family member 3a |
| chr1_+_100471066 | 0.18 |
ENSRNOT00000067562
|
Aspdh
|
aspartate dehydrogenase domain containing |
| chr1_+_203971152 | 0.18 |
ENSRNOT00000075540
|
Gpr26
|
G protein-coupled receptor 26 |
| chr9_-_65917132 | 0.18 |
ENSRNOT00000031866
|
Tmem237
|
transmembrane protein 237 |
| chr20_-_46871946 | 0.18 |
ENSRNOT00000031047
|
Armc2
|
armadillo repeat containing 2 |
| chr16_+_49485256 | 0.18 |
ENSRNOT00000059317
|
RGD1564308
|
similar to LOC495042 protein |
| chr1_-_220786615 | 0.18 |
ENSRNOT00000038198
|
Tsga10ip
|
testis specific 10 interacting protein |
| chr20_+_32450733 | 0.17 |
ENSRNOT00000036449
|
Rsph4a
|
radial spoke head 4 homolog A |
| chr13_-_89661150 | 0.17 |
ENSRNOT00000058390
|
Usp21
|
ubiquitin specific peptidase 21 |
| chr11_-_53731779 | 0.17 |
ENSRNOT00000002684
|
Ift57
|
intraflagellar transport 57 |
| chr1_-_188572141 | 0.17 |
ENSRNOT00000073003
|
Knop1
|
lysine-rich nucleolar protein 1 |
| chr6_-_51356383 | 0.17 |
ENSRNOT00000012415
|
Prkar2b
|
protein kinase cAMP-dependent type 2 regulatory subunit beta |
| chr4_+_183656013 | 0.17 |
ENSRNOT00000055442
|
Etfbkmt
|
electron transfer flavoprotein beta subunit lysine methyltransferase |
| chr3_-_58181971 | 0.17 |
ENSRNOT00000002076
|
Dlx2
|
distal-less homeobox 2 |
| chr1_-_141604273 | 0.17 |
ENSRNOT00000092125
|
Anpep
|
alanyl aminopeptidase, membrane |
| chr11_+_70967223 | 0.17 |
ENSRNOT00000087633
|
Iqcg
|
IQ motif containing G |
| chr5_+_136406130 | 0.17 |
ENSRNOT00000093099
|
Eri3
|
ERI1 exoribonuclease family member 3 |
| chr1_+_82473737 | 0.17 |
ENSRNOT00000028029
|
B9d2
|
B9 protein domain 2 |
| chr15_-_104168564 | 0.17 |
ENSRNOT00000093385
ENSRNOT00000038596 |
Dzip1
|
DAZ interacting zinc finger protein 1 |
| chr8_-_66893083 | 0.17 |
ENSRNOT00000037028
ENSRNOT00000091755 |
Kif23
|
kinesin family member 23 |
| chr10_-_13352371 | 0.16 |
ENSRNOT00000034340
|
Prss30
|
protease, serine, 30 |
| chr10_+_90085559 | 0.16 |
ENSRNOT00000028332
|
Nags
|
N-acetylglutamate synthase |
| chr12_+_31335372 | 0.16 |
ENSRNOT00000001242
ENSRNOT00000037296 |
Stx2
|
syntaxin 2 |
| chr1_+_144601410 | 0.16 |
ENSRNOT00000047408
|
Efl1
|
elongation factor like GTPase 1 |
| chr15_-_32888095 | 0.16 |
ENSRNOT00000012233
|
Dad1
|
defender against cell death 1 |
| chrX_-_23469041 | 0.16 |
ENSRNOT00000065789
|
LOC685699
|
hypothetical protein LOC685699 |
| chr1_+_266952561 | 0.16 |
ENSRNOT00000076452
|
Neurl1
|
neuralized E3 ubiquitin protein ligase 1 |
| chr11_+_61661724 | 0.16 |
ENSRNOT00000079423
|
Zdhhc23
|
zinc finger, DHHC-type containing 23 |
| chr17_-_9791781 | 0.16 |
ENSRNOT00000090536
|
Rgs14
|
regulator of G-protein signaling 14 |
| chr17_-_9792007 | 0.16 |
ENSRNOT00000021596
|
Rgs14
|
regulator of G-protein signaling 14 |
| chr5_+_166870011 | 0.16 |
ENSRNOT00000088299
|
Rps2
|
ribosomal protein S2 |
| chr14_-_84393421 | 0.16 |
ENSRNOT00000006911
|
Ccdc157
|
coiled-coil domain containing 157 |
| chr4_-_123118186 | 0.16 |
ENSRNOT00000038096
|
LOC100361898
|
coiled-coil-helix-coiled-coil-helix domain containing 4 |
| chr6_-_36940868 | 0.16 |
ENSRNOT00000006470
|
Gen1
|
GEN1 Holliday junction 5' flap endonuclease |
| chr9_-_82382272 | 0.16 |
ENSRNOT00000025627
|
Abcb6
|
ATP-binding cassette, subfamily B (MDR/TAP), member 6 |
| chr4_+_66165845 | 0.15 |
ENSRNOT00000064175
|
Ubn2
|
ubinuclein 2 |
| chr12_+_23544287 | 0.15 |
ENSRNOT00000001938
|
Orai2
|
ORAI calcium release-activated calcium modulator 2 |
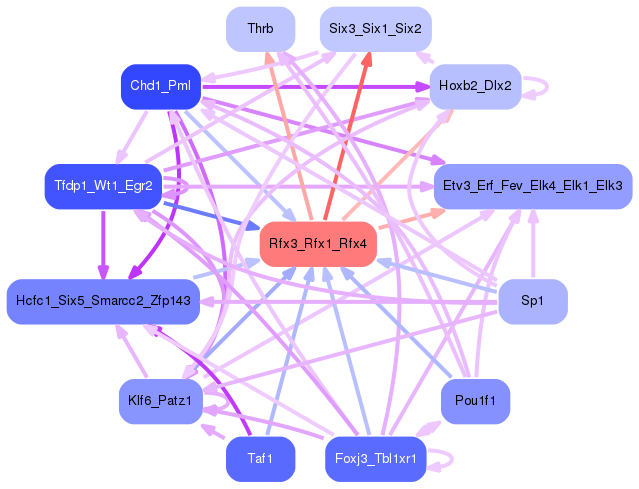
Network of associatons between targets according to the STRING database.

First level regulatory network of Rfx3_Rfx1_Rfx4
Gene Ontology Analysis
Gene overrepresentation in biological process category:
| Log-likelihood per target | Total log-likelihood | Term | Description |
|---|---|---|---|
| 0.3 | 0.9 | GO:0014016 | neuroblast differentiation(GO:0014016) |
| 0.2 | 0.5 | GO:0070638 | nicotinamide riboside catabolic process(GO:0006738) urate biosynthetic process(GO:0034418) nicotinamide riboside metabolic process(GO:0046495) pyridine nucleoside metabolic process(GO:0070637) pyridine nucleoside catabolic process(GO:0070638) |
| 0.1 | 0.4 | GO:0021678 | third ventricle development(GO:0021678) |
| 0.1 | 0.4 | GO:2000769 | epidermal stem cell homeostasis(GO:0036334) regulation of establishment or maintenance of cell polarity regulating cell shape(GO:2000769) positive regulation of establishment or maintenance of cell polarity regulating cell shape(GO:2000771) |
| 0.1 | 0.4 | GO:0034499 | late endosome to Golgi transport(GO:0034499) |
| 0.1 | 0.3 | GO:0021849 | neuroblast division in subventricular zone(GO:0021849) |
| 0.1 | 0.3 | GO:0010070 | zygote asymmetric cell division(GO:0010070) |
| 0.1 | 0.9 | GO:0035721 | intraciliary retrograde transport(GO:0035721) |
| 0.1 | 0.3 | GO:0060478 | acrosomal vesicle exocytosis(GO:0060478) |
| 0.1 | 0.5 | GO:0061588 | calcium activated phospholipid scrambling(GO:0061588) calcium activated phosphatidylcholine scrambling(GO:0061590) calcium activated galactosylceramide scrambling(GO:0061591) |
| 0.1 | 1.2 | GO:0007288 | sperm axoneme assembly(GO:0007288) |
| 0.1 | 0.4 | GO:0032792 | negative regulation of CREB transcription factor activity(GO:0032792) |
| 0.1 | 0.4 | GO:0030382 | sperm mitochondrion organization(GO:0030382) |
| 0.1 | 0.2 | GO:0061732 | mitochondrial acetyl-CoA biosynthetic process from pyruvate(GO:0061732) |
| 0.1 | 0.2 | GO:0044375 | regulation of peroxisome size(GO:0044375) |
| 0.1 | 0.4 | GO:0032914 | positive regulation of transforming growth factor beta1 production(GO:0032914) |
| 0.1 | 0.5 | GO:0061002 | negative regulation of dendritic spine morphogenesis(GO:0061002) |
| 0.1 | 0.4 | GO:1904491 | protein localization to ciliary transition zone(GO:1904491) |
| 0.1 | 0.4 | GO:0015851 | purine nucleobase transport(GO:0006863) nucleobase transport(GO:0015851) |
| 0.1 | 0.7 | GO:2000786 | positive regulation of autophagosome assembly(GO:2000786) |
| 0.1 | 0.3 | GO:1903753 | negative regulation of p38MAPK cascade(GO:1903753) |
| 0.1 | 0.2 | GO:0021898 | regulation of transcription from RNA polymerase II promoter involved in forebrain neuron fate commitment(GO:0021882) commitment of multipotent stem cells to neuronal lineage in forebrain(GO:0021898) |
| 0.1 | 0.3 | GO:0007207 | adenylate cyclase-inhibiting G-protein coupled acetylcholine receptor signaling pathway(GO:0007197) phospholipase C-activating G-protein coupled acetylcholine receptor signaling pathway(GO:0007207) |
| 0.1 | 0.3 | GO:0006526 | arginine biosynthetic process(GO:0006526) |
| 0.1 | 0.2 | GO:0000912 | assembly of actomyosin apparatus involved in cytokinesis(GO:0000912) actomyosin contractile ring assembly(GO:0000915) actomyosin contractile ring organization(GO:0044837) |
| 0.1 | 0.5 | GO:0002318 | myeloid progenitor cell differentiation(GO:0002318) |
| 0.1 | 0.2 | GO:0045041 | protein import into mitochondrial intermembrane space(GO:0045041) |
| 0.1 | 0.4 | GO:0000459 | exonucleolytic trimming involved in rRNA processing(GO:0000459) exonucleolytic trimming to generate mature 3'-end of 5.8S rRNA from tricistronic rRNA transcript (SSU-rRNA, 5.8S rRNA, LSU-rRNA)(GO:0000467) |
| 0.1 | 0.3 | GO:0035093 | spermatogenesis, exchange of chromosomal proteins(GO:0035093) |
| 0.1 | 0.2 | GO:1903251 | multi-ciliated epithelial cell differentiation(GO:1903251) |
| 0.0 | 0.3 | GO:0090154 | positive regulation of sphingolipid biosynthetic process(GO:0090154) positive regulation of ceramide biosynthetic process(GO:2000304) |
| 0.0 | 0.3 | GO:0035469 | determination of pancreatic left/right asymmetry(GO:0035469) |
| 0.0 | 0.2 | GO:2000327 | positive regulation of ligand-dependent nuclear receptor transcription coactivator activity(GO:2000327) |
| 0.0 | 0.2 | GO:0019918 | peptidyl-arginine methylation, to symmetrical-dimethyl arginine(GO:0019918) |
| 0.0 | 0.1 | GO:2000845 | positive regulation of testosterone secretion(GO:2000845) |
| 0.0 | 0.4 | GO:0098734 | macromolecule depalmitoylation(GO:0098734) |
| 0.0 | 0.1 | GO:0006532 | aspartate biosynthetic process(GO:0006532) |
| 0.0 | 0.2 | GO:1903575 | cornified envelope assembly(GO:1903575) |
| 0.0 | 0.2 | GO:0008050 | female courtship behavior(GO:0008050) |
| 0.0 | 0.3 | GO:0015886 | heme transport(GO:0015886) |
| 0.0 | 0.3 | GO:0031914 | negative regulation of synaptic plasticity(GO:0031914) |
| 0.0 | 0.8 | GO:0097120 | receptor localization to synapse(GO:0097120) |
| 0.0 | 0.2 | GO:0080154 | regulation of fertilization(GO:0080154) |
| 0.0 | 0.8 | GO:0071218 | cellular response to misfolded protein(GO:0071218) |
| 0.0 | 0.2 | GO:0097332 | response to antipsychotic drug(GO:0097332) |
| 0.0 | 0.2 | GO:1904732 | regulation of electron carrier activity(GO:1904732) |
| 0.0 | 0.5 | GO:0070050 | neuron cellular homeostasis(GO:0070050) |
| 0.0 | 0.3 | GO:0010668 | ectodermal cell differentiation(GO:0010668) |
| 0.0 | 0.2 | GO:0035735 | intraciliary transport involved in cilium morphogenesis(GO:0035735) |
| 0.0 | 0.1 | GO:0042769 | DNA damage response, detection of DNA damage(GO:0042769) |
| 0.0 | 0.1 | GO:1905076 | regulation of interleukin-17 secretion(GO:1905076) negative regulation of interleukin-17 secretion(GO:1905077) |
| 0.0 | 0.1 | GO:1902953 | endoplasmic reticulum membrane organization(GO:0090158) positive regulation of ER to Golgi vesicle-mediated transport(GO:1902953) |
| 0.0 | 0.1 | GO:0051594 | detection of carbohydrate stimulus(GO:0009730) detection of hexose stimulus(GO:0009732) detection of monosaccharide stimulus(GO:0034287) detection of glucose(GO:0051594) |
| 0.0 | 0.2 | GO:0034773 | histone H4-K20 trimethylation(GO:0034773) |
| 0.0 | 0.1 | GO:0001834 | trophectodermal cell proliferation(GO:0001834) |
| 0.0 | 0.4 | GO:0044458 | motile cilium assembly(GO:0044458) |
| 0.0 | 0.1 | GO:1902202 | regulation of hepatocyte growth factor receptor signaling pathway(GO:1902202) negative regulation of PERK-mediated unfolded protein response(GO:1903898) |
| 0.0 | 0.1 | GO:0071733 | regulation of primitive erythrocyte differentiation(GO:0010725) transcriptional activation by promoter-enhancer looping(GO:0071733) gene looping(GO:0090202) dsDNA loop formation(GO:0090579) |
| 0.0 | 0.3 | GO:0051013 | microtubule severing(GO:0051013) |
| 0.0 | 0.1 | GO:0090038 | negative regulation of protein kinase C signaling(GO:0090038) |
| 0.0 | 0.2 | GO:1901503 | ether lipid biosynthetic process(GO:0008611) glycerol ether biosynthetic process(GO:0046504) ether biosynthetic process(GO:1901503) |
| 0.0 | 0.1 | GO:0018095 | protein polyglutamylation(GO:0018095) |
| 0.0 | 0.2 | GO:2000210 | positive regulation of anoikis(GO:2000210) |
| 0.0 | 0.2 | GO:0042256 | mature ribosome assembly(GO:0042256) |
| 0.0 | 0.1 | GO:0048669 | somite specification(GO:0001757) collateral sprouting in absence of injury(GO:0048669) |
| 0.0 | 0.1 | GO:1903070 | negative regulation of ER-associated ubiquitin-dependent protein catabolic process(GO:1903070) |
| 0.0 | 0.2 | GO:2000480 | negative regulation of cAMP-dependent protein kinase activity(GO:2000480) |
| 0.0 | 0.1 | GO:0061641 | CENP-A containing nucleosome assembly(GO:0034080) CENP-A containing chromatin organization(GO:0061641) |
| 0.0 | 0.1 | GO:1990401 | regulation of branching involved in salivary gland morphogenesis by epithelial-mesenchymal signaling(GO:0060683) embryonic lung development(GO:1990401) |
| 0.0 | 0.2 | GO:0090232 | positive regulation of spindle checkpoint(GO:0090232) positive regulation of mitotic cell cycle spindle assembly checkpoint(GO:0090267) |
| 0.0 | 0.1 | GO:0035610 | protein side chain deglutamylation(GO:0035610) |
| 0.0 | 0.0 | GO:1990790 | response to glial cell derived neurotrophic factor(GO:1990790) cellular response to glial cell derived neurotrophic factor(GO:1990792) |
| 0.0 | 0.1 | GO:0006048 | UDP-N-acetylglucosamine biosynthetic process(GO:0006048) |
| 0.0 | 0.2 | GO:0090083 | regulation of inclusion body assembly(GO:0090083) |
| 0.0 | 0.1 | GO:0071579 | regulation of zinc ion transport(GO:0071579) |
| 0.0 | 0.1 | GO:0042663 | regulation of endodermal cell fate specification(GO:0042663) |
| 0.0 | 0.1 | GO:0032264 | IMP salvage(GO:0032264) |
| 0.0 | 0.1 | GO:0097106 | postsynaptic density organization(GO:0097106) |
| 0.0 | 0.4 | GO:0042026 | protein refolding(GO:0042026) |
| 0.0 | 0.1 | GO:0006420 | arginyl-tRNA aminoacylation(GO:0006420) |
| 0.0 | 0.1 | GO:0021769 | orbitofrontal cortex development(GO:0021769) |
| 0.0 | 0.0 | GO:0060392 | negative regulation of SMAD protein import into nucleus(GO:0060392) |
| 0.0 | 0.1 | GO:1902569 | regulation of activation of JAK2 kinase activity(GO:0010534) activation of JAK2 kinase activity(GO:0042977) negative regulation of activation of JAK2 kinase activity(GO:1902569) |
| 0.0 | 0.0 | GO:1904457 | positive regulation of neuronal action potential(GO:1904457) |
| 0.0 | 0.3 | GO:0006474 | N-terminal protein amino acid acetylation(GO:0006474) |
| 0.0 | 0.1 | GO:0071318 | cellular response to ATP(GO:0071318) |
| 0.0 | 0.0 | GO:0098759 | response to interleukin-8(GO:0098758) cellular response to interleukin-8(GO:0098759) |
| 0.0 | 0.1 | GO:1903912 | negative regulation of endoplasmic reticulum stress-induced eIF2 alpha phosphorylation(GO:1903912) |
| 0.0 | 0.2 | GO:0035814 | negative regulation of renal sodium excretion(GO:0035814) |
| 0.0 | 0.2 | GO:0042407 | cristae formation(GO:0042407) |
| 0.0 | 0.1 | GO:0072553 | terminal button organization(GO:0072553) |
| 0.0 | 0.1 | GO:2000035 | regulation of stem cell division(GO:2000035) |
| 0.0 | 0.3 | GO:0006359 | regulation of transcription from RNA polymerase III promoter(GO:0006359) |
| 0.0 | 0.0 | GO:0052572 | response to immune response of other organism involved in symbiotic interaction(GO:0052564) response to host immune response(GO:0052572) |
| 0.0 | 0.3 | GO:0045063 | T-helper 1 cell differentiation(GO:0045063) |
| 0.0 | 0.1 | GO:0039526 | suppression by virus of host apoptotic process(GO:0019050) modulation by virus of host apoptotic process(GO:0039526) |
| 0.0 | 0.0 | GO:0021873 | forebrain neuroblast division(GO:0021873) |
| 0.0 | 0.1 | GO:0045719 | negative regulation of glycogen biosynthetic process(GO:0045719) |
| 0.0 | 0.0 | GO:0036066 | protein O-linked fucosylation(GO:0036066) |
| 0.0 | 0.1 | GO:1902856 | negative regulation of nonmotile primary cilium assembly(GO:1902856) |
| 0.0 | 0.1 | GO:0090168 | Golgi reassembly(GO:0090168) |
| 0.0 | 0.1 | GO:1901386 | negative regulation of voltage-gated calcium channel activity(GO:1901386) |
| 0.0 | 0.4 | GO:0050482 | arachidonic acid secretion(GO:0050482) arachidonate transport(GO:1903963) |
| 0.0 | 0.0 | GO:1903413 | cellular response to bile acid(GO:1903413) |
| 0.0 | 0.1 | GO:2000680 | regulation of rubidium ion transport(GO:2000680) |
| 0.0 | 0.1 | GO:1901621 | negative regulation of smoothened signaling pathway involved in dorsal/ventral neural tube patterning(GO:1901621) |
| 0.0 | 0.4 | GO:0010107 | potassium ion import(GO:0010107) |
| 0.0 | 0.3 | GO:0071625 | vocalization behavior(GO:0071625) |
| 0.0 | 0.4 | GO:0046839 | phospholipid dephosphorylation(GO:0046839) |
| 0.0 | 0.2 | GO:0031167 | rRNA methylation(GO:0031167) |
| 0.0 | 0.3 | GO:0003301 | physiological muscle hypertrophy(GO:0003298) physiological cardiac muscle hypertrophy(GO:0003301) cell growth involved in cardiac muscle cell development(GO:0061049) |
| 0.0 | 0.0 | GO:0010751 | regulation of arginine metabolic process(GO:0000821) negative regulation of nitric oxide mediated signal transduction(GO:0010751) negative regulation of cellular amino acid metabolic process(GO:0045763) |
| 0.0 | 0.2 | GO:0006895 | Golgi to endosome transport(GO:0006895) |
| 0.0 | 0.1 | GO:0031145 | anaphase-promoting complex-dependent catabolic process(GO:0031145) |
Gene overrepresentation in cellular component category:
| Log-likelihood per target | Total log-likelihood | Term | Description |
|---|---|---|---|
| 0.2 | 0.9 | GO:1990716 | axonemal central apparatus(GO:1990716) |
| 0.1 | 0.4 | GO:0016939 | kinesin II complex(GO:0016939) |
| 0.0 | 0.2 | GO:0098536 | deuterosome(GO:0098536) |
| 0.0 | 0.3 | GO:0000137 | Golgi cis cisterna(GO:0000137) |
| 0.0 | 0.2 | GO:0097149 | centralspindlin complex(GO:0097149) |
| 0.0 | 2.0 | GO:0030286 | dynein complex(GO:0030286) |
| 0.0 | 0.9 | GO:0097228 | sperm principal piece(GO:0097228) |
| 0.0 | 0.6 | GO:0001741 | XY body(GO:0001741) |
| 0.0 | 0.3 | GO:0043020 | NADPH oxidase complex(GO:0043020) |
| 0.0 | 0.7 | GO:0010369 | chromocenter(GO:0010369) |
| 0.0 | 0.2 | GO:0030991 | intraciliary transport particle A(GO:0030991) |
| 0.0 | 0.2 | GO:0061617 | MICOS complex(GO:0061617) |
| 0.0 | 0.2 | GO:0005818 | astral microtubule(GO:0000235) aster(GO:0005818) |
| 0.0 | 1.1 | GO:0060077 | inhibitory synapse(GO:0060077) |
| 0.0 | 0.2 | GO:0005862 | muscle thin filament tropomyosin(GO:0005862) |
| 0.0 | 0.1 | GO:0070847 | core mediator complex(GO:0070847) |
| 0.0 | 0.1 | GO:0097487 | multivesicular body, internal vesicle(GO:0097487) |
| 0.0 | 0.0 | GO:0044316 | cone cell pedicle(GO:0044316) |
| 0.0 | 0.4 | GO:0044292 | dendrite terminus(GO:0044292) |
| 0.0 | 0.2 | GO:0034663 | endoplasmic reticulum chaperone complex(GO:0034663) |
| 0.0 | 0.1 | GO:0035867 | alphav-beta3 integrin-IGF-1-IGF1R complex(GO:0035867) |
| 0.0 | 0.1 | GO:0030121 | AP-1 adaptor complex(GO:0030121) |
| 0.0 | 0.7 | GO:0035869 | ciliary transition zone(GO:0035869) |
| 0.0 | 0.4 | GO:0097546 | ciliary base(GO:0097546) |
| 0.0 | 0.1 | GO:0035061 | interchromatin granule(GO:0035061) |
| 0.0 | 0.2 | GO:0002199 | zona pellucida receptor complex(GO:0002199) |
| 0.0 | 0.5 | GO:0000159 | protein phosphatase type 2A complex(GO:0000159) |
| 0.0 | 0.2 | GO:0031983 | vesicle lumen(GO:0031983) |
| 0.0 | 0.0 | GO:0099522 | region of cytosol(GO:0099522) postsynaptic cytosol(GO:0099524) |
| 0.0 | 0.1 | GO:0005797 | Golgi medial cisterna(GO:0005797) |
| 0.0 | 0.3 | GO:0090545 | NuRD complex(GO:0016581) CHD-type complex(GO:0090545) |
| 0.0 | 0.3 | GO:0032279 | asymmetric synapse(GO:0032279) |
| 0.0 | 0.1 | GO:0001739 | sex chromatin(GO:0001739) |
| 0.0 | 0.3 | GO:0070822 | Sin3-type complex(GO:0070822) |
| 0.0 | 0.1 | GO:0031592 | centrosomal corona(GO:0031592) |
| 0.0 | 0.1 | GO:0097443 | sorting endosome(GO:0097443) |
| 0.0 | 0.3 | GO:0034451 | centriolar satellite(GO:0034451) |
| 0.0 | 0.0 | GO:1990423 | RZZ complex(GO:1990423) |
| 0.0 | 0.2 | GO:0008250 | oligosaccharyltransferase complex(GO:0008250) |
| 0.0 | 0.0 | GO:0032021 | NELF complex(GO:0032021) |
| 0.0 | 0.3 | GO:0031304 | intrinsic component of mitochondrial inner membrane(GO:0031304) integral component of mitochondrial inner membrane(GO:0031305) |
| 0.0 | 0.1 | GO:0097539 | ciliary transition fiber(GO:0097539) |
| 0.0 | 0.0 | GO:0031417 | NatC complex(GO:0031417) |
| 0.0 | 0.1 | GO:0090571 | RNA polymerase II transcription repressor complex(GO:0090571) |
| 0.0 | 0.1 | GO:0005869 | dynactin complex(GO:0005869) |
Gene overrepresentation in molecular function category:
| Log-likelihood per target | Total log-likelihood | Term | Description |
|---|---|---|---|
| 0.2 | 0.5 | GO:0004731 | purine nucleobase binding(GO:0002060) purine-nucleoside phosphorylase activity(GO:0004731) |
| 0.1 | 0.6 | GO:0045504 | dynein heavy chain binding(GO:0045504) |
| 0.1 | 0.3 | GO:0061628 | H3K27me3 modified histone binding(GO:0061628) |
| 0.1 | 0.3 | GO:0000995 | transcription factor activity, core RNA polymerase III binding(GO:0000995) TFIIIC-class transcription factor binding(GO:0001156) |
| 0.1 | 0.7 | GO:0045505 | dynein intermediate chain binding(GO:0045505) |
| 0.1 | 0.2 | GO:0042799 | histone methyltransferase activity (H4-K20 specific)(GO:0042799) |
| 0.1 | 0.2 | GO:1990189 | peptide-serine-N-acetyltransferase activity(GO:1990189) |
| 0.1 | 0.3 | GO:0016907 | G-protein coupled acetylcholine receptor activity(GO:0016907) |
| 0.1 | 0.4 | GO:0008474 | palmitoyl-(protein) hydrolase activity(GO:0008474) palmitoyl hydrolase activity(GO:0098599) |
| 0.1 | 0.2 | GO:0000179 | rRNA (adenine-N6,N6-)-dimethyltransferase activity(GO:0000179) |
| 0.0 | 0.2 | GO:0008321 | Ral guanyl-nucleotide exchange factor activity(GO:0008321) |
| 0.0 | 0.2 | GO:0035243 | protein-arginine omega-N symmetric methyltransferase activity(GO:0035243) |
| 0.0 | 0.2 | GO:0050833 | pyruvate transmembrane transporter activity(GO:0050833) |
| 0.0 | 0.1 | GO:0004069 | L-aspartate:2-oxoglutarate aminotransferase activity(GO:0004069) |
| 0.0 | 0.9 | GO:0001222 | transcription corepressor binding(GO:0001222) |
| 0.0 | 0.1 | GO:0070548 | L-glutamine aminotransferase activity(GO:0070548) |
| 0.0 | 0.2 | GO:0019784 | NEDD8-specific protease activity(GO:0019784) |
| 0.0 | 0.4 | GO:0047498 | calcium-dependent phospholipase A2 activity(GO:0047498) |
| 0.0 | 0.4 | GO:0008140 | cAMP response element binding protein binding(GO:0008140) |
| 0.0 | 0.2 | GO:0034618 | arginine binding(GO:0034618) |
| 0.0 | 0.4 | GO:0070016 | armadillo repeat domain binding(GO:0070016) |
| 0.0 | 0.1 | GO:0008569 | ATP-dependent microtubule motor activity, minus-end-directed(GO:0008569) |
| 0.0 | 0.3 | GO:0004767 | sphingomyelin phosphodiesterase activity(GO:0004767) |
| 0.0 | 0.3 | GO:0015232 | heme transporter activity(GO:0015232) |
| 0.0 | 0.2 | GO:0070568 | guanylyltransferase activity(GO:0070568) |
| 0.0 | 0.4 | GO:0042577 | lipid phosphatase activity(GO:0042577) |
| 0.0 | 0.3 | GO:0047134 | protein-disulfide reductase activity(GO:0047134) |
| 0.0 | 0.3 | GO:0000774 | adenyl-nucleotide exchange factor activity(GO:0000774) |
| 0.0 | 0.3 | GO:0016176 | superoxide-generating NADPH oxidase activator activity(GO:0016176) |
| 0.0 | 0.4 | GO:0015216 | purine nucleotide transmembrane transporter activity(GO:0015216) |
| 0.0 | 0.1 | GO:0002046 | opsin binding(GO:0002046) |
| 0.0 | 0.4 | GO:0004862 | cAMP-dependent protein kinase inhibitor activity(GO:0004862) |
| 0.0 | 0.9 | GO:0043015 | gamma-tubulin binding(GO:0043015) |
| 0.0 | 0.1 | GO:0003876 | AMP deaminase activity(GO:0003876) adenosine-phosphate deaminase activity(GO:0047623) |
| 0.0 | 0.1 | GO:0008158 | hedgehog receptor activity(GO:0008158) |
| 0.0 | 0.5 | GO:0005229 | intracellular calcium activated chloride channel activity(GO:0005229) |
| 0.0 | 0.1 | GO:0004814 | arginine-tRNA ligase activity(GO:0004814) |
| 0.0 | 0.2 | GO:0016413 | O-acetyltransferase activity(GO:0016413) |
| 0.0 | 0.2 | GO:0004887 | thyroid hormone receptor activity(GO:0004887) |
| 0.0 | 0.3 | GO:0005092 | GDP-dissociation inhibitor activity(GO:0005092) |
| 0.0 | 0.1 | GO:0046790 | virion binding(GO:0046790) |
| 0.0 | 0.3 | GO:0008568 | microtubule-severing ATPase activity(GO:0008568) |
| 0.0 | 0.1 | GO:0004784 | superoxide dismutase activity(GO:0004784) oxidoreductase activity, acting on superoxide radicals as acceptor(GO:0016721) |
| 0.0 | 0.1 | GO:0071532 | ankyrin repeat binding(GO:0071532) |
| 0.0 | 0.1 | GO:1904288 | BAT3 complex binding(GO:1904288) |
| 0.0 | 0.2 | GO:0043515 | kinetochore binding(GO:0043515) |
| 0.0 | 0.4 | GO:0005242 | inward rectifier potassium channel activity(GO:0005242) |
| 0.0 | 0.4 | GO:0001671 | ATPase activator activity(GO:0001671) |
| 0.0 | 0.2 | GO:0004576 | oligosaccharyl transferase activity(GO:0004576) dolichyl-diphosphooligosaccharide-protein glycotransferase activity(GO:0004579) |
| 0.0 | 0.3 | GO:0070840 | dynein complex binding(GO:0070840) |
| 0.0 | 0.0 | GO:0004918 | interleukin-8 receptor activity(GO:0004918) |
| 0.0 | 0.2 | GO:0008821 | crossover junction endodeoxyribonuclease activity(GO:0008821) |
| 0.0 | 0.6 | GO:0046875 | ephrin receptor binding(GO:0046875) |
| 0.0 | 0.1 | GO:0008865 | glucokinase activity(GO:0004340) hexokinase activity(GO:0004396) fructokinase activity(GO:0008865) mannokinase activity(GO:0019158) |
| 0.0 | 0.4 | GO:0016709 | oxidoreductase activity, acting on paired donors, with incorporation or reduction of molecular oxygen, NAD(P)H as one donor, and incorporation of one atom of oxygen(GO:0016709) |
| 0.0 | 0.1 | GO:0001055 | RNA polymerase II activity(GO:0001055) |
| 0.0 | 0.9 | GO:0003777 | microtubule motor activity(GO:0003777) |
| 0.0 | 0.4 | GO:0048020 | CCR chemokine receptor binding(GO:0048020) |
| 0.0 | 0.1 | GO:0050816 | phosphothreonine binding(GO:0050816) |
| 0.0 | 0.8 | GO:0070491 | repressing transcription factor binding(GO:0070491) |
| 0.0 | 0.4 | GO:0098632 | protein binding involved in cell-cell adhesion(GO:0098632) |
| 0.0 | 0.1 | GO:0031821 | G-protein coupled serotonin receptor binding(GO:0031821) |
| 0.0 | 0.1 | GO:0031419 | cobalamin binding(GO:0031419) |
| 0.0 | 0.2 | GO:0032183 | SUMO binding(GO:0032183) |
Gene overrepresentation in curated gene sets: canonical pathways category:
| Log-likelihood per target | Total log-likelihood | Term | Description |
|---|---|---|---|
| 0.0 | 0.5 | SA REG CASCADE OF CYCLIN EXPR | Expression of cyclins regulates progression through the cell cycle by activating cyclin-dependent kinases. |
| 0.0 | 0.0 | PID IL8 CXCR1 PATHWAY | IL8- and CXCR1-mediated signaling events |
| 0.0 | 0.9 | PID AURORA B PATHWAY | Aurora B signaling |
| 0.0 | 0.5 | PID CDC42 REG PATHWAY | Regulation of CDC42 activity |
| 0.0 | 0.4 | PID IGF1 PATHWAY | IGF1 pathway |
Gene overrepresentation in curated gene sets: REACTOME pathways category:
| Log-likelihood per target | Total log-likelihood | Term | Description |
|---|---|---|---|
| 0.1 | 0.8 | REACTOME NEF MEDIATED DOWNREGULATION OF MHC CLASS I COMPLEX CELL SURFACE EXPRESSION | Genes involved in Nef mediated downregulation of MHC class I complex cell surface expression |
| 0.1 | 0.5 | REACTOME PURINE CATABOLISM | Genes involved in Purine catabolism |
| 0.0 | 0.5 | REACTOME CYCLIN A B1 ASSOCIATED EVENTS DURING G2 M TRANSITION | Genes involved in Cyclin A/B1 associated events during G2/M transition |
| 0.0 | 0.6 | REACTOME ACTIVATION OF BH3 ONLY PROTEINS | Genes involved in Activation of BH3-only proteins |
| 0.0 | 0.2 | REACTOME TRAFFICKING AND PROCESSING OF ENDOSOMAL TLR | Genes involved in Trafficking and processing of endosomal TLR |
| 0.0 | 0.3 | REACTOME CRMPS IN SEMA3A SIGNALING | Genes involved in CRMPs in Sema3A signaling |
| 0.0 | 0.3 | REACTOME OTHER SEMAPHORIN INTERACTIONS | Genes involved in Other semaphorin interactions |
| 0.0 | 0.4 | REACTOME INHIBITION OF VOLTAGE GATED CA2 CHANNELS VIA GBETA GAMMA SUBUNITS | Genes involved in Inhibition of voltage gated Ca2+ channels via Gbeta/gamma subunits |
| 0.0 | 0.2 | REACTOME ACTIVATION OF RAC | Genes involved in Activation of Rac |
| 0.0 | 0.5 | REACTOME NRAGE SIGNALS DEATH THROUGH JNK | Genes involved in NRAGE signals death through JNK |