Project
GSE49485: Hypoxia transcriptome sequencing of rat brain.
Navigation
Downloads
Results for Rarb
Z-value: 0.24
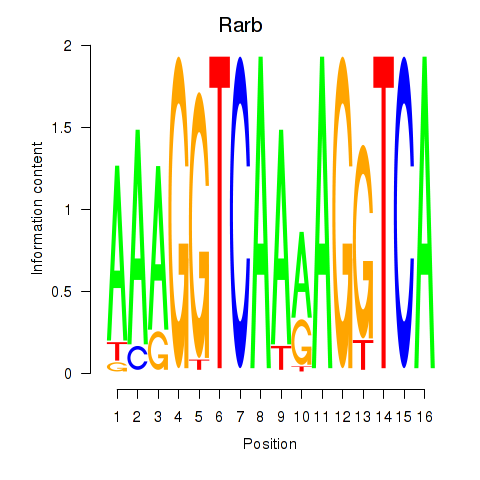
Motif logo
Transcription factors associated with Rarb
| Gene Symbol | Gene ID | Gene Info |
|---|---|---|
|
Rarb
|
ENSRNOG00000024061 | retinoic acid receptor, beta |
Activity-expression correlation:
| Gene | Promoter | Pearson corr. coef. | P-value | Plot |
|---|---|---|---|---|
| Rarb | rn6_v1_chr15_+_10120206_10120206 | 0.39 | 5.1e-01 | Click! |
Activity profile of Rarb motif
Sorted Z-values of Rarb motif
| Promoter | Log-likelihood | Transcript | Gene | Gene Info |
|---|---|---|---|---|
| chr2_+_260997497 | 0.13 |
ENSRNOT00000012638
|
Erich3
|
glutamate-rich 3 |
| chr1_-_245817809 | 0.08 |
ENSRNOT00000080607
|
AABR07006672.1
|
|
| chr2_+_187990242 | 0.08 |
ENSRNOT00000092819
|
Arhgef2
|
Rho/Rac guanine nucleotide exchange factor 2 |
| chr9_-_10369937 | 0.06 |
ENSRNOT00000071228
ENSRNOT00000072911 ENSRNOT00000072009 |
Ranbp3
|
RAN binding protein 3 |
| chr10_+_56381813 | 0.05 |
ENSRNOT00000019687
|
Zbtb4
|
zinc finger and BTB domain containing 4 |
| chr10_+_70627401 | 0.05 |
ENSRNOT00000076897
|
Rasl10b
|
RAS-like, family 10, member B |
| chr16_-_20460959 | 0.04 |
ENSRNOT00000026457
|
Pde4c
|
phosphodiesterase 4C |
| chr4_-_7342410 | 0.04 |
ENSRNOT00000013058
|
Nos3
|
nitric oxide synthase 3 |
| chr3_-_72113680 | 0.03 |
ENSRNOT00000009708
|
Zdhhc5
|
zinc finger, DHHC-type containing 5 |
| chr18_+_30885789 | 0.03 |
ENSRNOT00000044434
|
Pcdhga9
|
protocadherin gamma subfamily A, 9 |
| chr17_-_78499881 | 0.02 |
ENSRNOT00000079260
|
Fam107b
|
family with sequence similarity 107, member B |
| chr4_-_59014416 | 0.02 |
ENSRNOT00000049811
|
RGD1561636
|
similar to 60S ribosomal protein L38 |
| chr18_+_61261418 | 0.02 |
ENSRNOT00000064250
|
Zfp532
|
zinc finger protein 532 |
| chr9_+_97355924 | 0.02 |
ENSRNOT00000026558
|
Ackr3
|
atypical chemokine receptor 3 |
| chr13_+_110511668 | 0.02 |
ENSRNOT00000006235
|
Nek2
|
NIMA-related kinase 2 |
| chr5_-_166924136 | 0.01 |
ENSRNOT00000085251
|
Spsb1
|
splA/ryanodine receptor domain and SOCS box containing 1 |
| chr1_+_264741911 | 0.01 |
ENSRNOT00000019956
|
Sema4g
|
semaphorin 4G |
| chr11_-_64968437 | 0.01 |
ENSRNOT00000059541
|
Cox17
|
COX17 cytochrome c oxidase copper chaperone |
| chr16_+_20110148 | 0.01 |
ENSRNOT00000080146
ENSRNOT00000025312 |
Jak3
|
Janus kinase 3 |
| chr19_-_38344845 | 0.01 |
ENSRNOT00000072666
|
AABR07043748.1
|
|
| chr2_-_88314254 | 0.01 |
ENSRNOT00000038546
|
Car13
|
carbonic anhydrase 13 |
| chr1_+_247110216 | 0.00 |
ENSRNOT00000016000
|
Cdc37l1
|
cell division cycle 37-like 1 |
Network of associatons between targets according to the STRING database.

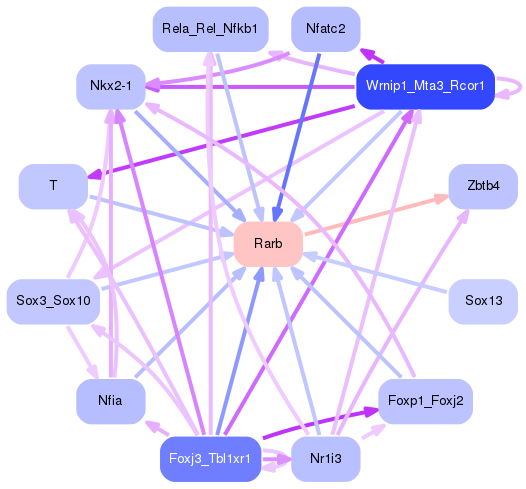
First level regulatory network of Rarb
Gene Ontology Analysis
Gene overrepresentation in biological process category:
| Log-likelihood per target | Total log-likelihood | Term | Description |
|---|---|---|---|
| 0.0 | 0.1 | GO:0046604 | positive regulation of mitotic centrosome separation(GO:0046604) |
| 0.0 | 0.1 | GO:0071802 | negative regulation of podosome assembly(GO:0071802) |
| 0.0 | 0.1 | GO:0003050 | regulation of systemic arterial blood pressure by atrial natriuretic peptide(GO:0003050) |