Project
GSE49485: Hypoxia transcriptome sequencing of rat brain.
Navigation
Downloads
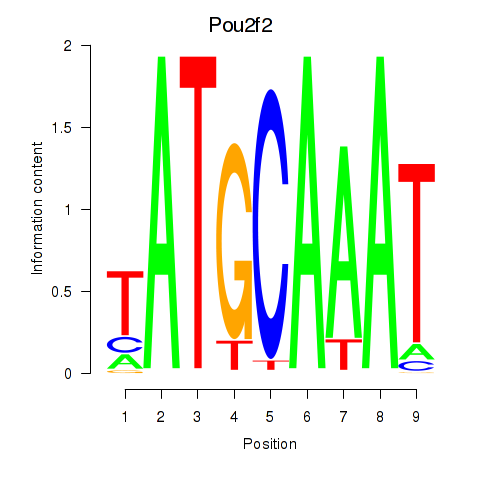
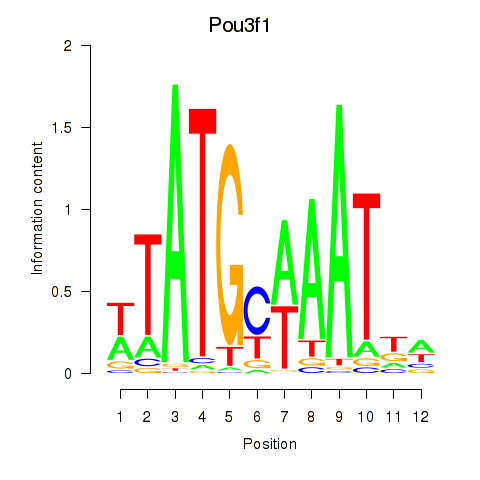
Results for Pou2f2_Pou3f1
Z-value: 1.19
Motif logo
Transcription factors associated with Pou2f2_Pou3f1
| Gene Symbol | Gene ID | Gene Info |
|---|---|---|
|
Pou2f2
|
ENSRNOG00000055650 | POU class 2 homeobox 2 |
|
Pou3f1
|
ENSRNOG00000047686 | Pou3f1 |
Activity-expression correlation:
| Gene | Promoter | Pearson corr. coef. | P-value | Plot |
|---|---|---|---|---|
| Pou2f2 | rn6_v1_chr1_-_82004538_82004538 | -0.37 | 5.4e-01 | Click! |
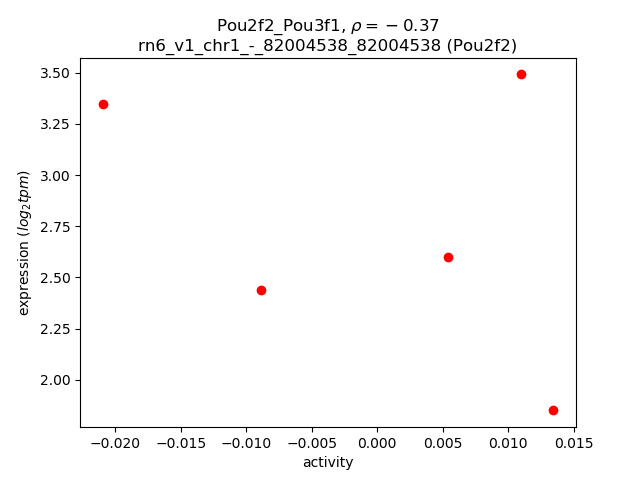
Activity profile of Pou2f2_Pou3f1 motif
Sorted Z-values of Pou2f2_Pou3f1 motif
| Promoter | Log-likelihood | Transcript | Gene | Gene Info |
|---|---|---|---|---|
| chr1_+_81372650 | 1.64 |
ENSRNOT00000088829
|
Zfp428
|
zinc finger protein 428 |
| chr1_-_25839198 | 1.19 |
ENSRNOT00000090388
ENSRNOT00000092757 ENSRNOT00000042072 |
Trdn
|
triadin |
| chr2_-_198360678 | 1.09 |
ENSRNOT00000051917
|
Hist2h2ac
|
histone cluster 2 H2A family member c |
| chr2_-_198382190 | 1.03 |
ENSRNOT00000044268
|
Hist2h2aa2
|
histone cluster 2, H2aa2 |
| chr2_+_198388809 | 1.01 |
ENSRNOT00000083087
|
Hist2h2aa3
|
histone cluster 2, H2aa3 |
| chr17_-_44527801 | 1.00 |
ENSRNOT00000089643
|
Hist1h2bk
|
histone cluster 1 H2B family member k |
| chr16_-_20486707 | 0.86 |
ENSRNOT00000026470
|
Jund
|
JunD proto-oncogene, AP-1 transcription factor subunit |
| chr3_-_9037942 | 0.83 |
ENSRNOT00000036770
|
Ier5l
|
immediate early response 5-like |
| chr10_-_45297385 | 0.74 |
ENSRNOT00000041187
|
Hist3h2bb
|
histone cluster 3 H2B family member b |
| chr2_+_198418691 | 0.64 |
ENSRNOT00000089409
|
Hist1h2bk
|
histone cluster 1, H2bk |
| chr5_+_145257714 | 0.54 |
ENSRNOT00000019214
|
Dlgap3
|
DLG associated protein 3 |
| chr1_+_238222521 | 0.52 |
ENSRNOT00000024000
|
Aldh1a1
|
aldehyde dehydrogenase 1 family, member A1 |
| chr2_+_198359754 | 0.51 |
ENSRNOT00000048582
|
Hist2h2ab
|
histone cluster 2 H2A family member b |
| chr4_-_97784842 | 0.46 |
ENSRNOT00000007698
|
Gadd45a
|
growth arrest and DNA-damage-inducible, alpha |
| chr10_+_45289741 | 0.43 |
ENSRNOT00000066190
|
Hist3h2ba
|
histone cluster 3, H2ba |
| chr10_+_77537340 | 0.39 |
ENSRNOT00000003297
|
Tmem100
|
transmembrane protein 100 |
| chr17_+_43632397 | 0.38 |
ENSRNOT00000013790
|
Hist1h2ah
|
histone cluster 1, H2ah |
| chr17_-_13393243 | 0.37 |
ENSRNOT00000018252
|
Gadd45g
|
growth arrest and DNA-damage-inducible, gamma |
| chr7_+_3133506 | 0.36 |
ENSRNOT00000049972
|
Pmel
|
premelanosome protein |
| chr17_-_43689311 | 0.32 |
ENSRNOT00000028779
|
Hist1h2bcl1
|
histone cluster 1, H2bc-like 1 |
| chr10_-_108196217 | 0.31 |
ENSRNOT00000075440
|
Cbx4
|
chromobox 4 |
| chr20_-_22459025 | 0.31 |
ENSRNOT00000000792
|
Egr2
|
early growth response 2 |
| chr20_+_44680449 | 0.28 |
ENSRNOT00000000728
|
Traf3ip2
|
Traf3 interacting protein 2 |
| chr1_-_88690534 | 0.28 |
ENSRNOT00000072570
|
Ovol3
|
ovo-like zinc finger 3 |
| chr5_+_16526058 | 0.26 |
ENSRNOT00000011130
|
Lyn
|
LYN proto-oncogene, Src family tyrosine kinase |
| chr16_-_19942343 | 0.25 |
ENSRNOT00000087162
ENSRNOT00000091906 |
Bst2
|
bone marrow stromal cell antigen 2 |
| chr7_-_107634287 | 0.25 |
ENSRNOT00000093672
ENSRNOT00000087116 |
Sla
|
src-like adaptor |
| chr4_-_157266018 | 0.24 |
ENSRNOT00000019570
|
LOC100911713
|
protein C10-like |
| chr10_-_104575890 | 0.23 |
ENSRNOT00000050223
|
H3f3b
|
H3 histone family member 3B |
| chr3_+_2396143 | 0.23 |
ENSRNOT00000012388
|
Nrarp
|
Notch-regulated ankyrin repeat protein |
| chr4_-_31730386 | 0.22 |
ENSRNOT00000013817
|
Slc25a13
|
solute carrier family 25 member 13 |
| chr3_+_150910398 | 0.21 |
ENSRNOT00000055310
|
Tp53inp2
|
tumor protein p53 inducible nuclear protein 2 |
| chr7_+_12619774 | 0.20 |
ENSRNOT00000015257
|
Med16
|
mediator complex subunit 16 |
| chr2_-_25235275 | 0.20 |
ENSRNOT00000061580
|
F2rl1
|
F2R like trypsin receptor 1 |
| chr11_-_33003021 | 0.19 |
ENSRNOT00000084134
|
Runx1
|
runt-related transcription factor 1 |
| chr10_+_55927223 | 0.18 |
ENSRNOT00000011523
|
Kcnab3
|
potassium voltage-gated channel subfamily A regulatory beta subunit 3 |
| chr17_+_43627930 | 0.17 |
ENSRNOT00000081719
|
LOC102549061
|
histone H2B type 1-N-like |
| chr17_+_44758460 | 0.17 |
ENSRNOT00000089436
|
Hist1h2an
|
histone cluster 1, H2an |
| chr19_-_43596801 | 0.17 |
ENSRNOT00000025625
|
Fa2h
|
fatty acid 2-hydroxylase |
| chr20_+_9173127 | 0.16 |
ENSRNOT00000088409
|
AABR07044520.1
|
|
| chr2_+_122877286 | 0.16 |
ENSRNOT00000033080
|
Arse
|
arylsulfatase E |
| chr2_-_89310946 | 0.16 |
ENSRNOT00000015195
|
Ralyl
|
RALY RNA binding protein-like |
| chrX_-_111887906 | 0.16 |
ENSRNOT00000085118
|
Tsc22d3
|
TSC22 domain family, member 3 |
| chr1_+_144070754 | 0.15 |
ENSRNOT00000079989
|
Sh3gl3
|
SH3 domain-containing GRB2-like 3 |
| chr1_+_91038886 | 0.15 |
ENSRNOT00000041301
|
Ovol3
|
ovo-like zinc finger 3 |
| chr4_+_157125998 | 0.14 |
ENSRNOT00000078349
|
C1r
|
complement C1r |
| chr15_+_17775692 | 0.14 |
ENSRNOT00000061169
|
LOC361016
|
similar to RIKEN cDNA 4933406L09 |
| chr8_+_64364741 | 0.14 |
ENSRNOT00000082840
|
Celf6
|
CUGBP, Elav-like family member 6 |
| chr8_+_22947152 | 0.14 |
ENSRNOT00000016790
|
Plppr2
|
phospholipid phosphatase related 2 |
| chr17_+_15749978 | 0.14 |
ENSRNOT00000067311
|
Fgd3
|
FYVE, RhoGEF and PH domain containing 3 |
| chr1_-_179010257 | 0.14 |
ENSRNOT00000017199
|
Rras2
|
related RAS viral (r-ras) oncogene homolog 2 |
| chr18_-_12640716 | 0.14 |
ENSRNOT00000020697
|
Klhl14
|
kelch-like family member 14 |
| chr17_-_43627629 | 0.13 |
ENSRNOT00000022965
|
Hist1h2af
|
histone cluster 1, H2af |
| chrX_+_6791136 | 0.12 |
ENSRNOT00000003984
|
LOC100909913
|
norrin-like |
| chr17_+_44520537 | 0.12 |
ENSRNOT00000077985
|
hist1h2ail2
|
histone cluster 1, H2ai-like2 |
| chr6_-_55524436 | 0.12 |
ENSRNOT00000006752
|
Tspan13
|
tetraspanin 13 |
| chr16_-_21017163 | 0.12 |
ENSRNOT00000027661
|
Mef2b
|
myocyte enhancer factor 2B |
| chr2_+_182723854 | 0.12 |
ENSRNOT00000012658
|
Sfrp2
|
secreted frizzled-related protein 2 |
| chr3_+_170550314 | 0.11 |
ENSRNOT00000006991
|
Tfap2c
|
transcription factor AP-2 gamma |
| chr15_-_62200837 | 0.11 |
ENSRNOT00000017599
|
Pcdh8
|
protocadherin 8 |
| chr2_+_222214885 | 0.11 |
ENSRNOT00000055723
|
Dpyd
|
dihydropyrimidine dehydrogenase |
| chr15_+_33596301 | 0.11 |
ENSRNOT00000022563
|
Il25
|
interleukin 25 |
| chr1_-_87937516 | 0.11 |
ENSRNOT00000087522
|
Eif3k
|
eukaryotic translation initiation factor 3, subunit K |
| chr18_+_44737154 | 0.11 |
ENSRNOT00000021972
|
Tnfaip8
|
TNF alpha induced protein 8 |
| chr6_-_125723732 | 0.10 |
ENSRNOT00000084815
|
Fbln5
|
fibulin 5 |
| chr11_-_62067655 | 0.10 |
ENSRNOT00000093382
|
Zbtb20
|
zinc finger and BTB domain containing 20 |
| chr1_-_218100272 | 0.10 |
ENSRNOT00000028411
ENSRNOT00000088588 |
Ccnd1
|
cyclin D1 |
| chr17_-_44748188 | 0.10 |
ENSRNOT00000081970
|
LOC103690190
|
histone H2A type 1-E |
| chr1_-_57327379 | 0.09 |
ENSRNOT00000080429
|
Dll1
|
delta like canonical Notch ligand 1 |
| chr15_-_14737704 | 0.09 |
ENSRNOT00000011307
|
Synpr
|
synaptoporin |
| chr10_-_50402616 | 0.09 |
ENSRNOT00000004546
|
Hs3st3b1
|
heparan sulfate-glucosamine 3-sulfotransferase 3B1 |
| chr19_-_48196748 | 0.09 |
ENSRNOT00000016577
|
Maf
|
MAF bZIP transcription factor |
| chr18_-_36893797 | 0.09 |
ENSRNOT00000043544
|
Gpr151
|
G protein-coupled receptor 151 |
| chr17_+_23116661 | 0.08 |
ENSRNOT00000067374
|
Nedd9
|
neural precursor cell expressed, developmentally down-regulated 9 |
| chr5_+_157434481 | 0.08 |
ENSRNOT00000088556
|
Tmco4
|
transmembrane and coiled-coil domains 4 |
| chr12_+_38160464 | 0.08 |
ENSRNOT00000032249
|
Hcar2
|
hydroxycarboxylic acid receptor 2 |
| chr7_+_11238630 | 0.08 |
ENSRNOT00000028002
ENSRNOT00000086194 |
Hmg20b
|
high mobility group 20 B |
| chr1_-_89303968 | 0.08 |
ENSRNOT00000056714
|
Ffar3
|
free fatty acid receptor 3 |
| chr7_+_97559841 | 0.08 |
ENSRNOT00000007326
|
Zhx2
|
zinc fingers and homeoboxes 2 |
| chr3_-_94833406 | 0.08 |
ENSRNOT00000049695
|
RGD1560017
|
similar to Ac2-210 |
| chr9_-_18371856 | 0.08 |
ENSRNOT00000027293
|
Supt3h
|
SPT3 homolog, SAGA and STAGA complex component |
| chr19_-_43955747 | 0.08 |
ENSRNOT00000058891
ENSRNOT00000041815 |
Bcar1
|
BCAR1, Cas family scaffolding protein |
| chr6_-_125723944 | 0.08 |
ENSRNOT00000007004
|
Fbln5
|
fibulin 5 |
| chr3_+_79918969 | 0.07 |
ENSRNOT00000016306
|
Spi1
|
Spi-1 proto-oncogene |
| chr11_-_60679555 | 0.07 |
ENSRNOT00000059735
|
Ccdc80
|
coiled-coil domain containing 80 |
| chr2_+_198360998 | 0.07 |
ENSRNOT00000046129
|
Hist2h2be
|
histone cluster 2, H2be |
| chr19_+_12097632 | 0.07 |
ENSRNOT00000049452
|
Ces5a
|
carboxylesterase 5A |
| chr9_-_119321500 | 0.07 |
ENSRNOT00000048125
|
Myl12b
|
myosin light chain 12B |
| chr17_-_44520240 | 0.07 |
ENSRNOT00000086538
|
Hist1h2bh
|
histone cluster 1 H2B family member h |
| chr11_-_32550539 | 0.07 |
ENSRNOT00000002715
|
Rcan1
|
regulator of calcineurin 1 |
| chr2_-_139528162 | 0.06 |
ENSRNOT00000014317
|
Slc7a11
|
solute carrier family 7 member 11 |
| chr2_-_204254699 | 0.06 |
ENSRNOT00000021487
|
Mab21l3
|
mab-21 like 3 |
| chr6_-_75075795 | 0.06 |
ENSRNOT00000007219
|
Egln3
|
egl-9 family hypoxia-inducible factor 3 |
| chr9_-_54457753 | 0.06 |
ENSRNOT00000020032
|
Stat1
|
signal transducer and activator of transcription 1 |
| chr2_+_174542667 | 0.06 |
ENSRNOT00000076793
|
Fstl5
|
follistatin-like 5 |
| chr10_+_95642640 | 0.06 |
ENSRNOT00000029782
|
RGD1359290
|
Ribosomal_L22 domain containing protein RGD1359290 |
| chr1_+_23409408 | 0.05 |
ENSRNOT00000022362
|
Eya4
|
EYA transcriptional coactivator and phosphatase 4 |
| chr1_+_225140863 | 0.05 |
ENSRNOT00000027141
|
Mta2
|
metastasis associated 1 family, member 2 |
| chr4_-_28437676 | 0.05 |
ENSRNOT00000012995
|
Hepacam2
|
HEPACAM family member 2 |
| chr5_+_172367398 | 0.05 |
ENSRNOT00000019028
|
Pank4
|
pantothenate kinase 4 |
| chr2_+_187893368 | 0.05 |
ENSRNOT00000092031
|
Mex3a
|
mex-3 RNA binding family member A |
| chr15_+_12827707 | 0.05 |
ENSRNOT00000012452
|
Fezf2
|
Fez family zinc finger 2 |
| chrX_-_62690806 | 0.05 |
ENSRNOT00000018147
|
Pola1
|
DNA polymerase alpha 1, catalytic subunit |
| chr7_+_123381077 | 0.05 |
ENSRNOT00000082603
ENSRNOT00000056041 |
Srebf2
|
sterol regulatory element binding transcription factor 2 |
| chrX_+_28593405 | 0.05 |
ENSRNOT00000071708
|
Tmsb4x
|
thymosin beta 4, X-linked |
| chrX_-_15467875 | 0.05 |
ENSRNOT00000011207
|
Pim2
|
Pim-2 proto-oncogene, serine/threonine kinase |
| chr4_+_147333056 | 0.05 |
ENSRNOT00000012137
|
Pparg
|
peroxisome proliferator-activated receptor gamma |
| chr10_-_56211891 | 0.05 |
ENSRNOT00000015076
|
Atp1b2
|
ATPase Na+/K+ transporting subunit beta 2 |
| chr1_+_84293102 | 0.05 |
ENSRNOT00000028468
|
Sertad1
|
SERTA domain containing 1 |
| chr1_-_264172729 | 0.05 |
ENSRNOT00000018447
|
Scd
|
stearoyl-CoA desaturase |
| chr15_+_43905099 | 0.05 |
ENSRNOT00000016568
|
Ebf2
|
early B-cell factor 2 |
| chr4_-_173640684 | 0.05 |
ENSRNOT00000010728
|
Rergl
|
RERG like |
| chr10_+_84167331 | 0.05 |
ENSRNOT00000010965
|
Hoxb4
|
homeo box B4 |
| chr5_+_154489590 | 0.04 |
ENSRNOT00000035788
|
Id3
|
inhibitor of DNA binding 3, HLH protein |
| chr4_-_82173207 | 0.04 |
ENSRNOT00000074167
|
Hoxa5
|
homeo box A5 |
| chr10_-_87335823 | 0.04 |
ENSRNOT00000079297
|
Krt12
|
keratin 12 |
| chr7_-_134722215 | 0.04 |
ENSRNOT00000036750
|
Prickle1
|
prickle planar cell polarity protein 1 |
| chr4_-_161850875 | 0.04 |
ENSRNOT00000009467
|
Pzp
|
pregnancy-zone protein |
| chr10_-_86004096 | 0.04 |
ENSRNOT00000091978
ENSRNOT00000066855 |
Stac2
|
SH3 and cysteine rich domain 2 |
| chr1_+_198210525 | 0.03 |
ENSRNOT00000026755
|
Ypel3
|
yippee-like 3 |
| chr17_-_44758170 | 0.03 |
ENSRNOT00000091176
|
Hist1h2bo
|
histone cluster 1 H2B family member o |
| chr7_+_144080614 | 0.03 |
ENSRNOT00000077687
|
Pcbp2
|
poly(rC) binding protein 2 |
| chr5_-_159336429 | 0.03 |
ENSRNOT00000009230
|
Padi3
|
peptidyl arginine deiminase 3 |
| chr13_+_56096834 | 0.03 |
ENSRNOT00000035129
|
Dennd1b
|
DENN domain containing 1B |
| chr1_+_214183724 | 0.03 |
ENSRNOT00000091150
|
Lrrc56
|
leucine rich repeat containing 56 |
| chr17_+_49714294 | 0.03 |
ENSRNOT00000018190
|
Rala
|
RAS like proto-oncogene A |
| chr6_-_138662365 | 0.03 |
ENSRNOT00000066209
ENSRNOT00000084892 |
Ighm
|
immunoglobulin heavy constant mu |
| chr6_+_124123228 | 0.03 |
ENSRNOT00000005329
|
Psmc1
|
proteasome 26S subunit, ATPase 1 |
| chr8_-_59239954 | 0.03 |
ENSRNOT00000016104
|
Acsbg1
|
acyl-CoA synthetase bubblegum family member 1 |
| chr20_-_13657943 | 0.03 |
ENSRNOT00000032290
|
Vpreb3
|
pre-B lymphocyte 3 |
| chr5_-_28130803 | 0.03 |
ENSRNOT00000093186
|
Slc26a7
|
solute carrier family 26 member 7 |
| chr7_-_57816621 | 0.03 |
ENSRNOT00000090748
|
AABR07057150.1
|
|
| chr1_-_222178725 | 0.03 |
ENSRNOT00000028697
|
Esrra
|
estrogen related receptor, alpha |
| chr17_-_43422846 | 0.03 |
ENSRNOT00000050526
|
Hist1h2aa
|
histone cluster 1 H2A family member a |
| chr2_-_250778269 | 0.03 |
ENSRNOT00000085670
ENSRNOT00000083535 ENSRNOT00000017824 |
Clca5
|
chloride channel accessory 5 |
| chrX_+_104684676 | 0.03 |
ENSRNOT00000083229
|
Tnmd
|
tenomodulin |
| chr2_+_264704769 | 0.02 |
ENSRNOT00000012667
|
Depdc1
|
DEP domain containing 1 |
| chr6_-_138632159 | 0.02 |
ENSRNOT00000082921
ENSRNOT00000040702 |
Ighm
|
immunoglobulin heavy constant mu |
| chr1_-_33275540 | 0.02 |
ENSRNOT00000017019
|
Irx2
|
iroquois homeobox 2 |
| chr17_+_49417067 | 0.02 |
ENSRNOT00000090024
|
Pou6f2
|
POU domain, class 6, transcription factor 2 |
| chr8_+_32188617 | 0.02 |
ENSRNOT00000081145
|
Zbtb44
|
zinc finger and BTB domain containing 44 |
| chr10_-_25847994 | 0.02 |
ENSRNOT00000082076
|
Mat2b
|
methionine adenosyltransferase 2B |
| chr3_-_3951025 | 0.02 |
ENSRNOT00000026212
|
Notch1
|
notch 1 |
| chr5_-_28131133 | 0.02 |
ENSRNOT00000067331
|
Slc26a7
|
solute carrier family 26 member 7 |
| chr3_+_93495106 | 0.02 |
ENSRNOT00000029922
ENSRNOT00000085760 |
Abtb2
|
ankyrin repeat and BTB domain containing 2 |
| chr1_+_267689328 | 0.02 |
ENSRNOT00000077738
|
Cfap58
|
cilia and flagella associated protein 58 |
| chr9_-_86103158 | 0.01 |
ENSRNOT00000021528
|
Cul3
|
cullin 3 |
| chr16_-_64745207 | 0.01 |
ENSRNOT00000032467
|
Tti2
|
TELO2 interacting protein 2 |
| chr2_-_250805445 | 0.01 |
ENSRNOT00000055362
|
Clca4l
|
chloride channel calcium activated 4-like |
| chr1_+_273854248 | 0.01 |
ENSRNOT00000044827
ENSRNOT00000017600 ENSRNOT00000086496 |
Add3
|
adducin 3 |
| chr13_-_52088780 | 0.01 |
ENSRNOT00000008754
|
Elf3
|
E74-like factor 3 |
| chr1_-_279277339 | 0.01 |
ENSRNOT00000023667
|
Gfra1
|
GDNF family receptor alpha 1 |
| chr16_-_20939545 | 0.01 |
ENSRNOT00000027457
|
Sugp2
|
SURP and G patch domain containing 2 |
| chr4_-_62840357 | 0.01 |
ENSRNOT00000059892
|
Slc13a4
|
solute carrier family 13 member 4 |
| chr3_-_18244535 | 0.01 |
ENSRNOT00000040689
|
AABR07051626.1
|
|
| chr20_-_5723902 | 0.01 |
ENSRNOT00000036871
|
Uqcc2
|
ubiquinol-cytochrome c reductase complex assembly factor 2 |
| chr1_+_85485289 | 0.00 |
ENSRNOT00000026182
|
Dll3
|
delta like canonical Notch ligand 3 |
| chr18_-_70924708 | 0.00 |
ENSRNOT00000025257
|
Lipg
|
lipase G, endothelial type |
| chr4_-_183424449 | 0.00 |
ENSRNOT00000071930
|
Fam60a
|
family with sequence similarity 60, member A |
| chr4_-_95970666 | 0.00 |
ENSRNOT00000008826
|
Hpgds
|
hematopoietic prostaglandin D synthase |
| chr17_+_44738643 | 0.00 |
ENSRNOT00000087643
|
LOC100910554
|
histone H2A type 1-like |
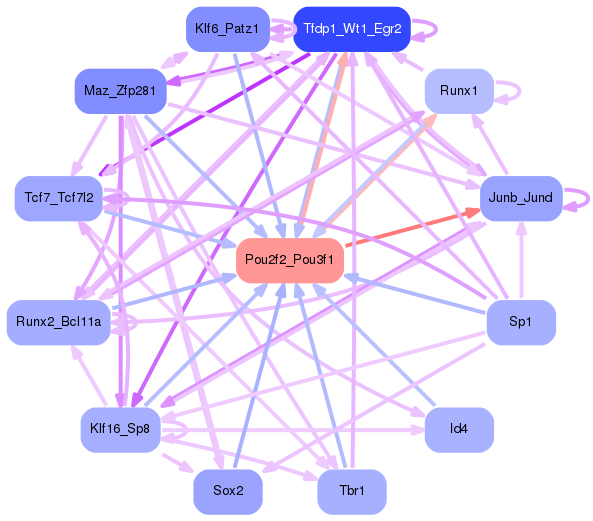
Network of associatons between targets according to the STRING database.

First level regulatory network of Pou2f2_Pou3f1
Gene Ontology Analysis
Gene overrepresentation in biological process category:
| Log-likelihood per target | Total log-likelihood | Term | Description |
|---|---|---|---|
| 0.4 | 1.2 | GO:0090158 | endoplasmic reticulum membrane organization(GO:0090158) |
| 0.1 | 0.3 | GO:0034136 | negative regulation of toll-like receptor 2 signaling pathway(GO:0034136) |
| 0.1 | 1.7 | GO:0002227 | innate immune response in mucosa(GO:0002227) |
| 0.1 | 0.4 | GO:0048023 | positive regulation of melanin biosynthetic process(GO:0048023) positive regulation of secondary metabolite biosynthetic process(GO:1900378) |
| 0.1 | 0.3 | GO:0002731 | negative regulation of dendritic cell cytokine production(GO:0002731) regulation of intracellular transport of viral material(GO:1901252) |
| 0.1 | 0.2 | GO:0031508 | pericentric heterochromatin assembly(GO:0031508) |
| 0.1 | 0.3 | GO:0021593 | rhombomere morphogenesis(GO:0021593) |
| 0.1 | 0.5 | GO:0060842 | arterial endothelial cell differentiation(GO:0060842) |
| 0.1 | 0.2 | GO:1902568 | negative regulation of toll-like receptor 3 signaling pathway(GO:0034140) regulation of eosinophil degranulation(GO:0043309) positive regulation of eosinophil degranulation(GO:0043311) regulation of neutrophil mediated cytotoxicity(GO:0070948) regulation of neutrophil mediated killing of symbiont cell(GO:0070949) positive regulation of renin secretion into blood stream(GO:1900135) positive regulation of eosinophil activation(GO:1902568) |
| 0.1 | 0.5 | GO:0042905 | optic cup morphogenesis involved in camera-type eye development(GO:0002072) 9-cis-retinoic acid biosynthetic process(GO:0042904) 9-cis-retinoic acid metabolic process(GO:0042905) |
| 0.1 | 0.2 | GO:2000872 | positive regulation of progesterone secretion(GO:2000872) |
| 0.1 | 0.2 | GO:0043490 | malate-aspartate shuttle(GO:0043490) |
| 0.1 | 4.6 | GO:0006342 | chromatin silencing(GO:0006342) |
| 0.0 | 0.8 | GO:0000185 | activation of MAPKKK activity(GO:0000185) |
| 0.0 | 0.1 | GO:2000040 | regulation of midbrain dopaminergic neuron differentiation(GO:1904956) regulation of planar cell polarity pathway involved in axis elongation(GO:2000040) negative regulation of planar cell polarity pathway involved in axis elongation(GO:2000041) |
| 0.0 | 0.1 | GO:0006214 | thymidine catabolic process(GO:0006214) pyrimidine deoxyribonucleoside catabolic process(GO:0046127) |
| 0.0 | 0.9 | GO:0002076 | osteoblast development(GO:0002076) |
| 0.0 | 0.1 | GO:0044027 | hypermethylation of CpG island(GO:0044027) |
| 0.0 | 0.2 | GO:0014807 | regulation of somitogenesis(GO:0014807) |
| 0.0 | 0.1 | GO:0060750 | epithelial cell proliferation involved in mammary gland duct elongation(GO:0060750) |
| 0.0 | 0.2 | GO:0032286 | central nervous system myelin maintenance(GO:0032286) |
| 0.0 | 0.1 | GO:0002877 | regulation of acute inflammatory response to non-antigenic stimulus(GO:0002877) |
| 0.0 | 0.1 | GO:0090370 | negative regulation of cholesterol efflux(GO:0090370) |
| 0.0 | 0.1 | GO:0000320 | re-entry into mitotic cell cycle(GO:0000320) |
| 0.0 | 0.0 | GO:0061303 | cornea development in camera-type eye(GO:0061303) |
| 0.0 | 0.2 | GO:0016191 | synaptic vesicle uncoating(GO:0016191) |
| 0.0 | 0.1 | GO:1990839 | response to endothelin(GO:1990839) cellular response to endothelin(GO:1990859) |
| 0.0 | 0.1 | GO:0009624 | response to nematode(GO:0009624) eosinophil differentiation(GO:0030222) |
| 0.0 | 1.6 | GO:0006334 | nucleosome assembly(GO:0006334) |
| 0.0 | 0.2 | GO:0048251 | elastic fiber assembly(GO:0048251) |
| 0.0 | 0.0 | GO:2000230 | negative regulation of pancreatic stellate cell proliferation(GO:2000230) |
| 0.0 | 0.0 | GO:0018101 | protein citrullination(GO:0018101) histone citrullination(GO:0036414) |
| 0.0 | 0.3 | GO:0002230 | positive regulation of defense response to virus by host(GO:0002230) |
| 0.0 | 0.2 | GO:0070236 | negative regulation of activation-induced cell death of T cells(GO:0070236) |
| 0.0 | 0.0 | GO:1903966 | tarsal gland development(GO:1903699) monounsaturated fatty acid metabolic process(GO:1903964) monounsaturated fatty acid biosynthetic process(GO:1903966) |
| 0.0 | 0.0 | GO:0060764 | cell-cell signaling involved in mammary gland development(GO:0060764) |
| 0.0 | 0.1 | GO:0034240 | negative regulation of macrophage fusion(GO:0034240) |
| 0.0 | 0.1 | GO:0006477 | protein sulfation(GO:0006477) |
| 0.0 | 0.1 | GO:0021797 | forebrain anterior/posterior pattern specification(GO:0021797) |
| 0.0 | 0.1 | GO:0006272 | leading strand elongation(GO:0006272) |
| 0.0 | 0.0 | GO:1903288 | positive regulation of potassium ion import(GO:1903288) |
| 0.0 | 0.1 | GO:0070163 | adiponectin secretion(GO:0070162) regulation of adiponectin secretion(GO:0070163) |
Gene overrepresentation in cellular component category:
| Log-likelihood per target | Total log-likelihood | Term | Description |
|---|---|---|---|
| 0.4 | 1.2 | GO:0014701 | junctional sarcoplasmic reticulum membrane(GO:0014701) |
| 0.2 | 0.9 | GO:0035976 | AP1 complex(GO:0035976) |
| 0.1 | 8.3 | GO:0000786 | nucleosome(GO:0000786) |
| 0.1 | 0.3 | GO:0034666 | integrin alpha2-beta1 complex(GO:0034666) |
| 0.1 | 0.4 | GO:0032585 | multivesicular body membrane(GO:0032585) |
| 0.0 | 0.2 | GO:0071953 | elastic fiber(GO:0071953) |
| 0.0 | 0.5 | GO:0017146 | NMDA selective glutamate receptor complex(GO:0017146) |
| 0.0 | 0.3 | GO:0035102 | PRC1 complex(GO:0035102) |
| 0.0 | 0.1 | GO:0032937 | SREBP-SCAP-Insig complex(GO:0032937) |
| 0.0 | 0.2 | GO:0031143 | pseudopodium(GO:0031143) |
| 0.0 | 0.1 | GO:0033290 | eukaryotic 43S preinitiation complex(GO:0016282) eukaryotic 48S preinitiation complex(GO:0033290) |
Gene overrepresentation in molecular function category:
| Log-likelihood per target | Total log-likelihood | Term | Description |
|---|---|---|---|
| 0.2 | 0.5 | GO:0018479 | benzaldehyde dehydrogenase (NAD+) activity(GO:0018479) |
| 0.0 | 0.2 | GO:0015057 | thrombin receptor activity(GO:0015057) |
| 0.0 | 0.2 | GO:0015183 | L-aspartate transmembrane transporter activity(GO:0015183) |
| 0.0 | 0.1 | GO:0017113 | dihydrouracil dehydrogenase (NAD+) activity(GO:0004159) dihydropyrimidine dehydrogenase (NADP+) activity(GO:0017113) |
| 0.0 | 0.9 | GO:0016922 | ligand-dependent nuclear receptor binding(GO:0016922) |
| 0.0 | 0.2 | GO:0030375 | thyroid hormone receptor activator activity(GO:0010861) thyroid hormone receptor coactivator activity(GO:0030375) |
| 0.0 | 0.3 | GO:0043208 | glycosphingolipid binding(GO:0043208) |
| 0.0 | 0.2 | GO:0043426 | MRF binding(GO:0043426) |
| 0.0 | 0.2 | GO:0004065 | arylsulfatase activity(GO:0004065) |
| 0.0 | 0.3 | GO:0008191 | metalloendopeptidase inhibitor activity(GO:0008191) |
| 0.0 | 0.1 | GO:0005294 | neutral L-amino acid secondary active transmembrane transporter activity(GO:0005294) |
| 0.0 | 0.1 | GO:0061133 | endopeptidase activator activity(GO:0061133) |
| 0.0 | 0.1 | GO:0008597 | calcium-dependent protein serine/threonine phosphatase regulator activity(GO:0008597) |
| 0.0 | 0.3 | GO:0019789 | SUMO transferase activity(GO:0019789) |
| 0.0 | 0.3 | GO:0071837 | HMG box domain binding(GO:0071837) |
| 0.0 | 0.1 | GO:0008467 | [heparan sulfate]-glucosamine 3-sulfotransferase 1 activity(GO:0008467) |
| 0.0 | 0.0 | GO:0004768 | stearoyl-CoA 9-desaturase activity(GO:0004768) palmitoyl-CoA 9-desaturase activity(GO:0032896) |
| 0.0 | 0.5 | GO:0001540 | beta-amyloid binding(GO:0001540) |
| 0.0 | 9.0 | GO:0046982 | protein heterodimerization activity(GO:0046982) |
| 0.0 | 0.1 | GO:0004594 | pantothenate kinase activity(GO:0004594) |
| 0.0 | 0.1 | GO:0030957 | Tat protein binding(GO:0030957) |
| 0.0 | 0.0 | GO:0004668 | protein-arginine deiminase activity(GO:0004668) |
Gene overrepresentation in curated gene sets: canonical pathways category:
| Log-likelihood per target | Total log-likelihood | Term | Description |
|---|---|---|---|
| 0.0 | 0.8 | PID P38 MKK3 6PATHWAY | p38 MAPK signaling pathway |
| 0.0 | 1.0 | PID FRA PATHWAY | Validated transcriptional targets of AP1 family members Fra1 and Fra2 |
| 0.0 | 0.3 | PID IL5 PATHWAY | IL5-mediated signaling events |
Gene overrepresentation in curated gene sets: REACTOME pathways category:
| Log-likelihood per target | Total log-likelihood | Term | Description |
|---|---|---|---|
| 0.2 | 4.9 | REACTOME RNA POL I PROMOTER OPENING | Genes involved in RNA Polymerase I Promoter Opening |
| 0.1 | 0.5 | REACTOME ETHANOL OXIDATION | Genes involved in Ethanol oxidation |
| 0.0 | 0.3 | REACTOME PECAM1 INTERACTIONS | Genes involved in PECAM1 interactions |
| 0.0 | 0.2 | REACTOME THE ACTIVATION OF ARYLSULFATASES | Genes involved in The activation of arylsulfatases |