Project
GSE49485: Hypoxia transcriptome sequencing of rat brain.
Navigation
Downloads
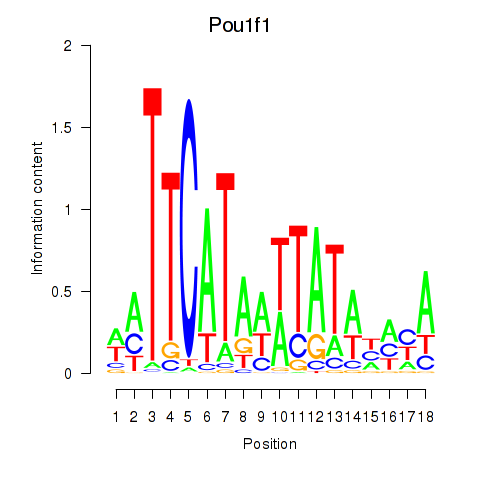
Results for Pou1f1
Z-value: 1.76
Motif logo
Transcription factors associated with Pou1f1
| Gene Symbol | Gene ID | Gene Info |
|---|---|---|
|
Pou1f1
|
ENSRNOG00000000715 | POU class 1 homeobox 1 |
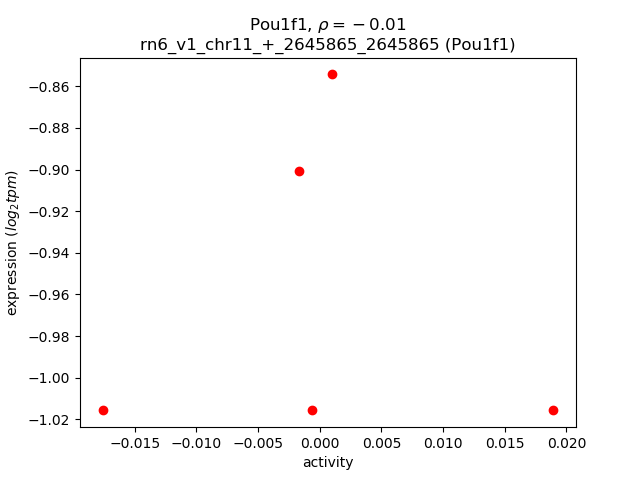
Activity-expression correlation:
| Gene | Promoter | Pearson corr. coef. | P-value | Plot |
|---|---|---|---|---|
| Pou1f1 | rn6_v1_chr11_+_2645865_2645865 | -0.01 | 9.9e-01 | Click! |
Activity profile of Pou1f1 motif
Sorted Z-values of Pou1f1 motif
| Promoter | Log-likelihood | Transcript | Gene | Gene Info |
|---|---|---|---|---|
| chr10_+_14136883 | 2.51 |
ENSRNOT00000082295
|
AC115181.1
|
|
| chr2_+_149899836 | 1.41 |
ENSRNOT00000086481
|
RGD1560324
|
similar to hypothetical protein C130079G13 |
| chr9_-_20528879 | 1.02 |
ENSRNOT00000085293
|
AABR07066871.3
|
|
| chr5_+_6373583 | 0.96 |
ENSRNOT00000084749
|
AABR07046778.1
|
|
| chr15_+_36865548 | 0.95 |
ENSRNOT00000076460
|
Parp4
|
poly (ADP-ribose) polymerase family, member 4 |
| chr7_-_116106368 | 0.87 |
ENSRNOT00000035678
|
Ly6k
|
lymphocyte antigen 6 complex, locus K |
| chr4_+_22859622 | 0.82 |
ENSRNOT00000073501
ENSRNOT00000068410 |
Adam22
|
ADAM metallopeptidase domain 22 |
| chrM_+_11736 | 0.73 |
ENSRNOT00000048767
|
Mt-nd5
|
mitochondrially encoded NADH dehydrogenase 5 |
| chr7_+_2300434 | 0.69 |
ENSRNOT00000071785
|
AABR07055413.1
|
|
| chr8_+_29714285 | 0.66 |
ENSRNOT00000042890
|
Opcml
|
opioid binding protein/cell adhesion molecule-like |
| chrM_+_9870 | 0.66 |
ENSRNOT00000044582
|
Mt-nd4l
|
mitochondrially encoded NADH 4L dehydrogenase |
| chr6_+_7793735 | 0.64 |
ENSRNOT00000090724
ENSRNOT00000006832 |
Plekhh2
|
pleckstrin homology, MyTH4 and FERM domain containing H2 |
| chr4_-_176026133 | 0.62 |
ENSRNOT00000043374
ENSRNOT00000046598 |
Slco1a4
|
solute carrier organic anion transporter family, member 1a4 |
| chr11_+_82052774 | 0.60 |
ENSRNOT00000062045
|
AABR07034637.1
|
|
| chr1_-_155955173 | 0.59 |
ENSRNOT00000079345
|
AABR07004776.1
|
|
| chr8_+_71547468 | 0.57 |
ENSRNOT00000042369
|
Csnk1g1
|
casein kinase 1, gamma 1 |
| chr8_-_96516975 | 0.57 |
ENSRNOT00000067996
|
RGD1560775
|
similar to RIKEN cDNA 4930579C12 gene |
| chr7_-_9976367 | 0.55 |
ENSRNOT00000044241
|
Zfp347
|
zinc finger protein 347 |
| chr3_+_95614562 | 0.55 |
ENSRNOT00000079990
|
AABR07053179.1
|
|
| chr6_-_87427153 | 0.55 |
ENSRNOT00000071999
|
AABR07064622.1
|
|
| chr8_+_130366775 | 0.55 |
ENSRNOT00000071152
|
Nktr
|
natural killer cell triggering receptor |
| chr1_+_66959610 | 0.55 |
ENSRNOT00000072122
ENSRNOT00000045994 |
Vom1r48
|
vomeronasal 1 receptor 48 |
| chr14_+_6298872 | 0.54 |
ENSRNOT00000065071
|
Znf442
|
zinc finger protein 442 |
| chr5_+_4393472 | 0.53 |
ENSRNOT00000082717
|
Eya1
|
EYA transcriptional coactivator and phosphatase 1 |
| chr5_+_58505500 | 0.52 |
ENSRNOT00000043216
|
Unc13b
|
unc-13 homolog B |
| chr8_+_52729003 | 0.52 |
ENSRNOT00000081738
|
Nxpe4
|
neurexophilin and PC-esterase domain family, member 4 |
| chr1_-_66237501 | 0.51 |
ENSRNOT00000073006
|
Zfp606
|
zinc finger protein 606 |
| chr3_-_71798531 | 0.51 |
ENSRNOT00000088170
|
Calcrl
|
calcitonin receptor like receptor |
| chrX_+_88298266 | 0.51 |
ENSRNOT00000041508
|
AABR07039936.1
|
|
| chr1_-_65681440 | 0.51 |
ENSRNOT00000026305
|
Zfp128
|
zinc finger protein 128 |
| chr2_-_167607919 | 0.51 |
ENSRNOT00000089083
|
AABR07011733.1
|
|
| chr7_-_80457816 | 0.51 |
ENSRNOT00000039430
|
AABR07057617.1
|
|
| chr7_+_15785410 | 0.50 |
ENSRNOT00000082664
ENSRNOT00000073235 |
Zfp955a
|
zinc finger protein 955A |
| chr1_+_228684136 | 0.50 |
ENSRNOT00000028608
|
Olr337
|
olfactory receptor 337 |
| chr3_-_66885085 | 0.49 |
ENSRNOT00000084299
ENSRNOT00000090547 |
Pde1a
|
phosphodiesterase 1A |
| chr16_+_39909270 | 0.49 |
ENSRNOT00000081994
|
Wdr17
|
WD repeat domain 17 |
| chrX_+_159081445 | 0.49 |
ENSRNOT00000056688
|
AABR07042542.1
|
|
| chr19_+_27603307 | 0.49 |
ENSRNOT00000074702
|
AABR07043347.1
|
|
| chrX_-_10031167 | 0.47 |
ENSRNOT00000060988
|
Gpr34
|
G protein-coupled receptor 34 |
| chr1_+_61522298 | 0.47 |
ENSRNOT00000029111
|
Zfp51
|
zinc finger protein 51 |
| chr9_+_73378057 | 0.46 |
ENSRNOT00000043627
ENSRNOT00000045766 ENSRNOT00000092445 ENSRNOT00000037974 |
Map2
|
microtubule-associated protein 2 |
| chrX_+_19854836 | 0.46 |
ENSRNOT00000075010
|
AABR07037395.2
|
|
| chr7_+_74350479 | 0.45 |
ENSRNOT00000089034
|
AABR07057495.1
|
|
| chr14_+_71542057 | 0.45 |
ENSRNOT00000082592
ENSRNOT00000083701 ENSRNOT00000084322 |
Prom1
|
prominin 1 |
| chr5_-_168120179 | 0.45 |
ENSRNOT00000093063
|
Per3
|
period circadian clock 3 |
| chr7_-_68512397 | 0.45 |
ENSRNOT00000058036
|
Slc16a7
|
solute carrier family 16 member 7 |
| chr6_-_76535517 | 0.44 |
ENSRNOT00000083857
|
Ralgapa1
|
Ral GTPase activating protein catalytic alpha subunit 1 |
| chr16_+_22979444 | 0.44 |
ENSRNOT00000017822
|
Csgalnact1
|
chondroitin sulfate N-acetylgalactosaminyltransferase 1 |
| chr11_+_66932614 | 0.43 |
ENSRNOT00000003189
|
Slc15a2
|
solute carrier family 15 member 2 |
| chr13_-_82129989 | 0.43 |
ENSRNOT00000078963
|
AC124874.1
|
|
| chr2_+_166475070 | 0.43 |
ENSRNOT00000071111
|
AABR07011700.1
|
|
| chr1_-_62316450 | 0.43 |
ENSRNOT00000079171
|
AABR07001926.3
|
|
| chr13_+_77602249 | 0.42 |
ENSRNOT00000003407
ENSRNOT00000076589 |
Tnr
|
tenascin R |
| chr8_+_82037977 | 0.42 |
ENSRNOT00000082288
|
Myo5a
|
myosin VA |
| chr4_+_168615890 | 0.42 |
ENSRNOT00000009324
|
Crebl2
|
cAMP responsive element binding protein-like 2 |
| chr14_+_42007312 | 0.42 |
ENSRNOT00000063985
|
Atp8a1
|
ATPase phospholipid transporting 8A1 |
| chr1_+_169145445 | 0.41 |
ENSRNOT00000034019
|
LOC499219
|
hypothetical protein LOC499219 |
| chr7_+_29029263 | 0.41 |
ENSRNOT00000007088
|
Sycp3
|
synaptonemal complex protein 3 |
| chr13_+_50103189 | 0.41 |
ENSRNOT00000004078
|
Atp2b4
|
ATPase plasma membrane Ca2+ transporting 4 |
| chr7_-_68549763 | 0.41 |
ENSRNOT00000078014
|
Slc16a7
|
solute carrier family 16 member 7 |
| chr9_-_95108739 | 0.41 |
ENSRNOT00000070819
|
Usp40
|
ubiquitin specific peptidase 40 |
| chr12_-_5490935 | 0.40 |
ENSRNOT00000050885
|
Zfp958
|
zinc finger protein 958 |
| chr7_+_23403891 | 0.40 |
ENSRNOT00000037918
|
Syn3
|
synapsin III |
| chr1_-_131585731 | 0.40 |
ENSRNOT00000075481
|
AABR07004232.1
|
|
| chr5_+_10125070 | 0.39 |
ENSRNOT00000085321
|
AABR07046866.1
|
|
| chr5_+_90818736 | 0.39 |
ENSRNOT00000093480
ENSRNOT00000009083 |
Kdm4c
|
lysine demethylase 4C |
| chr17_-_69862110 | 0.39 |
ENSRNOT00000058312
|
Akr1cl
|
aldo-keto reductase family 1, member C-like |
| chrX_-_157628237 | 0.38 |
ENSRNOT00000083549
|
Etd
|
embryonic testis differentiation |
| chr1_+_61786900 | 0.38 |
ENSRNOT00000090287
|
AABR07001905.1
|
|
| chr3_+_85544827 | 0.38 |
ENSRNOT00000051901
|
AABR07052953.1
|
|
| chr7_+_141642777 | 0.38 |
ENSRNOT00000079811
|
AABR07058884.2
|
|
| chr7_-_15821927 | 0.38 |
ENSRNOT00000050658
|
LOC691422
|
similar to zinc finger protein 101 |
| chr1_-_66212418 | 0.37 |
ENSRNOT00000026074
|
LOC691722
|
hypothetical protein LOC691722 |
| chr7_+_20262680 | 0.37 |
ENSRNOT00000046378
|
LOC300308
|
similar to hypothetical protein 4930509O22 |
| chr18_+_30487264 | 0.37 |
ENSRNOT00000040125
|
Pcdhb10
|
protocadherin beta 10 |
| chr2_-_117666683 | 0.37 |
ENSRNOT00000015479
|
AABR07009931.1
|
|
| chr1_+_11963836 | 0.36 |
ENSRNOT00000074325
|
AABR07000398.1
|
|
| chr10_+_53570989 | 0.36 |
ENSRNOT00000064764
ENSRNOT00000004516 |
Tmem220
|
transmembrane protein 220 |
| chr14_+_69800156 | 0.36 |
ENSRNOT00000072746
|
Lcorl
|
ligand dependent nuclear receptor corepressor-like |
| chr2_+_86891092 | 0.36 |
ENSRNOT00000077162
ENSRNOT00000083066 |
LOC100360380
|
zinc finger protein 457-like |
| chr9_+_61738471 | 0.36 |
ENSRNOT00000090305
|
AABR07067762.1
|
|
| chr1_-_235405831 | 0.36 |
ENSRNOT00000071578
|
AABR07006458.1
|
|
| chr18_+_56193978 | 0.35 |
ENSRNOT00000041533
ENSRNOT00000080177 |
Camk2a
|
calcium/calmodulin-dependent protein kinase II alpha |
| chr1_+_27476375 | 0.35 |
ENSRNOT00000047224
ENSRNOT00000075427 |
LOC102551716
|
sodium/potassium-transporting ATPase subunit beta-1-interacting protein 2-like |
| chr19_-_21970103 | 0.35 |
ENSRNOT00000074210
|
AABR07043115.1
|
|
| chr3_+_69549673 | 0.35 |
ENSRNOT00000043974
|
Zfp804a
|
zinc finger protein 804A |
| chr18_-_74485139 | 0.35 |
ENSRNOT00000022598
|
Slc14a1
|
solute carrier family 14 member 1 |
| chr2_-_220838905 | 0.34 |
ENSRNOT00000078914
|
AABR07013065.1
|
|
| chr4_-_16654811 | 0.34 |
ENSRNOT00000008637
|
Pclo
|
piccolo (presynaptic cytomatrix protein) |
| chr15_+_34328851 | 0.34 |
ENSRNOT00000026819
|
Tssk4
|
testis-specific serine kinase 4 |
| chr2_+_23289374 | 0.34 |
ENSRNOT00000090666
ENSRNOT00000032783 |
Dmgdh
|
dimethylglycine dehydrogenase |
| chr5_-_8864578 | 0.34 |
ENSRNOT00000008480
|
Cspp1
|
centrosome and spindle pole associated protein 1 |
| chr2_-_154508641 | 0.33 |
ENSRNOT00000065346
|
RGD1565059
|
similar to hypothetical protein E130311K13 |
| chr3_-_104504204 | 0.33 |
ENSRNOT00000049582
|
Ryr3
|
ryanodine receptor 3 |
| chr11_+_88699222 | 0.33 |
ENSRNOT00000084177
|
Fgd4
|
FYVE, RhoGEF and PH domain containing 4 |
| chr1_-_200548317 | 0.33 |
ENSRNOT00000088610
|
AABR07005806.1
|
|
| chr15_-_26175645 | 0.33 |
ENSRNOT00000020175
|
Slc35f4
|
solute carrier family 35, member F4 |
| chr3_+_134440195 | 0.33 |
ENSRNOT00000072928
|
AABR07054000.1
|
|
| chr10_-_91661558 | 0.32 |
ENSRNOT00000043156
|
AABR07030521.1
|
|
| chr5_-_9381214 | 0.32 |
ENSRNOT00000039237
|
RGD1561849
|
similar to RIKEN cDNA 3110035E14 |
| chr1_+_248402980 | 0.32 |
ENSRNOT00000043517
|
Chchd4
|
coiled-coil-helix-coiled-coil-helix domain containing 4 |
| chr18_-_399242 | 0.32 |
ENSRNOT00000045926
|
F8
|
coagulation factor VIII |
| chr10_+_67532030 | 0.32 |
ENSRNOT00000005428
|
Rhot1
|
ras homolog family member T1 |
| chrX_+_908044 | 0.32 |
ENSRNOT00000072087
|
Zfp300
|
zinc finger protein 300 |
| chr13_-_61591139 | 0.32 |
ENSRNOT00000005324
|
Rgs18
|
regulator of G-protein signaling 18 |
| chr3_-_55951584 | 0.32 |
ENSRNOT00000036585
|
Fastkd1
|
FAST kinase domains 1 |
| chr9_-_49448168 | 0.32 |
ENSRNOT00000059478
|
AABR07067499.1
|
|
| chr4_-_22425381 | 0.32 |
ENSRNOT00000011166
ENSRNOT00000037712 |
Abcb1a
|
ATP binding cassette subfamily B member 1A |
| chr8_-_123829749 | 0.32 |
ENSRNOT00000090467
|
AABR07071598.1
|
|
| chr11_-_71135493 | 0.32 |
ENSRNOT00000050535
|
Fyttd1
|
forty-two-three domain containing 1 |
| chr11_-_61287914 | 0.32 |
ENSRNOT00000086286
|
Spice1
|
spindle and centriole associated protein 1 |
| chr9_+_47281961 | 0.31 |
ENSRNOT00000065234
|
Slc9a4
|
solute carrier family 9 member A4 |
| chr1_+_73837944 | 0.31 |
ENSRNOT00000036413
|
Lair1
|
leukocyte-associated immunoglobulin-like receptor 1 |
| chr2_-_122756842 | 0.31 |
ENSRNOT00000080181
|
Ccdc144b
|
coiled-coil domain containing 144B |
| chr6_+_93563446 | 0.31 |
ENSRNOT00000050558
ENSRNOT00000011056 |
LOC690035
|
similar to Protein KIAA0586 |
| chr4_-_165456677 | 0.31 |
ENSRNOT00000082207
|
Klra2
|
killer cell lectin-like receptor, subfamily A, member 2 |
| chr11_+_42259761 | 0.31 |
ENSRNOT00000047310
|
Epha6
|
Eph receptor A6 |
| chr2_-_35104963 | 0.30 |
ENSRNOT00000018058
|
Rgs7bp
|
regulator of G-protein signaling 7-binding protein |
| chr6_+_135513650 | 0.30 |
ENSRNOT00000010676
|
Rcor1
|
REST corepressor 1 |
| chr8_-_49158971 | 0.30 |
ENSRNOT00000020573
|
Kmt2a
|
lysine methyltransferase 2A |
| chr3_-_48831417 | 0.30 |
ENSRNOT00000009920
ENSRNOT00000085246 |
Kcnh7
|
potassium voltage-gated channel subfamily H member 7 |
| chr7_+_15422479 | 0.30 |
ENSRNOT00000066520
|
Zfp563
|
zinc finger protein 563 |
| chr9_-_105655471 | 0.29 |
ENSRNOT00000014921
|
RGD1560925
|
similar to 2610034M16Rik protein |
| chr7_+_58419197 | 0.29 |
ENSRNOT00000085829
|
Zfc3h1
|
zinc finger, C3H1-type containing |
| chr4_-_16669368 | 0.29 |
ENSRNOT00000007608
|
Pclo
|
piccolo (presynaptic cytomatrix protein) |
| chrM_+_3904 | 0.29 |
ENSRNOT00000040993
|
Mt-nd2
|
mitochondrially encoded NADH dehydrogenase 2 |
| chr13_+_57243877 | 0.29 |
ENSRNOT00000083693
|
Kcnt2
|
potassium sodium-activated channel subfamily T member 2 |
| chr1_+_98627372 | 0.29 |
ENSRNOT00000030370
|
Dzf17
|
zinc finger protein 17 |
| chr1_+_84758233 | 0.29 |
ENSRNOT00000072734
|
AABR07002775.1
|
|
| chr2_-_149444548 | 0.29 |
ENSRNOT00000018600
|
P2ry12
|
purinergic receptor P2Y12 |
| chr4_+_102147211 | 0.29 |
ENSRNOT00000083239
|
AABR07060980.1
|
|
| chr5_+_141530211 | 0.29 |
ENSRNOT00000056546
|
4933427I04Rik
|
Riken cDNA 4933427I04 gene |
| chr14_+_39663421 | 0.29 |
ENSRNOT00000003197
|
Gabra2
|
gamma-aminobutyric acid type A receptor alpha2 subunit |
| chr20_-_26589209 | 0.28 |
ENSRNOT00000049437
|
Ctnna3
|
catenin alpha 3 |
| chr6_+_21708487 | 0.28 |
ENSRNOT00000087358
|
AABR07063197.1
|
|
| chr9_-_88816898 | 0.28 |
ENSRNOT00000083667
|
Slc19a3
|
solute carrier family 19 member 3 |
| chr6_-_95502775 | 0.28 |
ENSRNOT00000074990
ENSRNOT00000034289 |
Dhrs7l1
|
dehydrogenase/reductase (SDR family) member 7-like 1 |
| chr12_-_20276121 | 0.28 |
ENSRNOT00000065873
|
LOC685157
|
similar to paired immunoglobin-like type 2 receptor beta |
| chrX_-_71313513 | 0.28 |
ENSRNOT00000004972
ENSRNOT00000076008 ENSRNOT00000076042 |
Zmym3
|
zinc finger MYM-type containing 3 |
| chr3_-_64766472 | 0.27 |
ENSRNOT00000037684
|
Cwc22
|
CWC22 spliceosome associated protein homolog |
| chr10_-_87541851 | 0.27 |
ENSRNOT00000089610
|
RGD1561684
|
similar to keratin associated protein 2-4 |
| chr7_+_11582984 | 0.27 |
ENSRNOT00000026893
|
Gng7
|
G protein subunit gamma 7 |
| chr1_+_1545134 | 0.27 |
ENSRNOT00000044523
|
AABR07000156.1
|
|
| chr2_-_265300868 | 0.27 |
ENSRNOT00000066024
ENSRNOT00000016073 ENSRNOT00000033502 |
Lrrc7
|
leucine rich repeat containing 7 |
| chr10_-_70788309 | 0.27 |
ENSRNOT00000029184
|
Ccl9
|
chemokine (C-C motif) ligand 9 |
| chr7_-_70552897 | 0.27 |
ENSRNOT00000080594
|
Kif5a
|
kinesin family member 5A |
| chr7_-_45185690 | 0.27 |
ENSRNOT00000071306
|
Lrriq1
|
leucine-rich repeats and IQ motif containing 1 |
| chr6_-_28663233 | 0.26 |
ENSRNOT00000070979
|
Cenpo
|
centromere protein O |
| chr3_-_431933 | 0.26 |
ENSRNOT00000033653
|
Spopl
|
speckle type BTB/POZ protein like |
| chr10_+_70262361 | 0.26 |
ENSRNOT00000064625
ENSRNOT00000076973 |
Unc45b
|
unc-45 myosin chaperone B |
| chr3_-_109044420 | 0.26 |
ENSRNOT00000007687
|
Rasgrp1
|
RAS guanyl releasing protein 1 |
| chr4_-_28310178 | 0.26 |
ENSRNOT00000084021
|
RGD1563091
|
similar to OEF2 |
| chr10_+_11912543 | 0.26 |
ENSRNOT00000045192
|
Zfp597
|
zinc finger protein 597 |
| chr12_-_45801842 | 0.26 |
ENSRNOT00000078837
|
AABR07036513.1
|
|
| chr7_+_48867664 | 0.26 |
ENSRNOT00000005862
|
Ppfia2
|
PTPRF interacting protein alpha 2 |
| chr8_-_69508024 | 0.25 |
ENSRNOT00000083564
|
AABR07070416.3
|
|
| chr8_-_21453190 | 0.25 |
ENSRNOT00000078192
|
Zfp26
|
zinc finger protein 26 |
| chr1_-_246010594 | 0.25 |
ENSRNOT00000023762
|
Rfx3
|
regulatory factor X3 |
| chr13_-_80775230 | 0.25 |
ENSRNOT00000091389
ENSRNOT00000004762 |
Fmo2
|
flavin containing monooxygenase 2 |
| chr15_+_30557388 | 0.25 |
ENSRNOT00000072978
|
AABR07017745.4
|
|
| chr2_+_243425007 | 0.25 |
ENSRNOT00000082894
|
Trmt10a
|
tRNA methyltransferase 10A |
| chr3_-_104502471 | 0.25 |
ENSRNOT00000040306
|
Ryr3
|
ryanodine receptor 3 |
| chr2_+_196608496 | 0.25 |
ENSRNOT00000091681
|
Arnt
|
aryl hydrocarbon receptor nuclear translocator |
| chrM_+_8599 | 0.25 |
ENSRNOT00000049683
|
Mt-cox3
|
mitochondrially encoded cytochrome C oxidase III |
| chr4_+_25686392 | 0.25 |
ENSRNOT00000061199
|
Cldn12
|
claudin 12 |
| chr13_-_39643361 | 0.25 |
ENSRNOT00000003527
|
Dpp10
|
dipeptidylpeptidase 10 |
| chr1_-_191651628 | 0.25 |
ENSRNOT00000055048
|
Usp31
|
ubiquitin specific peptidase 31 |
| chr1_-_49844547 | 0.25 |
ENSRNOT00000086127
ENSRNOT00000077423 ENSRNOT00000089439 ENSRNOT00000090521 |
AABR07001519.1
|
|
| chr4_-_168517177 | 0.25 |
ENSRNOT00000009151
|
Dusp16
|
dual specificity phosphatase 16 |
| chr17_+_45199178 | 0.25 |
ENSRNOT00000080047
|
Zscan26
|
zinc finger and SCAN domain containing 26 |
| chr10_+_45893018 | 0.25 |
ENSRNOT00000004280
ENSRNOT00000086710 |
Nlrp3
|
NLR family, pyrin domain containing 3 |
| chr7_+_40217991 | 0.25 |
ENSRNOT00000085684
|
Cep290
|
centrosomal protein 290 |
| chr14_-_44767120 | 0.25 |
ENSRNOT00000003991
|
Wdr19
|
WD repeat domain 19 |
| chr18_+_55505993 | 0.24 |
ENSRNOT00000043736
|
RGD1309362
|
similar to interferon-inducible GTPase |
| chr6_+_106084815 | 0.24 |
ENSRNOT00000058195
|
Sipa1l1
|
signal-induced proliferation-associated 1 like 1 |
| chr9_+_50892605 | 0.24 |
ENSRNOT00000033133
|
Bivm
|
basic, immunoglobulin-like variable motif containing |
| chr17_-_44640092 | 0.24 |
ENSRNOT00000077628
|
Zfp184
|
zinc finger protein 184 |
| chr1_-_38586563 | 0.24 |
ENSRNOT00000070999
ENSRNOT00000071758 |
LOC501406
|
similar to regulator of sex-limitation candidate 1 |
| chr1_+_72956026 | 0.24 |
ENSRNOT00000031462
|
Rdh13
|
retinol dehydrogenase 13 |
| chr9_-_97290639 | 0.24 |
ENSRNOT00000026491
ENSRNOT00000056724 |
Iqca1
|
IQ motif containing with AAA domain 1 |
| chrX_+_51286737 | 0.24 |
ENSRNOT00000035692
|
Dmd
|
dystrophin |
| chr10_-_35175647 | 0.24 |
ENSRNOT00000078960
|
Cnot6
|
CCR4-NOT transcription complex, subunit 6 |
| chr4_-_124338176 | 0.24 |
ENSRNOT00000016628
|
Prickle2
|
prickle planar cell polarity protein 2 |
| chrX_+_84064427 | 0.24 |
ENSRNOT00000046364
|
Zfp711
|
zinc finger protein 711 |
| chr3_+_113102090 | 0.23 |
ENSRNOT00000016529
|
Adal
|
adenosine deaminase-like |
| chr1_-_61872975 | 0.23 |
ENSRNOT00000078809
|
AABR07001910.1
|
|
| chr17_+_78764506 | 0.23 |
ENSRNOT00000077953
|
Suv39h2
|
suppressor of variegation 3-9 homolog 2 |
| chr15_-_39742103 | 0.23 |
ENSRNOT00000074587
ENSRNOT00000036781 ENSRNOT00000071919 |
Setdb2
|
SET domain, bifurcated 2 |
| chr8_+_82038967 | 0.23 |
ENSRNOT00000079535
|
Myo5a
|
myosin VA |
| chr10_+_49259194 | 0.23 |
ENSRNOT00000091100
ENSRNOT00000004390 |
Fbxw10
|
F-box and WD repeat domain containing 10 |
| chr1_+_88582641 | 0.23 |
ENSRNOT00000028187
|
Zfp382
|
zinc finger protein 382 |
| chr9_-_38495126 | 0.23 |
ENSRNOT00000016933
ENSRNOT00000090385 |
Rab23
|
RAB23, member RAS oncogene family |
| chr10_-_57121584 | 0.23 |
ENSRNOT00000029421
|
Vmo1
|
vitelline membrane outer layer 1 homolog |
| chr14_+_7949239 | 0.23 |
ENSRNOT00000044617
|
Ndufb4l1
|
NADH dehydrogenase (ubiquinone) 1 beta subcomplex, 4-like 1 |
| chr5_-_16799776 | 0.23 |
ENSRNOT00000011721
|
Plag1
|
PLAG1 zinc finger |
| chr15_-_93765498 | 0.23 |
ENSRNOT00000093297
|
Mycbp2
|
MYC binding protein 2, E3 ubiquitin protein ligase |
| chr8_-_13906355 | 0.23 |
ENSRNOT00000029634
|
Cep295
|
centrosomal protein 295 |
| chr1_+_259958310 | 0.23 |
ENSRNOT00000019751
|
LOC103689954
|
ectonucleoside triphosphate diphosphohydrolase 1 |
| chr5_+_157222636 | 0.23 |
ENSRNOT00000022579
|
Pla2g2d
|
phospholipase A2, group IID |
| chr14_-_28967980 | 0.23 |
ENSRNOT00000048175
|
Adgrl3
|
adhesion G protein-coupled receptor L3 |
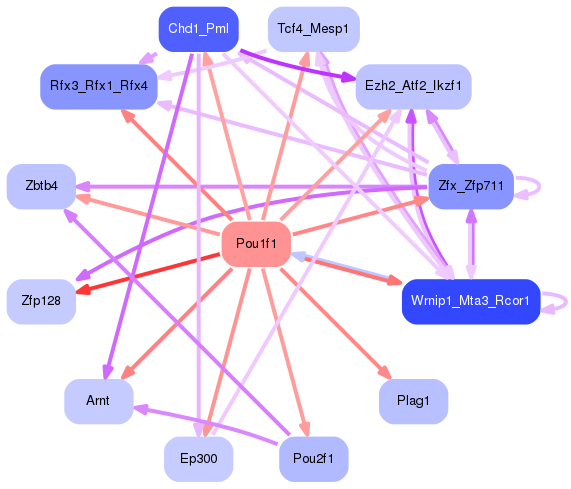
Network of associatons between targets according to the STRING database.

First level regulatory network of Pou1f1
Gene Ontology Analysis
Gene overrepresentation in biological process category:
| Log-likelihood per target | Total log-likelihood | Term | Description |
|---|---|---|---|
| 0.2 | 0.9 | GO:1901475 | pyruvate transmembrane transport(GO:1901475) |
| 0.2 | 0.7 | GO:0051643 | endoplasmic reticulum localization(GO:0051643) |
| 0.1 | 0.4 | GO:0019276 | UDP-N-acetylgalactosamine metabolic process(GO:0019276) |
| 0.1 | 0.4 | GO:0043974 | histone H3-K27 acetylation(GO:0043974) regulation of histone H3-K27 acetylation(GO:1901674) |
| 0.1 | 0.4 | GO:0061091 | regulation of phospholipid translocation(GO:0061091) positive regulation of phospholipid translocation(GO:0061092) |
| 0.1 | 0.4 | GO:0007066 | female meiosis sister chromatid cohesion(GO:0007066) |
| 0.1 | 0.4 | GO:0000821 | regulation of arginine metabolic process(GO:0000821) negative regulation of nitric oxide mediated signal transduction(GO:0010751) negative regulation of cellular amino acid metabolic process(GO:0045763) |
| 0.1 | 0.5 | GO:1905235 | carbohydrate export(GO:0033231) daunorubicin transport(GO:0043215) response to borneol(GO:1905230) cellular response to borneol(GO:1905231) response to codeine(GO:1905233) response to quercetin(GO:1905235) drug transport across blood-brain barrier(GO:1990962) establishment of blood-retinal barrier(GO:1990963) |
| 0.1 | 0.1 | GO:0032053 | ciliary basal body organization(GO:0032053) |
| 0.1 | 0.8 | GO:0016080 | synaptic vesicle targeting(GO:0016080) |
| 0.1 | 0.4 | GO:0007597 | blood coagulation, intrinsic pathway(GO:0007597) |
| 0.1 | 0.4 | GO:0071934 | thiamine transmembrane transport(GO:0071934) |
| 0.1 | 0.4 | GO:1904139 | microglial cell migration(GO:1904124) regulation of microglial cell migration(GO:1904139) |
| 0.1 | 0.3 | GO:0006579 | amino-acid betaine catabolic process(GO:0006579) |
| 0.1 | 0.5 | GO:0072139 | glomerular parietal epithelial cell differentiation(GO:0072139) |
| 0.1 | 0.7 | GO:0072513 | positive regulation of secondary heart field cardioblast proliferation(GO:0072513) |
| 0.1 | 0.4 | GO:0042891 | antibiotic transport(GO:0042891) dipeptide transport(GO:0042938) |
| 0.1 | 0.3 | GO:0045041 | protein import into mitochondrial intermembrane space(GO:0045041) |
| 0.1 | 0.7 | GO:0010808 | positive regulation of synaptic vesicle priming(GO:0010808) |
| 0.1 | 0.4 | GO:0032252 | secretory granule localization(GO:0032252) |
| 0.1 | 0.3 | GO:1903566 | positive regulation of protein localization to cilium(GO:1903566) |
| 0.1 | 0.4 | GO:0006428 | isoleucyl-tRNA aminoacylation(GO:0006428) |
| 0.1 | 0.4 | GO:0060830 | ciliary receptor clustering involved in smoothened signaling pathway(GO:0060830) |
| 0.1 | 0.3 | GO:0098971 | anterograde dendritic transport of neurotransmitter receptor complex(GO:0098971) |
| 0.1 | 0.3 | GO:2000078 | glandular epithelial cell maturation(GO:0002071) positive regulation of type B pancreatic cell development(GO:2000078) |
| 0.1 | 0.3 | GO:0071623 | negative regulation of granulocyte chemotaxis(GO:0071623) negative regulation of neutrophil chemotaxis(GO:0090024) |
| 0.1 | 0.2 | GO:0009644 | response to high light intensity(GO:0009644) |
| 0.1 | 0.2 | GO:0061470 | T follicular helper cell differentiation(GO:0061470) |
| 0.1 | 0.2 | GO:0021627 | muscle attachment(GO:0016203) olfactory nerve morphogenesis(GO:0021627) olfactory nerve structural organization(GO:0021629) |
| 0.1 | 0.5 | GO:0070966 | nuclear-transcribed mRNA catabolic process, no-go decay(GO:0070966) |
| 0.1 | 0.2 | GO:0010752 | regulation of cGMP-mediated signaling(GO:0010752) |
| 0.1 | 0.2 | GO:0042501 | serine phosphorylation of STAT protein(GO:0042501) |
| 0.1 | 0.5 | GO:0048690 | regulation of sprouting of injured axon(GO:0048686) regulation of axon extension involved in regeneration(GO:0048690) |
| 0.1 | 0.2 | GO:1902595 | regulation of DNA replication origin binding(GO:1902595) |
| 0.1 | 0.2 | GO:0099553 | trans-synaptic signaling by lipid, modulating synaptic transmission(GO:0099552) trans-synaptic signaling by endocannabinoid, modulating synaptic transmission(GO:0099553) |
| 0.1 | 0.1 | GO:0035700 | astrocyte chemotaxis(GO:0035700) regulation of astrocyte chemotaxis(GO:2000458) |
| 0.1 | 0.4 | GO:0098989 | NMDA selective glutamate receptor signaling pathway(GO:0098989) |
| 0.1 | 0.4 | GO:0000820 | regulation of glutamine family amino acid metabolic process(GO:0000820) |
| 0.1 | 0.1 | GO:1904844 | response to L-glutamine(GO:1904844) cellular response to L-glutamine(GO:1904845) |
| 0.1 | 0.4 | GO:1903527 | positive regulation of membrane tubulation(GO:1903527) |
| 0.1 | 0.2 | GO:0003220 | left ventricular cardiac muscle tissue morphogenesis(GO:0003220) |
| 0.1 | 0.2 | GO:0010982 | regulation of high-density lipoprotein particle clearance(GO:0010982) |
| 0.1 | 0.2 | GO:0018076 | N-terminal peptidyl-lysine acetylation(GO:0018076) |
| 0.1 | 0.2 | GO:0003430 | growth plate cartilage chondrocyte growth(GO:0003430) |
| 0.1 | 0.2 | GO:0043605 | cellular amide catabolic process(GO:0043605) |
| 0.1 | 0.2 | GO:0050713 | negative regulation of interleukin-1 beta secretion(GO:0050713) positive regulation of T-helper 17 type immune response(GO:2000318) |
| 0.1 | 0.1 | GO:0070340 | detection of diacyl bacterial lipopeptide(GO:0042496) detection of bacterial lipopeptide(GO:0070340) |
| 0.1 | 0.2 | GO:0032485 | regulation of Ral protein signal transduction(GO:0032485) |
| 0.1 | 0.2 | GO:0015820 | leucine transport(GO:0015820) |
| 0.1 | 0.2 | GO:0090172 | microtubule cytoskeleton organization involved in homologous chromosome segregation(GO:0090172) |
| 0.1 | 0.3 | GO:2000354 | regulation of ovarian follicle development(GO:2000354) |
| 0.1 | 0.2 | GO:1904430 | negative regulation of t-circle formation(GO:1904430) |
| 0.1 | 0.2 | GO:0007208 | phospholipase C-activating serotonin receptor signaling pathway(GO:0007208) |
| 0.1 | 0.2 | GO:0071698 | olfactory placode formation(GO:0030910) olfactory placode development(GO:0071698) olfactory placode morphogenesis(GO:0071699) |
| 0.1 | 0.2 | GO:0098963 | dendritic transport of ribonucleoprotein complex(GO:0098961) dendritic transport of messenger ribonucleoprotein complex(GO:0098963) anterograde dendritic transport of messenger ribonucleoprotein complex(GO:0098964) |
| 0.1 | 0.7 | GO:0043252 | sodium-independent organic anion transport(GO:0043252) |
| 0.1 | 0.1 | GO:0002581 | negative regulation of antigen processing and presentation of peptide or polysaccharide antigen via MHC class II(GO:0002581) |
| 0.1 | 0.2 | GO:0071918 | urea transmembrane transport(GO:0071918) |
| 0.1 | 0.2 | GO:0033364 | mast cell secretory granule organization(GO:0033364) |
| 0.1 | 0.2 | GO:0030576 | Cajal body organization(GO:0030576) |
| 0.1 | 0.2 | GO:0032915 | positive regulation of transforming growth factor beta2 production(GO:0032915) |
| 0.1 | 0.2 | GO:2000978 | gastrin-induced gastric acid secretion(GO:0001698) positive regulation of actin filament-based movement(GO:1903116) negative regulation of forebrain neuron differentiation(GO:2000978) |
| 0.0 | 0.1 | GO:1904694 | negative regulation of vascular smooth muscle contraction(GO:1904694) |
| 0.0 | 0.1 | GO:0071691 | cardiac muscle thin filament assembly(GO:0071691) |
| 0.0 | 0.2 | GO:1990918 | double-strand break repair involved in meiotic recombination(GO:1990918) |
| 0.0 | 0.1 | GO:2000312 | regulation of kainate selective glutamate receptor activity(GO:2000312) |
| 0.0 | 0.1 | GO:0007172 | signal complex assembly(GO:0007172) |
| 0.0 | 0.3 | GO:0030035 | microspike assembly(GO:0030035) |
| 0.0 | 0.2 | GO:0061364 | apoptotic process involved in luteolysis(GO:0061364) |
| 0.0 | 0.1 | GO:0010133 | proline catabolic process to glutamate(GO:0010133) |
| 0.0 | 0.1 | GO:1900748 | positive regulation of vascular endothelial growth factor signaling pathway(GO:1900748) positive regulation of lymphangiogenesis(GO:1901492) |
| 0.0 | 0.4 | GO:1990910 | negative regulation of mitochondrial fission(GO:0090258) response to hypobaric hypoxia(GO:1990910) |
| 0.0 | 0.3 | GO:0007168 | receptor guanylyl cyclase signaling pathway(GO:0007168) |
| 0.0 | 0.2 | GO:0070537 | histone H2A K63-linked deubiquitination(GO:0070537) |
| 0.0 | 0.2 | GO:0031119 | tRNA pseudouridine synthesis(GO:0031119) |
| 0.0 | 0.1 | GO:0051935 | amino acid neurotransmitter reuptake(GO:0051933) glutamate reuptake(GO:0051935) |
| 0.0 | 0.3 | GO:0002943 | tRNA dihydrouridine synthesis(GO:0002943) |
| 0.0 | 0.1 | GO:1902304 | positive regulation of potassium ion export(GO:1902304) |
| 0.0 | 0.1 | GO:0007079 | mitotic chromosome movement towards spindle pole(GO:0007079) |
| 0.0 | 0.1 | GO:0060383 | positive regulation of DNA strand elongation(GO:0060383) |
| 0.0 | 0.3 | GO:0035726 | common myeloid progenitor cell proliferation(GO:0035726) |
| 0.0 | 0.4 | GO:0019367 | fatty acid elongation, saturated fatty acid(GO:0019367) fatty acid elongation, unsaturated fatty acid(GO:0019368) |
| 0.0 | 0.1 | GO:0042989 | sequestering of actin monomers(GO:0042989) |
| 0.0 | 0.1 | GO:1903233 | regulation of calcium ion-dependent exocytosis of neurotransmitter(GO:1903233) positive regulation of endoplasmic reticulum tubular network organization(GO:1903373) |
| 0.0 | 0.2 | GO:0021840 | directional guidance of interneurons involved in migration from the subpallium to the cortex(GO:0021840) chemorepulsion involved in interneuron migration from the subpallium to the cortex(GO:0021842) |
| 0.0 | 0.1 | GO:0019417 | sulfur oxidation(GO:0019417) |
| 0.0 | 0.1 | GO:0071477 | hypotonic salinity response(GO:0042539) cellular hypotonic salinity response(GO:0071477) |
| 0.0 | 0.1 | GO:1902261 | positive regulation of delayed rectifier potassium channel activity(GO:1902261) |
| 0.0 | 0.1 | GO:0034395 | regulation of transcription from RNA polymerase II promoter in response to iron(GO:0034395) |
| 0.0 | 0.0 | GO:1903719 | regulation of I-kappaB phosphorylation(GO:1903719) positive regulation of I-kappaB phosphorylation(GO:1903721) |
| 0.0 | 0.1 | GO:0035696 | monocyte extravasation(GO:0035696) interleukin-12-mediated signaling pathway(GO:0035722) interleukin-15-mediated signaling pathway(GO:0035723) cellular response to interleukin-12(GO:0071349) cellular response to interleukin-15(GO:0071350) response to ionomycin(GO:1904636) cellular response to ionomycin(GO:1904637) |
| 0.0 | 0.5 | GO:0046069 | cGMP catabolic process(GO:0046069) |
| 0.0 | 0.2 | GO:1902414 | protein localization to cell junction(GO:1902414) |
| 0.0 | 0.1 | GO:0070358 | actin polymerization-dependent cell motility(GO:0070358) |
| 0.0 | 1.0 | GO:0022011 | myelination in peripheral nervous system(GO:0022011) peripheral nervous system axon ensheathment(GO:0032292) |
| 0.0 | 0.1 | GO:0000350 | generation of catalytic spliceosome for second transesterification step(GO:0000350) |
| 0.0 | 0.1 | GO:0070245 | positive regulation of thymocyte apoptotic process(GO:0070245) |
| 0.0 | 0.2 | GO:0043031 | negative regulation of macrophage activation(GO:0043031) |
| 0.0 | 0.1 | GO:0098886 | modification of dendritic spine(GO:0098886) |
| 0.0 | 0.3 | GO:0086073 | bundle of His cell-Purkinje myocyte adhesion involved in cell communication(GO:0086073) |
| 0.0 | 0.2 | GO:2000601 | positive regulation of Arp2/3 complex-mediated actin nucleation(GO:2000601) |
| 0.0 | 0.1 | GO:0032484 | Ral protein signal transduction(GO:0032484) |
| 0.0 | 0.4 | GO:0098719 | sodium ion import across plasma membrane(GO:0098719) sodium ion import into cell(GO:1990118) |
| 0.0 | 0.2 | GO:0002457 | T cell antigen processing and presentation(GO:0002457) |
| 0.0 | 0.1 | GO:0002904 | positive regulation of B cell apoptotic process(GO:0002904) |
| 0.0 | 0.5 | GO:0007216 | G-protein coupled glutamate receptor signaling pathway(GO:0007216) |
| 0.0 | 0.1 | GO:0006772 | thiamine metabolic process(GO:0006772) thiamine diphosphate metabolic process(GO:0042357) thiamine-containing compound metabolic process(GO:0042723) |
| 0.0 | 0.1 | GO:0046338 | phosphatidylethanolamine catabolic process(GO:0046338) |
| 0.0 | 0.1 | GO:0006045 | N-acetylglucosamine biosynthetic process(GO:0006045) N-acetylneuraminate biosynthetic process(GO:0046380) |
| 0.0 | 0.5 | GO:0070933 | histone H4 deacetylation(GO:0070933) |
| 0.0 | 0.1 | GO:1904209 | regulation of chemokine (C-C motif) ligand 2 secretion(GO:1904207) positive regulation of chemokine (C-C motif) ligand 2 secretion(GO:1904209) |
| 0.0 | 0.2 | GO:0045196 | establishment or maintenance of neuroblast polarity(GO:0045196) establishment of neuroblast polarity(GO:0045200) |
| 0.0 | 0.1 | GO:1904976 | cellular response to bleomycin(GO:1904976) |
| 0.0 | 0.6 | GO:0032793 | positive regulation of CREB transcription factor activity(GO:0032793) |
| 0.0 | 0.1 | GO:0046061 | dATP catabolic process(GO:0046061) |
| 0.0 | 0.1 | GO:0038145 | macrophage colony-stimulating factor signaling pathway(GO:0038145) |
| 0.0 | 0.1 | GO:0002636 | positive regulation of germinal center formation(GO:0002636) B cell costimulation(GO:0031296) |
| 0.0 | 0.1 | GO:0046951 | ketone body biosynthetic process(GO:0046951) |
| 0.0 | 0.3 | GO:0010571 | positive regulation of nuclear cell cycle DNA replication(GO:0010571) |
| 0.0 | 0.2 | GO:0070269 | pyroptosis(GO:0070269) |
| 0.0 | 0.1 | GO:0001554 | luteolysis(GO:0001554) |
| 0.0 | 0.1 | GO:0010032 | meiotic chromosome condensation(GO:0010032) |
| 0.0 | 0.2 | GO:0060267 | positive regulation of respiratory burst(GO:0060267) |
| 0.0 | 0.1 | GO:0016240 | autophagosome docking(GO:0016240) |
| 0.0 | 0.1 | GO:1900454 | positive regulation of long term synaptic depression(GO:1900454) |
| 0.0 | 0.2 | GO:0010961 | cellular magnesium ion homeostasis(GO:0010961) |
| 0.0 | 0.4 | GO:0021785 | branchiomotor neuron axon guidance(GO:0021785) |
| 0.0 | 0.1 | GO:0048319 | axial mesoderm morphogenesis(GO:0048319) |
| 0.0 | 0.0 | GO:0032687 | negative regulation of interferon-alpha production(GO:0032687) |
| 0.0 | 0.1 | GO:0006290 | pyrimidine dimer repair(GO:0006290) |
| 0.0 | 0.1 | GO:1902268 | negative regulation of polyamine transmembrane transport(GO:1902268) |
| 0.0 | 0.1 | GO:1900113 | negative regulation of histone H3-K9 trimethylation(GO:1900113) |
| 0.0 | 0.1 | GO:0014908 | myotube differentiation involved in skeletal muscle regeneration(GO:0014908) |
| 0.0 | 0.1 | GO:1903679 | regulation of cap-independent translational initiation(GO:1903677) positive regulation of cap-independent translational initiation(GO:1903679) regulation of cytoplasmic translational initiation(GO:1904688) positive regulation of cytoplasmic translational initiation(GO:1904690) |
| 0.0 | 0.2 | GO:0006297 | nucleotide-excision repair, DNA gap filling(GO:0006297) |
| 0.0 | 0.1 | GO:2001268 | negative regulation of cysteine-type endopeptidase activity involved in apoptotic signaling pathway(GO:2001268) |
| 0.0 | 0.5 | GO:0045986 | negative regulation of smooth muscle contraction(GO:0045986) |
| 0.0 | 0.4 | GO:0032688 | negative regulation of interferon-beta production(GO:0032688) |
| 0.0 | 0.2 | GO:0071169 | establishment of protein localization to chromatin(GO:0071169) |
| 0.0 | 0.6 | GO:0051481 | negative regulation of cytosolic calcium ion concentration(GO:0051481) |
| 0.0 | 0.2 | GO:0032483 | regulation of Rab protein signal transduction(GO:0032483) |
| 0.0 | 0.1 | GO:1903999 | negative regulation of eating behavior(GO:1903999) |
| 0.0 | 0.1 | GO:0033058 | directional locomotion(GO:0033058) |
| 0.0 | 0.1 | GO:0016098 | monoterpenoid metabolic process(GO:0016098) |
| 0.0 | 0.1 | GO:1905050 | positive regulation of metallopeptidase activity(GO:1905050) |
| 0.0 | 0.2 | GO:0097105 | presynaptic membrane assembly(GO:0097105) |
| 0.0 | 0.2 | GO:0010991 | negative regulation of SMAD protein complex assembly(GO:0010991) |
| 0.0 | 0.2 | GO:0042754 | negative regulation of circadian rhythm(GO:0042754) |
| 0.0 | 0.1 | GO:0060023 | soft palate development(GO:0060023) |
| 0.0 | 0.2 | GO:0032959 | inositol trisphosphate biosynthetic process(GO:0032959) |
| 0.0 | 0.1 | GO:0035616 | histone H2B conserved C-terminal lysine deubiquitination(GO:0035616) |
| 0.0 | 0.2 | GO:0046010 | positive regulation of circadian sleep/wake cycle, non-REM sleep(GO:0046010) |
| 0.0 | 0.5 | GO:0045187 | regulation of circadian sleep/wake cycle, sleep(GO:0045187) |
| 0.0 | 0.1 | GO:0002322 | B cell proliferation involved in immune response(GO:0002322) |
| 0.0 | 0.1 | GO:1900245 | positive regulation of MDA-5 signaling pathway(GO:1900245) |
| 0.0 | 0.2 | GO:0070544 | histone H3-K36 demethylation(GO:0070544) |
| 0.0 | 0.1 | GO:0042276 | error-prone translesion synthesis(GO:0042276) |
| 0.0 | 0.0 | GO:1904753 | negative regulation of vascular associated smooth muscle cell migration(GO:1904753) |
| 0.0 | 0.1 | GO:0072709 | cellular response to sorbitol(GO:0072709) negative regulation of motor neuron apoptotic process(GO:2000672) |
| 0.0 | 0.1 | GO:0006295 | nucleotide-excision repair, DNA incision, 3'-to lesion(GO:0006295) |
| 0.0 | 0.1 | GO:0071802 | negative regulation of podosome assembly(GO:0071802) |
| 0.0 | 0.1 | GO:0019474 | lysine catabolic process(GO:0006554) L-lysine catabolic process to acetyl-CoA(GO:0019474) L-lysine catabolic process(GO:0019477) L-lysine metabolic process(GO:0046440) |
| 0.0 | 0.2 | GO:1902036 | regulation of hematopoietic stem cell differentiation(GO:1902036) |
| 0.0 | 0.3 | GO:0045161 | neuronal ion channel clustering(GO:0045161) |
| 0.0 | 0.1 | GO:1902044 | regulation of Fas signaling pathway(GO:1902044) |
| 0.0 | 0.1 | GO:0036500 | ATF6-mediated unfolded protein response(GO:0036500) |
| 0.0 | 0.1 | GO:1902775 | mitochondrial large ribosomal subunit assembly(GO:1902775) |
| 0.0 | 0.1 | GO:0000019 | regulation of mitotic recombination(GO:0000019) |
| 0.0 | 1.2 | GO:0030835 | negative regulation of actin filament depolymerization(GO:0030835) |
| 0.0 | 0.1 | GO:0010606 | positive regulation of cytoplasmic mRNA processing body assembly(GO:0010606) |
| 0.0 | 0.2 | GO:0002467 | germinal center formation(GO:0002467) |
| 0.0 | 0.1 | GO:0060083 | smooth muscle contraction involved in micturition(GO:0060083) |
| 0.0 | 0.2 | GO:0043619 | regulation of transcription from RNA polymerase II promoter in response to oxidative stress(GO:0043619) |
| 0.0 | 0.3 | GO:0010960 | magnesium ion homeostasis(GO:0010960) |
| 0.0 | 0.1 | GO:0010157 | response to chlorate(GO:0010157) |
| 0.0 | 0.4 | GO:0060736 | prostate gland growth(GO:0060736) |
| 0.0 | 1.3 | GO:0042773 | ATP synthesis coupled electron transport(GO:0042773) |
| 0.0 | 0.5 | GO:0031065 | positive regulation of histone deacetylation(GO:0031065) |
| 0.0 | 0.7 | GO:0007214 | gamma-aminobutyric acid signaling pathway(GO:0007214) |
| 0.0 | 0.1 | GO:1902534 | single-organism membrane invagination(GO:1902534) |
| 0.0 | 0.5 | GO:0045663 | positive regulation of myoblast differentiation(GO:0045663) |
| 0.0 | 0.1 | GO:1904428 | negative regulation of tubulin deacetylation(GO:1904428) |
| 0.0 | 0.3 | GO:0021859 | pyramidal neuron differentiation(GO:0021859) |
| 0.0 | 0.2 | GO:0000055 | ribosomal large subunit export from nucleus(GO:0000055) |
| 0.0 | 0.1 | GO:2000348 | regulation of CD40 signaling pathway(GO:2000348) |
| 0.0 | 0.1 | GO:0008050 | female courtship behavior(GO:0008050) |
| 0.0 | 0.2 | GO:0051382 | kinetochore assembly(GO:0051382) |
| 0.0 | 0.2 | GO:0061525 | hindgut development(GO:0061525) |
| 0.0 | 0.1 | GO:0071955 | recycling endosome to Golgi transport(GO:0071955) |
| 0.0 | 0.1 | GO:0060467 | negative regulation of fertilization(GO:0060467) prevention of polyspermy(GO:0060468) |
| 0.0 | 0.1 | GO:1902774 | late endosome to lysosome transport(GO:1902774) |
| 0.0 | 0.3 | GO:0047497 | establishment of mitochondrion localization, microtubule-mediated(GO:0034643) mitochondrion transport along microtubule(GO:0047497) |
| 0.0 | 0.1 | GO:0021577 | hindbrain structural organization(GO:0021577) cerebellum structural organization(GO:0021589) neuronal-glial interaction involved in cerebral cortex radial glia guided migration(GO:0021812) lateral motor column neuron migration(GO:0097477) |
| 0.0 | 0.1 | GO:2000158 | positive regulation of ubiquitin-specific protease activity(GO:2000158) |
| 0.0 | 0.1 | GO:2001295 | multicellular organismal protein metabolic process(GO:0044268) malonyl-CoA biosynthetic process(GO:2001295) |
| 0.0 | 0.2 | GO:0007258 | JUN phosphorylation(GO:0007258) |
| 0.0 | 0.1 | GO:0043387 | toxin catabolic process(GO:0009407) mycotoxin metabolic process(GO:0043385) mycotoxin catabolic process(GO:0043387) aflatoxin metabolic process(GO:0046222) aflatoxin catabolic process(GO:0046223) secondary metabolite catabolic process(GO:0090487) organic heteropentacyclic compound metabolic process(GO:1901376) organic heteropentacyclic compound catabolic process(GO:1901377) |
| 0.0 | 0.1 | GO:1905168 | positive regulation of double-strand break repair via homologous recombination(GO:1905168) |
| 0.0 | 0.1 | GO:0097210 | response to gonadotropin-releasing hormone(GO:0097210) cellular response to gonadotropin-releasing hormone(GO:0097211) |
| 0.0 | 0.3 | GO:0043116 | negative regulation of vascular permeability(GO:0043116) |
| 0.0 | 0.1 | GO:1901894 | regulation of calcium-transporting ATPase activity(GO:1901894) |
| 0.0 | 0.1 | GO:0061366 | behavioral response to chemical pain(GO:0061366) behavioral response to formalin induced pain(GO:0061368) |
| 0.0 | 0.0 | GO:0051383 | kinetochore organization(GO:0051383) |
| 0.0 | 0.1 | GO:1902083 | negative regulation of peptidyl-cysteine S-nitrosylation(GO:1902083) |
| 0.0 | 0.1 | GO:0033564 | anterior/posterior axon guidance(GO:0033564) |
| 0.0 | 0.7 | GO:0048013 | ephrin receptor signaling pathway(GO:0048013) |
| 0.0 | 0.1 | GO:0001927 | exocyst assembly(GO:0001927) |
| 0.0 | 0.5 | GO:1901880 | negative regulation of protein depolymerization(GO:1901880) |
| 0.0 | 0.1 | GO:0034240 | negative regulation of macrophage fusion(GO:0034240) |
| 0.0 | 0.1 | GO:0045410 | positive regulation of interleukin-6 biosynthetic process(GO:0045410) |
| 0.0 | 0.2 | GO:0035336 | long-chain fatty-acyl-CoA metabolic process(GO:0035336) |
| 0.0 | 0.1 | GO:0018344 | protein geranylgeranylation(GO:0018344) |
| 0.0 | 0.2 | GO:0031987 | locomotion involved in locomotory behavior(GO:0031987) |
| 0.0 | 0.1 | GO:0033572 | transferrin transport(GO:0033572) |
| 0.0 | 0.2 | GO:0070995 | NADPH oxidation(GO:0070995) |
| 0.0 | 0.1 | GO:0006384 | transcription initiation from RNA polymerase III promoter(GO:0006384) |
| 0.0 | 0.0 | GO:0065001 | specification of axis polarity(GO:0065001) |
| 0.0 | 0.2 | GO:0002098 | tRNA wobble uridine modification(GO:0002098) |
| 0.0 | 0.0 | GO:0090292 | nucleokinesis involved in cell motility in cerebral cortex radial glia guided migration(GO:0021817) nuclear migration along microtubule(GO:0030473) nuclear matrix anchoring at nuclear membrane(GO:0090292) |
| 0.0 | 0.1 | GO:1900246 | positive regulation of RIG-I signaling pathway(GO:1900246) |
| 0.0 | 0.1 | GO:0070459 | prolactin secretion(GO:0070459) |
| 0.0 | 0.2 | GO:0000712 | resolution of meiotic recombination intermediates(GO:0000712) |
| 0.0 | 0.1 | GO:0007262 | STAT protein import into nucleus(GO:0007262) |
| 0.0 | 0.2 | GO:0046599 | regulation of centriole replication(GO:0046599) |
| 0.0 | 0.1 | GO:0019227 | neuronal action potential propagation(GO:0019227) action potential propagation(GO:0098870) |
| 0.0 | 0.2 | GO:0016973 | poly(A)+ mRNA export from nucleus(GO:0016973) |
| 0.0 | 0.1 | GO:0048752 | semicircular canal morphogenesis(GO:0048752) |
| 0.0 | 0.2 | GO:0042118 | endothelial cell activation(GO:0042118) |
| 0.0 | 0.2 | GO:0006607 | NLS-bearing protein import into nucleus(GO:0006607) |
| 0.0 | 0.1 | GO:0031340 | positive regulation of vesicle fusion(GO:0031340) |
| 0.0 | 0.1 | GO:0006968 | cellular defense response(GO:0006968) |
| 0.0 | 0.1 | GO:0097264 | self proteolysis(GO:0097264) |
| 0.0 | 0.2 | GO:0009143 | nucleoside triphosphate catabolic process(GO:0009143) |
| 0.0 | 0.2 | GO:0017121 | phospholipid scrambling(GO:0017121) |
| 0.0 | 0.3 | GO:0045662 | negative regulation of myoblast differentiation(GO:0045662) |
| 0.0 | 0.0 | GO:0001915 | negative regulation of T cell mediated cytotoxicity(GO:0001915) |
| 0.0 | 0.0 | GO:0060392 | negative regulation of SMAD protein import into nucleus(GO:0060392) |
| 0.0 | 0.1 | GO:0045741 | positive regulation of epidermal growth factor-activated receptor activity(GO:0045741) |
| 0.0 | 0.2 | GO:0051639 | actin filament network formation(GO:0051639) |
| 0.0 | 0.0 | GO:0002949 | tRNA threonylcarbamoyladenosine modification(GO:0002949) |
| 0.0 | 0.1 | GO:0046874 | quinolinate metabolic process(GO:0046874) |
| 0.0 | 0.4 | GO:0007339 | binding of sperm to zona pellucida(GO:0007339) |
| 0.0 | 0.1 | GO:0060287 | epithelial cilium movement involved in determination of left/right asymmetry(GO:0060287) |
| 0.0 | 0.0 | GO:0009822 | alkaloid catabolic process(GO:0009822) |
| 0.0 | 0.0 | GO:0042196 | response to salicylic acid(GO:0009751) chlorinated hydrocarbon metabolic process(GO:0042196) halogenated hydrocarbon metabolic process(GO:0042197) |
| 0.0 | 0.1 | GO:0000160 | phosphorelay signal transduction system(GO:0000160) |
| 0.0 | 0.1 | GO:0043568 | positive regulation of insulin-like growth factor receptor signaling pathway(GO:0043568) |
| 0.0 | 0.2 | GO:0048172 | regulation of short-term neuronal synaptic plasticity(GO:0048172) |
| 0.0 | 0.1 | GO:0060327 | cytoplasmic actin-based contraction involved in cell motility(GO:0060327) |
| 0.0 | 0.1 | GO:0038109 | Kit signaling pathway(GO:0038109) diapedesis(GO:0050904) |
| 0.0 | 0.1 | GO:1901620 | regulation of smoothened signaling pathway involved in dorsal/ventral neural tube patterning(GO:1901620) |
| 0.0 | 0.2 | GO:0046597 | negative regulation of viral entry into host cell(GO:0046597) |
| 0.0 | 0.1 | GO:0043504 | mitochondrial DNA repair(GO:0043504) |
| 0.0 | 0.1 | GO:0070127 | tRNA aminoacylation for mitochondrial protein translation(GO:0070127) |
| 0.0 | 0.4 | GO:0072698 | protein localization to microtubule cytoskeleton(GO:0072698) |
| 0.0 | 0.4 | GO:0060292 | long term synaptic depression(GO:0060292) |
| 0.0 | 0.2 | GO:0001829 | trophectodermal cell differentiation(GO:0001829) |
| 0.0 | 0.1 | GO:0032876 | negative regulation of DNA endoreduplication(GO:0032876) |
| 0.0 | 0.1 | GO:0017196 | N-terminal peptidyl-methionine acetylation(GO:0017196) |
| 0.0 | 0.1 | GO:0000290 | deadenylation-dependent decapping of nuclear-transcribed mRNA(GO:0000290) |
| 0.0 | 0.1 | GO:0015919 | peroxisomal membrane transport(GO:0015919) protein import into peroxisome membrane(GO:0045046) |
| 0.0 | 0.0 | GO:0042726 | flavin-containing compound metabolic process(GO:0042726) |
| 0.0 | 0.1 | GO:0042090 | interleukin-12 biosynthetic process(GO:0042090) regulation of interleukin-12 biosynthetic process(GO:0045075) |
| 0.0 | 0.0 | GO:0001545 | primary ovarian follicle growth(GO:0001545) |
| 0.0 | 0.1 | GO:1902916 | positive regulation of protein polyubiquitination(GO:1902916) |
| 0.0 | 0.0 | GO:0031204 | posttranslational protein targeting to membrane, translocation(GO:0031204) |
| 0.0 | 0.0 | GO:1903690 | negative regulation of wound healing, spreading of epidermal cells(GO:1903690) |
| 0.0 | 0.1 | GO:0007288 | sperm axoneme assembly(GO:0007288) |
| 0.0 | 0.0 | GO:0009804 | coumarin metabolic process(GO:0009804) |
| 0.0 | 0.1 | GO:0021902 | commitment of neuronal cell to specific neuron type in forebrain(GO:0021902) |
| 0.0 | 0.1 | GO:0031643 | positive regulation of myelination(GO:0031643) |
| 0.0 | 0.1 | GO:0043569 | negative regulation of insulin-like growth factor receptor signaling pathway(GO:0043569) |
| 0.0 | 0.2 | GO:0006622 | protein targeting to lysosome(GO:0006622) |
| 0.0 | 0.0 | GO:1900864 | mitochondrial tRNA modification(GO:0070900) mitochondrial RNA modification(GO:1900864) |
| 0.0 | 0.3 | GO:0050860 | negative regulation of T cell receptor signaling pathway(GO:0050860) |
| 0.0 | 0.7 | GO:0090630 | activation of GTPase activity(GO:0090630) |
| 0.0 | 0.1 | GO:0032790 | ribosome disassembly(GO:0032790) |
| 0.0 | 0.0 | GO:0000320 | re-entry into mitotic cell cycle(GO:0000320) |
| 0.0 | 0.0 | GO:0002184 | cytoplasmic translational termination(GO:0002184) |
| 0.0 | 0.4 | GO:0045494 | photoreceptor cell maintenance(GO:0045494) |
Gene overrepresentation in cellular component category:
| Log-likelihood per target | Total log-likelihood | Term | Description |
|---|---|---|---|
| 0.2 | 0.7 | GO:0042642 | actomyosin, myosin complex part(GO:0042642) |
| 0.2 | 0.6 | GO:0044317 | rod spherule(GO:0044317) |
| 0.1 | 0.4 | GO:0000802 | transverse filament(GO:0000802) |
| 0.1 | 0.4 | GO:1990423 | RZZ complex(GO:1990423) |
| 0.1 | 0.5 | GO:0071914 | prominosome(GO:0071914) |
| 0.1 | 0.5 | GO:0072534 | perineuronal net(GO:0072534) |
| 0.1 | 0.3 | GO:0071006 | U2-type catalytic step 1 spliceosome(GO:0071006) |
| 0.1 | 0.4 | GO:0099522 | region of cytosol(GO:0099522) postsynaptic cytosol(GO:0099524) |
| 0.1 | 0.8 | GO:0097442 | CA3 pyramidal cell dendrite(GO:0097442) |
| 0.1 | 0.2 | GO:0072559 | NLRP3 inflammasome complex(GO:0072559) |
| 0.1 | 0.1 | GO:0014701 | junctional sarcoplasmic reticulum membrane(GO:0014701) |
| 0.1 | 0.5 | GO:0044305 | calyx of Held(GO:0044305) |
| 0.1 | 0.6 | GO:0030314 | junctional membrane complex(GO:0030314) |
| 0.1 | 0.1 | GO:0097539 | ciliary transition fiber(GO:0097539) |
| 0.1 | 0.2 | GO:1990005 | granular vesicle(GO:1990005) |
| 0.1 | 0.2 | GO:0042571 | immunoglobulin complex, circulating(GO:0042571) |
| 0.0 | 0.1 | GO:0034750 | Scrib-APC-beta-catenin complex(GO:0034750) |
| 0.0 | 0.3 | GO:0030991 | intraciliary transport particle A(GO:0030991) |
| 0.0 | 0.2 | GO:0070022 | transforming growth factor beta receptor homodimeric complex(GO:0070022) |
| 0.0 | 0.6 | GO:0046581 | intercellular canaliculus(GO:0046581) |
| 0.0 | 0.2 | GO:0072557 | IPAF inflammasome complex(GO:0072557) |
| 0.0 | 0.1 | GO:0005592 | collagen type XI trimer(GO:0005592) |
| 0.0 | 0.2 | GO:0098831 | presynaptic active zone cytoplasmic component(GO:0098831) |
| 0.0 | 0.1 | GO:0035355 | Toll-like receptor 2-Toll-like receptor 6 protein complex(GO:0035355) |
| 0.0 | 0.1 | GO:0005968 | Rab-protein geranylgeranyltransferase complex(GO:0005968) |
| 0.0 | 0.1 | GO:0005944 | phosphatidylinositol 3-kinase complex, class IB(GO:0005944) |
| 0.0 | 0.5 | GO:0098799 | outer mitochondrial membrane protein complex(GO:0098799) |
| 0.0 | 0.3 | GO:0031209 | SCAR complex(GO:0031209) |
| 0.0 | 0.1 | GO:1990682 | CSF1-CSF1R complex(GO:1990682) |
| 0.0 | 1.0 | GO:0032839 | dendrite cytoplasm(GO:0032839) |
| 0.0 | 0.2 | GO:1990769 | proximal neuron projection(GO:1990769) |
| 0.0 | 0.7 | GO:0043194 | axon initial segment(GO:0043194) |
| 0.0 | 0.1 | GO:0030015 | CCR4-NOT core complex(GO:0030015) |
| 0.0 | 0.3 | GO:1990454 | L-type voltage-gated calcium channel complex(GO:1990454) |
| 0.0 | 0.2 | GO:0042105 | alpha-beta T cell receptor complex(GO:0042105) |
| 0.0 | 0.1 | GO:0031390 | Ctf18 RFC-like complex(GO:0031390) |
| 0.0 | 0.1 | GO:0097598 | sperm cytoplasmic droplet(GO:0097598) |
| 0.0 | 0.1 | GO:0016035 | zeta DNA polymerase complex(GO:0016035) |
| 0.0 | 0.1 | GO:0030868 | smooth endoplasmic reticulum membrane(GO:0030868) smooth endoplasmic reticulum part(GO:0097425) |
| 0.0 | 0.1 | GO:1990761 | growth cone lamellipodium(GO:1990761) |
| 0.0 | 0.2 | GO:0030870 | Mre11 complex(GO:0030870) |
| 0.0 | 0.1 | GO:0042584 | chromaffin granule membrane(GO:0042584) |
| 0.0 | 0.4 | GO:0000930 | gamma-tubulin complex(GO:0000930) |
| 0.0 | 0.1 | GO:0008091 | spectrin(GO:0008091) cuticular plate(GO:0032437) |
| 0.0 | 0.1 | GO:1990745 | EARP complex(GO:1990745) |
| 0.0 | 0.2 | GO:0071821 | FANCM-MHF complex(GO:0071821) |
| 0.0 | 0.2 | GO:0005964 | phosphorylase kinase complex(GO:0005964) |
| 0.0 | 0.1 | GO:0061673 | mitotic spindle astral microtubule(GO:0061673) |
| 0.0 | 0.1 | GO:0061689 | tricellular tight junction(GO:0061689) |
| 0.0 | 0.0 | GO:0070552 | BRISC complex(GO:0070552) |
| 0.0 | 0.3 | GO:0097449 | astrocyte projection(GO:0097449) |
| 0.0 | 0.1 | GO:0070695 | FHF complex(GO:0070695) |
| 0.0 | 0.1 | GO:0070545 | PeBoW complex(GO:0070545) |
| 0.0 | 0.1 | GO:0055087 | Ski complex(GO:0055087) |
| 0.0 | 0.0 | GO:0009330 | DNA topoisomerase complex (ATP-hydrolyzing)(GO:0009330) |
| 0.0 | 0.3 | GO:0005916 | fascia adherens(GO:0005916) |
| 0.0 | 0.4 | GO:0031307 | integral component of mitochondrial outer membrane(GO:0031307) |
| 0.0 | 0.7 | GO:0043034 | costamere(GO:0043034) |
| 0.0 | 0.4 | GO:0097228 | sperm principal piece(GO:0097228) |
| 0.0 | 0.2 | GO:0030014 | CCR4-NOT complex(GO:0030014) |
| 0.0 | 0.2 | GO:0070531 | BRCA1-A complex(GO:0070531) |
| 0.0 | 0.1 | GO:0005663 | DNA replication factor C complex(GO:0005663) |
| 0.0 | 0.4 | GO:1902711 | GABA-A receptor complex(GO:1902711) |
| 0.0 | 0.4 | GO:0035145 | exon-exon junction complex(GO:0035145) |
| 0.0 | 0.1 | GO:0070187 | telosome(GO:0070187) |
| 0.0 | 0.2 | GO:0000778 | condensed nuclear chromosome kinetochore(GO:0000778) |
| 0.0 | 0.2 | GO:0031011 | Ino80 complex(GO:0031011) DNA helicase complex(GO:0033202) |
| 0.0 | 0.1 | GO:0000796 | condensin complex(GO:0000796) |
| 0.0 | 0.1 | GO:0046696 | lipopolysaccharide receptor complex(GO:0046696) |
| 0.0 | 0.0 | GO:1990421 | subtelomeric heterochromatin(GO:1990421) nuclear subtelomeric heterochromatin(GO:1990707) |
| 0.0 | 0.1 | GO:0005826 | actomyosin contractile ring(GO:0005826) |
| 0.0 | 0.1 | GO:0000220 | vacuolar proton-transporting V-type ATPase, V0 domain(GO:0000220) |
| 0.0 | 0.2 | GO:0005675 | holo TFIIH complex(GO:0005675) |
| 0.0 | 0.2 | GO:0044224 | juxtaparanode region of axon(GO:0044224) |
| 0.0 | 0.1 | GO:0097165 | nuclear stress granule(GO:0097165) |
| 0.0 | 0.1 | GO:0098839 | postsynaptic density membrane(GO:0098839) |
| 0.0 | 0.1 | GO:0005606 | laminin-1 complex(GO:0005606) |
| 0.0 | 0.8 | GO:0030864 | cortical actin cytoskeleton(GO:0030864) |
| 0.0 | 0.8 | GO:0005876 | spindle microtubule(GO:0005876) |
| 0.0 | 0.2 | GO:0016327 | apicolateral plasma membrane(GO:0016327) |
| 0.0 | 0.1 | GO:0036057 | filtration diaphragm(GO:0036056) slit diaphragm(GO:0036057) |
| 0.0 | 0.1 | GO:0031313 | extrinsic component of endosome membrane(GO:0031313) |
| 0.0 | 0.1 | GO:0005955 | calcineurin complex(GO:0005955) |
| 0.0 | 0.1 | GO:0035253 | ciliary rootlet(GO:0035253) |
| 0.0 | 0.2 | GO:0097431 | mitotic spindle pole(GO:0097431) |
| 0.0 | 0.1 | GO:0008282 | ATP-sensitive potassium channel complex(GO:0008282) |
| 0.0 | 0.0 | GO:0060053 | neurofilament cytoskeleton(GO:0060053) |
| 0.0 | 0.1 | GO:0031904 | endosome lumen(GO:0031904) |
| 0.0 | 0.5 | GO:0009925 | basal plasma membrane(GO:0009925) |
| 0.0 | 0.1 | GO:0001533 | cornified envelope(GO:0001533) |
| 0.0 | 0.3 | GO:0033017 | sarcoplasmic reticulum membrane(GO:0033017) |
| 0.0 | 0.1 | GO:0031258 | lamellipodium membrane(GO:0031258) |
| 0.0 | 0.1 | GO:0034388 | Pwp2p-containing subcomplex of 90S preribosome(GO:0034388) |
| 0.0 | 0.4 | GO:0071339 | MLL1/2 complex(GO:0044665) MLL1 complex(GO:0071339) |
| 0.0 | 0.5 | GO:0002102 | podosome(GO:0002102) |
| 0.0 | 0.1 | GO:0070652 | HAUS complex(GO:0070652) |
| 0.0 | 0.1 | GO:0042405 | nuclear inclusion body(GO:0042405) |
| 0.0 | 0.1 | GO:1990316 | ATG1/ULK1 kinase complex(GO:1990316) |
| 0.0 | 0.1 | GO:0034464 | BBSome(GO:0034464) |
| 0.0 | 0.0 | GO:0098592 | cytoplasmic side of apical plasma membrane(GO:0098592) |
| 0.0 | 0.0 | GO:0031074 | nucleocytoplasmic shuttling complex(GO:0031074) |
| 0.0 | 1.5 | GO:0044450 | microtubule organizing center part(GO:0044450) |
| 0.0 | 0.0 | GO:0018444 | translation release factor complex(GO:0018444) |
| 0.0 | 0.0 | GO:0032021 | NELF complex(GO:0032021) |
| 0.0 | 0.1 | GO:0031415 | NatA complex(GO:0031415) |
| 0.0 | 0.0 | GO:0000408 | EKC/KEOPS complex(GO:0000408) |
Gene overrepresentation in molecular function category:
| Log-likelihood per target | Total log-likelihood | Term | Description |
|---|---|---|---|
| 0.2 | 0.8 | GO:0005219 | ryanodine-sensitive calcium-release channel activity(GO:0005219) |
| 0.2 | 0.9 | GO:0050833 | pyruvate transmembrane transporter activity(GO:0050833) |
| 0.1 | 0.4 | GO:0047237 | glucuronylgalactosylproteoglycan 4-beta-N-acetylgalactosaminyltransferase activity(GO:0047237) |
| 0.1 | 0.4 | GO:0042895 | antibiotic transporter activity(GO:0042895) |
| 0.1 | 0.5 | GO:0004948 | calcitonin gene-related peptide receptor activity(GO:0001635) calcitonin receptor activity(GO:0004948) |
| 0.1 | 0.4 | GO:0015234 | thiamine transmembrane transporter activity(GO:0015234) |
| 0.1 | 0.3 | GO:0015265 | urea channel activity(GO:0015265) |
| 0.1 | 0.5 | GO:0048101 | calcium- and calmodulin-regulated 3',5'-cyclic-GMP phosphodiesterase activity(GO:0048101) |
| 0.1 | 0.5 | GO:0090555 | phosphatidylethanolamine-translocating ATPase activity(GO:0090555) |
| 0.1 | 0.4 | GO:0004822 | isoleucine-tRNA ligase activity(GO:0004822) |
| 0.1 | 0.8 | GO:0019992 | diacylglycerol binding(GO:0019992) |
| 0.1 | 0.3 | GO:0004874 | aryl hydrocarbon receptor activity(GO:0004874) |
| 0.1 | 0.2 | GO:0032810 | sterol response element binding(GO:0032810) |
| 0.1 | 0.3 | GO:0099583 | neurotransmitter receptor activity involved in regulation of postsynaptic cytosolic calcium ion concentration(GO:0099583) |
| 0.1 | 0.4 | GO:0031802 | type 5 metabotropic glutamate receptor binding(GO:0031802) |
| 0.1 | 0.2 | GO:0047708 | biotinidase activity(GO:0047708) |
| 0.1 | 0.3 | GO:0045322 | unmethylated CpG binding(GO:0045322) |
| 0.1 | 0.2 | GO:0046976 | histone methyltransferase activity (H3-K27 specific)(GO:0046976) |
| 0.1 | 0.3 | GO:0008503 | benzodiazepine receptor activity(GO:0008503) |
| 0.1 | 0.5 | GO:0046974 | histone methyltransferase activity (H3-K9 specific)(GO:0046974) |
| 0.1 | 0.2 | GO:0001847 | opsonin receptor activity(GO:0001847) |
| 0.1 | 0.2 | GO:0071886 | 1-(4-iodo-2,5-dimethoxyphenyl)propan-2-amine binding(GO:0071886) |
| 0.1 | 1.5 | GO:0050136 | NADH dehydrogenase (ubiquinone) activity(GO:0008137) NADH dehydrogenase (quinone) activity(GO:0050136) |
| 0.1 | 0.2 | GO:0001011 | transcription factor activity, sequence-specific DNA binding, RNA polymerase recruiting(GO:0001011) transcription factor activity, TFIIB-class binding(GO:0001087) |
| 0.1 | 0.3 | GO:0009019 | tRNA (guanine-N1-)-methyltransferase activity(GO:0009019) |
| 0.0 | 0.2 | GO:0051864 | histone demethylase activity (H3-K36 specific)(GO:0051864) |
| 0.0 | 0.1 | GO:0071791 | chemokine (C-C motif) ligand 5 binding(GO:0071791) |
| 0.0 | 0.3 | GO:0001609 | G-protein coupled adenosine receptor activity(GO:0001609) |
| 0.0 | 0.2 | GO:0008499 | UDP-galactose:beta-N-acetylglucosamine beta-1,3-galactosyltransferase activity(GO:0008499) |
| 0.0 | 0.1 | GO:0004657 | proline dehydrogenase activity(GO:0004657) |
| 0.0 | 0.2 | GO:0008321 | Ral guanyl-nucleotide exchange factor activity(GO:0008321) |
| 0.0 | 0.9 | GO:0001222 | transcription corepressor binding(GO:0001222) |
| 0.0 | 0.1 | GO:0031770 | growth hormone-releasing hormone receptor binding(GO:0031770) |
| 0.0 | 0.3 | GO:0017150 | tRNA dihydrouridine synthase activity(GO:0017150) |
| 0.0 | 0.4 | GO:0086080 | protein binding involved in heterotypic cell-cell adhesion(GO:0086080) |
| 0.0 | 0.4 | GO:0015386 | potassium:proton antiporter activity(GO:0015386) |
| 0.0 | 0.8 | GO:0003950 | NAD+ ADP-ribosyltransferase activity(GO:0003950) |
| 0.0 | 0.3 | GO:0022821 | calcium, potassium:sodium antiporter activity(GO:0008273) potassium ion antiporter activity(GO:0022821) |
| 0.0 | 0.2 | GO:0019237 | centromeric DNA binding(GO:0019237) |
| 0.0 | 0.4 | GO:0102337 | fatty acid elongase activity(GO:0009922) 3-oxo-arachidoyl-CoA synthase activity(GO:0102336) 3-oxo-cerotoyl-CoA synthase activity(GO:0102337) 3-oxo-lignoceronyl-CoA synthase activity(GO:0102338) |
| 0.0 | 0.4 | GO:0030346 | protein phosphatase 2B binding(GO:0030346) |
| 0.0 | 0.2 | GO:0048248 | CXCR3 chemokine receptor binding(GO:0048248) |
| 0.0 | 0.1 | GO:0042498 | Toll-like receptor 2 binding(GO:0035663) diacyl lipopeptide binding(GO:0042498) |
| 0.0 | 0.1 | GO:0015203 | polyamine transmembrane transporter activity(GO:0015203) putrescine transmembrane transporter activity(GO:0015489) |
| 0.0 | 0.4 | GO:0016909 | JUN kinase activity(GO:0004705) SAP kinase activity(GO:0016909) |
| 0.0 | 0.2 | GO:0016300 | tRNA (uracil) methyltransferase activity(GO:0016300) |
| 0.0 | 0.2 | GO:0034714 | type III transforming growth factor beta receptor binding(GO:0034714) |
| 0.0 | 0.2 | GO:0000829 | inositol heptakisphosphate kinase activity(GO:0000829) |
| 0.0 | 0.2 | GO:0086059 | voltage-gated calcium channel activity involved SA node cell action potential(GO:0086059) |
| 0.0 | 0.1 | GO:0002046 | opsin binding(GO:0002046) |
| 0.0 | 0.2 | GO:0001594 | trace-amine receptor activity(GO:0001594) |
| 0.0 | 0.7 | GO:0043008 | ATP-dependent protein binding(GO:0043008) |
| 0.0 | 0.1 | GO:0000386 | second spliceosomal transesterification activity(GO:0000386) |
| 0.0 | 0.1 | GO:0001641 | group II metabotropic glutamate receptor activity(GO:0001641) |
| 0.0 | 0.4 | GO:0051011 | microtubule minus-end binding(GO:0051011) |
| 0.0 | 0.1 | GO:0016716 | oxidoreductase activity, acting on paired donors, with incorporation or reduction of molecular oxygen, another compound as one donor, and incorporation of one atom of oxygen(GO:0016716) |
| 0.0 | 0.2 | GO:0008970 | phosphatidylcholine 1-acylhydrolase activity(GO:0008970) |
| 0.0 | 0.1 | GO:0050253 | retinyl-palmitate esterase activity(GO:0050253) |
| 0.0 | 0.1 | GO:1990955 | G-rich single-stranded DNA binding(GO:1990955) |
| 0.0 | 0.1 | GO:0070905 | serine binding(GO:0070905) |
| 0.0 | 0.2 | GO:0016262 | protein N-acetylglucosaminyltransferase activity(GO:0016262) |
| 0.0 | 0.1 | GO:0004809 | tRNA (guanine-N2-)-methyltransferase activity(GO:0004809) |
| 0.0 | 0.2 | GO:0004957 | prostaglandin E receptor activity(GO:0004957) |
| 0.0 | 0.1 | GO:0004963 | follicle-stimulating hormone receptor activity(GO:0004963) |
| 0.0 | 0.1 | GO:0050252 | retinol O-fatty-acyltransferase activity(GO:0050252) |
| 0.0 | 0.1 | GO:0042030 | ATPase inhibitor activity(GO:0042030) |
| 0.0 | 0.2 | GO:0051880 | G-quadruplex DNA binding(GO:0051880) |
| 0.0 | 0.2 | GO:0004468 | lysine N-acetyltransferase activity, acting on acetyl phosphate as donor(GO:0004468) |
| 0.0 | 0.1 | GO:0072590 | N-acetyl-L-aspartate-L-glutamate ligase activity(GO:0072590) |
| 0.0 | 0.2 | GO:0004694 | eukaryotic translation initiation factor 2alpha kinase activity(GO:0004694) |
| 0.0 | 0.6 | GO:0002162 | dystroglycan binding(GO:0002162) |
| 0.0 | 0.1 | GO:0030348 | syntaxin-3 binding(GO:0030348) |
| 0.0 | 0.2 | GO:0004972 | NMDA glutamate receptor activity(GO:0004972) |
| 0.0 | 0.1 | GO:0005157 | macrophage colony-stimulating factor receptor binding(GO:0005157) |
| 0.0 | 0.4 | GO:0015125 | bile acid transmembrane transporter activity(GO:0015125) |
| 0.0 | 0.2 | GO:0042834 | peptidoglycan binding(GO:0042834) |
| 0.0 | 0.5 | GO:0034237 | protein kinase A regulatory subunit binding(GO:0034237) |
| 0.0 | 0.4 | GO:0004012 | phospholipid-translocating ATPase activity(GO:0004012) |
| 0.0 | 0.4 | GO:0045295 | gamma-catenin binding(GO:0045295) |
| 0.0 | 0.3 | GO:0005003 | ephrin receptor activity(GO:0005003) |
| 0.0 | 0.2 | GO:0015277 | kainate selective glutamate receptor activity(GO:0015277) |
| 0.0 | 0.1 | GO:0005087 | Ran guanyl-nucleotide exchange factor activity(GO:0005087) |
| 0.0 | 0.1 | GO:0047499 | calcium-independent phospholipase A2 activity(GO:0047499) |
| 0.0 | 0.2 | GO:0030274 | LIM domain binding(GO:0030274) |
| 0.0 | 0.1 | GO:0086056 | voltage-gated calcium channel activity involved in AV node cell action potential(GO:0086056) |
| 0.0 | 0.3 | GO:0005542 | folic acid binding(GO:0005542) |
| 0.0 | 0.1 | GO:0005042 | netrin receptor activity(GO:0005042) |
| 0.0 | 0.7 | GO:0050681 | androgen receptor binding(GO:0050681) |
| 0.0 | 0.2 | GO:0004689 | phosphorylase kinase activity(GO:0004689) |
| 0.0 | 0.4 | GO:0031402 | sodium ion binding(GO:0031402) |
| 0.0 | 0.2 | GO:0015193 | L-proline transmembrane transporter activity(GO:0015193) |
| 0.0 | 0.1 | GO:0070051 | fibrinogen binding(GO:0070051) |
| 0.0 | 0.2 | GO:0008046 | axon guidance receptor activity(GO:0008046) |
| 0.0 | 0.1 | GO:0000405 | bubble DNA binding(GO:0000405) |
| 0.0 | 0.2 | GO:0004385 | guanylate kinase activity(GO:0004385) |
| 0.0 | 0.1 | GO:0035800 | deubiquitinase activator activity(GO:0035800) |
| 0.0 | 0.1 | GO:0032554 | purine deoxyribonucleotide binding(GO:0032554) |
| 0.0 | 0.1 | GO:0003989 | acetyl-CoA carboxylase activity(GO:0003989) |
| 0.0 | 0.2 | GO:0009931 | calcium-dependent protein serine/threonine kinase activity(GO:0009931) |
| 0.0 | 0.2 | GO:0008239 | dipeptidyl-peptidase activity(GO:0008239) |
| 0.0 | 0.1 | GO:0001875 | lipopolysaccharide receptor activity(GO:0001875) |
| 0.0 | 0.1 | GO:0047023 | androsterone dehydrogenase activity(GO:0047023) |
| 0.0 | 0.1 | GO:0070290 | N-acylphosphatidylethanolamine-specific phospholipase D activity(GO:0070290) |
| 0.0 | 0.0 | GO:0016608 | growth hormone-releasing hormone activity(GO:0016608) |
| 0.0 | 0.2 | GO:0019966 | interleukin-1 binding(GO:0019966) |
| 0.0 | 0.1 | GO:0060230 | lipoprotein lipase activator activity(GO:0060230) |
| 0.0 | 0.1 | GO:0008281 | sulfonylurea receptor activity(GO:0008281) |
| 0.0 | 0.2 | GO:0016813 | hydrolase activity, acting on carbon-nitrogen (but not peptide) bonds, in linear amidines(GO:0016813) |
| 0.0 | 0.6 | GO:0032266 | phosphatidylinositol-3-phosphate binding(GO:0032266) |
| 0.0 | 0.3 | GO:0008574 | ATP-dependent microtubule motor activity, plus-end-directed(GO:0008574) |
| 0.0 | 0.2 | GO:0017017 | MAP kinase tyrosine/serine/threonine phosphatase activity(GO:0017017) |
| 0.0 | 0.1 | GO:0004719 | protein-L-isoaspartate (D-aspartate) O-methyltransferase activity(GO:0004719) |
| 0.0 | 0.1 | GO:0008310 | single-stranded DNA 3'-5' exodeoxyribonuclease activity(GO:0008310) |
| 0.0 | 0.2 | GO:0004115 | 3',5'-cyclic-AMP phosphodiesterase activity(GO:0004115) |
| 0.0 | 0.4 | GO:0004003 | ATP-dependent DNA helicase activity(GO:0004003) |
| 0.0 | 0.0 | GO:0000991 | transcription factor activity, core RNA polymerase II binding(GO:0000991) |
| 0.0 | 0.2 | GO:0072349 | modified amino acid transmembrane transporter activity(GO:0072349) |
| 0.0 | 0.1 | GO:0016174 | NAD(P)H oxidase activity(GO:0016174) |
| 0.0 | 0.2 | GO:0050321 | tau-protein kinase activity(GO:0050321) |
| 0.0 | 0.0 | GO:0009384 | N-acylmannosamine kinase activity(GO:0009384) |
| 0.0 | 0.1 | GO:0003796 | lysozyme activity(GO:0003796) |
| 0.0 | 0.4 | GO:0070530 | K63-linked polyubiquitin binding(GO:0070530) |
| 0.0 | 0.3 | GO:0004623 | phospholipase A2 activity(GO:0004623) |
| 0.0 | 0.3 | GO:0005523 | tropomyosin binding(GO:0005523) |
| 0.0 | 0.1 | GO:0034046 | poly(G) binding(GO:0034046) |
| 0.0 | 0.4 | GO:0015035 | protein disulfide oxidoreductase activity(GO:0015035) |
| 0.0 | 0.2 | GO:0045499 | chemorepellent activity(GO:0045499) |
| 0.0 | 0.1 | GO:0016647 | oxidoreductase activity, acting on the CH-NH group of donors, oxygen as acceptor(GO:0016647) |
| 0.0 | 0.1 | GO:0016286 | small conductance calcium-activated potassium channel activity(GO:0016286) |
| 0.0 | 0.1 | GO:0015245 | fatty acid transporter activity(GO:0015245) |
| 0.0 | 0.1 | GO:0070087 | chromo shadow domain binding(GO:0070087) |
| 0.0 | 0.0 | GO:0004307 | ethanolaminephosphotransferase activity(GO:0004307) |
| 0.0 | 0.3 | GO:0017128 | phospholipid scramblase activity(GO:0017128) |
| 0.0 | 0.6 | GO:0017112 | Rab guanyl-nucleotide exchange factor activity(GO:0017112) |
| 0.0 | 0.4 | GO:0005452 | inorganic anion exchanger activity(GO:0005452) |
| 0.0 | 0.1 | GO:0030144 | alpha-1,6-mannosylglycoprotein 6-beta-N-acetylglucosaminyltransferase activity(GO:0030144) |
| 0.0 | 0.4 | GO:0001103 | RNA polymerase II repressing transcription factor binding(GO:0001103) |
| 0.0 | 0.1 | GO:0008349 | MAP kinase kinase kinase kinase activity(GO:0008349) |
| 0.0 | 0.1 | GO:0031078 | histone deacetylase activity (H3-K14 specific)(GO:0031078) NAD-dependent histone deacetylase activity (H3-K14 specific)(GO:0032041) |
| 0.0 | 0.1 | GO:0000155 | phosphorelay sensor kinase activity(GO:0000155) |
| 0.0 | 0.1 | GO:0030292 | protein tyrosine kinase inhibitor activity(GO:0030292) |
| 0.0 | 0.2 | GO:0009982 | pseudouridine synthase activity(GO:0009982) |
| 0.0 | 0.3 | GO:0042288 | MHC class I protein binding(GO:0042288) |
| 0.0 | 0.2 | GO:0003678 | DNA helicase activity(GO:0003678) |
| 0.0 | 0.5 | GO:0046875 | ephrin receptor binding(GO:0046875) |
| 0.0 | 0.2 | GO:0004198 | calcium-dependent cysteine-type endopeptidase activity(GO:0004198) |
| 0.0 | 0.0 | GO:0004335 | galactokinase activity(GO:0004335) |
| 0.0 | 0.2 | GO:0051400 | BH domain binding(GO:0051400) |
| 0.0 | 0.1 | GO:0010861 | thyroid hormone receptor activator activity(GO:0010861) |
| 0.0 | 0.0 | GO:0035529 | NADH pyrophosphatase activity(GO:0035529) |
| 0.0 | 0.1 | GO:0031685 | adenosine receptor binding(GO:0031685) |
| 0.0 | 0.2 | GO:0004535 | poly(A)-specific ribonuclease activity(GO:0004535) |
| 0.0 | 0.0 | GO:0061575 | cyclin-dependent protein serine/threonine kinase activator activity(GO:0061575) |
| 0.0 | 0.2 | GO:0005242 | inward rectifier potassium channel activity(GO:0005242) |
| 0.0 | 0.1 | GO:0016018 | cyclosporin A binding(GO:0016018) |
| 0.0 | 0.1 | GO:0000340 | RNA 7-methylguanosine cap binding(GO:0000340) |
| 0.0 | 0.3 | GO:0070840 | dynein complex binding(GO:0070840) |
| 0.0 | 0.1 | GO:0042608 | T cell receptor binding(GO:0042608) |
| 0.0 | 0.1 | GO:0016840 | carbon-nitrogen lyase activity(GO:0016840) |
| 0.0 | 0.1 | GO:0030306 | ADP-ribosylation factor binding(GO:0030306) |
| 0.0 | 0.1 | GO:0004887 | thyroid hormone receptor activity(GO:0004887) |
| 0.0 | 0.2 | GO:0035497 | cAMP response element binding(GO:0035497) |
| 0.0 | 0.1 | GO:0042043 | neurexin family protein binding(GO:0042043) |
| 0.0 | 0.3 | GO:0000983 | transcription factor activity, RNA polymerase II core promoter sequence-specific(GO:0000983) |
| 0.0 | 0.2 | GO:0004629 | phosphatidylinositol phospholipase C activity(GO:0004435) phospholipase C activity(GO:0004629) |
Gene overrepresentation in curated gene sets: canonical pathways category:
| Log-likelihood per target | Total log-likelihood | Term | Description |
|---|---|---|---|
| 0.0 | 0.7 | PID WNT CANONICAL PATHWAY | Canonical Wnt signaling pathway |
| 0.0 | 0.1 | PID TCR RAS PATHWAY | Ras signaling in the CD4+ TCR pathway |
| 0.0 | 0.3 | PID TCR JNK PATHWAY | JNK signaling in the CD4+ TCR pathway |
| 0.0 | 0.4 | PID ARF 3PATHWAY | Arf1 pathway |
| 0.0 | 0.7 | PID AR NONGENOMIC PATHWAY | Nongenotropic Androgen signaling |
| 0.0 | 0.2 | SA B CELL RECEPTOR COMPLEXES | Antigen binding to B cell receptors activates protein tyrosine kinases, such as the Src family, which ultimate activate MAP kinases. |
| 0.0 | 0.6 | PID IFNG PATHWAY | IFN-gamma pathway |
| 0.0 | 0.4 | PID GLYPICAN 1PATHWAY | Glypican 1 network |
| 0.0 | 0.3 | PID ERBB NETWORK PATHWAY | ErbB receptor signaling network |
| 0.0 | 0.3 | PID ERBB2 ERBB3 PATHWAY | ErbB2/ErbB3 signaling events |
| 0.0 | 0.2 | PID NEPHRIN NEPH1 PATHWAY | Nephrin/Neph1 signaling in the kidney podocyte |
| 0.0 | 0.8 | PID FANCONI PATHWAY | Fanconi anemia pathway |
| 0.0 | 0.5 | PID HEDGEHOG GLI PATHWAY | Hedgehog signaling events mediated by Gli proteins |
| 0.0 | 0.1 | PID RHODOPSIN PATHWAY | Visual signal transduction: Rods |
| 0.0 | 0.4 | PID IL12 STAT4 PATHWAY | IL12 signaling mediated by STAT4 |
| 0.0 | 0.2 | PID WNT NONCANONICAL PATHWAY | Noncanonical Wnt signaling pathway |
| 0.0 | 0.5 | PID RAS PATHWAY | Regulation of Ras family activation |
| 0.0 | 0.1 | PID ANTHRAX PATHWAY | Cellular roles of Anthrax toxin |
| 0.0 | 0.9 | PID AR PATHWAY | Coregulation of Androgen receptor activity |
| 0.0 | 0.5 | PID EPHA FWDPATHWAY | EPHA forward signaling |
| 0.0 | 0.2 | PID HIF1A PATHWAY | Hypoxic and oxygen homeostasis regulation of HIF-1-alpha |
| 0.0 | 0.3 | PID TOLL ENDOGENOUS PATHWAY | Endogenous TLR signaling |
| 0.0 | 0.4 | PID ARF6 PATHWAY | Arf6 signaling events |
| 0.0 | 0.2 | PID REELIN PATHWAY | Reelin signaling pathway |
| 0.0 | 0.2 | PID P38 ALPHA BETA PATHWAY | Regulation of p38-alpha and p38-beta |
| 0.0 | 0.7 | PID LKB1 PATHWAY | LKB1 signaling events |
| 0.0 | 0.3 | PID TCPTP PATHWAY | Signaling events mediated by TCPTP |
| 0.0 | 0.2 | PID ERBB4 PATHWAY | ErbB4 signaling events |
| 0.0 | 0.1 | PID S1P META PATHWAY | Sphingosine 1-phosphate (S1P) pathway |
| 0.0 | 0.1 | PID CXCR3 PATHWAY | CXCR3-mediated signaling events |
Gene overrepresentation in curated gene sets: REACTOME pathways category:
| Log-likelihood per target | Total log-likelihood | Term | Description |
|---|---|---|---|
| 0.1 | 0.7 | REACTOME BILE SALT AND ORGANIC ANION SLC TRANSPORTERS | Genes involved in Bile salt and organic anion SLC transporters |
| 0.0 | 0.7 | REACTOME DOPAMINE NEUROTRANSMITTER RELEASE CYCLE | Genes involved in Dopamine Neurotransmitter Release Cycle |
| 0.0 | 0.5 | REACTOME GLUTAMATE NEUROTRANSMITTER RELEASE CYCLE | Genes involved in Glutamate Neurotransmitter Release Cycle |
| 0.0 | 0.8 | REACTOME INSULIN SYNTHESIS AND PROCESSING | Genes involved in Insulin Synthesis and Processing |
| 0.0 | 0.5 | REACTOME ACTIVATION OF THE AP1 FAMILY OF TRANSCRIPTION FACTORS | Genes involved in Activation of the AP-1 family of transcription factors |
| 0.0 | 0.1 | REACTOME BINDING AND ENTRY OF HIV VIRION | Genes involved in Binding and entry of HIV virion |
| 0.0 | 0.2 | REACTOME TRANSLOCATION OF ZAP 70 TO IMMUNOLOGICAL SYNAPSE | Genes involved in Translocation of ZAP-70 to Immunological synapse |
| 0.0 | 0.2 | REACTOME ABACAVIR TRANSPORT AND METABOLISM | Genes involved in Abacavir transport and metabolism |
| 0.0 | 0.3 | REACTOME P2Y RECEPTORS | Genes involved in P2Y receptors |
| 0.0 | 0.4 | REACTOME SEROTONIN RECEPTORS | Genes involved in Serotonin receptors |
| 0.0 | 0.2 | REACTOME PROSTANOID LIGAND RECEPTORS | Genes involved in Prostanoid ligand receptors |
| 0.0 | 0.0 | REACTOME VIRAL MESSENGER RNA SYNTHESIS | Genes involved in Viral Messenger RNA Synthesis |
| 0.0 | 0.5 | REACTOME CHONDROITIN SULFATE BIOSYNTHESIS | Genes involved in Chondroitin sulfate biosynthesis |
| 0.0 | 0.4 | REACTOME GABA A RECEPTOR ACTIVATION | Genes involved in GABA A receptor activation |
| 0.0 | 0.3 | REACTOME ACYL CHAIN REMODELLING OF PG | Genes involved in Acyl chain remodelling of PG |
| 0.0 | 0.4 | REACTOME UNBLOCKING OF NMDA RECEPTOR GLUTAMATE BINDING AND ACTIVATION | Genes involved in Unblocking of NMDA receptor, glutamate binding and activation |
| 0.0 | 0.2 | REACTOME THE NLRP3 INFLAMMASOME | Genes involved in The NLRP3 inflammasome |
| 0.0 | 0.4 | REACTOME FANCONI ANEMIA PATHWAY | Genes involved in Fanconi Anemia pathway |
| 0.0 | 0.5 | REACTOME CGMP EFFECTS | Genes involved in cGMP effects |
| 0.0 | 0.2 | REACTOME IRAK2 MEDIATED ACTIVATION OF TAK1 COMPLEX UPON TLR7 8 OR 9 STIMULATION | Genes involved in IRAK2 mediated activation of TAK1 complex upon TLR7/8 or 9 stimulation |
| 0.0 | 0.3 | REACTOME TRAF6 MEDIATED IRF7 ACTIVATION | Genes involved in TRAF6 mediated IRF7 activation |
| 0.0 | 0.3 | REACTOME SYNTHESIS OF VERY LONG CHAIN FATTY ACYL COAS | Genes involved in Synthesis of very long-chain fatty acyl-CoAs |
| 0.0 | 0.4 | REACTOME HOMOLOGOUS RECOMBINATION REPAIR OF REPLICATION INDEPENDENT DOUBLE STRAND BREAKS | Genes involved in Homologous recombination repair of replication-independent double-strand breaks |
| 0.0 | 0.1 | REACTOME REGULATION OF ORNITHINE DECARBOXYLASE ODC | Genes involved in Regulation of ornithine decarboxylase (ODC) |
| 0.0 | 0.1 | REACTOME RECYCLING OF BILE ACIDS AND SALTS | Genes involved in Recycling of bile acids and salts |
| 0.0 | 0.3 | REACTOME TGF BETA RECEPTOR SIGNALING IN EMT EPITHELIAL TO MESENCHYMAL TRANSITION | Genes involved in TGF-beta receptor signaling in EMT (epithelial to mesenchymal transition) |
| 0.0 | 0.8 | REACTOME VOLTAGE GATED POTASSIUM CHANNELS | Genes involved in Voltage gated Potassium channels |
| 0.0 | 0.4 | REACTOME DEADENYLATION OF MRNA | Genes involved in Deadenylation of mRNA |
| 0.0 | 0.1 | REACTOME FATTY ACYL COA BIOSYNTHESIS | Genes involved in Fatty Acyl-CoA Biosynthesis |
| 0.0 | 0.1 | REACTOME TRAF6 MEDIATED INDUCTION OF TAK1 COMPLEX | Genes involved in TRAF6 mediated induction of TAK1 complex |
| 0.0 | 0.1 | REACTOME PHOSPHORYLATION OF CD3 AND TCR ZETA CHAINS | Genes involved in Phosphorylation of CD3 and TCR zeta chains |
| 0.0 | 0.2 | REACTOME GPVI MEDIATED ACTIVATION CASCADE | Genes involved in GPVI-mediated activation cascade |
| 0.0 | 0.1 | REACTOME ACYL CHAIN REMODELLING OF PE | Genes involved in Acyl chain remodelling of PE |
| 0.0 | 0.2 | REACTOME NEGATIVE REGULATORS OF RIG I MDA5 SIGNALING | Genes involved in Negative regulators of RIG-I/MDA5 signaling |
| 0.0 | 0.2 | REACTOME SIGNAL REGULATORY PROTEIN SIRP FAMILY INTERACTIONS | Genes involved in Signal regulatory protein (SIRP) family interactions |
| 0.0 | 0.3 | REACTOME DEPOSITION OF NEW CENPA CONTAINING NUCLEOSOMES AT THE CENTROMERE | Genes involved in Deposition of New CENPA-containing Nucleosomes at the Centromere |
| 0.0 | 0.1 | REACTOME JNK C JUN KINASES PHOSPHORYLATION AND ACTIVATION MEDIATED BY ACTIVATED HUMAN TAK1 | Genes involved in JNK (c-Jun kinases) phosphorylation and activation mediated by activated human TAK1 |
| 0.0 | 0.3 | REACTOME NEPHRIN INTERACTIONS | Genes involved in Nephrin interactions |
| 0.0 | 0.1 | REACTOME ORGANIC CATION ANION ZWITTERION TRANSPORT | Genes involved in Organic cation/anion/zwitterion transport |
| 0.0 | 0.2 | REACTOME MITOCHONDRIAL TRNA AMINOACYLATION | Genes involved in Mitochondrial tRNA aminoacylation |
| 0.0 | 0.2 | REACTOME INTRINSIC PATHWAY | Genes involved in Intrinsic Pathway |
| 0.0 | 0.3 | REACTOME SIGNALING BY FGFR1 FUSION MUTANTS | Genes involved in Signaling by FGFR1 fusion mutants |
| 0.0 | 0.5 | REACTOME AMINO ACID AND OLIGOPEPTIDE SLC TRANSPORTERS | Genes involved in Amino acid and oligopeptide SLC transporters |
| 0.0 | 0.6 | REACTOME TRANSPORT OF INORGANIC CATIONS ANIONS AND AMINO ACIDS OLIGOPEPTIDES | Genes involved in Transport of inorganic cations/anions and amino acids/oligopeptides |
| 0.0 | 0.3 | REACTOME MYOGENESIS | Genes involved in Myogenesis |
| 0.0 | 0.1 | REACTOME SYNTHESIS OF PE | Genes involved in Synthesis of PE |
| 0.0 | 0.2 | REACTOME REGULATION OF HYPOXIA INDUCIBLE FACTOR HIF BY OXYGEN | Genes involved in Regulation of Hypoxia-inducible Factor (HIF) by Oxygen |
| 0.0 | 0.3 | REACTOME INTEGRIN ALPHAIIB BETA3 SIGNALING | Genes involved in Integrin alphaIIb beta3 signaling |
| 0.0 | 0.1 | REACTOME APOPTOSIS INDUCED DNA FRAGMENTATION | Genes involved in Apoptosis induced DNA fragmentation |