Project
GSE49485: Hypoxia transcriptome sequencing of rat brain.
Navigation
Downloads
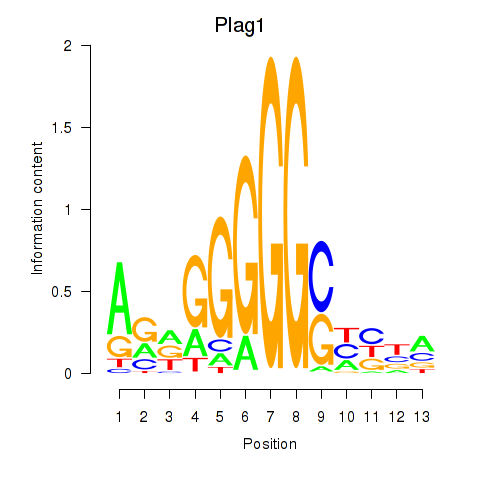
Results for Plag1
Z-value: 0.58
Motif logo
Transcription factors associated with Plag1
| Gene Symbol | Gene ID | Gene Info |
|---|---|---|
|
Plag1
|
ENSRNOG00000008846 | PLAG1 zinc finger |
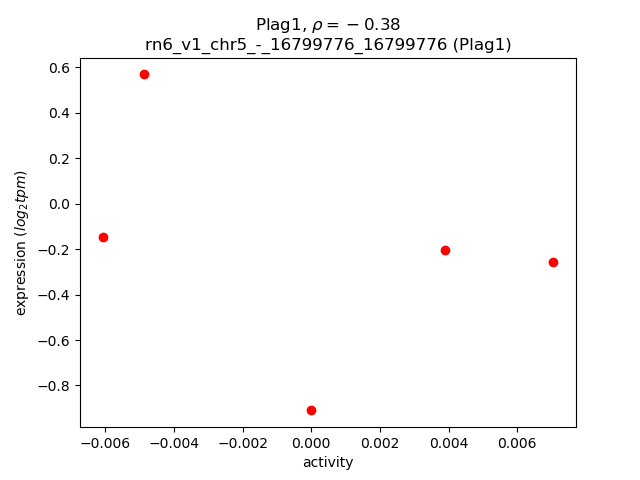
Activity-expression correlation:
| Gene | Promoter | Pearson corr. coef. | P-value | Plot |
|---|---|---|---|---|
| Plag1 | rn6_v1_chr5_-_16799776_16799776 | -0.38 | 5.3e-01 | Click! |
Activity profile of Plag1 motif
Sorted Z-values of Plag1 motif
| Promoter | Log-likelihood | Transcript | Gene | Gene Info |
|---|---|---|---|---|
| chr6_+_135856218 | 0.36 |
ENSRNOT00000066715
|
RGD1560608
|
similar to novel protein |
| chr5_-_151709877 | 0.30 |
ENSRNOT00000080602
|
Trnp1
|
TMF1-regulated nuclear protein 1 |
| chr5_-_156811650 | 0.19 |
ENSRNOT00000068065
|
Fam43b
|
family with sequence similarity 43, member B |
| chr7_+_120580743 | 0.19 |
ENSRNOT00000017181
|
Maff
|
MAF bZIP transcription factor F |
| chr7_+_142912316 | 0.19 |
ENSRNOT00000010171
|
Nr4a1
|
nuclear receptor subfamily 4, group A, member 1 |
| chr1_+_81372650 | 0.19 |
ENSRNOT00000088829
|
Zfp428
|
zinc finger protein 428 |
| chr13_+_52887649 | 0.19 |
ENSRNOT00000048033
|
Ascl5
|
achaete-scute family bHLH transcription factor 5 |
| chr1_+_221792221 | 0.18 |
ENSRNOT00000054828
|
Nrxn2
|
neurexin 2 |
| chr1_-_80544825 | 0.18 |
ENSRNOT00000057802
ENSRNOT00000040060 ENSRNOT00000067049 ENSRNOT00000052387 ENSRNOT00000073352 |
Relb
|
RELB proto-oncogene, NF-kB subunit |
| chr8_+_59344083 | 0.18 |
ENSRNOT00000031175
|
Crabp1
|
cellular retinoic acid binding protein 1 |
| chrX_-_138148967 | 0.17 |
ENSRNOT00000033968
|
Frmd7
|
FERM domain containing 7 |
| chr3_-_13435979 | 0.17 |
ENSRNOT00000029600
|
Pbx3
|
PBX homeobox 3 |
| chr20_+_5049496 | 0.17 |
ENSRNOT00000088251
ENSRNOT00000001118 |
Ddah2
|
dimethylarginine dimethylaminohydrolase 2 |
| chr3_+_110982553 | 0.16 |
ENSRNOT00000030754
|
LOC691418
|
hypothetical protein LOC691418 |
| chr19_-_25961666 | 0.16 |
ENSRNOT00000004091
|
Calr
|
calreticulin |
| chr3_-_72289310 | 0.16 |
ENSRNOT00000038250
|
Rtn4rl2
|
reticulon 4 receptor-like 2 |
| chr12_+_47193964 | 0.16 |
ENSRNOT00000001552
ENSRNOT00000039281 |
Cabp1
|
calcium binding protein 1 |
| chr8_-_33661049 | 0.15 |
ENSRNOT00000068037
|
Fli1
|
Fli-1 proto-oncogene, ETS transcription factor |
| chr10_-_17075139 | 0.14 |
ENSRNOT00000039398
|
Neurl1b
|
neuralized E3 ubiquitin protein ligase 1B |
| chr11_-_36479868 | 0.14 |
ENSRNOT00000075762
|
LOC100911295
|
non-histone chromosomal protein HMG-14-like |
| chr15_-_34469746 | 0.13 |
ENSRNOT00000027719
|
Adcy4
|
adenylate cyclase 4 |
| chr1_+_80135391 | 0.13 |
ENSRNOT00000021893
|
Gpr4
|
G protein-coupled receptor 4 |
| chr7_+_70364813 | 0.13 |
ENSRNOT00000084012
ENSRNOT00000031230 |
Agap2
|
ArfGAP with GTPase domain, ankyrin repeat and PH domain 2 |
| chr7_-_12424367 | 0.13 |
ENSRNOT00000060698
|
Midn
|
midnolin |
| chr3_-_160853650 | 0.13 |
ENSRNOT00000018844
|
Matn4
|
matrilin 4 |
| chr20_+_7136007 | 0.13 |
ENSRNOT00000000580
|
Hmga1
|
high mobility group AT-hook 1 |
| chr18_-_28454756 | 0.13 |
ENSRNOT00000040091
|
Spata24
|
spermatogenesis associated 24 |
| chr6_-_135939534 | 0.12 |
ENSRNOT00000052237
|
Diras3
|
DIRAS family GTPase 3 |
| chr5_-_148355406 | 0.12 |
ENSRNOT00000018674
|
Hcrtr1
|
hypocretin receptor 1 |
| chr1_+_276659542 | 0.12 |
ENSRNOT00000019681
|
Tcf7l2
|
transcription factor 7 like 2 |
| chr6_-_138093643 | 0.12 |
ENSRNOT00000045874
|
Igh-6
|
immunoglobulin heavy chain 6 |
| chr1_+_101783621 | 0.11 |
ENSRNOT00000067679
|
Lmtk3
|
lemur tyrosine kinase 3 |
| chr1_-_80599572 | 0.11 |
ENSRNOT00000024832
|
Apoc4
|
apolipoprotein C4 |
| chr1_+_222519615 | 0.11 |
ENSRNOT00000083585
|
Rcor2
|
REST corepressor 2 |
| chr9_+_82674202 | 0.11 |
ENSRNOT00000027208
|
Tmem198
|
transmembrane protein 198 |
| chr4_+_99239115 | 0.11 |
ENSRNOT00000009515
|
Cd8a
|
CD8a molecule |
| chr7_-_11777503 | 0.10 |
ENSRNOT00000026220
|
Amh
|
anti-Mullerian hormone |
| chr12_-_22680630 | 0.10 |
ENSRNOT00000041808
|
Vgf
|
VGF nerve growth factor inducible |
| chr11_+_31389514 | 0.10 |
ENSRNOT00000000325
|
Olig2
|
oligodendrocyte lineage transcription factor 2 |
| chr2_+_188844073 | 0.10 |
ENSRNOT00000028117
|
Kcnn3
|
potassium calcium-activated channel subfamily N member 3 |
| chr7_-_11648322 | 0.10 |
ENSRNOT00000026871
|
Gadd45b
|
growth arrest and DNA-damage-inducible, beta |
| chr10_-_90393317 | 0.10 |
ENSRNOT00000028563
|
Fam171a2
|
family with sequence similarity 171, member A2 |
| chr15_-_34469350 | 0.10 |
ENSRNOT00000067536
|
Adcy4
|
adenylate cyclase 4 |
| chr1_-_84491466 | 0.10 |
ENSRNOT00000034609
|
Map3k10
|
mitogen activated protein kinase kinase kinase 10 |
| chr8_+_71822129 | 0.10 |
ENSRNOT00000089147
|
Dapk2
|
death-associated protein kinase 2 |
| chr15_-_4035064 | 0.10 |
ENSRNOT00000012300
|
Fut11
|
fucosyltransferase 11 |
| chr1_+_101178104 | 0.10 |
ENSRNOT00000028072
|
Pth2
|
parathyroid hormone 2 |
| chr6_-_25616995 | 0.10 |
ENSRNOT00000077894
|
Fosl2
|
FOS like 2, AP-1 transcription factor subunit |
| chr17_+_49417067 | 0.10 |
ENSRNOT00000090024
|
Pou6f2
|
POU domain, class 6, transcription factor 2 |
| chr1_+_91152635 | 0.09 |
ENSRNOT00000073438
|
LOC100912070
|
dermokine-like |
| chr15_+_51756978 | 0.09 |
ENSRNOT00000024067
|
Egr3
|
early growth response 3 |
| chr16_-_20486707 | 0.09 |
ENSRNOT00000026470
|
Jund
|
JunD proto-oncogene, AP-1 transcription factor subunit |
| chr1_-_32362359 | 0.09 |
ENSRNOT00000079987
|
Slc6a3
|
solute carrier family 6 member 3 |
| chr19_-_10620671 | 0.09 |
ENSRNOT00000021842
|
Ccl17
|
C-C motif chemokine ligand 17 |
| chr18_-_325374 | 0.09 |
ENSRNOT00000078032
ENSRNOT00000003638 |
Mtmr1
|
myotubularin related protein 1 |
| chr2_-_45518502 | 0.09 |
ENSRNOT00000014627
|
Hspb3
|
heat shock protein family B (small) member 3 |
| chr6_-_60054279 | 0.09 |
ENSRNOT00000005988
|
Scin
|
scinderin |
| chr19_-_37916813 | 0.09 |
ENSRNOT00000026585
|
Lcat
|
lecithin cholesterol acyltransferase |
| chr2_-_198719202 | 0.09 |
ENSRNOT00000028801
|
Polr3gl
|
RNA polymerase III subunit G like |
| chr3_-_164095878 | 0.09 |
ENSRNOT00000079414
|
B4galt5
|
beta-1,4-galactosyltransferase 5 |
| chr20_+_4414276 | 0.08 |
ENSRNOT00000000492
|
Atf6b
|
activating transcription factor 6 beta |
| chr6_-_46631983 | 0.08 |
ENSRNOT00000045963
|
Sox11
|
SRY box 11 |
| chr10_+_75088422 | 0.08 |
ENSRNOT00000081951
|
Mpo
|
myeloperoxidase |
| chr5_-_151396507 | 0.08 |
ENSRNOT00000012710
|
Gpr3
|
G protein-coupled receptor 3 |
| chr10_-_108196217 | 0.08 |
ENSRNOT00000075440
|
Cbx4
|
chromobox 4 |
| chr10_+_55687050 | 0.08 |
ENSRNOT00000057136
|
Per1
|
period circadian clock 1 |
| chr10_+_86950557 | 0.08 |
ENSRNOT00000014153
|
Igfbp4
|
insulin-like growth factor binding protein 4 |
| chr4_-_77489535 | 0.08 |
ENSRNOT00000008728
|
Pdia4
|
protein disulfide isomerase family A, member 4 |
| chr3_-_72171078 | 0.08 |
ENSRNOT00000009817
|
Serping1
|
serpin family G member 1 |
| chr10_-_13580821 | 0.08 |
ENSRNOT00000009735
|
Ntn3
|
netrin 3 |
| chr9_+_43331155 | 0.08 |
ENSRNOT00000023036
|
Zap70
|
zeta chain of T cell receptor associated protein kinase 70 |
| chr10_-_50402616 | 0.08 |
ENSRNOT00000004546
|
Hs3st3b1
|
heparan sulfate-glucosamine 3-sulfotransferase 3B1 |
| chr6_-_92760018 | 0.08 |
ENSRNOT00000009560
|
Trim9
|
tripartite motif-containing 9 |
| chrX_+_68782872 | 0.08 |
ENSRNOT00000075995
|
Stard8
|
StAR-related lipid transfer domain containing 8 |
| chr1_+_256370850 | 0.08 |
ENSRNOT00000030962
|
Cyp26c1
|
cytochrome P450, family 26, subfamily C, polypeptide 1 |
| chr10_-_64657089 | 0.08 |
ENSRNOT00000080703
|
Abr
|
active BCR-related |
| chr3_+_154395187 | 0.08 |
ENSRNOT00000050810
|
Vstm2l
|
V-set and transmembrane domain containing 2 like |
| chr10_-_90030423 | 0.07 |
ENSRNOT00000092150
|
Mpp2
|
membrane palmitoylated protein 2 |
| chr10_+_55927223 | 0.07 |
ENSRNOT00000011523
|
Kcnab3
|
potassium voltage-gated channel subfamily A regulatory beta subunit 3 |
| chr13_-_89594738 | 0.07 |
ENSRNOT00000004641
|
Tomm40l
|
translocase of outer mitochondrial membrane 40 like |
| chr4_+_58053041 | 0.07 |
ENSRNOT00000072698
|
Mest
|
mesoderm specific transcript |
| chr4_+_7377563 | 0.07 |
ENSRNOT00000084826
|
Kcnh2
|
potassium voltage-gated channel subfamily H member 2 |
| chr5_-_79222687 | 0.07 |
ENSRNOT00000010516
|
Akna
|
AT-hook transcription factor |
| chr1_-_88989552 | 0.07 |
ENSRNOT00000034001
|
Arhgap33
|
Rho GTPase activating protein 33 |
| chr7_-_24668250 | 0.07 |
ENSRNOT00000083806
|
Tmem263
|
transmembrane protein 263 |
| chr1_+_86873253 | 0.07 |
ENSRNOT00000071239
|
Fbxo27
|
F-box protein 27 |
| chr20_-_4921348 | 0.07 |
ENSRNOT00000082497
ENSRNOT00000041151 |
RT1-CE4
|
RT1 class I, locus CE4 |
| chr5_-_20189721 | 0.07 |
ENSRNOT00000014661
|
Tox
|
thymocyte selection-associated high mobility group box |
| chr7_+_11054333 | 0.07 |
ENSRNOT00000007202
|
Gna15
|
guanine nucleotide binding protein, alpha 15 |
| chr10_-_85517683 | 0.07 |
ENSRNOT00000016070
|
Srcin1
|
SRC kinase signaling inhibitor 1 |
| chr15_-_14737704 | 0.07 |
ENSRNOT00000011307
|
Synpr
|
synaptoporin |
| chr13_-_52197205 | 0.07 |
ENSRNOT00000009712
|
Shisa4
|
shisa family member 4 |
| chr11_-_32508420 | 0.07 |
ENSRNOT00000002717
|
Kcne1
|
potassium voltage-gated channel subfamily E regulatory subunit 1 |
| chrX_-_14890606 | 0.07 |
ENSRNOT00000049864
|
RGD1560784
|
similar to RIKEN cDNA B630019K06 |
| chr10_-_91302155 | 0.07 |
ENSRNOT00000004371
|
Spata32
|
spermatogenesis associated 32 |
| chrX_-_78496847 | 0.07 |
ENSRNOT00000003265
|
Itm2a
|
integral membrane protein 2A |
| chr17_+_26785029 | 0.06 |
ENSRNOT00000022065
|
Eef1e1
|
eukaryotic translation elongation factor 1 epsilon 1 |
| chr11_-_87485833 | 0.06 |
ENSRNOT00000079948
|
AABR07034751.1
|
|
| chr2_-_187771857 | 0.06 |
ENSRNOT00000092517
ENSRNOT00000035383 |
Pmf1
|
polyamine-modulated factor 1 |
| chr1_+_247398598 | 0.06 |
ENSRNOT00000087011
|
Jak2
|
Janus kinase 2 |
| chr3_-_2411544 | 0.06 |
ENSRNOT00000012406
|
Tor4a
|
torsin family 4, member A |
| chr1_+_140601791 | 0.06 |
ENSRNOT00000091588
|
Isg20
|
interferon stimulated exonuclease gene 20 |
| chr11_-_73678984 | 0.06 |
ENSRNOT00000002355
|
Fam43a
|
family with sequence similarity 43, member A |
| chr1_-_199037267 | 0.06 |
ENSRNOT00000078779
|
Ccdc189
|
coiled-coil domain containing 189 |
| chr1_+_101410019 | 0.06 |
ENSRNOT00000042039
|
Lhb
|
luteinizing hormone beta polypeptide |
| chr6_+_28382962 | 0.06 |
ENSRNOT00000016976
|
Pomc
|
proopiomelanocortin |
| chr13_-_81214494 | 0.06 |
ENSRNOT00000004950
ENSRNOT00000082385 |
Prrx1
|
paired related homeobox 1 |
| chr3_-_148932878 | 0.06 |
ENSRNOT00000013881
|
Nol4l
|
nucleolar protein 4-like |
| chr1_-_199655147 | 0.06 |
ENSRNOT00000026979
|
LOC103691238
|
zinc finger protein 239-like |
| chr20_-_5533448 | 0.06 |
ENSRNOT00000000568
|
Cuta
|
cutA divalent cation tolerance homolog |
| chr5_+_139038134 | 0.06 |
ENSRNOT00000078155
|
Hivep3
|
human immunodeficiency virus type I enhancer binding protein 3 |
| chr5_-_139227196 | 0.06 |
ENSRNOT00000050941
|
Foxo6
|
forkhead box O6 |
| chr20_-_5533600 | 0.06 |
ENSRNOT00000072319
|
Cuta
|
cutA divalent cation tolerance homolog |
| chr6_-_132958546 | 0.06 |
ENSRNOT00000041903
|
Begain
|
brain-enriched guanylate kinase-associated |
| chr9_+_82647071 | 0.06 |
ENSRNOT00000027135
|
Asic4
|
acid sensing ion channel subunit family member 4 |
| chr8_-_78233430 | 0.06 |
ENSRNOT00000083220
|
Cgnl1
|
cingulin-like 1 |
| chr19_+_56220755 | 0.06 |
ENSRNOT00000023452
|
Tubb3
|
tubulin, beta 3 class III |
| chr1_-_88066101 | 0.06 |
ENSRNOT00000079473
ENSRNOT00000027893 |
Ryr1
|
ryanodine receptor 1 |
| chr19_-_56037077 | 0.06 |
ENSRNOT00000021968
|
Spata2L
|
spermatogenesis associated 2-like |
| chr14_-_84393421 | 0.06 |
ENSRNOT00000006911
|
Ccdc157
|
coiled-coil domain containing 157 |
| chr2_+_198303168 | 0.06 |
ENSRNOT00000056262
|
Mtmr11
|
myotubularin related protein 11 |
| chr13_-_72890841 | 0.06 |
ENSRNOT00000093726
|
RGD1304622
|
similar to 6820428L09 protein |
| chr8_-_115358046 | 0.06 |
ENSRNOT00000017607
|
Grm2
|
glutamate metabotropic receptor 2 |
| chr20_-_5931417 | 0.06 |
ENSRNOT00000092383
|
Slc26a8
|
solute carrier family 26 member 8 |
| chr19_-_25288335 | 0.06 |
ENSRNOT00000050214
|
Nanos3
|
nanos C2HC-type zinc finger 3 |
| chr17_+_49516429 | 0.06 |
ENSRNOT00000048929
|
Tgif2-ps1
|
TGFB-induced factor homeobox 2, pseudogene 1 |
| chr20_+_5374985 | 0.06 |
ENSRNOT00000052270
|
RT1-A2
|
RT1 class Ia, locus A2 |
| chr1_-_222189604 | 0.06 |
ENSRNOT00000028704
|
Kcnk4
|
potassium two pore domain channel subfamily K member 4 |
| chr1_-_77893509 | 0.06 |
ENSRNOT00000015059
|
Gltscr1
|
glioma tumor suppressor candidate region gene 1 |
| chr1_+_141767940 | 0.06 |
ENSRNOT00000064034
|
Zfp710
|
zinc finger protein 710 |
| chr4_-_56786754 | 0.06 |
ENSRNOT00000050795
|
Kcp
|
kielin/chordin-like protein |
| chr1_-_82580761 | 0.06 |
ENSRNOT00000028131
ENSRNOT00000028132 |
Axl
|
Axl receptor tyrosine kinase |
| chr1_-_153752541 | 0.06 |
ENSRNOT00000080927
|
Prss23
|
protease, serine, 23 |
| chr8_+_58870516 | 0.06 |
ENSRNOT00000033900
|
Gldn
|
gliomedin |
| chr20_+_5535432 | 0.06 |
ENSRNOT00000040859
|
Syngap1
|
synaptic Ras GTPase activating protein 1 |
| chr19_-_52499433 | 0.05 |
ENSRNOT00000021954
|
Cotl1
|
coactosin-like F-actin binding protein 1 |
| chr1_-_101883744 | 0.05 |
ENSRNOT00000028635
|
Syngr4
|
synaptogyrin 4 |
| chr4_+_113866804 | 0.05 |
ENSRNOT00000081196
|
Loxl3
|
lysyl oxidase-like 3 |
| chr9_-_15214596 | 0.05 |
ENSRNOT00000039102
|
Tfeb
|
transcription factor EB |
| chr18_+_36371041 | 0.05 |
ENSRNOT00000025408
|
Sh3rf2
|
SH3 domain containing ring finger 2 |
| chr20_-_6500523 | 0.05 |
ENSRNOT00000000629
|
Cpne5
|
copine 5 |
| chrX_+_15273933 | 0.05 |
ENSRNOT00000075082
|
LOC108348091
|
erythroid transcription factor |
| chr1_-_101351879 | 0.05 |
ENSRNOT00000028142
|
Ppfia3
|
PTPRF interacting protein alpha 3 |
| chr11_-_83546674 | 0.05 |
ENSRNOT00000044896
|
Ephb3
|
Eph receptor B3 |
| chr10_+_80953006 | 0.05 |
ENSRNOT00000035567
|
Hnrnpa3
|
heterogeneous nuclear ribonucleoprotein A3 |
| chr9_+_82053581 | 0.05 |
ENSRNOT00000086375
|
Wnt10a
|
wingless-type MMTV integration site family, member 10A |
| chrX_-_72133692 | 0.05 |
ENSRNOT00000004263
|
Cited1
|
Cbp/p300-interacting transactivator with Glu/Asp-rich carboxy-terminal domain 1 |
| chr2_+_187893875 | 0.05 |
ENSRNOT00000093014
|
Mex3a
|
mex-3 RNA binding family member A |
| chr2_+_187512164 | 0.05 |
ENSRNOT00000051394
|
Mef2d
|
myocyte enhancer factor 2D |
| chr7_+_12619774 | 0.05 |
ENSRNOT00000015257
|
Med16
|
mediator complex subunit 16 |
| chr9_-_81469274 | 0.05 |
ENSRNOT00000070827
|
Cxcr1
|
C-X-C motif chemokine receptor 1 |
| chr12_-_11265865 | 0.05 |
ENSRNOT00000001315
|
Arpc1b
|
actin related protein 2/3 complex, subunit 1B |
| chr11_-_30428073 | 0.05 |
ENSRNOT00000047741
|
Scaf4
|
SR-related CTD-associated factor 4 |
| chr3_-_155192806 | 0.05 |
ENSRNOT00000051343
|
RGD1563145
|
similar to 60S ribosomal protein L13 |
| chr3_-_162035614 | 0.05 |
ENSRNOT00000047890
|
Zfp663
|
zinc finger protein 663 |
| chr12_+_23151180 | 0.05 |
ENSRNOT00000059486
|
Cux1
|
cut-like homeobox 1 |
| chr5_-_161035368 | 0.05 |
ENSRNOT00000091640
|
AABR07050321.2
|
|
| chr6_+_111180108 | 0.05 |
ENSRNOT00000082027
|
Gstz1
|
glutathione S-transferase zeta 1 |
| chr5_-_172424081 | 0.05 |
ENSRNOT00000019096
|
Plch2
|
phospholipase C, eta 2 |
| chr17_+_83221827 | 0.05 |
ENSRNOT00000000155
|
Plxdc2
|
plexin domain containing 2 |
| chr19_+_25120128 | 0.05 |
ENSRNOT00000081243
|
Samd1
|
sterile alpha motif domain containing 1 |
| chr7_-_70348780 | 0.05 |
ENSRNOT00000072468
|
March9
|
membrane associated ring-CH-type finger 9 |
| chr1_-_86948845 | 0.05 |
ENSRNOT00000027212
|
Nfkbib
|
NFKB inhibitor beta |
| chr8_+_44136496 | 0.05 |
ENSRNOT00000087022
|
Scn3b
|
sodium voltage-gated channel beta subunit 3 |
| chr13_+_24823488 | 0.05 |
ENSRNOT00000019907
|
Cdh20
|
cadherin 20 |
| chr6_+_29977797 | 0.05 |
ENSRNOT00000071784
|
Fkbp1b
|
FK506 binding protein 1B |
| chr12_+_47218969 | 0.05 |
ENSRNOT00000081343
ENSRNOT00000038395 |
Unc119b
|
unc-119 lipid binding chaperone B |
| chr1_+_140602542 | 0.05 |
ENSRNOT00000085570
|
Isg20
|
interferon stimulated exonuclease gene 20 |
| chr1_+_88113445 | 0.05 |
ENSRNOT00000056955
|
Ggn
|
gametogenetin |
| chr1_+_72903257 | 0.05 |
ENSRNOT00000086122
|
Ppp1r12c
|
protein phosphatase 1, regulatory subunit 12C |
| chr6_+_115170865 | 0.05 |
ENSRNOT00000005671
|
Tshr
|
thyroid stimulating hormone receptor |
| chr12_-_41485122 | 0.05 |
ENSRNOT00000001859
|
Ddx54
|
DEAD-box helicase 54 |
| chr6_+_27589657 | 0.05 |
ENSRNOT00000038649
|
Hadha
|
hydroxyacyl-CoA dehydrogenase/3-ketoacyl-CoA thiolase/enoyl-CoA hydratase (trifunctional protein), alpha subunit |
| chr9_+_97355924 | 0.05 |
ENSRNOT00000026558
|
Ackr3
|
atypical chemokine receptor 3 |
| chr20_-_28814636 | 0.05 |
ENSRNOT00000086030
|
Sept10
|
septin 10 |
| chr10_-_58973020 | 0.05 |
ENSRNOT00000020379
|
Smtnl2
|
smoothelin-like 2 |
| chr3_+_80362858 | 0.05 |
ENSRNOT00000021353
ENSRNOT00000086242 |
Lrp4
|
LDL receptor related protein 4 |
| chr10_-_11131548 | 0.05 |
ENSRNOT00000005490
|
Vasn
|
vasorin |
| chr10_+_43768708 | 0.04 |
ENSRNOT00000086218
|
Sh3bp5l
|
SH3 binding domain protein 5 like |
| chr7_+_18668692 | 0.04 |
ENSRNOT00000009532
|
Kank3
|
KN motif and ankyrin repeat domains 3 |
| chr7_-_124620703 | 0.04 |
ENSRNOT00000017727
|
Scube1
|
signal peptide, CUB domain and EGF like domain containing 1 |
| chr8_+_63286773 | 0.04 |
ENSRNOT00000033397
|
RGD1562618
|
similar to RIKEN cDNA 6030419C18 gene |
| chr16_+_61954590 | 0.04 |
ENSRNOT00000017883
|
Rbpms
|
RNA binding protein with multiple splicing |
| chr19_-_39087880 | 0.04 |
ENSRNOT00000070822
|
Chtf8
|
chromosome transmission fidelity factor 8 |
| chr14_+_83341851 | 0.04 |
ENSRNOT00000086090
|
Pisd
|
phosphatidylserine decarboxylase |
| chr10_+_75087892 | 0.04 |
ENSRNOT00000065910
|
Mpo
|
myeloperoxidase |
| chr1_+_212558257 | 0.04 |
ENSRNOT00000024912
|
Prap1
|
proline-rich acidic protein 1 |
| chr20_-_5140304 | 0.04 |
ENSRNOT00000092646
|
Prrc2a
|
proline-rich coiled-coil 2A |
| chr2_-_210873024 | 0.04 |
ENSRNOT00000026051
|
Ampd2
|
adenosine monophosphate deaminase 2 |
| chr8_+_56179816 | 0.04 |
ENSRNOT00000059078
|
Arhgap20
|
Rho GTPase activating protein 20 |
| chr5_+_167109691 | 0.04 |
ENSRNOT00000055536
|
Gpr157
|
G protein-coupled receptor 157 |
| chr8_+_93491761 | 0.04 |
ENSRNOT00000014326
|
Tpbg
|
trophoblast glycoprotein |
| chr9_-_52238564 | 0.04 |
ENSRNOT00000005073
|
Col5a2
|
collagen type V alpha 2 chain |
| chr3_-_147487170 | 0.04 |
ENSRNOT00000077580
|
Fam110a
|
family with sequence similarity 110, member A |
| chr8_-_119157071 | 0.04 |
ENSRNOT00000028963
|
Tmie
|
transmembrane inner ear |
| chr3_-_175479034 | 0.04 |
ENSRNOT00000086761
|
Hrh3
|
histamine receptor H3 |
| chr1_-_216663720 | 0.04 |
ENSRNOT00000078944
ENSRNOT00000077409 |
Cdkn1c
|
cyclin-dependent kinase inhibitor 1C |
| chr8_+_45797315 | 0.04 |
ENSRNOT00000059997
|
AABR07070046.1
|
|
| chr8_-_3272306 | 0.04 |
ENSRNOT00000040365
|
AABR07068955.1
|
|
| chr20_-_6257604 | 0.04 |
ENSRNOT00000092489
|
Stk38
|
serine/threonine kinase 38 |
Network of associatons between targets according to the STRING database.

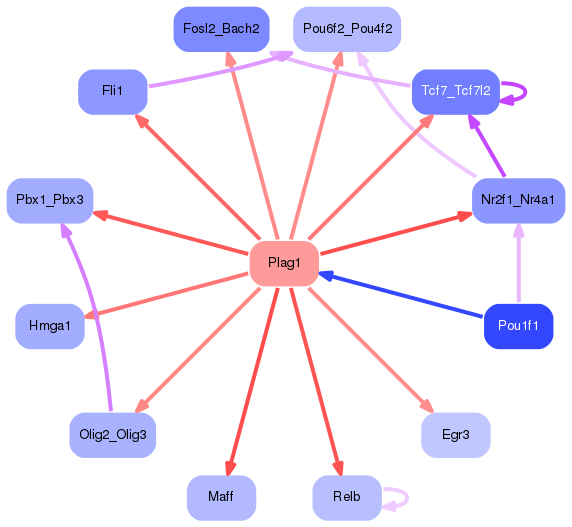
First level regulatory network of Plag1
Gene Ontology Analysis
Gene overrepresentation in biological process category:
| Log-likelihood per target | Total log-likelihood | Term | Description |
|---|---|---|---|
| 0.1 | 0.3 | GO:0034653 | diterpenoid catabolic process(GO:0016103) retinoic acid catabolic process(GO:0034653) |
| 0.1 | 0.2 | GO:0002397 | MHC class I protein complex assembly(GO:0002397) |
| 0.0 | 0.1 | GO:0021530 | spinal cord oligodendrocyte cell differentiation(GO:0021529) spinal cord oligodendrocyte cell fate specification(GO:0021530) |
| 0.0 | 0.1 | GO:0035986 | senescence-associated heterochromatin focus assembly(GO:0035986) |
| 0.0 | 0.1 | GO:0002149 | hypochlorous acid metabolic process(GO:0002148) hypochlorous acid biosynthetic process(GO:0002149) |
| 0.0 | 0.1 | GO:0010909 | regulation of heparan sulfate proteoglycan biosynthetic process(GO:0010908) positive regulation of heparan sulfate proteoglycan biosynthetic process(GO:0010909) embryonic hindgut morphogenesis(GO:0048619) |
| 0.0 | 0.1 | GO:0000738 | DNA catabolic process, exonucleolytic(GO:0000738) |
| 0.0 | 0.1 | GO:0045065 | cytotoxic T cell differentiation(GO:0045065) |
| 0.0 | 0.1 | GO:0070086 | ubiquitin-dependent endocytosis(GO:0070086) |
| 0.0 | 0.1 | GO:0048162 | preantral ovarian follicle growth(GO:0001546) multi-layer follicle stage(GO:0048162) |
| 0.0 | 0.1 | GO:1903300 | negative regulation of glucokinase activity(GO:0033132) negative regulation of hexokinase activity(GO:1903300) |
| 0.0 | 0.1 | GO:2000424 | regulation of eosinophil chemotaxis(GO:2000422) positive regulation of eosinophil chemotaxis(GO:2000424) |
| 0.0 | 0.2 | GO:0043435 | response to corticotropin-releasing hormone(GO:0043435) cellular response to corticotropin-releasing hormone stimulus(GO:0071376) |
| 0.0 | 0.1 | GO:0035544 | negative regulation of SNARE complex assembly(GO:0035544) |
| 0.0 | 0.2 | GO:0097116 | gephyrin clustering involved in postsynaptic density assembly(GO:0097116) |
| 0.0 | 0.1 | GO:0003357 | noradrenergic neuron differentiation(GO:0003357) |
| 0.0 | 0.1 | GO:0072144 | glomerular mesangial cell development(GO:0072144) |
| 0.0 | 0.1 | GO:0043366 | beta selection(GO:0043366) |
| 0.0 | 0.1 | GO:0043314 | negative regulation of neutrophil degranulation(GO:0043314) |
| 0.0 | 0.1 | GO:1902303 | negative regulation of potassium ion export(GO:1902303) |
| 0.0 | 0.1 | GO:1903575 | cornified envelope assembly(GO:1903575) |
| 0.0 | 0.1 | GO:0097296 | mineralocorticoid receptor signaling pathway(GO:0031959) interleukin-12-mediated signaling pathway(GO:0035722) positive regulation of growth hormone receptor signaling pathway(GO:0060399) cellular response to interleukin-12(GO:0071349) activation of cysteine-type endopeptidase activity involved in apoptotic signaling pathway(GO:0097296) |
| 0.0 | 0.1 | GO:0097167 | circadian regulation of translation(GO:0097167) |
| 0.0 | 0.1 | GO:1903334 | positive regulation of protein folding(GO:1903334) |
| 0.0 | 0.1 | GO:0071469 | cellular response to alkaline pH(GO:0071469) |
| 0.0 | 0.1 | GO:2000328 | regulation of T-helper 17 cell lineage commitment(GO:2000328) |
| 0.0 | 0.1 | GO:0098759 | response to interleukin-8(GO:0098758) cellular response to interleukin-8(GO:0098759) |
| 0.0 | 0.0 | GO:0072054 | renal outer medulla development(GO:0072054) |
| 0.0 | 0.1 | GO:0002317 | plasma cell differentiation(GO:0002317) |
| 0.0 | 0.1 | GO:0010890 | positive regulation of sequestering of triglyceride(GO:0010890) |
| 0.0 | 0.0 | GO:1905225 | response to thyrotropin-releasing hormone(GO:1905225) |
| 0.0 | 0.1 | GO:0042420 | dopamine catabolic process(GO:0042420) |
| 0.0 | 0.1 | GO:1902746 | regulation of lens fiber cell differentiation(GO:1902746) |
| 0.0 | 0.0 | GO:0071461 | cellular response to redox state(GO:0071461) |
| 0.0 | 0.1 | GO:2000669 | negative regulation of dendritic cell apoptotic process(GO:2000669) |
| 0.0 | 0.1 | GO:0003340 | negative regulation of mesenchymal to epithelial transition involved in metanephros morphogenesis(GO:0003340) |
| 0.0 | 0.0 | GO:1902809 | regulation of skeletal muscle fiber differentiation(GO:1902809) |
| 0.0 | 0.1 | GO:1901386 | negative regulation of voltage-gated calcium channel activity(GO:1901386) |
| 0.0 | 0.2 | GO:0006527 | arginine catabolic process(GO:0006527) |
| 0.0 | 0.0 | GO:1904721 | negative regulation of mRNA cleavage(GO:0031438) negative regulation of mRNA endonucleolytic cleavage involved in unfolded protein response(GO:1904721) |
| 0.0 | 0.0 | GO:0010982 | regulation of high-density lipoprotein particle clearance(GO:0010982) positive regulation of lipoprotein particle clearance(GO:0010986) |
| 0.0 | 0.0 | GO:0021564 | vagus nerve development(GO:0021564) |
| 0.0 | 0.0 | GO:0019064 | fusion of virus membrane with host plasma membrane(GO:0019064) membrane fusion involved in viral entry into host cell(GO:0039663) multi-organism membrane fusion(GO:0044800) susceptibility to T cell mediated cytotoxicity(GO:0060370) |
| 0.0 | 0.0 | GO:1903847 | regulation of aorta morphogenesis(GO:1903847) positive regulation of aorta morphogenesis(GO:1903849) |
| 0.0 | 0.2 | GO:0002087 | regulation of respiratory gaseous exchange by neurological system process(GO:0002087) |
| 0.0 | 0.1 | GO:0001661 | conditioned taste aversion(GO:0001661) |
| 0.0 | 0.0 | GO:0031444 | slow-twitch skeletal muscle fiber contraction(GO:0031444) |
| 0.0 | 0.1 | GO:0060158 | phospholipase C-activating dopamine receptor signaling pathway(GO:0060158) |
| 0.0 | 0.0 | GO:0097104 | postsynaptic membrane assembly(GO:0097104) |
| 0.0 | 0.1 | GO:2000852 | regulation of corticosterone secretion(GO:2000852) |
| 0.0 | 0.1 | GO:0048664 | neuron fate determination(GO:0048664) |
| 0.0 | 0.2 | GO:0022038 | corpus callosum development(GO:0022038) |
| 0.0 | 0.1 | GO:0006477 | protein sulfation(GO:0006477) |
| 0.0 | 0.1 | GO:0042989 | sequestering of actin monomers(GO:0042989) |
| 0.0 | 0.0 | GO:0071579 | regulation of zinc ion transport(GO:0071579) |
| 0.0 | 0.1 | GO:0034370 | triglyceride-rich lipoprotein particle remodeling(GO:0034370) very-low-density lipoprotein particle remodeling(GO:0034372) |
| 0.0 | 0.0 | GO:0071929 | alpha-tubulin acetylation(GO:0071929) |
| 0.0 | 0.1 | GO:0031274 | positive regulation of pseudopodium assembly(GO:0031274) |
| 0.0 | 0.1 | GO:2000774 | positive regulation of cellular senescence(GO:2000774) |
| 0.0 | 0.0 | GO:0060931 | sinoatrial node cell development(GO:0060931) |
| 0.0 | 0.0 | GO:1903225 | negative regulation of endodermal cell differentiation(GO:1903225) |
| 0.0 | 0.1 | GO:0006572 | tyrosine catabolic process(GO:0006572) |
Gene overrepresentation in cellular component category:
| Log-likelihood per target | Total log-likelihood | Term | Description |
|---|---|---|---|
| 0.0 | 0.1 | GO:1990907 | beta-catenin-TCF complex(GO:1990907) |
| 0.0 | 0.1 | GO:0042571 | immunoglobulin complex, circulating(GO:0042571) |
| 0.0 | 0.2 | GO:0033018 | sarcoplasmic reticulum lumen(GO:0033018) |
| 0.0 | 0.2 | GO:0033256 | I-kappaB/NF-kappaB complex(GO:0033256) |
| 0.0 | 0.1 | GO:0035976 | AP1 complex(GO:0035976) |
| 0.0 | 0.1 | GO:0000444 | MIS12/MIND type complex(GO:0000444) |
| 0.0 | 0.1 | GO:0035985 | senescence-associated heterochromatin focus(GO:0035985) |
| 0.0 | 0.1 | GO:0016600 | flotillin complex(GO:0016600) |
| 0.0 | 0.0 | GO:0005853 | eukaryotic translation elongation factor 1 complex(GO:0005853) |
| 0.0 | 0.0 | GO:0005588 | collagen type V trimer(GO:0005588) |
Gene overrepresentation in molecular function category:
| Log-likelihood per target | Total log-likelihood | Term | Description |
|---|---|---|---|
| 0.1 | 0.2 | GO:0016403 | dimethylargininase activity(GO:0016403) |
| 0.0 | 0.2 | GO:0097109 | neuroligin family protein binding(GO:0097109) |
| 0.0 | 0.1 | GO:0008401 | retinoic acid 4-hydroxylase activity(GO:0008401) |
| 0.0 | 0.1 | GO:0004706 | JUN kinase kinase kinase activity(GO:0004706) |
| 0.0 | 0.1 | GO:0005330 | dopamine:sodium symporter activity(GO:0005330) |
| 0.0 | 0.1 | GO:0051575 | 5'-deoxyribose-5-phosphate lyase activity(GO:0051575) |
| 0.0 | 0.1 | GO:0008310 | single-stranded DNA 3'-5' exodeoxyribonuclease activity(GO:0008310) |
| 0.0 | 0.1 | GO:0001641 | group II metabotropic glutamate receptor activity(GO:0001641) |
| 0.0 | 0.1 | GO:0097603 | temperature-gated ion channel activity(GO:0097603) |
| 0.0 | 0.1 | GO:0034186 | apolipoprotein A-I binding(GO:0034186) |
| 0.0 | 0.1 | GO:0004918 | interleukin-8 receptor activity(GO:0004918) |
| 0.0 | 0.2 | GO:0035256 | G-protein coupled glutamate receptor binding(GO:0035256) |
| 0.0 | 0.1 | GO:0052629 | phosphatidylinositol-3,5-bisphosphate 3-phosphatase activity(GO:0052629) |
| 0.0 | 0.1 | GO:0046920 | alpha-(1->3)-fucosyltransferase activity(GO:0046920) |
| 0.0 | 0.1 | GO:0005143 | interleukin-12 receptor binding(GO:0005143) |
| 0.0 | 0.1 | GO:0070996 | type 1 melanocortin receptor binding(GO:0070996) |
| 0.0 | 0.1 | GO:1902282 | voltage-gated potassium channel activity involved in ventricular cardiac muscle cell action potential repolarization(GO:1902282) |
| 0.0 | 0.0 | GO:0016508 | long-chain-enoyl-CoA hydratase activity(GO:0016508) long-chain-3-hydroxyacyl-CoA dehydrogenase activity(GO:0016509) |
| 0.0 | 0.1 | GO:0005219 | ryanodine-sensitive calcium-release channel activity(GO:0005219) |
| 0.0 | 0.2 | GO:0001972 | retinoic acid binding(GO:0001972) |
| 0.0 | 0.1 | GO:0003836 | beta-galactoside (CMP) alpha-2,3-sialyltransferase activity(GO:0003836) |
| 0.0 | 0.1 | GO:0051032 | nucleic acid transmembrane transporter activity(GO:0051032) RNA transmembrane transporter activity(GO:0051033) |
| 0.0 | 0.1 | GO:0008467 | [heparan sulfate]-glucosamine 3-sulfotransferase 1 activity(GO:0008467) |
| 0.0 | 0.1 | GO:0016286 | small conductance calcium-activated potassium channel activity(GO:0016286) |
| 0.0 | 0.1 | GO:0070016 | armadillo repeat domain binding(GO:0070016) |
| 0.0 | 0.0 | GO:1902379 | chemoattractant activity involved in axon guidance(GO:1902379) |
| 0.0 | 0.1 | GO:0004720 | protein-lysine 6-oxidase activity(GO:0004720) |
| 0.0 | 0.0 | GO:0035614 | snRNA stem-loop binding(GO:0035614) |
| 0.0 | 0.0 | GO:0004609 | phosphatidylserine decarboxylase activity(GO:0004609) |
| 0.0 | 0.0 | GO:0003876 | AMP deaminase activity(GO:0003876) adenosine-phosphate deaminase activity(GO:0047623) |
Gene overrepresentation in curated gene sets: REACTOME pathways category:
| Log-likelihood per target | Total log-likelihood | Term | Description |
|---|---|---|---|
| 0.0 | 0.1 | REACTOME APOBEC3G MEDIATED RESISTANCE TO HIV1 INFECTION | Genes involved in APOBEC3G mediated resistance to HIV-1 infection |
| 0.0 | 0.2 | REACTOME N GLYCAN TRIMMING IN THE ER AND CALNEXIN CALRETICULIN CYCLE | Genes involved in N-glycan trimming in the ER and Calnexin/Calreticulin cycle |
| 0.0 | 0.2 | REACTOME ADENYLATE CYCLASE ACTIVATING PATHWAY | Genes involved in Adenylate cyclase activating pathway |
| 0.0 | 0.1 | REACTOME PEPTIDE HORMONE BIOSYNTHESIS | Genes involved in Peptide hormone biosynthesis |