Project
GSE49485: Hypoxia transcriptome sequencing of rat brain.
Navigation
Downloads
Results for Pitx2_Otx2
Z-value: 0.70
Motif logo
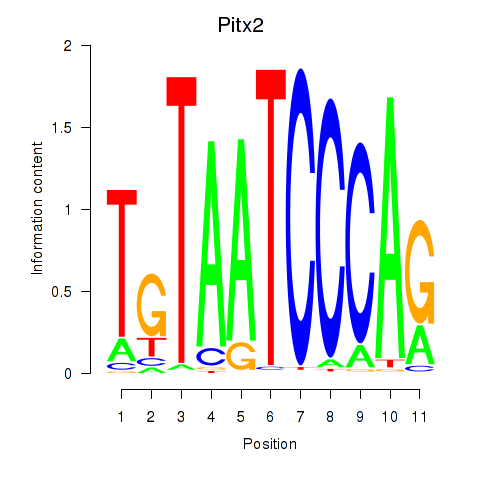
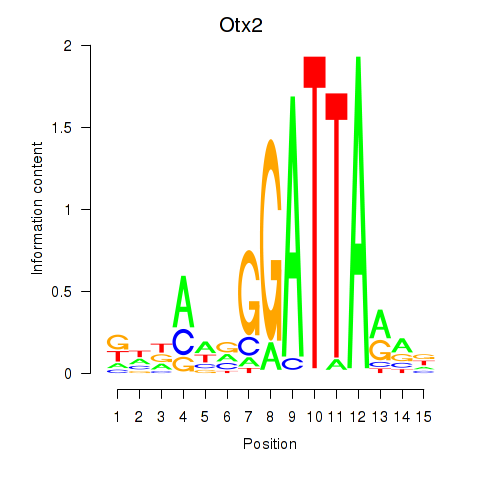
Transcription factors associated with Pitx2_Otx2
| Gene Symbol | Gene ID | Gene Info |
|---|---|---|
|
Pitx2
|
ENSRNOG00000010681 | paired-like homeodomain 2 |
|
Otx2
|
ENSRNOG00000056186 | orthodenticle homeobox 2 |
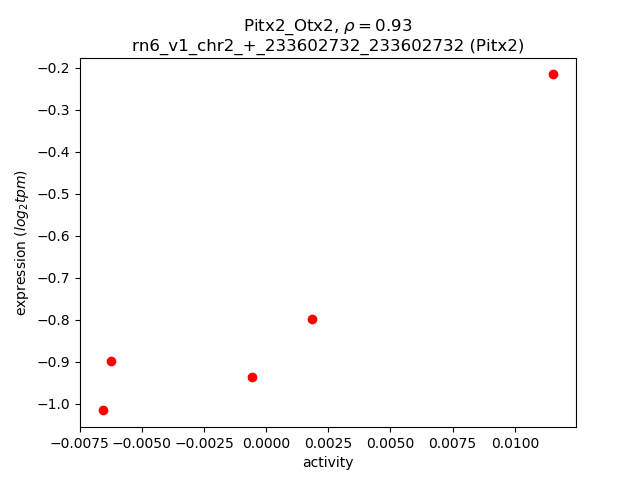
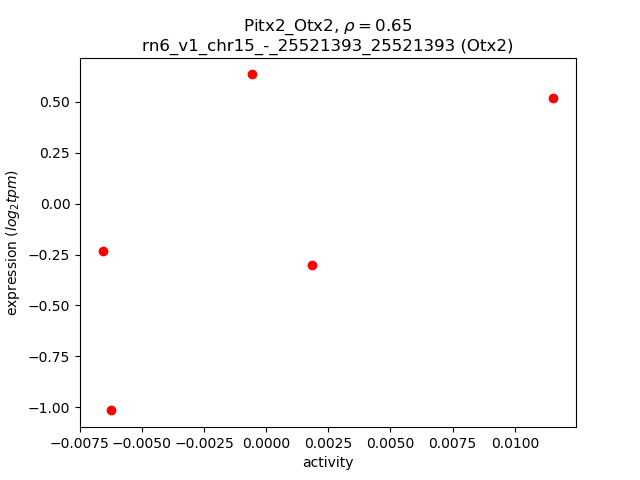
Activity-expression correlation:
| Gene | Promoter | Pearson corr. coef. | P-value | Plot |
|---|---|---|---|---|
| Pitx2 | rn6_v1_chr2_+_233602732_233602732 | 0.93 | 2.1e-02 | Click! |
| Otx2 | rn6_v1_chr15_-_25521393_25521393 | 0.65 | 2.4e-01 | Click! |
Activity profile of Pitx2_Otx2 motif
Sorted Z-values of Pitx2_Otx2 motif
| Promoter | Log-likelihood | Transcript | Gene | Gene Info |
|---|---|---|---|---|
| chr3_-_123119460 | 0.72 |
ENSRNOT00000028833
|
Avp
|
arginine vasopressin |
| chr4_+_86275717 | 0.71 |
ENSRNOT00000016414
|
Ppp1r17
|
protein phosphatase 1, regulatory subunit 17 |
| chr16_+_20020444 | 0.50 |
ENSRNOT00000024827
|
Pgls
|
6-phosphogluconolactonase |
| chr10_-_59883839 | 0.46 |
ENSRNOT00000093579
|
Aspa
|
aspartoacylase |
| chr12_-_48365784 | 0.40 |
ENSRNOT00000077317
|
Dao
|
D-amino-acid oxidase |
| chr2_-_210116038 | 0.36 |
ENSRNOT00000074950
|
LOC684509
|
similar to NADH-ubiquinone oxidoreductase B9 subunit (Complex I-B9) (CI-B9) |
| chr1_-_166939541 | 0.34 |
ENSRNOT00000079675
|
Folr1
|
folate receptor 1 |
| chr9_+_20004280 | 0.34 |
ENSRNOT00000075670
|
Ankrd66
|
ankyrin repeat domain 66 |
| chr8_-_132345708 | 0.33 |
ENSRNOT00000006300
|
Tmem158
|
transmembrane protein 158 |
| chr2_-_113616766 | 0.32 |
ENSRNOT00000016858
ENSRNOT00000074723 |
Tmem212
|
transmembrane protein 212 |
| chr15_+_38095803 | 0.31 |
ENSRNOT00000086854
|
Mrpl57
|
mitochondrial ribosomal protein L57 |
| chr7_-_145174771 | 0.31 |
ENSRNOT00000055270
|
Glycam1
|
glycosylation dependent cell adhesion molecule 1 |
| chr10_+_55626741 | 0.31 |
ENSRNOT00000008492
|
Aurkb
|
aurora kinase B |
| chr6_+_8886591 | 0.30 |
ENSRNOT00000091510
ENSRNOT00000089174 |
Six3
|
SIX homeobox 3 |
| chr10_-_59888198 | 0.29 |
ENSRNOT00000093482
ENSRNOT00000049311 ENSRNOT00000093230 |
Aspa
|
aspartoacylase |
| chr19_-_57333433 | 0.28 |
ENSRNOT00000024917
|
Agt
|
angiotensinogen |
| chr19_+_14835822 | 0.27 |
ENSRNOT00000072804
|
1700007B14Rik
|
RIKEN cDNA 1700007B14 gene |
| chr1_+_87224677 | 0.25 |
ENSRNOT00000028070
|
Ppp1r14a
|
protein phosphatase 1, regulatory (inhibitor) subunit 14A |
| chr6_+_22296128 | 0.25 |
ENSRNOT00000087805
|
Dpy30
|
dpy-30 histone methyltransferase complex regulatory subunit |
| chrM_+_7758 | 0.25 |
ENSRNOT00000046201
|
Mt-atp8
|
mitochondrially encoded ATP synthase 8 |
| chr20_+_14095914 | 0.25 |
ENSRNOT00000093404
|
Gucd1
|
guanylyl cyclase domain containing 1 |
| chr6_+_123361864 | 0.25 |
ENSRNOT00000057577
|
AABR07065353.1
|
|
| chr10_+_40247436 | 0.25 |
ENSRNOT00000079830
|
Gpx3
|
glutathione peroxidase 3 |
| chr18_+_63098144 | 0.24 |
ENSRNOT00000024968
|
Cidea
|
cell death-inducing DFFA-like effector a |
| chr3_-_147819571 | 0.24 |
ENSRNOT00000009840
|
Trib3
|
tribbles pseudokinase 3 |
| chr5_-_169467153 | 0.24 |
ENSRNOT00000014536
|
Hes3
|
hes family bHLH transcription factor 3 |
| chr19_-_37528011 | 0.24 |
ENSRNOT00000059628
|
Agrp
|
agouti related neuropeptide |
| chr1_-_88881460 | 0.23 |
ENSRNOT00000028287
|
Hcst
|
hematopoietic cell signal transducer |
| chr9_+_88964525 | 0.23 |
ENSRNOT00000068236
|
Daw1
|
dynein assembly factor with WD repeats 1 |
| chr10_-_66229311 | 0.22 |
ENSRNOT00000016897
|
Lgals5
|
lectin, galactose binding, soluble 5 |
| chr20_+_6356423 | 0.22 |
ENSRNOT00000000628
|
Cdkn1a
|
cyclin-dependent kinase inhibitor 1A |
| chr7_+_11769400 | 0.22 |
ENSRNOT00000044417
|
Jsrp1
|
junctional sarcoplasmic reticulum protein 1 |
| chr11_+_67465236 | 0.22 |
ENSRNOT00000042374
|
Stfa2
|
stefin A2 |
| chr9_-_121972055 | 0.21 |
ENSRNOT00000089735
|
AABR07068851.1
|
clusterin-like protein 1 |
| chr5_-_156734541 | 0.21 |
ENSRNOT00000021036
|
LOC100909857
|
cytidine deaminase-like |
| chr5_+_151413382 | 0.21 |
ENSRNOT00000012626
|
Cd164l2
|
CD164 molecule like 2 |
| chr1_+_214016897 | 0.21 |
ENSRNOT00000075588
|
LOC100911766
|
tetraspanin-4-like |
| chr1_-_216663720 | 0.21 |
ENSRNOT00000078944
ENSRNOT00000077409 |
Cdkn1c
|
cyclin-dependent kinase inhibitor 1C |
| chr1_-_85510114 | 0.20 |
ENSRNOT00000074665
|
Eid2b
|
EP300 interacting inhibitor of differentiation 2B |
| chr2_+_140708397 | 0.20 |
ENSRNOT00000088846
|
Mgst2
|
microsomal glutathione S-transferase 2 |
| chr16_-_75648538 | 0.19 |
ENSRNOT00000048414
|
Defb14
|
defensin beta 14 |
| chr3_+_148234193 | 0.19 |
ENSRNOT00000010418
|
Cox4i2
|
cytochrome c oxidase subunit 4i2 |
| chr20_-_13657943 | 0.19 |
ENSRNOT00000032290
|
Vpreb3
|
pre-B lymphocyte 3 |
| chr10_+_39066716 | 0.18 |
ENSRNOT00000010729
|
Il5
|
interleukin 5 |
| chr1_-_167005839 | 0.18 |
ENSRNOT00000027261
|
Lrrc51
|
leucine rich repeat containing 51 |
| chr5_-_154438361 | 0.18 |
ENSRNOT00000085003
|
AC141344.2
|
|
| chr5_-_144345531 | 0.17 |
ENSRNOT00000014721
|
Tekt2
|
tektin 2 |
| chr9_+_14951047 | 0.17 |
ENSRNOT00000074267
|
LOC100911489
|
uncharacterized LOC100911489 |
| chr4_+_145580799 | 0.17 |
ENSRNOT00000013727
|
Vhl
|
von Hippel-Lindau tumor suppressor |
| chr7_-_136997050 | 0.17 |
ENSRNOT00000009143
|
Dbx2
|
developing brain homeobox 2 |
| chr16_-_47535358 | 0.17 |
ENSRNOT00000040731
|
Cldn22
|
claudin 22 |
| chr10_-_45534570 | 0.17 |
ENSRNOT00000058362
|
Gjc2
|
gap junction protein, gamma 2 |
| chr8_+_128829680 | 0.16 |
ENSRNOT00000025279
|
Mobp
|
myelin-associated oligodendrocyte basic protein |
| chr7_-_29152442 | 0.16 |
ENSRNOT00000079774
|
Mybpc1
|
myosin binding protein C, slow type |
| chr4_+_170766900 | 0.16 |
ENSRNOT00000044446
|
H2afj
|
H2A histone family, member J |
| chr10_-_90307658 | 0.16 |
ENSRNOT00000092102
|
Slc4a1
|
solute carrier family 4 member 1 |
| chr7_+_120320547 | 0.16 |
ENSRNOT00000014817
|
Eif3l
|
eukaryotic translation initiation factor 3, subunit L |
| chr12_-_38782010 | 0.16 |
ENSRNOT00000001813
|
Wdr66
|
WD repeat domain 66 |
| chr13_-_52136127 | 0.16 |
ENSRNOT00000009398
|
Timm17a
|
translocase of inner mitochondrial membrane 17 homolog A (yeast) |
| chr16_+_36116258 | 0.15 |
ENSRNOT00000017652
|
Sap30
|
Sin3A associated protein 30 |
| chr15_+_61879184 | 0.15 |
ENSRNOT00000042606
|
Sugt1
|
SGT1 homolog, MIS12 kinetochore complex assembly cochaperone |
| chr16_-_20890949 | 0.15 |
ENSRNOT00000081977
|
Homer3
|
homer scaffolding protein 3 |
| chr19_+_37229120 | 0.15 |
ENSRNOT00000076335
|
Hsf4
|
heat shock transcription factor 4 |
| chr19_-_25166528 | 0.15 |
ENSRNOT00000007775
|
Rln3
|
relaxin 3 |
| chr5_-_77945016 | 0.15 |
ENSRNOT00000076223
|
Zfp37
|
zinc finger protein 37 |
| chr20_-_13667333 | 0.15 |
ENSRNOT00000031472
|
LOC103694872
|
coiled-coil-helix-coiled-coil-helix domain-containing protein 10, mitochondrial |
| chr12_-_13924531 | 0.14 |
ENSRNOT00000001477
|
Slc29a4
|
solute carrier family 29 member 4 |
| chr16_+_83358116 | 0.14 |
ENSRNOT00000031109
|
Rab20
|
RAB20, member RAS oncogene family |
| chr8_-_87879888 | 0.14 |
ENSRNOT00000017048
|
Impg1
|
interphotoreceptor matrix proteoglycan 1 |
| chr4_+_84423653 | 0.14 |
ENSRNOT00000012655
|
Chn2
|
chimerin 2 |
| chr16_+_20109200 | 0.14 |
ENSRNOT00000079784
|
Jak3
|
Janus kinase 3 |
| chr12_-_47919400 | 0.14 |
ENSRNOT00000073774
|
Mvk
|
mevalonate kinase |
| chr13_-_111474411 | 0.14 |
ENSRNOT00000072729
|
Hhat
|
hedgehog acyltransferase |
| chr10_-_109979712 | 0.14 |
ENSRNOT00000086042
|
Dus1l
|
dihydrouridine synthase 1-like |
| chr16_-_21017163 | 0.14 |
ENSRNOT00000027661
|
Mef2b
|
myocyte enhancer factor 2B |
| chr9_+_16139101 | 0.14 |
ENSRNOT00000070803
|
LOC100910668
|
uncharacterized LOC100910668 |
| chr12_+_25264400 | 0.14 |
ENSRNOT00000087656
|
Gtf2ird1
|
GTF2I repeat domain containing 1 |
| chr20_+_5080070 | 0.14 |
ENSRNOT00000086950
ENSRNOT00000077082 |
Abhd16a
|
abhydrolase domain containing 16A |
| chr1_+_81643816 | 0.14 |
ENSRNOT00000027214
|
LOC103689942
|
carcinoembryonic antigen-related cell adhesion molecule 1-like |
| chr5_-_135859643 | 0.14 |
ENSRNOT00000024719
|
Urod
|
uroporphyrinogen decarboxylase |
| chr10_+_48240127 | 0.13 |
ENSRNOT00000080682
|
Specc1
|
sperm antigen with calponin homology and coiled-coil domains 1 |
| chr12_-_38805121 | 0.13 |
ENSRNOT00000057716
|
Psmd9
|
proteasome 26S subunit, non-ATPase 9 |
| chr5_+_159606647 | 0.13 |
ENSRNOT00000051693
|
Rps21-ps1
|
ribosomal protein S21, pseudogene 1 |
| chr12_-_2007516 | 0.13 |
ENSRNOT00000037564
|
Pex11g
|
peroxisomal biogenesis factor 11 gamma |
| chr11_+_64882288 | 0.13 |
ENSRNOT00000077727
|
Pla1a
|
phospholipase A1 member A |
| chr2_+_235311719 | 0.13 |
ENSRNOT00000080183
ENSRNOT00000087287 |
Pla2g12a
|
phospholipase A2, group XIIA |
| chr4_-_120414118 | 0.12 |
ENSRNOT00000072795
|
LOC100911337
|
40S ribosomal protein S25-like |
| chr5_-_17061361 | 0.12 |
ENSRNOT00000089318
|
Penk
|
proenkephalin |
| chr3_-_8315910 | 0.12 |
ENSRNOT00000074482
|
LOC102546892
|
proline-rich protein HaeIII subfamily 1-like |
| chr10_-_97750679 | 0.12 |
ENSRNOT00000078059
|
Slc16a6
|
solute carrier family 16, member 6 |
| chr10_-_88677055 | 0.12 |
ENSRNOT00000025590
|
Ghdc
|
GH3 domain containing |
| chr10_-_10767389 | 0.12 |
ENSRNOT00000066754
|
Smim22
|
small integral membrane protein 22 |
| chr15_+_24141651 | 0.12 |
ENSRNOT00000082304
|
Lgals3
|
galectin 3 |
| chr9_+_23420654 | 0.12 |
ENSRNOT00000073595
|
LOC688459
|
hypothetical protein LOC688459 |
| chr1_-_80609836 | 0.12 |
ENSRNOT00000091647
ENSRNOT00000046169 |
Apoc1
|
apolipoprotein C1 |
| chr3_+_163552166 | 0.12 |
ENSRNOT00000049082
|
Tp53rk
|
TP53 regulating kinase |
| chr8_-_55491152 | 0.12 |
ENSRNOT00000014965
|
LOC100359479
|
rCG58364-like |
| chr1_-_102255459 | 0.12 |
ENSRNOT00000067392
|
Ush1c
|
USH1 protein network component harmonin |
| chr8_+_71914867 | 0.11 |
ENSRNOT00000023372
|
Dapk2
|
death-associated protein kinase 2 |
| chr16_+_71242470 | 0.11 |
ENSRNOT00000030489
|
Letm2
|
leucine zipper and EF-hand containing transmembrane protein 2 |
| chr14_-_80680738 | 0.11 |
ENSRNOT00000077706
|
LOC103690128
|
smoothelin-like |
| chr14_+_10692764 | 0.11 |
ENSRNOT00000003012
|
LOC100910270
|
uncharacterized LOC100910270 |
| chrX_-_124516705 | 0.11 |
ENSRNOT00000061493
|
LOC108348144
|
NADH dehydrogenase [ubiquinone] 1 alpha subcomplex subunit 1 |
| chr5_+_157282669 | 0.11 |
ENSRNOT00000022827
|
Pla2g2a
|
phospholipase A2 group IIA |
| chr1_-_80835701 | 0.11 |
ENSRNOT00000064305
|
PVR
|
poliovirus receptor |
| chr1_-_266862842 | 0.11 |
ENSRNOT00000027496
|
LOC103693430
|
up-regulated during skeletal muscle growth protein 5 |
| chr1_+_78659435 | 0.11 |
ENSRNOT00000071271
|
Ceacam9
|
carcinoembryonic antigen-related cell adhesion molecule 9 |
| chr16_-_74330911 | 0.11 |
ENSRNOT00000084330
|
Slc20a2
|
solute carrier family 20 member 2 |
| chr3_+_2438089 | 0.11 |
ENSRNOT00000013335
|
Fam166a
|
family with sequence similarity 166, member A |
| chr1_+_199449973 | 0.11 |
ENSRNOT00000029994
|
Trim72
|
tripartite motif containing 72 |
| chr16_+_7758996 | 0.11 |
ENSRNOT00000061063
|
Btd
|
biotinidase |
| chr12_+_25264192 | 0.11 |
ENSRNOT00000079392
|
Gtf2ird1
|
GTF2I repeat domain containing 1 |
| chr2_-_187706300 | 0.11 |
ENSRNOT00000092349
ENSRNOT00000026414 |
Tmem79
|
transmembrane protein 79 |
| chr15_+_50891127 | 0.11 |
ENSRNOT00000020728
|
Stc1
|
stanniocalcin 1 |
| chr7_-_12640232 | 0.10 |
ENSRNOT00000014981
|
Elane
|
elastase, neutrophil expressed |
| chr2_-_196415530 | 0.10 |
ENSRNOT00000064238
|
RGD1359334
|
similar to hypothetical protein FLJ20519 |
| chr4_-_50860756 | 0.10 |
ENSRNOT00000068404
|
Cadps2
|
calcium dependent secretion activator 2 |
| chr1_+_90919076 | 0.10 |
ENSRNOT00000081362
|
LOC108348197
|
calpain small subunit 1-like |
| chr1_+_100393303 | 0.10 |
ENSRNOT00000026251
|
Syt3
|
synaptotagmin 3 |
| chr10_+_12929471 | 0.10 |
ENSRNOT00000036563
|
Zscan10
|
zinc finger and SCAN domain containing 10 |
| chr2_-_187854363 | 0.10 |
ENSRNOT00000092993
|
Lmna
|
lamin A/C |
| chr20_-_4935887 | 0.10 |
ENSRNOT00000064734
|
RT1-CE4
|
RT1 class I, locus CE4 |
| chr5_-_136023511 | 0.10 |
ENSRNOT00000081747
|
Rps8
|
ribosomal protein S8 |
| chr3_-_10153554 | 0.10 |
ENSRNOT00000093246
|
Exosc2
|
exosome component 2 |
| chr12_+_23752844 | 0.10 |
ENSRNOT00000001953
|
Ssc4d
|
scavenger receptor cysteine rich family member with 4 domains |
| chr3_+_15379109 | 0.10 |
ENSRNOT00000036495
|
Morn5
|
MORN repeat containing 5 |
| chr19_+_10731855 | 0.10 |
ENSRNOT00000022277
|
Pllp
|
plasmolipin |
| chr1_-_214163808 | 0.10 |
ENSRNOT00000082284
|
Rnh1
|
ribonuclease/angiogenin inhibitor 1 |
| chr19_+_26142720 | 0.10 |
ENSRNOT00000005270
|
RGD1564093
|
similar to RIKEN cDNA 2310036O22 |
| chr1_-_89473904 | 0.10 |
ENSRNOT00000089474
|
Fxyd5
|
FXYD domain-containing ion transport regulator 5 |
| chr11_+_33909439 | 0.10 |
ENSRNOT00000002310
|
Cbr3
|
carbonyl reductase 3 |
| chr5_+_138300107 | 0.10 |
ENSRNOT00000047151
|
Cldn19
|
claudin 19 |
| chr8_+_118926478 | 0.10 |
ENSRNOT00000028426
|
Ccdc12
|
coiled-coil domain containing 12 |
| chr2_+_150211898 | 0.10 |
ENSRNOT00000018767
|
Sucnr1
|
succinate receptor 1 |
| chr1_-_188190778 | 0.10 |
ENSRNOT00000092657
ENSRNOT00000022988 |
Coq7
|
coenzyme Q7, hydroxylase |
| chr2_-_198339130 | 0.10 |
ENSRNOT00000028767
|
Bola1
|
bolA family member 1 |
| chr11_-_27971359 | 0.10 |
ENSRNOT00000085629
ENSRNOT00000051060 ENSRNOT00000042581 ENSRNOT00000050073 ENSRNOT00000081066 |
Grik1
|
glutamate ionotropic receptor kainate type subunit 1 |
| chr4_+_172119331 | 0.10 |
ENSRNOT00000010579
|
Mgst1
|
microsomal glutathione S-transferase 1 |
| chr1_+_101152734 | 0.10 |
ENSRNOT00000028022
|
Pih1d1
|
PIH1 domain containing 1 |
| chr8_-_117932518 | 0.10 |
ENSRNOT00000028130
|
Camp
|
cathelicidin antimicrobial peptide |
| chr3_+_79876938 | 0.09 |
ENSRNOT00000015757
|
Psmc3
|
proteasome 26S subunit, ATPase 3 |
| chr5_-_72287669 | 0.09 |
ENSRNOT00000022255
|
Klf4
|
Kruppel like factor 4 |
| chr2_+_197682000 | 0.09 |
ENSRNOT00000066821
|
Hormad1
|
HORMA domain containing 1 |
| chr10_+_108395860 | 0.09 |
ENSRNOT00000075796
|
Gaa
|
glucosidase, alpha, acid |
| chr10_-_109909646 | 0.09 |
ENSRNOT00000074362
ENSRNOT00000088907 |
Dcxr
|
dicarbonyl and L-xylulose reductase |
| chr3_+_66673246 | 0.09 |
ENSRNOT00000081338
|
Ppp1r1c
|
protein phosphatase 1, regulatory (inhibitor) subunit 1C |
| chr10_-_13780283 | 0.09 |
ENSRNOT00000084200
|
AC103090.1
|
|
| chr2_-_148807813 | 0.09 |
ENSRNOT00000047649
|
AC112531.1
|
|
| chr13_+_48689962 | 0.09 |
ENSRNOT00000079707
|
Nucks1
|
nuclear casein kinase and cyclin-dependent kinase substrate 1 |
| chr1_-_7801438 | 0.09 |
ENSRNOT00000022273
|
AABR07000276.1
|
|
| chr4_-_100783750 | 0.09 |
ENSRNOT00000078956
|
Kcmf1
|
potassium channel modulatory factor 1 |
| chr9_+_95274707 | 0.09 |
ENSRNOT00000045163
|
Ugt1a5
|
UDP glucuronosyltransferase family 1 member A5 |
| chr19_-_26243223 | 0.09 |
ENSRNOT00000037766
|
Zfp791
|
zinc finger protein 791 |
| chr7_+_11321057 | 0.09 |
ENSRNOT00000027737
|
Mrpl54
|
mitochondrial ribosomal protein L54 |
| chr10_-_94576512 | 0.09 |
ENSRNOT00000035474
|
Icam2
|
intercellular adhesion molecule 2 |
| chr2_-_56151531 | 0.09 |
ENSRNOT00000040847
ENSRNOT00000080677 |
Osmr
|
oncostatin M receptor |
| chr4_-_120408232 | 0.09 |
ENSRNOT00000073269
|
LOC100911337
|
40S ribosomal protein S25-like |
| chr3_+_170996193 | 0.09 |
ENSRNOT00000008959
|
Spo11
|
SPO11, initiator of meiotic double stranded breaks |
| chr5_+_135997052 | 0.09 |
ENSRNOT00000024921
|
Tctex1d4
|
Tctex1 domain containing 4 |
| chrX_-_63803915 | 0.09 |
ENSRNOT00000076938
|
Maged1
|
MAGE family member D1 |
| chr8_+_14060394 | 0.09 |
ENSRNOT00000014827
|
Smco4
|
single-pass membrane protein with coiled-coil domains 4 |
| chr10_+_83104622 | 0.09 |
ENSRNOT00000072972
|
AABR07030375.2
|
|
| chr17_-_32015071 | 0.09 |
ENSRNOT00000070876
|
LOC100911107
|
leukocyte elastase inhibitor A-like |
| chr10_+_56662561 | 0.08 |
ENSRNOT00000025254
|
Asgr1
|
asialoglycoprotein receptor 1 |
| chr7_-_14217778 | 0.08 |
ENSRNOT00000038961
|
Ephx3
|
epoxide hydrolase 3 |
| chr10_+_40208223 | 0.08 |
ENSRNOT00000000772
|
Hint1
|
histidine triad nucleotide binding protein 1 |
| chr8_+_118525682 | 0.08 |
ENSRNOT00000028288
|
Elp6
|
elongator acetyltransferase complex subunit 6 |
| chr3_+_161343883 | 0.08 |
ENSRNOT00000023202
|
Pcif1
|
PDX1 C-terminal inhibiting factor 1 |
| chr19_+_26016382 | 0.08 |
ENSRNOT00000004601
|
Klf1
|
Kruppel like factor 1 |
| chr2_-_88553086 | 0.08 |
ENSRNOT00000042494
|
LOC361914
|
similar to solute carrier family 7 (cationic amino acid transporter, y+ system), member 12 |
| chr8_-_122841477 | 0.08 |
ENSRNOT00000014861
|
Cmtm7
|
CKLF-like MARVEL transmembrane domain containing 7 |
| chr7_+_116671948 | 0.08 |
ENSRNOT00000077773
ENSRNOT00000029711 |
Gli4
|
GLI family zinc finger 4 |
| chr4_+_118814284 | 0.08 |
ENSRNOT00000024884
|
Nfu1
|
NFU1 iron-sulfur cluster scaffold |
| chr11_+_72044096 | 0.08 |
ENSRNOT00000034757
|
Senp5
|
SUMO1/sentrin specific peptidase 5 |
| chr14_-_44375804 | 0.08 |
ENSRNOT00000042825
|
LOC100362751
|
ribosomal protein P2-like |
| chr10_-_59112788 | 0.08 |
ENSRNOT00000041886
|
Spns3
|
SPNS sphingolipid transporter 3 |
| chr16_-_61753476 | 0.08 |
ENSRNOT00000016792
|
Saraf
|
store-operated calcium entry-associated regulatory factor |
| chr5_-_17061837 | 0.08 |
ENSRNOT00000011892
|
Penk
|
proenkephalin |
| chr11_+_72892448 | 0.08 |
ENSRNOT00000075655
|
LOC103689978
|
sentrin-specific protease 5 |
| chr5_+_29538380 | 0.08 |
ENSRNOT00000010845
|
Calb1
|
calbindin 1 |
| chr10_+_37215937 | 0.08 |
ENSRNOT00000006567
|
Sar1b
|
secretion associated, Ras related GTPase 1B |
| chr19_-_37912027 | 0.08 |
ENSRNOT00000026462
|
Psmb10
|
proteasome subunit beta 10 |
| chr1_-_90685257 | 0.08 |
ENSRNOT00000037700
|
Chst8
|
carbohydrate sulfotransferase 8 |
| chr10_-_82374171 | 0.08 |
ENSRNOT00000032693
|
Eme1
|
essential meiotic structure-specific endonuclease 1 |
| chr17_+_57040023 | 0.08 |
ENSRNOT00000020204
|
Crem
|
cAMP responsive element modulator |
| chr15_-_37826211 | 0.08 |
ENSRNOT00000064702
|
Eef1akmt1
|
eukaryotic translation elongation factor 1 alpha lysine methyltransferase 1 |
| chr13_+_52553775 | 0.08 |
ENSRNOT00000011991
|
Csrp1
|
cysteine and glycine-rich protein 1 |
| chr2_+_248723255 | 0.08 |
ENSRNOT00000015032
|
Gtf2b
|
general transcription factor IIB |
| chr1_+_222311253 | 0.08 |
ENSRNOT00000028749
|
Macrod1
|
MACRO domain containing 1 |
| chr7_-_117364322 | 0.08 |
ENSRNOT00000080724
|
Oplah
|
5-oxoprolinase (ATP-hydrolysing) |
| chr10_+_89352835 | 0.08 |
ENSRNOT00000028060
|
Rpl27
|
ribosomal protein L27 |
| chr7_-_123088279 | 0.08 |
ENSRNOT00000071998
|
Tob2
|
transducer of ERBB2, 2 |
| chr8_-_61919874 | 0.08 |
ENSRNOT00000064830
|
RGD1305464
|
similar to human chromosome 15 open reading frame 39 |
| chr3_-_10371240 | 0.08 |
ENSRNOT00000012075
|
Ass1
|
argininosuccinate synthase 1 |
| chr1_+_15093599 | 0.08 |
ENSRNOT00000016354
|
Il22ra2
|
interleukin 22 receptor subunit alpha 2 |
| chr19_+_24701049 | 0.08 |
ENSRNOT00000035890
|
Ndufb7
|
NADH:ubiquinone oxidoreductase subunit B7 |
| chr1_+_219390523 | 0.07 |
ENSRNOT00000054852
|
Gpr152
|
G protein-coupled receptor 152 |
| chr8_-_14292698 | 0.07 |
ENSRNOT00000073672
|
AABR07069238.1
|
|
| chr14_-_79462080 | 0.07 |
ENSRNOT00000082180
|
Grpel1
|
GrpE-like 1, mitochondrial |
| chr14_+_44524753 | 0.07 |
ENSRNOT00000076245
|
Rpl9
|
ribosomal protein L9 |
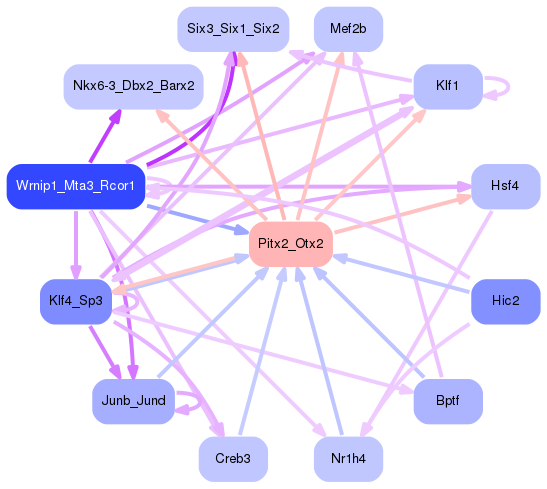
Network of associatons between targets according to the STRING database.

First level regulatory network of Pitx2_Otx2
Gene Ontology Analysis
Gene overrepresentation in biological process category:
| Log-likelihood per target | Total log-likelihood | Term | Description |
|---|---|---|---|
| 0.2 | 0.7 | GO:0002125 | maternal aggressive behavior(GO:0002125) |
| 0.1 | 0.4 | GO:0006524 | alanine catabolic process(GO:0006524) pyruvate family amino acid catabolic process(GO:0009080) |
| 0.1 | 0.3 | GO:0060974 | cell migration involved in heart formation(GO:0060974) |
| 0.1 | 0.3 | GO:0014016 | neuroblast differentiation(GO:0014016) |
| 0.1 | 0.3 | GO:0001998 | ovarian follicle rupture(GO:0001543) angiotensin mediated vasoconstriction involved in regulation of systemic arterial blood pressure(GO:0001998) regulation of renal output by angiotensin(GO:0002019) regulation of extracellular matrix constituent secretion(GO:0003330) positive regulation of extracellular matrix constituent secretion(GO:0003331) response to muscle activity involved in regulation of muscle adaptation(GO:0014873) |
| 0.1 | 0.3 | GO:0046087 | cytidine catabolic process(GO:0006216) cytidine deamination(GO:0009972) cytidine metabolic process(GO:0046087) |
| 0.1 | 0.2 | GO:0021558 | trochlear nerve development(GO:0021558) |
| 0.1 | 0.3 | GO:0043988 | histone H3-S28 phosphorylation(GO:0043988) |
| 0.1 | 0.2 | GO:0051867 | general adaptation syndrome, behavioral process(GO:0051867) |
| 0.1 | 0.2 | GO:1902071 | regulation of hypoxia-inducible factor-1alpha signaling pathway(GO:1902071) |
| 0.1 | 0.2 | GO:0070682 | proteasome regulatory particle assembly(GO:0070682) |
| 0.1 | 0.2 | GO:0052422 | modulation of catalytic activity in other organism involved in symbiotic interaction(GO:0052203) modulation by host of symbiont catalytic activity(GO:0052422) |
| 0.1 | 0.2 | GO:0060370 | susceptibility to T cell mediated cytotoxicity(GO:0060370) |
| 0.0 | 0.1 | GO:0045210 | negative regulation of dendritic cell cytokine production(GO:0002731) FasL biosynthetic process(GO:0045210) |
| 0.0 | 0.1 | GO:0019287 | isopentenyl diphosphate biosynthetic process, mevalonate pathway(GO:0019287) |
| 0.0 | 0.1 | GO:0000053 | argininosuccinate metabolic process(GO:0000053) |
| 0.0 | 0.3 | GO:0010890 | positive regulation of sequestering of triglyceride(GO:0010890) |
| 0.0 | 0.2 | GO:0052651 | monoacylglycerol metabolic process(GO:0046462) monoacylglycerol catabolic process(GO:0052651) |
| 0.0 | 0.1 | GO:0044375 | regulation of peroxisome size(GO:0044375) |
| 0.0 | 0.2 | GO:1902746 | regulation of lens fiber cell differentiation(GO:1902746) |
| 0.0 | 0.2 | GO:0045415 | negative regulation of interleukin-8 biosynthetic process(GO:0045415) |
| 0.0 | 0.1 | GO:1903769 | negative regulation of cell proliferation in bone marrow(GO:1903769) |
| 0.0 | 0.3 | GO:0014886 | transition between slow and fast fiber(GO:0014886) |
| 0.0 | 0.2 | GO:0000706 | meiotic DNA double-strand break processing(GO:0000706) |
| 0.0 | 0.1 | GO:2000422 | regulation of eosinophil chemotaxis(GO:2000422) positive regulation of eosinophil chemotaxis(GO:2000424) |
| 0.0 | 0.1 | GO:0070268 | cuticle development(GO:0042335) cornification(GO:0070268) |
| 0.0 | 0.2 | GO:0002238 | response to molecule of fungal origin(GO:0002238) |
| 0.0 | 0.1 | GO:0051725 | protein de-ADP-ribosylation(GO:0051725) |
| 0.0 | 0.1 | GO:1904178 | sterol regulatory element binding protein import into nucleus(GO:0035105) negative regulation of adipose tissue development(GO:1904178) |
| 0.0 | 0.1 | GO:0071049 | nuclear mRNA surveillance of mRNA 3'-end processing(GO:0071031) nuclear polyadenylation-dependent tRNA catabolic process(GO:0071038) nuclear retention of pre-mRNA with aberrant 3'-ends at the site of transcription(GO:0071049) |
| 0.0 | 0.1 | GO:0006788 | heme oxidation(GO:0006788) |
| 0.0 | 0.1 | GO:0003011 | involuntary skeletal muscle contraction(GO:0003011) |
| 0.0 | 0.1 | GO:0042376 | phylloquinone metabolic process(GO:0042374) phylloquinone catabolic process(GO:0042376) quinone catabolic process(GO:1901662) |
| 0.0 | 0.1 | GO:0001306 | age-dependent response to oxidative stress(GO:0001306) age-dependent general metabolic decline(GO:0007571) |
| 0.0 | 0.2 | GO:0030222 | eosinophil differentiation(GO:0030222) |
| 0.0 | 0.1 | GO:0006420 | arginyl-tRNA aminoacylation(GO:0006420) |
| 0.0 | 0.2 | GO:0010037 | response to carbon dioxide(GO:0010037) |
| 0.0 | 0.1 | GO:1902659 | regulation of glucose mediated signaling pathway(GO:1902659) |
| 0.0 | 0.2 | GO:0075525 | viral translational termination-reinitiation(GO:0075525) |
| 0.0 | 0.6 | GO:0032291 | central nervous system myelination(GO:0022010) axon ensheathment in central nervous system(GO:0032291) |
| 0.0 | 0.1 | GO:0051005 | regulation of phosphatidylcholine catabolic process(GO:0010899) negative regulation of lipoprotein lipase activity(GO:0051005) |
| 0.0 | 0.3 | GO:0006348 | chromatin silencing at telomere(GO:0006348) |
| 0.0 | 0.2 | GO:2000253 | positive regulation of feeding behavior(GO:2000253) |
| 0.0 | 0.1 | GO:0072429 | response to intra-S DNA damage checkpoint signaling(GO:0072429) |
| 0.0 | 0.5 | GO:0006098 | pentose-phosphate shunt(GO:0006098) glyceraldehyde-3-phosphate metabolic process(GO:0019682) |
| 0.0 | 0.1 | GO:0032632 | interleukin-3 production(GO:0032632) cadmium ion homeostasis(GO:0055073) |
| 0.0 | 0.1 | GO:0003100 | regulation of systemic arterial blood pressure by endothelin(GO:0003100) |
| 0.0 | 0.1 | GO:0009249 | protein lipoylation(GO:0009249) |
| 0.0 | 0.1 | GO:0072702 | regulation of endoplasmic reticulum stress-induced eIF2 alpha phosphorylation(GO:0060734) response to methyl methanesulfonate(GO:0072702) cellular response to methyl methanesulfonate(GO:0072703) response to environmental enrichment(GO:0090648) positive regulation of peptidyl-serine dephosphorylation(GO:1902310) |
| 0.0 | 0.1 | GO:1904970 | brush border assembly(GO:1904970) |
| 0.0 | 0.1 | GO:0007597 | blood coagulation, intrinsic pathway(GO:0007597) |
| 0.0 | 0.1 | GO:0019046 | viral latency(GO:0019042) release from viral latency(GO:0019046) |
| 0.0 | 0.1 | GO:0038165 | oncostatin-M-mediated signaling pathway(GO:0038165) |
| 0.0 | 0.1 | GO:0051462 | cortisol secretion(GO:0043400) regulation of cortisol secretion(GO:0051462) |
| 0.0 | 0.3 | GO:0006123 | mitochondrial electron transport, cytochrome c to oxygen(GO:0006123) |
| 0.0 | 0.1 | GO:0060574 | intestinal epithelial cell maturation(GO:0060574) |
| 0.0 | 0.1 | GO:1900220 | semaphorin-plexin signaling pathway involved in bone trabecula morphogenesis(GO:1900220) |
| 0.0 | 0.1 | GO:0021699 | cerebellar cortex maturation(GO:0021699) |
| 0.0 | 0.1 | GO:0002337 | B-1a B cell differentiation(GO:0002337) |
| 0.0 | 0.1 | GO:0035502 | metanephric part of ureteric bud development(GO:0035502) |
| 0.0 | 0.1 | GO:1900060 | negative regulation of ceramide biosynthetic process(GO:1900060) |
| 0.0 | 0.1 | GO:1904798 | positive regulation of core promoter binding(GO:1904798) |
| 0.0 | 0.1 | GO:0090383 | phagosome acidification(GO:0090383) |
| 0.0 | 0.1 | GO:0071224 | cellular response to peptidoglycan(GO:0071224) |
| 0.0 | 0.1 | GO:1901873 | regulation of post-translational protein modification(GO:1901873) |
| 0.0 | 0.1 | GO:0010877 | lipid transport involved in lipid storage(GO:0010877) |
| 0.0 | 0.3 | GO:0030150 | protein import into mitochondrial matrix(GO:0030150) |
| 0.0 | 0.2 | GO:0045717 | negative regulation of fatty acid biosynthetic process(GO:0045717) |
| 0.0 | 0.1 | GO:0036151 | phosphatidylcholine acyl-chain remodeling(GO:0036151) |
| 0.0 | 0.0 | GO:0070433 | negative regulation of nucleotide-binding oligomerization domain containing signaling pathway(GO:0070425) negative regulation of nucleotide-binding oligomerization domain containing 2 signaling pathway(GO:0070433) |
| 0.0 | 0.2 | GO:0071688 | striated muscle myosin thick filament assembly(GO:0071688) |
| 0.0 | 0.2 | GO:0016926 | protein desumoylation(GO:0016926) |
| 0.0 | 0.1 | GO:0031665 | negative regulation of lipopolysaccharide-mediated signaling pathway(GO:0031665) |
| 0.0 | 0.0 | GO:0006651 | diacylglycerol biosynthetic process(GO:0006651) |
| 0.0 | 0.2 | GO:0019370 | glutathione biosynthetic process(GO:0006750) leukotriene biosynthetic process(GO:0019370) |
| 0.0 | 0.0 | GO:0010796 | regulation of multivesicular body size(GO:0010796) |
| 0.0 | 0.0 | GO:0015965 | diadenosine polyphosphate biosynthetic process(GO:0015960) diadenosine tetraphosphate metabolic process(GO:0015965) diadenosine tetraphosphate biosynthetic process(GO:0015966) |
| 0.0 | 0.1 | GO:0070318 | positive regulation of G0 to G1 transition(GO:0070318) |
| 0.0 | 0.0 | GO:1902608 | regulation of large conductance calcium-activated potassium channel activity(GO:1902606) positive regulation of large conductance calcium-activated potassium channel activity(GO:1902608) |
| 0.0 | 0.0 | GO:2001183 | negative regulation of interleukin-12 secretion(GO:2001183) |
| 0.0 | 0.1 | GO:0006432 | phenylalanyl-tRNA aminoacylation(GO:0006432) |
| 0.0 | 0.0 | GO:0048210 | Golgi vesicle fusion to target membrane(GO:0048210) |
| 0.0 | 0.1 | GO:0070525 | tRNA threonylcarbamoyladenosine metabolic process(GO:0070525) |
| 0.0 | 0.0 | GO:0010265 | SCF complex assembly(GO:0010265) |
| 0.0 | 0.0 | GO:0034241 | positive regulation of macrophage fusion(GO:0034241) |
| 0.0 | 0.0 | GO:1902527 | positive regulation of protein monoubiquitination(GO:1902527) |
| 0.0 | 0.1 | GO:0021966 | corticospinal neuron axon guidance(GO:0021966) |
| 0.0 | 0.0 | GO:0002215 | defense response to nematode(GO:0002215) |
| 0.0 | 0.1 | GO:0002339 | B cell selection(GO:0002339) |
| 0.0 | 0.1 | GO:0060631 | regulation of meiosis I(GO:0060631) |
| 0.0 | 0.0 | GO:0006311 | meiotic gene conversion(GO:0006311) gene conversion(GO:0035822) |
| 0.0 | 0.1 | GO:2000354 | regulation of ovarian follicle development(GO:2000354) |
| 0.0 | 0.1 | GO:1990504 | dense core granule exocytosis(GO:1990504) |
| 0.0 | 0.0 | GO:0070084 | protein initiator methionine removal(GO:0070084) |
| 0.0 | 0.0 | GO:0034441 | plasma lipoprotein particle oxidation(GO:0034441) negative regulation of lipoprotein oxidation(GO:0034443) |
| 0.0 | 0.0 | GO:0035606 | peptidyl-cysteine S-trans-nitrosylation(GO:0035606) |
| 0.0 | 0.1 | GO:0032914 | positive regulation of transforming growth factor beta1 production(GO:0032914) |
| 0.0 | 0.0 | GO:0070638 | nicotinamide riboside catabolic process(GO:0006738) nicotinamide riboside metabolic process(GO:0046495) pyridine nucleoside metabolic process(GO:0070637) pyridine nucleoside catabolic process(GO:0070638) |
| 0.0 | 0.1 | GO:0006782 | protoporphyrinogen IX biosynthetic process(GO:0006782) |
| 0.0 | 0.0 | GO:0035553 | oxidative RNA demethylation(GO:0035513) oxidative single-stranded DNA demethylation(GO:0035552) oxidative single-stranded RNA demethylation(GO:0035553) |
| 0.0 | 0.0 | GO:0043366 | beta selection(GO:0043366) |
| 0.0 | 0.0 | GO:0016129 | phytosteroid metabolic process(GO:0016128) phytosteroid biosynthetic process(GO:0016129) |
| 0.0 | 0.1 | GO:0036233 | glycine import(GO:0036233) |
| 0.0 | 0.1 | GO:0002943 | tRNA dihydrouridine synthesis(GO:0002943) |
| 0.0 | 0.1 | GO:0046784 | viral mRNA export from host cell nucleus(GO:0046784) |
| 0.0 | 0.0 | GO:0098759 | response to interleukin-8(GO:0098758) cellular response to interleukin-8(GO:0098759) |
| 0.0 | 0.0 | GO:0019556 | histidine catabolic process to glutamate and formamide(GO:0019556) formamide metabolic process(GO:0043606) |
| 0.0 | 0.0 | GO:0043323 | positive regulation of natural killer cell degranulation(GO:0043323) |
| 0.0 | 0.0 | GO:0046038 | guanine salvage(GO:0006178) GMP catabolic process(GO:0046038) guanine biosynthetic process(GO:0046099) |
| 0.0 | 0.1 | GO:0015866 | ADP transport(GO:0015866) |
| 0.0 | 0.1 | GO:0001766 | membrane raft polarization(GO:0001766) membrane raft distribution(GO:0031580) |
| 0.0 | 0.0 | GO:0016557 | peroxisome membrane biogenesis(GO:0016557) |
| 0.0 | 0.0 | GO:0006004 | fucose metabolic process(GO:0006004) |
| 0.0 | 0.1 | GO:2000346 | negative regulation of hepatocyte proliferation(GO:2000346) |
| 0.0 | 0.1 | GO:0006703 | estrogen biosynthetic process(GO:0006703) |
| 0.0 | 0.0 | GO:0030186 | melatonin metabolic process(GO:0030186) |
| 0.0 | 0.0 | GO:0030043 | actin filament fragmentation(GO:0030043) |
| 0.0 | 0.2 | GO:0036159 | inner dynein arm assembly(GO:0036159) |
| 0.0 | 0.1 | GO:0051790 | threonine metabolic process(GO:0006566) short-chain fatty acid biosynthetic process(GO:0051790) |
| 0.0 | 0.0 | GO:0044208 | 'de novo' AMP biosynthetic process(GO:0044208) |
| 0.0 | 0.1 | GO:1901642 | nucleoside transmembrane transport(GO:1901642) |
| 0.0 | 0.0 | GO:0060332 | positive regulation of response to interferon-gamma(GO:0060332) positive regulation of interferon-gamma-mediated signaling pathway(GO:0060335) |
| 0.0 | 0.1 | GO:1990564 | protein polyufmylation(GO:1990564) protein K69-linked ufmylation(GO:1990592) |
| 0.0 | 0.1 | GO:0052697 | xenobiotic glucuronidation(GO:0052697) |
Gene overrepresentation in cellular component category:
| Log-likelihood per target | Total log-likelihood | Term | Description |
|---|---|---|---|
| 0.1 | 0.2 | GO:0070557 | PCNA-p21 complex(GO:0070557) |
| 0.1 | 0.3 | GO:0032133 | chromosome passenger complex(GO:0032133) |
| 0.0 | 0.2 | GO:0032280 | symmetric synapse(GO:0032280) |
| 0.0 | 0.1 | GO:0000408 | EKC/KEOPS complex(GO:0000408) |
| 0.0 | 0.3 | GO:0008540 | proteasome regulatory particle, base subcomplex(GO:0008540) |
| 0.0 | 0.1 | GO:0070821 | tertiary granule membrane(GO:0070821) |
| 0.0 | 0.3 | GO:0005796 | Golgi lumen(GO:0005796) |
| 0.0 | 0.2 | GO:0005744 | mitochondrial inner membrane presequence translocase complex(GO:0005744) |
| 0.0 | 0.1 | GO:1902560 | GMP reductase complex(GO:1902560) |
| 0.0 | 0.3 | GO:0044666 | MLL3/4 complex(GO:0044666) |
| 0.0 | 0.3 | GO:0000276 | mitochondrial proton-transporting ATP synthase complex, coupling factor F(o)(GO:0000276) |
| 0.0 | 0.2 | GO:0030891 | VCB complex(GO:0030891) |
| 0.0 | 0.1 | GO:0005853 | eukaryotic translation elongation factor 1 complex(GO:0005853) |
| 0.0 | 0.1 | GO:1990716 | axonemal central apparatus(GO:1990716) |
| 0.0 | 0.1 | GO:0097255 | R2TP complex(GO:0097255) |
| 0.0 | 0.1 | GO:1990005 | granular vesicle(GO:1990005) |
| 0.0 | 0.3 | GO:0005751 | mitochondrial respiratory chain complex IV(GO:0005751) |
| 0.0 | 0.1 | GO:0048476 | Holliday junction resolvase complex(GO:0048476) |
| 0.0 | 0.1 | GO:0032983 | kainate selective glutamate receptor complex(GO:0032983) |
| 0.0 | 0.0 | GO:0000814 | ESCRT II complex(GO:0000814) |
| 0.0 | 0.1 | GO:0035339 | SPOTS complex(GO:0035339) |
| 0.0 | 0.1 | GO:0042719 | mitochondrial intermembrane space protein transporter complex(GO:0042719) |
| 0.0 | 0.0 | GO:1990590 | ATF1-ATF4 transcription factor complex(GO:1990590) |
| 0.0 | 0.1 | GO:0000445 | THO complex(GO:0000347) THO complex part of transcription export complex(GO:0000445) |
| 0.0 | 0.2 | GO:0005859 | muscle myosin complex(GO:0005859) |
| 0.0 | 0.1 | GO:1990111 | spermatoproteasome complex(GO:1990111) |
| 0.0 | 0.1 | GO:0005638 | lamin filament(GO:0005638) |
| 0.0 | 0.0 | GO:0032798 | Swi5-Sfr1 complex(GO:0032798) |
| 0.0 | 0.2 | GO:0031362 | anchored component of external side of plasma membrane(GO:0031362) |
| 0.0 | 0.1 | GO:0005827 | polar microtubule(GO:0005827) |
| 0.0 | 0.1 | GO:0033588 | Elongator holoenzyme complex(GO:0033588) |
| 0.0 | 0.0 | GO:0061474 | phagolysosome membrane(GO:0061474) |
| 0.0 | 0.0 | GO:0031510 | SUMO activating enzyme complex(GO:0031510) |
| 0.0 | 0.0 | GO:0031021 | interphase microtubule organizing center(GO:0031021) |
| 0.0 | 0.0 | GO:0005749 | mitochondrial respiratory chain complex II, succinate dehydrogenase complex (ubiquinone)(GO:0005749) succinate dehydrogenase complex (ubiquinone)(GO:0045257) fumarate reductase complex(GO:0045283) |
| 0.0 | 0.1 | GO:0002189 | ribose phosphate diphosphokinase complex(GO:0002189) |
| 0.0 | 0.1 | GO:0005786 | signal recognition particle, endoplasmic reticulum targeting(GO:0005786) |
| 0.0 | 0.2 | GO:0005922 | connexon complex(GO:0005922) |
| 0.0 | 0.5 | GO:0005747 | mitochondrial respiratory chain complex I(GO:0005747) NADH dehydrogenase complex(GO:0030964) respiratory chain complex I(GO:0045271) |
Gene overrepresentation in molecular function category:
| Log-likelihood per target | Total log-likelihood | Term | Description |
|---|---|---|---|
| 0.3 | 0.8 | GO:0019807 | aspartoacylase activity(GO:0019807) |
| 0.2 | 0.7 | GO:0031893 | vasopressin receptor binding(GO:0031893) |
| 0.1 | 0.8 | GO:0004865 | protein serine/threonine phosphatase inhibitor activity(GO:0004865) |
| 0.1 | 0.3 | GO:0051870 | methotrexate binding(GO:0051870) |
| 0.1 | 0.2 | GO:0019912 | cyclin-dependent protein kinase activating kinase activity(GO:0019912) |
| 0.1 | 0.2 | GO:0004464 | leukotriene-C4 synthase activity(GO:0004464) |
| 0.1 | 0.3 | GO:0004126 | cytidine deaminase activity(GO:0004126) |
| 0.0 | 0.1 | GO:0001565 | phorbol ester receptor activity(GO:0001565) |
| 0.0 | 0.2 | GO:0061505 | DNA topoisomerase type II (ATP-hydrolyzing) activity(GO:0003918) DNA topoisomerase II activity(GO:0061505) |
| 0.0 | 0.3 | GO:0043199 | sulfate binding(GO:0043199) |
| 0.0 | 0.1 | GO:0004574 | oligo-1,6-glucosidase activity(GO:0004574) |
| 0.0 | 0.1 | GO:0004392 | heme oxygenase (decyclizing) activity(GO:0004392) |
| 0.0 | 0.1 | GO:0000253 | 3-keto sterol reductase activity(GO:0000253) |
| 0.0 | 0.1 | GO:0004814 | arginine-tRNA ligase activity(GO:0004814) |
| 0.0 | 0.3 | GO:0008430 | selenium binding(GO:0008430) |
| 0.0 | 0.1 | GO:0004924 | oncostatin-M receptor activity(GO:0004924) |
| 0.0 | 0.2 | GO:0001515 | opioid peptide activity(GO:0001515) |
| 0.0 | 0.3 | GO:0035174 | histone serine kinase activity(GO:0035174) |
| 0.0 | 0.1 | GO:0017168 | 5-oxoprolinase (ATP-hydrolyzing) activity(GO:0017168) |
| 0.0 | 0.2 | GO:0015266 | protein channel activity(GO:0015266) |
| 0.0 | 0.1 | GO:0001010 | transcription factor activity, sequence-specific DNA binding transcription factor recruiting(GO:0001010) |
| 0.0 | 0.1 | GO:0034618 | arginine binding(GO:0034618) |
| 0.0 | 0.3 | GO:0019911 | structural constituent of myelin sheath(GO:0019911) |
| 0.0 | 0.1 | GO:0019863 | IgE binding(GO:0019863) advanced glycation end-product receptor activity(GO:0050785) |
| 0.0 | 0.1 | GO:0004739 | pyruvate dehydrogenase (acetyl-transferring) activity(GO:0004739) |
| 0.0 | 0.1 | GO:0030156 | benzodiazepine receptor binding(GO:0030156) |
| 0.0 | 0.1 | GO:0047025 | 3-oxoacyl-[acyl-carrier-protein] reductase (NADH) activity(GO:0047025) |
| 0.0 | 0.1 | GO:0008970 | phosphatidylcholine 1-acylhydrolase activity(GO:0008970) |
| 0.0 | 0.1 | GO:0030942 | endoplasmic reticulum signal peptide binding(GO:0030942) |
| 0.0 | 0.1 | GO:0047708 | biotinidase activity(GO:0047708) |
| 0.0 | 0.2 | GO:0031702 | type 1 angiotensin receptor binding(GO:0031702) |
| 0.0 | 0.1 | GO:0099510 | calcium ion binding involved in regulation of cytosolic calcium ion concentration(GO:0099510) |
| 0.0 | 0.4 | GO:0016641 | oxidoreductase activity, acting on the CH-NH2 group of donors, oxygen as acceptor(GO:0016641) |
| 0.0 | 0.1 | GO:0003920 | GMP reductase activity(GO:0003920) oxidoreductase activity, acting on NAD(P)H, nitrogenous group as acceptor(GO:0016657) |
| 0.0 | 0.2 | GO:0008504 | monoamine transmembrane transporter activity(GO:0008504) |
| 0.0 | 0.1 | GO:0004982 | N-formyl peptide receptor activity(GO:0004982) |
| 0.0 | 0.2 | GO:0004861 | cyclin-dependent protein serine/threonine kinase inhibitor activity(GO:0004861) |
| 0.0 | 0.1 | GO:0070905 | serine binding(GO:0070905) |
| 0.0 | 0.1 | GO:0004859 | phospholipase inhibitor activity(GO:0004859) |
| 0.0 | 0.1 | GO:0008428 | ribonuclease inhibitor activity(GO:0008428) |
| 0.0 | 0.1 | GO:0004826 | phenylalanine-tRNA ligase activity(GO:0004826) |
| 0.0 | 0.2 | GO:0016929 | SUMO-specific protease activity(GO:0016929) |
| 0.0 | 0.1 | GO:0004948 | calcitonin receptor activity(GO:0004948) |
| 0.0 | 0.1 | GO:0036402 | proteasome-activating ATPase activity(GO:0036402) |
| 0.0 | 0.2 | GO:0032036 | myosin heavy chain binding(GO:0032036) |
| 0.0 | 0.3 | GO:0055106 | ubiquitin-protein transferase regulator activity(GO:0055106) |
| 0.0 | 0.1 | GO:0016842 | amidine-lyase activity(GO:0016842) |
| 0.0 | 0.0 | GO:0004605 | phosphatidate cytidylyltransferase activity(GO:0004605) |
| 0.0 | 0.2 | GO:0047372 | acylglycerol lipase activity(GO:0047372) |
| 0.0 | 0.2 | GO:0097493 | structural molecule activity conferring elasticity(GO:0097493) |
| 0.0 | 0.0 | GO:0046911 | metal chelating activity(GO:0046911) |
| 0.0 | 0.1 | GO:0046624 | sphingolipid transporter activity(GO:0046624) |
| 0.0 | 0.0 | GO:0042296 | ISG15 transferase activity(GO:0042296) |
| 0.0 | 0.1 | GO:0086062 | voltage-gated sodium channel activity involved in Purkinje myocyte action potential(GO:0086062) |
| 0.0 | 0.1 | GO:0005176 | ErbB-2 class receptor binding(GO:0005176) |
| 0.0 | 0.1 | GO:0001537 | N-acetylgalactosamine 4-O-sulfotransferase activity(GO:0001537) |
| 0.0 | 0.3 | GO:0004864 | protein phosphatase inhibitor activity(GO:0004864) |
| 0.0 | 0.2 | GO:0005243 | gap junction channel activity(GO:0005243) |
| 0.0 | 0.3 | GO:0008157 | protein phosphatase 1 binding(GO:0008157) |
| 0.0 | 0.0 | GO:0102007 | lactonohydrolase activity(GO:0046573) acyl-L-homoserine-lactone lactonohydrolase activity(GO:0102007) |
| 0.0 | 0.1 | GO:0015277 | kainate selective glutamate receptor activity(GO:0015277) |
| 0.0 | 0.0 | GO:0004459 | L-lactate dehydrogenase activity(GO:0004459) |
| 0.0 | 0.1 | GO:0047498 | calcium-dependent phospholipase A2 activity(GO:0047498) |
| 0.0 | 0.0 | GO:0004731 | purine-nucleoside phosphorylase activity(GO:0004731) |
| 0.0 | 0.0 | GO:0004514 | nicotinate-nucleotide diphosphorylase (carboxylating) activity(GO:0004514) |
| 0.0 | 0.0 | GO:0035515 | DNA demethylase activity(GO:0035514) oxidative RNA demethylase activity(GO:0035515) |
| 0.0 | 0.1 | GO:0090555 | phosphatidylethanolamine-translocating ATPase activity(GO:0090555) |
| 0.0 | 0.1 | GO:0070892 | lipoteichoic acid receptor activity(GO:0070892) |
| 0.0 | 0.1 | GO:0017150 | tRNA dihydrouridine synthase activity(GO:0017150) |
| 0.0 | 0.4 | GO:0001205 | transcriptional activator activity, RNA polymerase II distal enhancer sequence-specific binding(GO:0001205) |
| 0.0 | 0.0 | GO:0004918 | interleukin-8 receptor activity(GO:0004918) |
| 0.0 | 0.1 | GO:0004726 | non-membrane spanning protein tyrosine phosphatase activity(GO:0004726) |
| 0.0 | 0.1 | GO:0005384 | manganese ion transmembrane transporter activity(GO:0005384) |
| 0.0 | 0.0 | GO:0035539 | 8-oxo-7,8-dihydroguanosine triphosphate pyrophosphatase activity(GO:0008413) 8-oxo-7,8-dihydrodeoxyguanosine triphosphate pyrophosphatase activity(GO:0035539) |
| 0.0 | 0.2 | GO:0005184 | neuropeptide hormone activity(GO:0005184) |
| 0.0 | 0.0 | GO:0004060 | arylamine N-acetyltransferase activity(GO:0004060) |
| 0.0 | 0.0 | GO:0051538 | succinate dehydrogenase (ubiquinone) activity(GO:0008177) 3 iron, 4 sulfur cluster binding(GO:0051538) |
| 0.0 | 0.0 | GO:0004736 | pyruvate carboxylase activity(GO:0004736) |
| 0.0 | 0.0 | GO:0016608 | growth hormone-releasing hormone activity(GO:0016608) |
| 0.0 | 0.1 | GO:0019808 | polyamine binding(GO:0019808) |
| 0.0 | 0.1 | GO:0030215 | semaphorin receptor binding(GO:0030215) |
Gene overrepresentation in curated gene sets: canonical pathways category:
| Log-likelihood per target | Total log-likelihood | Term | Description |
|---|---|---|---|
| 0.0 | 0.2 | SA G2 AND M PHASES | Cdc25 activates the cdc2/cyclin B complex to induce the G2/M transition. |
| 0.0 | 0.0 | PID TCR RAS PATHWAY | Ras signaling in the CD4+ TCR pathway |
| 0.0 | 0.1 | ST INTERFERON GAMMA PATHWAY | Interferon gamma pathway. |
| 0.0 | 0.1 | ST JAK STAT PATHWAY | Jak-STAT Pathway |
| 0.0 | 0.2 | PID IL5 PATHWAY | IL5-mediated signaling events |
| 0.0 | 0.3 | PID PRL SIGNALING EVENTS PATHWAY | Signaling events mediated by PRL |
| 0.0 | 0.2 | PID SYNDECAN 3 PATHWAY | Syndecan-3-mediated signaling events |
| 0.0 | 0.2 | PID ERB GENOMIC PATHWAY | Validated nuclear estrogen receptor beta network |
Gene overrepresentation in curated gene sets: REACTOME pathways category:
| Log-likelihood per target | Total log-likelihood | Term | Description |
|---|---|---|---|
| 0.1 | 0.7 | REACTOME TRANSPORT OF ORGANIC ANIONS | Genes involved in Transport of organic anions |
| 0.0 | 0.2 | REACTOME ACYL CHAIN REMODELLING OF PI | Genes involved in Acyl chain remodelling of PI |
| 0.0 | 0.2 | REACTOME SCFSKP2 MEDIATED DEGRADATION OF P27 P21 | Genes involved in SCF(Skp2)-mediated degradation of p27/p21 |
| 0.0 | 0.2 | REACTOME ROLE OF DCC IN REGULATING APOPTOSIS | Genes involved in Role of DCC in regulating apoptosis |
| 0.0 | 0.2 | REACTOME METABOLISM OF PORPHYRINS | Genes involved in Metabolism of porphyrins |
| 0.0 | 0.2 | REACTOME OXYGEN DEPENDENT PROLINE HYDROXYLATION OF HYPOXIA INDUCIBLE FACTOR ALPHA | Genes involved in Oxygen-dependent Proline Hydroxylation of Hypoxia-inducible Factor Alpha |
| 0.0 | 0.4 | REACTOME GLUTATHIONE CONJUGATION | Genes involved in Glutathione conjugation |
| 0.0 | 0.2 | REACTOME GAP JUNCTION ASSEMBLY | Genes involved in Gap junction assembly |
| 0.0 | 0.7 | REACTOME APC C CDH1 MEDIATED DEGRADATION OF CDC20 AND OTHER APC C CDH1 TARGETED PROTEINS IN LATE MITOSIS EARLY G1 | Genes involved in APC/C:Cdh1 mediated degradation of Cdc20 and other APC/C:Cdh1 targeted proteins in late mitosis/early G1 |
| 0.0 | 0.5 | REACTOME MITOCHONDRIAL PROTEIN IMPORT | Genes involved in Mitochondrial Protein Import |
| 0.0 | 0.5 | REACTOME IMMUNOREGULATORY INTERACTIONS BETWEEN A LYMPHOID AND A NON LYMPHOID CELL | Genes involved in Immunoregulatory interactions between a Lymphoid and a non-Lymphoid cell |