Project
GSE49485: Hypoxia transcriptome sequencing of rat brain.
Navigation
Downloads
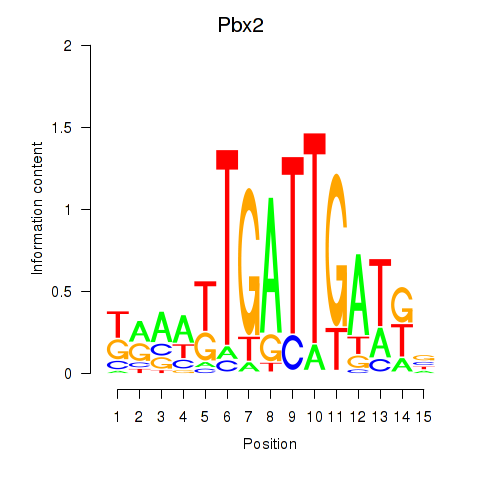
Results for Pbx2
Z-value: 0.43
Motif logo
Transcription factors associated with Pbx2
| Gene Symbol | Gene ID | Gene Info |
|---|---|---|
|
Pbx2
|
ENSRNOG00000000440 | PBX homeobox 2 |
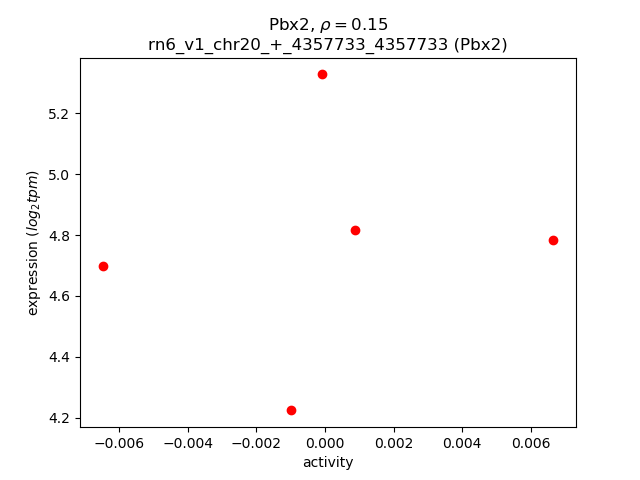
Activity-expression correlation:
| Gene | Promoter | Pearson corr. coef. | P-value | Plot |
|---|---|---|---|---|
| Pbx2 | rn6_v1_chr20_+_4357733_4357733 | 0.15 | 8.1e-01 | Click! |
Activity profile of Pbx2 motif
Sorted Z-values of Pbx2 motif
| Promoter | Log-likelihood | Transcript | Gene | Gene Info |
|---|---|---|---|---|
| chr4_-_147756294 | 0.18 |
ENSRNOT00000014537
|
Mbd4
|
methyl-CpG binding domain 4 DNA glycosylase |
| chrM_+_11736 | 0.16 |
ENSRNOT00000048767
|
Mt-nd5
|
mitochondrially encoded NADH dehydrogenase 5 |
| chr7_+_125288081 | 0.15 |
ENSRNOT00000085216
|
Parvg
|
parvin, gamma |
| chr1_-_155955173 | 0.10 |
ENSRNOT00000079345
|
AABR07004776.1
|
|
| chr9_+_67699379 | 0.08 |
ENSRNOT00000091237
ENSRNOT00000088183 |
Ctla4
|
cytotoxic T-lymphocyte-associated protein 4 |
| chr19_+_43338166 | 0.07 |
ENSRNOT00000091720
ENSRNOT00000084739 |
Fuk
|
fucokinase |
| chr17_+_70262363 | 0.06 |
ENSRNOT00000048933
|
Fam208b
|
family with sequence similarity 208, member B |
| chr12_-_37682964 | 0.06 |
ENSRNOT00000001421
|
RGD1563482
|
similar to hypothetical protein FLJ38663 |
| chr7_-_81592206 | 0.06 |
ENSRNOT00000007979
|
Angpt1
|
angiopoietin 1 |
| chr4_+_123801174 | 0.06 |
ENSRNOT00000029055
|
RGD1560289
|
similar to chromosome 3 open reading frame 20 |
| chr2_-_27296777 | 0.06 |
ENSRNOT00000080748
|
Ankdd1b
|
ankyrin repeat and death domain containing 1B |
| chrX_-_95062132 | 0.05 |
ENSRNOT00000049956
|
Nap1l3
|
nucleosome assembly protein 1-like 3 |
| chr1_-_250626844 | 0.05 |
ENSRNOT00000077135
|
Asah2
|
N-acylsphingosine amidohydrolase 2 |
| chr6_+_93461713 | 0.05 |
ENSRNOT00000031595
|
Arid4a
|
AT-rich interaction domain 4A |
| chr9_-_20154077 | 0.05 |
ENSRNOT00000082904
|
Adgrf5
|
adhesion G protein-coupled receptor F5 |
| chr1_+_203524426 | 0.05 |
ENSRNOT00000028020
|
Bub3
|
BUB3 mitotic checkpoint protein |
| chr2_+_127489771 | 0.05 |
ENSRNOT00000093581
|
Intu
|
inturned planar cell polarity protein |
| chr4_-_34282351 | 0.05 |
ENSRNOT00000011123
|
Rpa3
|
replication protein A3 |
| chr8_-_13835168 | 0.05 |
ENSRNOT00000014435
|
Med17
|
mediator complex subunit 17 |
| chr2_+_235738416 | 0.05 |
ENSRNOT00000074209
|
Etnppl
|
ethanolamine-phosphate phospho-lyase |
| chr6_-_126710854 | 0.05 |
ENSRNOT00000081127
ENSRNOT00000064914 |
Btbd7
|
BTB domain containing 7 |
| chr17_-_32015071 | 0.05 |
ENSRNOT00000070876
|
LOC100911107
|
leukocyte elastase inhibitor A-like |
| chr8_-_124399494 | 0.05 |
ENSRNOT00000037883
|
Tgfbr2
|
transforming growth factor, beta receptor 2 |
| chr13_-_74520634 | 0.05 |
ENSRNOT00000077169
|
Ralgps2
|
Ral GEF with PH domain and SH3 binding motif 2 |
| chr1_+_88955440 | 0.05 |
ENSRNOT00000091101
|
Prodh2
|
proline dehydrogenase 2 |
| chr9_+_77320726 | 0.05 |
ENSRNOT00000068450
|
Spag16
|
sperm associated antigen 16 |
| chr3_+_154437571 | 0.05 |
ENSRNOT00000019331
|
AABR07054456.1
|
|
| chr2_-_209537087 | 0.05 |
ENSRNOT00000024344
|
Cd53
|
Cd53 molecule |
| chr5_+_58144705 | 0.05 |
ENSRNOT00000019886
|
Galt
|
galactose-1-phosphate uridylyltransferase |
| chr10_-_38969501 | 0.05 |
ENSRNOT00000090691
ENSRNOT00000081309 ENSRNOT00000010029 |
Il4
|
interleukin 4 |
| chr17_+_41798783 | 0.04 |
ENSRNOT00000023519
|
Nrsn1
|
neurensin 1 |
| chr1_+_164706276 | 0.04 |
ENSRNOT00000024311
|
Olr36
|
olfactory receptor 36 |
| chr20_-_45126062 | 0.04 |
ENSRNOT00000000720
|
RGD1310495
|
similar to KIAA1919 protein |
| chr20_+_47395014 | 0.04 |
ENSRNOT00000057116
|
Ostm1
|
osteopetrosis associated transmembrane protein 1 |
| chr10_-_34242985 | 0.04 |
ENSRNOT00000046438
|
RGD1559575
|
similar to novel protein |
| chrX_-_105417323 | 0.04 |
ENSRNOT00000015494
|
Gla
|
galactosidase, alpha |
| chr3_-_113405829 | 0.04 |
ENSRNOT00000036823
|
Ell3
|
elongation factor for RNA polymerase II 3 |
| chr2_+_72006099 | 0.04 |
ENSRNOT00000034044
|
Cdh12
|
cadherin 12 |
| chr11_-_61748768 | 0.04 |
ENSRNOT00000078879
|
Ccdc191
|
coiled-coil domain containing 191 |
| chr15_+_57241968 | 0.03 |
ENSRNOT00000082191
|
Lcp1
|
lymphocyte cytosolic protein 1 |
| chr2_+_9683570 | 0.03 |
ENSRNOT00000074157
|
Cetn3
|
centrin 3 |
| chr1_-_55895636 | 0.03 |
ENSRNOT00000029537
|
Vom2r9
|
vomeronasal 2 receptor, 9 |
| chr17_+_78911581 | 0.03 |
ENSRNOT00000085104
|
AC128960.2
|
|
| chr18_-_786674 | 0.03 |
ENSRNOT00000021955
|
Cetn1
|
centrin 1 |
| chr14_-_18634309 | 0.03 |
ENSRNOT00000003720
|
Epgn
|
epithelial mitogen |
| chr1_+_84280945 | 0.03 |
ENSRNOT00000057190
|
Sertad3
|
SERTA domain containing 3 |
| chr3_+_57770948 | 0.03 |
ENSRNOT00000038429
|
AC107446.2
|
|
| chr19_+_37873515 | 0.03 |
ENSRNOT00000026163
ENSRNOT00000089921 |
Pskh1
|
protein serine kinase H1 |
| chr5_+_163773509 | 0.03 |
ENSRNOT00000072167
|
LOC103692519
|
60S ribosomal protein L9 pseudogene |
| chr2_+_165805144 | 0.03 |
ENSRNOT00000073716
|
Rabif
|
RAB interacting factor |
| chr4_-_163214678 | 0.03 |
ENSRNOT00000091602
|
Clec1a
|
C-type lectin domain family 1, member A |
| chr13_+_51384389 | 0.03 |
ENSRNOT00000087025
|
Kdm5b
|
lysine demethylase 5B |
| chrX_+_51286737 | 0.03 |
ENSRNOT00000035692
|
Dmd
|
dystrophin |
| chr8_-_69807826 | 0.03 |
ENSRNOT00000014071
|
Dis3l
|
DIS3-like exosome 3'-5' exoribonuclease |
| chr18_-_75207306 | 0.03 |
ENSRNOT00000021717
|
Setbp1
|
SET binding protein 1 |
| chr5_-_100970043 | 0.03 |
ENSRNOT00000013950
|
Zdhhc21
|
zinc finger, DHHC-type containing 21 |
| chr19_+_24849356 | 0.03 |
ENSRNOT00000090312
|
Ddx39a
|
DExD-box helicase 39A |
| chr10_+_34489940 | 0.03 |
ENSRNOT00000085975
|
Zfp62
|
zinc finger protein 62 |
| chr4_-_161743847 | 0.03 |
ENSRNOT00000064174
ENSRNOT00000084173 ENSRNOT00000064215 |
Itfg2
|
integrin alpha FG-GAP repeat containing 2 |
| chr15_-_88670349 | 0.03 |
ENSRNOT00000012881
|
Rnf219
|
ring finger protein 219 |
| chr6_-_50941248 | 0.03 |
ENSRNOT00000084533
|
Dus4l
|
dihydrouridine synthase 4-like |
| chr8_+_77107536 | 0.03 |
ENSRNOT00000083255
|
Adam10
|
ADAM metallopeptidase domain 10 |
| chr11_-_31180616 | 0.03 |
ENSRNOT00000065535
ENSRNOT00000052033 ENSRNOT00000002812 |
Synj1
|
synaptojanin 1 |
| chr8_+_119524039 | 0.03 |
ENSRNOT00000056050
|
Epm2aip1
|
EPM2A interacting protein 1 |
| chr17_-_43614844 | 0.03 |
ENSRNOT00000023054
|
Hist1h1a
|
histone cluster 1 H1 family member a |
| chrX_+_124894466 | 0.03 |
ENSRNOT00000080894
|
Mcts1
|
MCTS1, re-initiation and release factor |
| chr5_+_159734838 | 0.03 |
ENSRNOT00000079905
|
Rsg1
|
REM2 and RAB-like small GTPase 1 |
| chr5_+_29538380 | 0.03 |
ENSRNOT00000010845
|
Calb1
|
calbindin 1 |
| chr6_+_76079880 | 0.03 |
ENSRNOT00000009304
|
RGD1305089
|
similar to 1110008L16Rik protein |
| chr3_+_121408146 | 0.03 |
ENSRNOT00000023708
|
Fbln7
|
fibulin 7 |
| chr7_-_143217535 | 0.02 |
ENSRNOT00000088316
|
Kb15
|
type II keratin Kb15 |
| chr18_+_30581530 | 0.02 |
ENSRNOT00000048166
|
Pcdhb20
|
protocadherin beta 20 |
| chr6_+_11644578 | 0.02 |
ENSRNOT00000021923
ENSRNOT00000093689 |
Msh6
|
mutS homolog 6 |
| chr18_+_17403407 | 0.02 |
ENSRNOT00000045150
|
RGD1562608
|
similar to KIAA1328 protein |
| chrX_+_135187468 | 0.02 |
ENSRNOT00000006805
|
Bcorl1
|
BCL6 co-repressor-like 1 |
| chr4_-_40136061 | 0.02 |
ENSRNOT00000009752
|
Bmt2
|
base methyltransferase of 25S rRNA 2 homolog |
| chr20_-_44220702 | 0.02 |
ENSRNOT00000036853
|
Fam229b
|
family with sequence similarity 229, member B |
| chr16_-_18645941 | 0.02 |
ENSRNOT00000079241
|
Dydc2
|
DPY30 domain containing 2 |
| chr4_+_34237762 | 0.02 |
ENSRNOT00000084163
|
Mios
|
meiosis regulator for oocyte development |
| chr12_-_38916237 | 0.02 |
ENSRNOT00000074517
|
Tmem120b
|
transmembrane protein 120B |
| chr10_+_40812858 | 0.02 |
ENSRNOT00000018149
|
G3bp1
|
G3BP stress granule assembly factor 1 |
| chr3_-_3890758 | 0.02 |
ENSRNOT00000064083
|
Sec16a
|
SEC16 homolog A, endoplasmic reticulum export factor |
| chr1_+_88955135 | 0.02 |
ENSRNOT00000083550
|
Prodh2
|
proline dehydrogenase 2 |
| chr1_-_141655417 | 0.02 |
ENSRNOT00000068084
|
Ap3s2
|
adaptor-related protein complex 3, sigma 2 subunit |
| chr3_-_153468221 | 0.02 |
ENSRNOT00000010443
|
Ghrh
|
growth hormone releasing hormone |
| chr5_+_35991068 | 0.02 |
ENSRNOT00000061139
|
Pnisr
|
PNN interacting serine and arginine rich protein |
| chrX_+_31984612 | 0.02 |
ENSRNOT00000005181
|
Bmx
|
BMX non-receptor tyrosine kinase |
| chr2_+_62887267 | 0.02 |
ENSRNOT00000048026
|
Drosha
|
drosha ribonuclease III |
| chr8_+_130538651 | 0.02 |
ENSRNOT00000026343
|
Ackr2
|
atypical chemokine receptor 2 |
| chr2_+_243701962 | 0.02 |
ENSRNOT00000016891
|
Adh4
|
alcohol dehydrogenase 4 (class II), pi polypeptide |
| chr2_+_257568613 | 0.02 |
ENSRNOT00000066125
|
Usp33
|
ubiquitin specific peptidase 33 |
| chr8_-_119523964 | 0.02 |
ENSRNOT00000081718
|
Mlh1
|
mutL homolog 1 |
| chr3_+_117938500 | 0.02 |
ENSRNOT00000042411
|
Eid1
|
EP300 interacting inhibitor of differentiation 1 |
| chr2_-_62887048 | 0.02 |
ENSRNOT00000039234
|
RGD1306502
|
similar to hypothetical protein FLJ11193 |
| chr13_-_74005486 | 0.02 |
ENSRNOT00000090173
|
AABR07021465.1
|
|
| chr1_-_88428685 | 0.02 |
ENSRNOT00000074582
|
Zfp566
|
zinc finger protein 566 |
| chr15_-_12129220 | 0.02 |
ENSRNOT00000029318
|
Olr1605
|
olfactory receptor 1605 |
| chrX_-_36884748 | 0.02 |
ENSRNOT00000065678
|
Phka2
|
phosphorylase kinase, alpha 2 |
| chr1_+_227743612 | 0.02 |
ENSRNOT00000028476
|
Gm8369
|
predicted gene 8369 |
| chr1_-_98521551 | 0.02 |
ENSRNOT00000081922
|
Siglec10
|
sialic acid binding Ig-like lectin 10 |
| chr8_+_26652121 | 0.02 |
ENSRNOT00000009342
|
Eepd1
|
endonuclease/exonuclease/phosphatase family domain containing 1 |
| chr9_-_24383679 | 0.02 |
ENSRNOT00000040542
|
Crisp1
|
cysteine-rich secretory protein 1 |
| chr7_-_98804499 | 0.02 |
ENSRNOT00000070909
|
Tatdn1
|
TatD DNase domain containing 1 |
| chr9_-_52238564 | 0.02 |
ENSRNOT00000005073
|
Col5a2
|
collagen type V alpha 2 chain |
| chrX_-_15467875 | 0.02 |
ENSRNOT00000011207
|
Pim2
|
Pim-2 proto-oncogene, serine/threonine kinase |
| chr2_+_104854572 | 0.02 |
ENSRNOT00000064828
ENSRNOT00000090912 |
Hltf
|
helicase-like transcription factor |
| chr11_-_81444375 | 0.02 |
ENSRNOT00000058479
ENSRNOT00000078131 ENSRNOT00000080949 ENSRNOT00000080562 ENSRNOT00000084867 |
Kng1
|
kininogen 1 |
| chr13_-_82006005 | 0.02 |
ENSRNOT00000039581
|
Mettl11b
|
methyltransferase like 11B |
| chr12_+_37444072 | 0.02 |
ENSRNOT00000077380
ENSRNOT00000092699 ENSRNOT00000001373 ENSRNOT00000092416 |
Eif2b1
|
eukaryotic translation initiation factor 2B subunit 1 alpha |
| chr15_-_24199341 | 0.02 |
ENSRNOT00000015553
|
Dlgap5
|
DLG associated protein 5 |
| chr5_-_47836586 | 0.02 |
ENSRNOT00000008469
|
Gja10
|
gap junction protein, alpha 10 |
| chr5_-_56536772 | 0.01 |
ENSRNOT00000060765
|
Ddx58
|
DEXD/H-box helicase 58 |
| chr6_-_76079664 | 0.01 |
ENSRNOT00000033533
|
Ppp2r3c
|
protein phosphatase 2, regulatory subunit B'', gamma |
| chr20_+_44220840 | 0.01 |
ENSRNOT00000047194
|
Tube1
|
tubulin, epsilon 1 |
| chrX_+_84064427 | 0.01 |
ENSRNOT00000046364
|
Zfp711
|
zinc finger protein 711 |
| chr3_-_119405453 | 0.01 |
ENSRNOT00000090355
|
Sppl2a
|
signal peptide peptidase-like 2A |
| chr10_-_87153982 | 0.01 |
ENSRNOT00000014414
|
Krt222
|
keratin 222 |
| chrX_+_112311251 | 0.01 |
ENSRNOT00000086698
|
AABR07040855.1
|
|
| chr13_+_77485113 | 0.01 |
ENSRNOT00000080254
|
Tnr
|
tenascin R |
| chr3_-_110828879 | 0.01 |
ENSRNOT00000013963
|
Ccdc32
|
coiled-coil domain containing 32 |
| chr5_+_133864798 | 0.01 |
ENSRNOT00000091977
|
Tal1
|
TAL bHLH transcription factor 1, erythroid differentiation factor |
| chr4_+_110699557 | 0.01 |
ENSRNOT00000030588
ENSRNOT00000092261 |
Lrrtm4
|
leucine rich repeat transmembrane neuronal 4 |
| chr10_-_8498422 | 0.01 |
ENSRNOT00000082332
|
Rbfox1
|
RNA binding protein, fox-1 homolog 1 |
| chr2_+_208373154 | 0.01 |
ENSRNOT00000082943
ENSRNOT00000050538 |
LOC100911796
|
adenosine receptor A3-like |
| chr11_-_33801999 | 0.01 |
ENSRNOT00000002308
|
Setd4
|
SET domain containing 4 |
| chr9_-_14502933 | 0.01 |
ENSRNOT00000078464
|
Unc5cl
|
unc-5 family C-terminal like |
| chrM_-_14061 | 0.01 |
ENSRNOT00000051268
|
Mt-nd6
|
mitochondrially encoded NADH dehydrogenase 6 |
| chr4_+_35279063 | 0.01 |
ENSRNOT00000011833
|
Nxph1
|
neurexophilin 1 |
| chr3_+_11396070 | 0.01 |
ENSRNOT00000037399
|
Ciz1
|
CDKN1A interacting zinc finger protein 1 |
| chr10_+_46018659 | 0.01 |
ENSRNOT00000040865
ENSRNOT00000004357 |
Mprip
|
myosin phosphatase Rho interacting protein |
| chr3_-_146396299 | 0.01 |
ENSRNOT00000040188
ENSRNOT00000008931 |
Apmap
|
adipocyte plasma membrane associated protein |
| chr4_+_147756553 | 0.01 |
ENSRNOT00000086549
ENSRNOT00000014733 |
Ift122
|
intraflagellar transport 122 |
| chr18_-_48720472 | 0.01 |
ENSRNOT00000023236
|
Cep120
|
centrosomal protein 120 |
| chr16_-_23991570 | 0.01 |
ENSRNOT00000044198
ENSRNOT00000018854 |
Nat2
Nat1
|
N-acetyltransferase 2 N-acetyltransferase 1 |
| chr12_+_47590154 | 0.01 |
ENSRNOT00000045946
|
Git2
|
GIT ArfGAP 2 |
| chr3_-_147188929 | 0.01 |
ENSRNOT00000055455
|
Rad21l1
|
RAD21 cohesin complex component like 1 |
| chr6_+_99817431 | 0.01 |
ENSRNOT00000009621
|
Churc1
|
churchill domain containing 1 |
| chr8_+_2635851 | 0.01 |
ENSRNOT00000061973
|
Casp4
|
caspase 4 |
| chr2_-_117666683 | 0.01 |
ENSRNOT00000015479
|
AABR07009931.1
|
|
| chr1_+_277641512 | 0.01 |
ENSRNOT00000084861
ENSRNOT00000023024 |
Tdrd1
|
tudor domain containing 1 |
| chr11_-_35749464 | 0.01 |
ENSRNOT00000078818
ENSRNOT00000078425 |
Erg
|
ERG, ETS transcription factor |
| chr4_+_34282625 | 0.01 |
ENSRNOT00000011138
ENSRNOT00000086735 |
Glcci1
|
glucocorticoid induced 1 |
| chrX_+_73390903 | 0.01 |
ENSRNOT00000077002
|
Zfp449
|
zinc finger protein 449 |
| chr13_+_101381510 | 0.01 |
ENSRNOT00000004821
|
Tlr5
|
toll-like receptor 5 |
| chr13_+_82496022 | 0.01 |
ENSRNOT00000080759
|
F5
|
coagulation factor V |
| chr19_-_11669578 | 0.01 |
ENSRNOT00000026373
|
Gnao1
|
G protein subunit alpha o1 |
| chrX_-_20232635 | 0.01 |
ENSRNOT00000003540
ENSRNOT00000072753 |
Tsr2
|
TSR2, ribosome maturation factor |
| chr19_+_37852659 | 0.01 |
ENSRNOT00000030967
|
Nrn1l
|
neuritin 1-like |
| chr4_-_163762434 | 0.01 |
ENSRNOT00000081854
|
Ly49si1
|
immunoreceptor Ly49si1 |
| chr5_+_133865331 | 0.01 |
ENSRNOT00000035409
|
Tal1
|
TAL bHLH transcription factor 1, erythroid differentiation factor |
| chr5_-_100977902 | 0.01 |
ENSRNOT00000077429
|
Zdhhc21
|
zinc finger, DHHC-type containing 21 |
| chr3_+_114772603 | 0.01 |
ENSRNOT00000073569
|
MGC105649
|
hypothetical LOC302884 |
| chr8_-_77398156 | 0.01 |
ENSRNOT00000091858
ENSRNOT00000085349 ENSRNOT00000082763 |
Lipc
|
lipase C, hepatic type |
| chr2_+_208749996 | 0.01 |
ENSRNOT00000086321
|
Chia
|
chitinase, acidic |
| chrX_+_44907521 | 0.01 |
ENSRNOT00000004901
|
Tbl1x
|
transducin (beta)-like 1 X-linked |
| chrX_+_1787266 | 0.01 |
ENSRNOT00000011183
|
Ndufb11
|
NADH:ubiquinone oxidoreductase subunit B11 |
| chr9_-_113328428 | 0.01 |
ENSRNOT00000086340
|
Vapa
|
VAMP associated protein A |
| chr14_-_46054022 | 0.01 |
ENSRNOT00000002982
|
LOC498368
|
similar to RIKEN cDNA 0610040J01 |
| chr6_-_115616766 | 0.01 |
ENSRNOT00000006143
ENSRNOT00000045870 |
Sel1l
|
SEL1L ERAD E3 ligase adaptor subunit |
| chr14_+_78640620 | 0.01 |
ENSRNOT00000034730
|
Wfs1
|
wolframin ER transmembrane glycoprotein |
| chr11_+_31893489 | 0.01 |
ENSRNOT00000042750
|
Itsn1
|
intersectin 1 |
| chr18_+_3887419 | 0.01 |
ENSRNOT00000093089
|
Lama3
|
laminin subunit alpha 3 |
| chr9_+_17920677 | 0.01 |
ENSRNOT00000045763
|
Spats1
|
spermatogenesis associated, serine-rich 1 |
| chr7_-_29949603 | 0.01 |
ENSRNOT00000009419
|
LOC103692829
|
60S ribosomal protein L9 pseudogene |
| chr10_-_98544447 | 0.01 |
ENSRNOT00000073149
|
Abca6
|
ATP binding cassette subfamily A member 6 |
| chr16_-_38063821 | 0.01 |
ENSRNOT00000077452
ENSRNOT00000089533 |
Glra3
|
glycine receptor, alpha 3 |
| chr7_+_144064931 | 0.01 |
ENSRNOT00000048504
|
Prr13
|
proline rich 13 |
| chr5_+_121952977 | 0.01 |
ENSRNOT00000008278
|
Pde4b
|
phosphodiesterase 4B |
| chr7_-_58365313 | 0.01 |
ENSRNOT00000005443
|
Thap2
|
THAP domain containing 2 |
| chr13_+_27032048 | 0.01 |
ENSRNOT00000031789
|
Serpinb13
|
serpin family B member 13 |
| chr14_-_3359300 | 0.01 |
ENSRNOT00000080875
|
Lpcat2b
|
lysophosphatidylcholine acyltransferase 2b |
| chr10_-_13187461 | 0.01 |
ENSRNOT00000007039
|
Prss41
|
protease, serine, 41 |
| chrX_-_123486814 | 0.01 |
ENSRNOT00000016993
|
RGD1564541
|
similar to hypothetical protein FLJ22965 |
| chr10_-_66848388 | 0.00 |
ENSRNOT00000018891
|
Omg
|
oligodendrocyte-myelin glycoprotein |
| chr16_+_8302950 | 0.00 |
ENSRNOT00000066062
|
Ncoa4
|
nuclear receptor coactivator 4 |
| chr4_-_144620731 | 0.00 |
ENSRNOT00000066468
|
Rad18
|
RAD18 E3 ubiquitin protein ligase |
| chr9_+_15609804 | 0.00 |
ENSRNOT00000020902
|
Guca1a
|
guanylate cyclase activator 1A |
| chr11_-_61748583 | 0.00 |
ENSRNOT00000093431
|
Ccdc191
|
coiled-coil domain containing 191 |
| chr20_-_45053640 | 0.00 |
ENSRNOT00000072256
|
RGD1561777
|
similar to Na+ dependent glucose transporter 1 |
| chr8_-_119523716 | 0.00 |
ENSRNOT00000064581
|
Mlh1
|
mutL homolog 1 |
| chr1_+_48273611 | 0.00 |
ENSRNOT00000022254
ENSRNOT00000022068 |
Slc22a1
|
solute carrier family 22 member 1 |
| chr10_-_13892997 | 0.00 |
ENSRNOT00000004192
|
Traf7
|
TNF receptor associated factor 7 |
| chr10_+_38661901 | 0.00 |
ENSRNOT00000009098
|
Zcchc10
|
zinc finger CCHC-type containing 10 |
| chr10_+_59894340 | 0.00 |
ENSRNOT00000080446
|
Spata22
|
spermatogenesis associated 22 |
| chr2_-_102838745 | 0.00 |
ENSRNOT00000082084
|
Cyp7b1
|
cytochrome P450, family 7, subfamily b, polypeptide 1 |
| chr1_-_220502272 | 0.00 |
ENSRNOT00000041238
|
Klc2
|
kinesin light chain 2 |
| chr9_-_43276685 | 0.00 |
ENSRNOT00000022779
|
Actr1b
|
ARP1 actin-related protein 1 homolog B, centractin beta |
| chr19_-_42054018 | 0.00 |
ENSRNOT00000082380
ENSRNOT00000089134 |
Pkd1l3
|
polycystin 1 like 3, transient receptor potential channel interacting |
| chr8_-_77992621 | 0.00 |
ENSRNOT00000085843
|
Myzap
|
myocardial zonula adherens protein |
| chr2_-_200625434 | 0.00 |
ENSRNOT00000079754
|
Hsd3b5
|
hydroxy-delta-5-steroid dehydrogenase, 3 beta- and steroid delta-isomerase 5 |
| chr2_-_120316600 | 0.00 |
ENSRNOT00000084521
|
Ccdc39
|
coiled-coil domain containing 39 |
| chr2_+_218834034 | 0.00 |
ENSRNOT00000018367
|
Dph5
|
diphthamide biosynthesis 5 |
| chr17_+_10137974 | 0.00 |
ENSRNOT00000031935
|
Hk3
|
hexokinase 3 |
| chr7_-_14189688 | 0.00 |
ENSRNOT00000037456
|
Notch3
|
notch 3 |
| chr1_+_167944448 | 0.00 |
ENSRNOT00000087667
|
Olr56
|
olfactory receptor 56 |
| chrX_+_80359555 | 0.00 |
ENSRNOT00000030692
|
LOC681325
|
hypothetical protein LOC681325 |
| chr19_-_19727081 | 0.00 |
ENSRNOT00000020700
|
Adcy7
|
adenylate cyclase 7 |
| chr4_+_45567573 | 0.00 |
ENSRNOT00000089824
|
Ankrd7
|
ankyrin repeat domain 7 |
| chr9_+_95202632 | 0.00 |
ENSRNOT00000025652
|
Ugt1a5
|
UDP glucuronosyltransferase family 1 member A5 |
| chrX_+_124894706 | 0.00 |
ENSRNOT00000066677
|
Mcts1
|
MCTS1, re-initiation and release factor |
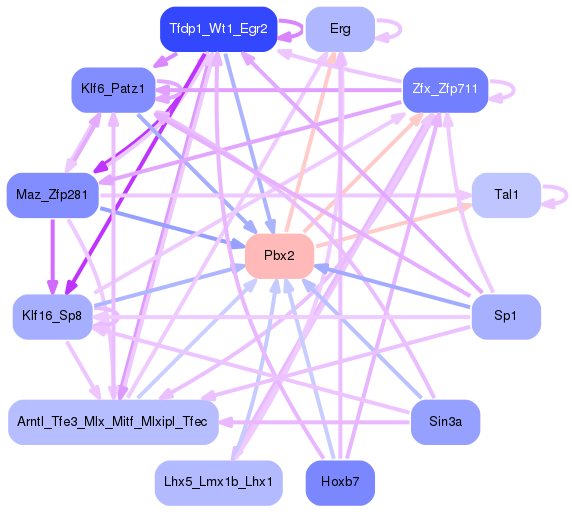
Network of associatons between targets according to the STRING database.

First level regulatory network of Pbx2
Gene Ontology Analysis
Gene overrepresentation in biological process category:
| Log-likelihood per target | Total log-likelihood | Term | Description |
|---|---|---|---|
| 0.0 | 0.1 | GO:0042350 | GDP-L-fucose biosynthetic process(GO:0042350) |
| 0.0 | 0.1 | GO:0010133 | proline catabolic process to glutamate(GO:0010133) |
| 0.0 | 0.0 | GO:0003430 | growth plate cartilage chondrocyte growth(GO:0003430) |
| 0.0 | 0.0 | GO:0051012 | microtubule sliding(GO:0051012) |
| 0.0 | 0.1 | GO:0045590 | negative regulation of regulatory T cell differentiation(GO:0045590) |
| 0.0 | 0.0 | GO:0009227 | nucleotide-sugar catabolic process(GO:0009227) |
| 0.0 | 0.0 | GO:2000422 | T-helper 1 cell lineage commitment(GO:0002296) negative regulation of complement-dependent cytotoxicity(GO:1903660) regulation of eosinophil chemotaxis(GO:2000422) positive regulation of eosinophil chemotaxis(GO:2000424) |
| 0.0 | 0.1 | GO:0030210 | negative regulation of cytokine secretion involved in immune response(GO:0002740) heparin biosynthetic process(GO:0030210) |
| 0.0 | 0.0 | GO:0032485 | regulation of Ral protein signal transduction(GO:0032485) |
Gene overrepresentation in cellular component category:
| Log-likelihood per target | Total log-likelihood | Term | Description |
|---|---|---|---|
| 0.0 | 0.0 | GO:0070022 | transforming growth factor beta receptor homodimeric complex(GO:0070022) |
Gene overrepresentation in molecular function category:
| Log-likelihood per target | Total log-likelihood | Term | Description |
|---|---|---|---|
| 0.1 | 0.2 | GO:0008263 | pyrimidine-specific mismatch base pair DNA N-glycosylase activity(GO:0008263) |
| 0.0 | 0.1 | GO:0004657 | proline dehydrogenase activity(GO:0004657) |
| 0.0 | 0.0 | GO:0008453 | alanine-glyoxylate transaminase activity(GO:0008453) |
| 0.0 | 0.0 | GO:0005534 | galactose binding(GO:0005534) |
| 0.0 | 0.0 | GO:0005136 | interleukin-4 receptor binding(GO:0005136) |
Gene overrepresentation in curated gene sets: REACTOME pathways category:
| Log-likelihood per target | Total log-likelihood | Term | Description |
|---|---|---|---|
| 0.0 | 0.2 | REACTOME BASE FREE SUGAR PHOSPHATE REMOVAL VIA THE SINGLE NUCLEOTIDE REPLACEMENT PATHWAY | Genes involved in Base-free sugar-phosphate removal via the single-nucleotide replacement pathway |