Project
GSE49485: Hypoxia transcriptome sequencing of rat brain.
Navigation
Downloads
Results for Pbx1_Pbx3
Z-value: 0.48
Motif logo
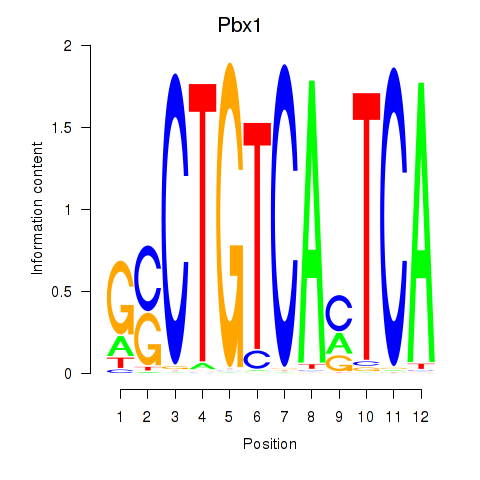
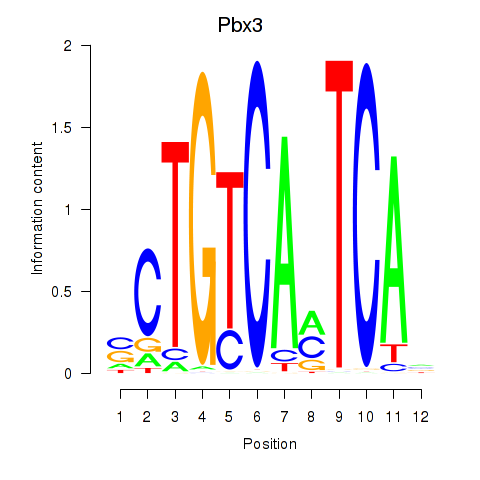
Transcription factors associated with Pbx1_Pbx3
| Gene Symbol | Gene ID | Gene Info |
|---|---|---|
|
Pbx1
|
ENSRNOG00000004693 | PBX homeobox 1 |
|
Pbx3
|
ENSRNOG00000022162 | PBX homeobox 3 |
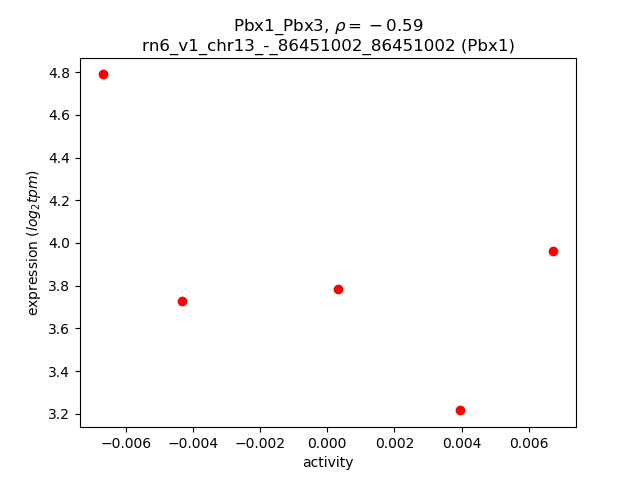
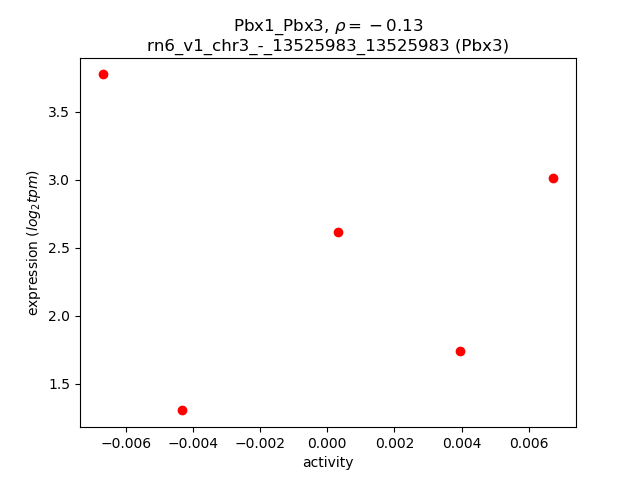
Activity-expression correlation:
| Gene | Promoter | Pearson corr. coef. | P-value | Plot |
|---|---|---|---|---|
| Pbx1 | rn6_v1_chr13_-_86451002_86451002 | -0.59 | 3.0e-01 | Click! |
| Pbx3 | rn6_v1_chr3_-_13525983_13525983 | -0.13 | 8.4e-01 | Click! |
Activity profile of Pbx1_Pbx3 motif
Sorted Z-values of Pbx1_Pbx3 motif
| Promoter | Log-likelihood | Transcript | Gene | Gene Info |
|---|---|---|---|---|
| chr19_+_55669626 | 1.36 |
ENSRNOT00000033352
|
Cdh15
|
cadherin 15 |
| chr10_+_91830654 | 0.41 |
ENSRNOT00000005176
|
Wnt3
|
wingless-type MMTV integration site family, member 3 |
| chr1_+_214454090 | 0.33 |
ENSRNOT00000049448
|
Tspan4
|
tetraspanin 4 |
| chr1_+_99762253 | 0.28 |
ENSRNOT00000065876
|
Klk6
|
kallikrein related-peptidase 6 |
| chrX_+_107496072 | 0.27 |
ENSRNOT00000003283
|
Plp1
|
proteolipid protein 1 |
| chr1_+_33910912 | 0.25 |
ENSRNOT00000044690
|
Irx1
|
iroquois homeobox 1 |
| chr3_+_111135021 | 0.19 |
ENSRNOT00000018970
|
Dll4
|
delta like canonical Notch ligand 4 |
| chr6_+_55812747 | 0.19 |
ENSRNOT00000008106
|
Sostdc1
|
sclerostin domain containing 1 |
| chr8_-_23000455 | 0.18 |
ENSRNOT00000091027
ENSRNOT00000017493 |
Rgl3
|
ral guanine nucleotide dissociation stimulator-like 3 |
| chr6_+_8886591 | 0.17 |
ENSRNOT00000091510
ENSRNOT00000089174 |
Six3
|
SIX homeobox 3 |
| chr1_-_33275540 | 0.15 |
ENSRNOT00000017019
|
Irx2
|
iroquois homeobox 2 |
| chr7_+_11737293 | 0.15 |
ENSRNOT00000046059
|
Lingo3
|
leucine rich repeat and Ig domain containing 3 |
| chr18_+_79326738 | 0.14 |
ENSRNOT00000089879
|
Mbp
|
myelin basic protein |
| chr14_-_103321270 | 0.14 |
ENSRNOT00000006157
|
Meis1
|
Meis homeobox 1 |
| chr12_+_52670898 | 0.14 |
ENSRNOT00000056632
|
LOC100912590
|
putative GTP-binding protein 6-like |
| chr6_-_99783047 | 0.14 |
ENSRNOT00000009028
|
Sptb
|
spectrin, beta, erythrocytic |
| chr10_+_88245532 | 0.14 |
ENSRNOT00000019863
|
Gast
|
gastrin |
| chr12_+_52637000 | 0.13 |
ENSRNOT00000063905
|
Gtpbp6
|
GTP binding protein 6 (putative) |
| chr19_+_37873515 | 0.13 |
ENSRNOT00000026163
ENSRNOT00000089921 |
Pskh1
|
protein serine kinase H1 |
| chr19_-_52282877 | 0.12 |
ENSRNOT00000021271
|
Kcng4
|
potassium voltage-gated channel modifier subfamily G member 4 |
| chr7_-_120967490 | 0.11 |
ENSRNOT00000046399
|
Sun2
|
Sad1 and UNC84 domain containing 2 |
| chr9_-_78969013 | 0.11 |
ENSRNOT00000019772
ENSRNOT00000057585 |
Fn1
|
fibronectin 1 |
| chr6_+_58468155 | 0.10 |
ENSRNOT00000091263
|
Etv1
|
ets variant 1 |
| chr1_+_261229347 | 0.10 |
ENSRNOT00000018485
|
Ubtd1
|
ubiquitin domain containing 1 |
| chr15_-_108898703 | 0.10 |
ENSRNOT00000067577
|
Zic5
|
Zic family member 5 |
| chr3_+_11593655 | 0.10 |
ENSRNOT00000074122
|
Pip5kl1
|
phosphatidylinositol-4-phosphate 5-kinase-like 1 |
| chr12_+_18516946 | 0.09 |
ENSRNOT00000029485
|
Dhrsx
|
dehydrogenase/reductase X-linked |
| chr10_-_103816287 | 0.09 |
ENSRNOT00000004477
|
Grin2c
|
glutamate ionotropic receptor NMDA type subunit 2C |
| chr3_+_171832500 | 0.09 |
ENSRNOT00000007554
|
Vapb
|
VAMP associated protein B and C |
| chr1_+_29432152 | 0.09 |
ENSRNOT00000019436
ENSRNOT00000083276 |
Trmt11
|
tRNA methyltransferase 11 homolog |
| chr10_-_47724499 | 0.08 |
ENSRNOT00000085011
|
Rnf112
|
ring finger protein 112 |
| chr10_+_15696824 | 0.08 |
ENSRNOT00000079290
|
Il9r
|
interleukin 9 receptor |
| chr6_+_109710781 | 0.08 |
ENSRNOT00000012895
|
Ttll5
|
tubulin tyrosine ligase like 5 |
| chr20_+_11393877 | 0.08 |
ENSRNOT00000001625
|
Pfkl
|
phosphofructokinase, liver type |
| chr2_+_95320283 | 0.08 |
ENSRNOT00000015537
|
Hey1
|
hes-related family bHLH transcription factor with YRPW motif 1 |
| chr5_-_59025631 | 0.08 |
ENSRNOT00000049000
ENSRNOT00000022801 |
Tpm2
|
tropomyosin 2, beta |
| chr4_+_153921115 | 0.08 |
ENSRNOT00000018821
|
Slc6a12
|
solute carrier family 6 member 12 |
| chr12_-_13251112 | 0.07 |
ENSRNOT00000044378
|
Grid2ip
|
Grid2 interacting protein |
| chr17_+_76002275 | 0.07 |
ENSRNOT00000092665
ENSRNOT00000086701 |
Echdc3
|
enoyl CoA hydratase domain containing 3 |
| chr5_-_169017295 | 0.07 |
ENSRNOT00000067481
|
Camta1
|
calmodulin binding transcription activator 1 |
| chr1_+_218076116 | 0.07 |
ENSRNOT00000028374
|
Oraov1
|
oral cancer overexpressed 1 |
| chr3_+_148234193 | 0.07 |
ENSRNOT00000010418
|
Cox4i2
|
cytochrome c oxidase subunit 4i2 |
| chr5_-_166926636 | 0.06 |
ENSRNOT00000023287
|
Spsb1
|
splA/ryanodine receptor domain and SOCS box containing 1 |
| chr17_-_66511870 | 0.06 |
ENSRNOT00000044662
|
Lgals8
|
galectin 8 |
| chr11_+_47188495 | 0.06 |
ENSRNOT00000002188
|
Nxpe3
|
neurexophilin and PC-esterase domain family, member 3 |
| chr13_-_98530724 | 0.06 |
ENSRNOT00000040203
|
Psen2
|
presenilin 2 |
| chr4_-_7113919 | 0.06 |
ENSRNOT00000014082
|
Chpf2
|
chondroitin polymerizing factor 2 |
| chr1_+_264893162 | 0.06 |
ENSRNOT00000021714
|
Tlx1
|
T-cell leukemia, homeobox 1 |
| chr11_-_60547201 | 0.06 |
ENSRNOT00000093151
|
Btla
|
B and T lymphocyte associated |
| chr14_+_63095720 | 0.06 |
ENSRNOT00000006071
|
Ppargc1a
|
PPARG coactivator 1 alpha |
| chr9_+_46840992 | 0.06 |
ENSRNOT00000019415
|
Il1r2
|
interleukin 1 receptor type 2 |
| chr2_+_46980976 | 0.06 |
ENSRNOT00000083668
ENSRNOT00000082990 |
Mocs2
|
molybdenum cofactor synthesis 2 |
| chr2_+_196334626 | 0.05 |
ENSRNOT00000050914
ENSRNOT00000028645 ENSRNOT00000090729 |
Sema6c
|
semaphorin 6C |
| chr1_+_240908483 | 0.05 |
ENSRNOT00000019367
|
Klf9
|
Kruppel-like factor 9 |
| chr8_+_132032944 | 0.05 |
ENSRNOT00000089278
|
Kif15
|
kinesin family member 15 |
| chr4_-_56453563 | 0.05 |
ENSRNOT00000060362
|
Prrt4
|
proline-rich transmembrane protein 4 |
| chr3_+_170252901 | 0.05 |
ENSRNOT00000005871
|
Mc3r
|
melanocortin 3 receptor |
| chr8_+_94686938 | 0.05 |
ENSRNOT00000013285
|
Ripply2
|
ripply transcriptional repressor 2 |
| chr2_+_78407414 | 0.05 |
ENSRNOT00000084541
ENSRNOT00000087109 |
Zfp622
|
zinc finger protein 622 |
| chr1_+_248402980 | 0.05 |
ENSRNOT00000043517
|
Chchd4
|
coiled-coil-helix-coiled-coil-helix domain containing 4 |
| chr10_+_86303727 | 0.05 |
ENSRNOT00000037752
|
Ppp1r1b
|
protein phosphatase 1, regulatory (inhibitor) subunit 1B |
| chr20_+_27173213 | 0.05 |
ENSRNOT00000073617
|
Hnrnph3
|
heterogeneous nuclear ribonucleoprotein H3 |
| chr1_-_56683731 | 0.05 |
ENSRNOT00000014552
|
Thbs2
|
thrombospondin 2 |
| chr5_+_148320438 | 0.05 |
ENSRNOT00000018742
|
Pef1
|
penta-EF hand domain containing 1 |
| chr1_+_222844144 | 0.04 |
ENSRNOT00000032879
|
Pla2g16
|
phospholipase A2, group XVI |
| chr20_+_8312792 | 0.04 |
ENSRNOT00000083108
|
Cmtr1
|
cap methyltransferase 1 |
| chr5_+_147375350 | 0.04 |
ENSRNOT00000010674
|
Yars
|
tyrosyl-tRNA synthetase |
| chr7_-_144778656 | 0.04 |
ENSRNOT00000055290
|
Smug1
|
single-strand-selective monofunctional uracil-DNA glycosylase 1 |
| chr1_+_101055622 | 0.04 |
ENSRNOT00000079189
|
Nosip
|
nitric oxide synthase interacting protein |
| chr4_+_168689163 | 0.04 |
ENSRNOT00000049848
|
Cdkn1b
|
cyclin-dependent kinase inhibitor 1B |
| chr2_+_174542667 | 0.04 |
ENSRNOT00000076793
|
Fstl5
|
follistatin-like 5 |
| chr3_+_9822580 | 0.04 |
ENSRNOT00000010786
ENSRNOT00000093718 |
Usp20
|
ubiquitin specific peptidase 20 |
| chr7_-_142050558 | 0.04 |
ENSRNOT00000081327
ENSRNOT00000086751 |
Slc11a2
|
solute carrier family 11 member 2 |
| chr3_-_105512939 | 0.04 |
ENSRNOT00000011773
|
Actc1
|
actin, alpha, cardiac muscle 1 |
| chr8_+_104106740 | 0.04 |
ENSRNOT00000015015
|
Tfdp2
|
transcription factor Dp-2 |
| chr3_+_5709236 | 0.04 |
ENSRNOT00000061201
ENSRNOT00000070887 |
Dbh
|
dopamine beta-hydroxylase |
| chr20_-_12870496 | 0.04 |
ENSRNOT00000078412
ENSRNOT00000081903 |
Lss
|
lanosterol synthase (2,3-oxidosqualene-lanosterol cyclase) |
| chrX_-_64702441 | 0.04 |
ENSRNOT00000051132
|
Amer1
|
APC membrane recruitment protein 1 |
| chr4_+_57034675 | 0.04 |
ENSRNOT00000080223
|
Smo
|
smoothened, frizzled class receptor |
| chrX_+_156854594 | 0.04 |
ENSRNOT00000083442
|
Renbp
|
renin binding protein |
| chr7_+_123578878 | 0.04 |
ENSRNOT00000011316
|
Smdt1
|
single-pass membrane protein with aspartate-rich tail 1 |
| chr18_-_6782757 | 0.04 |
ENSRNOT00000068150
|
Aqp4
|
aquaporin 4 |
| chr20_+_29558689 | 0.04 |
ENSRNOT00000085229
|
Ascc1
|
activating signal cointegrator 1 complex subunit 1 |
| chr1_-_211956858 | 0.04 |
ENSRNOT00000054886
|
Cfap46
|
cilia and flagella associated protein 46 |
| chr1_+_78933372 | 0.04 |
ENSRNOT00000029810
|
Ccdc8
|
coiled-coil domain containing 8 |
| chr8_-_22785671 | 0.04 |
ENSRNOT00000045384
|
Spc24
|
SPC24, NDC80 kinetochore complex component |
| chr8_+_48569328 | 0.04 |
ENSRNOT00000084030
|
Ccdc153
|
coiled-coil domain containing 153 |
| chr19_+_37229120 | 0.04 |
ENSRNOT00000076335
|
Hsf4
|
heat shock transcription factor 4 |
| chr1_-_91042230 | 0.04 |
ENSRNOT00000073107
|
LOC103690054
|
DNA-directed RNA polymerase II subunit RPB9 |
| chr2_-_210738378 | 0.04 |
ENSRNOT00000025746
|
Gstm6
|
glutathione S-transferase, mu 6 |
| chr18_-_6782996 | 0.04 |
ENSRNOT00000090320
|
Aqp4
|
aquaporin 4 |
| chr10_-_14324170 | 0.04 |
ENSRNOT00000035513
ENSRNOT00000090587 |
Hn1l
|
hematological and neurological expressed 1-like |
| chr19_-_43215077 | 0.04 |
ENSRNOT00000082151
|
Aars
|
alanyl-tRNA synthetase |
| chr8_-_48802204 | 0.04 |
ENSRNOT00000077364
|
AC105645.4
|
|
| chr5_-_77031120 | 0.03 |
ENSRNOT00000022987
|
Inip
|
INTS3 and NABP interacting protein |
| chr19_-_43215281 | 0.03 |
ENSRNOT00000025052
|
Aars
|
alanyl-tRNA synthetase |
| chr1_+_57345577 | 0.03 |
ENSRNOT00000082790
ENSRNOT00000084017 |
Fam120b
|
family with sequence similarity 120B |
| chr6_+_8219385 | 0.03 |
ENSRNOT00000040509
|
Ppm1b
|
protein phosphatase, Mg2+/Mn2+ dependent, 1B |
| chr7_-_9834670 | 0.03 |
ENSRNOT00000075919
ENSRNOT00000076994 |
LOC102549817
|
zinc finger protein 124-like |
| chrX_+_105911925 | 0.03 |
ENSRNOT00000052422
|
LOC108348137
|
armadillo repeat-containing X-linked protein 1 |
| chr5_+_33580944 | 0.03 |
ENSRNOT00000092054
ENSRNOT00000036050 |
Rmdn1
|
regulator of microtubule dynamics 1 |
| chr10_-_47018537 | 0.03 |
ENSRNOT00000068351
ENSRNOT00000080083 |
Top3a
|
topoisomerase (DNA) III alpha |
| chrX_-_64715823 | 0.03 |
ENSRNOT00000076297
|
Asb12
|
ankyrin repeat and SOCS box-containing 12 |
| chr7_-_25743537 | 0.03 |
ENSRNOT00000083450
|
LOC100910996
|
uncharacterized LOC100910996 |
| chr2_+_187951344 | 0.03 |
ENSRNOT00000027123
|
Ssr2
|
signal sequence receptor, beta |
| chr7_+_142239035 | 0.03 |
ENSRNOT00000006239
|
Dazap2
|
DAZ associated protein 2 |
| chr4_+_181027212 | 0.03 |
ENSRNOT00000002502
|
Stk38l
|
serine/threonine kinase 38 like |
| chr6_-_33691301 | 0.03 |
ENSRNOT00000008008
|
Rhob
|
ras homolog family member B |
| chr8_-_33017854 | 0.03 |
ENSRNOT00000011386
|
Barx2
|
BARX homeobox 2 |
| chr10_-_104637823 | 0.03 |
ENSRNOT00000010826
|
Wbp2
|
WW domain binding protein 2 |
| chr2_+_122877286 | 0.03 |
ENSRNOT00000033080
|
Arse
|
arylsulfatase E |
| chr8_+_131845696 | 0.03 |
ENSRNOT00000005440
|
Tcaim
|
T cell activation inhibitor, mitochondrial |
| chr2_-_143104412 | 0.03 |
ENSRNOT00000058116
|
Ufm1
|
ubiquitin-fold modifier 1 |
| chr4_+_170766900 | 0.03 |
ENSRNOT00000044446
|
H2afj
|
H2A histone family, member J |
| chr7_-_59587382 | 0.03 |
ENSRNOT00000091427
ENSRNOT00000066396 |
Cnot2
|
CCR4-NOT transcription complex, subunit 2 |
| chr11_+_89511191 | 0.03 |
ENSRNOT00000002510
|
Mcm4
|
minichromosome maintenance complex component 4 |
| chr20_+_18493538 | 0.03 |
ENSRNOT00000000749
|
Cisd1
|
CDGSH iron sulfur domain 1 |
| chr9_+_10885560 | 0.03 |
ENSRNOT00000072870
|
Mydgf
|
myeloid-derived growth factor |
| chr14_-_86047162 | 0.03 |
ENSRNOT00000018227
|
Pgam2
|
phosphoglycerate mutase 2 |
| chr1_-_79816450 | 0.03 |
ENSRNOT00000018495
|
Ccdc61
|
coiled-coil domain containing 61 |
| chr5_+_162808646 | 0.03 |
ENSRNOT00000021155
|
Dhrs3
|
dehydrogenase/reductase 3 |
| chr7_+_80750725 | 0.03 |
ENSRNOT00000079962
|
Oxr1
|
oxidation resistance 1 |
| chr3_-_172566010 | 0.03 |
ENSRNOT00000071913
|
Atp5e
|
ATP synthase, H+ transporting, mitochondrial F1 complex, epsilon subunit |
| chr15_+_33108671 | 0.02 |
ENSRNOT00000015468
|
Lrp10
|
LDL receptor related protein 10 |
| chr4_-_156427755 | 0.02 |
ENSRNOT00000085675
ENSRNOT00000014030 |
LOC103690024
|
peroxisomal targeting signal 1 receptor-like |
| chr10_-_10908776 | 0.02 |
ENSRNOT00000065907
|
AABR07072078.1
|
|
| chr1_-_134871167 | 0.02 |
ENSRNOT00000076300
|
Chd2
|
chromodomain helicase DNA binding protein 2 |
| chr14_+_42401706 | 0.02 |
ENSRNOT00000090148
|
Bend4
|
BEN domain containing 4 |
| chr1_+_101427195 | 0.02 |
ENSRNOT00000028271
|
Gys1
|
glycogen synthase 1 |
| chr4_+_61912210 | 0.02 |
ENSRNOT00000013569
|
Bpgm
|
bisphosphoglycerate mutase |
| chr10_-_88355678 | 0.02 |
ENSRNOT00000076625
|
Nt5c3b
|
5'-nucleotidase, cytosolic IIIB |
| chr6_-_109103999 | 0.02 |
ENSRNOT00000009086
ENSRNOT00000080009 |
Acyp1
|
acylphosphatase 1 |
| chr16_+_1979191 | 0.02 |
ENSRNOT00000014382
|
Ppif
|
peptidylprolyl isomerase F |
| chrX_-_106558366 | 0.02 |
ENSRNOT00000042126
|
Bex2
|
brain expressed X-linked 2 |
| chr8_-_13420439 | 0.02 |
ENSRNOT00000051471
|
Izumo1r
|
IZUMO1 receptor, JUNO |
| chr17_+_36451058 | 0.02 |
ENSRNOT00000071408
|
Cdkal1
|
CDK5 regulatory subunit associated protein 1-like 1 |
| chr7_-_144778339 | 0.02 |
ENSRNOT00000082149
|
Smug1
|
single-strand-selective monofunctional uracil-DNA glycosylase 1 |
| chr3_+_11763706 | 0.02 |
ENSRNOT00000078366
|
Sh2d3c
|
SH2 domain containing 3C |
| chr4_+_171748273 | 0.02 |
ENSRNOT00000009998
|
Dera
|
deoxyribose-phosphate aldolase |
| chr15_-_46681467 | 0.02 |
ENSRNOT00000015353
|
Tdh
|
L-threonine dehydrogenase |
| chrX_-_123486814 | 0.02 |
ENSRNOT00000016993
|
RGD1564541
|
similar to hypothetical protein FLJ22965 |
| chr10_+_73333119 | 0.02 |
ENSRNOT00000004736
|
Tbx4
|
T-box 4 |
| chr1_-_229639187 | 0.02 |
ENSRNOT00000016804
|
Zfp91
|
zinc finger protein 91 |
| chr10_+_89635675 | 0.02 |
ENSRNOT00000028179
|
RGD1561590
|
similar to SAP18 |
| chr7_+_70580198 | 0.02 |
ENSRNOT00000083472
ENSRNOT00000008941 |
Ddit3
|
DNA-damage inducible transcript 3 |
| chr10_-_20658100 | 0.02 |
ENSRNOT00000010252
|
Rars
|
arginyl-tRNA synthetase |
| chr20_+_9948908 | 0.02 |
ENSRNOT00000001541
|
Ubash3a
|
ubiquitin associated and SH3 domain containing, A |
| chr4_-_145370992 | 0.02 |
ENSRNOT00000068001
|
Rpusd3
|
RNA pseudouridylate synthase domain containing 3 |
| chr4_-_157008947 | 0.02 |
ENSRNOT00000073341
|
Pex5
|
peroxisomal biogenesis factor 5 |
| chr9_-_82699551 | 0.02 |
ENSRNOT00000020673
|
Obsl1
|
obscurin-like 1 |
| chr17_-_20364714 | 0.02 |
ENSRNOT00000070962
|
Jarid2
|
jumonji and AT-rich interaction domain containing 2 |
| chr5_+_165724027 | 0.02 |
ENSRNOT00000018000
|
Casz1
|
castor zinc finger 1 |
| chr3_+_151126591 | 0.02 |
ENSRNOT00000025859
|
Myh7b
|
myosin heavy chain 7B |
| chr1_+_282638017 | 0.02 |
ENSRNOT00000079722
ENSRNOT00000082254 |
Ces2c
|
carboxylesterase 2C |
| chr4_-_138885556 | 0.02 |
ENSRNOT00000008873
|
Crbn
|
cereblon |
| chr10_-_34961608 | 0.02 |
ENSRNOT00000033056
|
LOC103689931
|
heterogeneous nuclear ribonucleoprotein A/B |
| chr2_-_174413236 | 0.02 |
ENSRNOT00000064588
|
Golim4
|
golgi integral membrane protein 4 |
| chr4_+_9966891 | 0.02 |
ENSRNOT00000086609
|
Napepld
|
N-acyl phosphatidylethanolamine phospholipase D |
| chr17_-_77093308 | 0.02 |
ENSRNOT00000024110
|
Ccdc3
|
coiled-coil domain containing 3 |
| chr17_-_75886523 | 0.01 |
ENSRNOT00000046266
|
Usp6nl
|
USP6 N-terminal like |
| chr11_+_73078982 | 0.01 |
ENSRNOT00000029549
|
Acap2
|
ArfGAP with coiled-coil, ankyrin repeat and PH domains 2 |
| chr14_+_83341851 | 0.01 |
ENSRNOT00000086090
|
Pisd
|
phosphatidylserine decarboxylase |
| chr5_-_136748980 | 0.01 |
ENSRNOT00000026844
|
Ipo13
|
importin 13 |
| chr7_-_124982566 | 0.01 |
ENSRNOT00000075099
|
Sult4a1
|
sulfotransferase family 4A, member 1 |
| chr10_+_47018974 | 0.01 |
ENSRNOT00000079375
|
Smcr8
|
Smith-Magenis syndrome chromosome region, candidate 8 |
| chrX_+_110016995 | 0.01 |
ENSRNOT00000093542
|
Nrk
|
Nik related kinase |
| chr20_+_27212724 | 0.01 |
ENSRNOT00000032600
|
Hnrnph3
|
heterogeneous nuclear ribonucleoprotein H3 |
| chr18_+_86307646 | 0.01 |
ENSRNOT00000091778
|
Cd226
|
CD226 molecule |
| chr6_-_51257625 | 0.01 |
ENSRNOT00000012004
|
Hbp1
|
HMG-box transcription factor 1 |
| chr20_-_3728844 | 0.01 |
ENSRNOT00000074958
|
Psors1c2
|
psoriasis susceptibility 1 candidate 2 |
| chr14_-_7863664 | 0.01 |
ENSRNOT00000061162
|
Ptpn13
|
protein tyrosine phosphatase, non-receptor type 13 |
| chr4_+_98648545 | 0.01 |
ENSRNOT00000008451
|
Eif2ak3
|
eukaryotic translation initiation factor 2 alpha kinase 3 |
| chrX_+_106823491 | 0.01 |
ENSRNOT00000045997
|
Bex3
|
brain expressed X-linked 3 |
| chr11_-_14741563 | 0.01 |
ENSRNOT00000002152
|
Nrip1
|
nuclear receptor interacting protein 1 |
| chr3_+_45277348 | 0.01 |
ENSRNOT00000059246
|
Pkp4
|
plakophilin 4 |
| chr8_-_132032971 | 0.01 |
ENSRNOT00000005502
|
RGD1311745
|
similar to RIKEN cDNA 1110059G10 |
| chrX_-_64726210 | 0.01 |
ENSRNOT00000076012
ENSRNOT00000086265 |
Asb12
|
ankyrin repeat and SOCS box-containing 12 |
| chr2_+_78262839 | 0.01 |
ENSRNOT00000066879
|
LOC103689968
|
protein FAM134B |
| chr15_-_28314459 | 0.01 |
ENSRNOT00000042055
ENSRNOT00000040540 |
Ndrg2
|
NDRG family member 2 |
| chr15_-_28313841 | 0.01 |
ENSRNOT00000085897
|
Ndrg2
|
NDRG family member 2 |
| chr20_-_2083688 | 0.01 |
ENSRNOT00000001011
|
Znrd1as1
|
ZNRD1 antisense RNA 1 |
| chr3_-_120076788 | 0.01 |
ENSRNOT00000047158
|
Kcnip3
|
potassium voltage-gated channel interacting protein 3 |
| chr1_-_101426852 | 0.01 |
ENSRNOT00000028217
|
Ruvbl2
|
RuvB-like AAA ATPase 2 |
| chr2_-_186480278 | 0.01 |
ENSRNOT00000031743
|
Kirrel
|
kin of IRRE like (Drosophila) |
| chr1_-_256914260 | 0.01 |
ENSRNOT00000020620
|
Fra10ac1
|
FRA10A associated CGG repeat 1 |
| chr5_-_146973932 | 0.01 |
ENSRNOT00000007761
|
Zfp362
|
zinc finger protein 362 |
| chr6_-_108488330 | 0.01 |
ENSRNOT00000016076
|
Npc2
|
NPC intracellular cholesterol transporter 2 |
| chr1_-_88123643 | 0.01 |
ENSRNOT00000027937
|
Psmd8
|
proteasome 26S subunit, non-ATPase 8 |
| chr3_+_160207913 | 0.01 |
ENSRNOT00000014346
|
Wisp2
|
WNT1 inducible signaling pathway protein 2 |
| chr19_-_20508711 | 0.01 |
ENSRNOT00000032408
|
LOC680913
|
hypothetical protein LOC680913 |
| chrX_+_71324365 | 0.01 |
ENSRNOT00000004911
|
Nono
|
non-POU domain containing, octamer-binding |
| chr19_+_27404712 | 0.01 |
ENSRNOT00000023657
|
Mylk3
|
myosin light chain kinase 3 |
| chr3_-_176282211 | 0.01 |
ENSRNOT00000013690
|
Bhlhe23
|
basic helix-loop-helix family, member e23 |
| chr11_-_71419223 | 0.01 |
ENSRNOT00000002407
|
Tfrc
|
transferrin receptor |
| chr7_+_131330913 | 0.01 |
ENSRNOT00000019672
|
Alg10
|
ALG10, alpha-1,2-glucosyltransferase |
| chr20_-_11424324 | 0.01 |
ENSRNOT00000049745
|
RGD1309594
|
similar to RIKEN cDNA 1810043G02; DNA segment, Chr 10, Johns Hopkins University 13, expressed |
| chr1_+_142951094 | 0.01 |
ENSRNOT00000077441
|
Slc28a1
|
solute carrier family 28 member 1 |
| chr4_-_150520774 | 0.01 |
ENSRNOT00000009095
|
Zfp9
|
zinc finger protein 9 |
| chr9_-_19476646 | 0.01 |
ENSRNOT00000013703
|
Enpp5
|
ectonucleotide pyrophosphatase/phosphodiesterase 5 |
| chr5_+_2632712 | 0.01 |
ENSRNOT00000009431
|
Rpl7
|
ribosomal protein L7 |
Network of associatons between targets according to the STRING database.

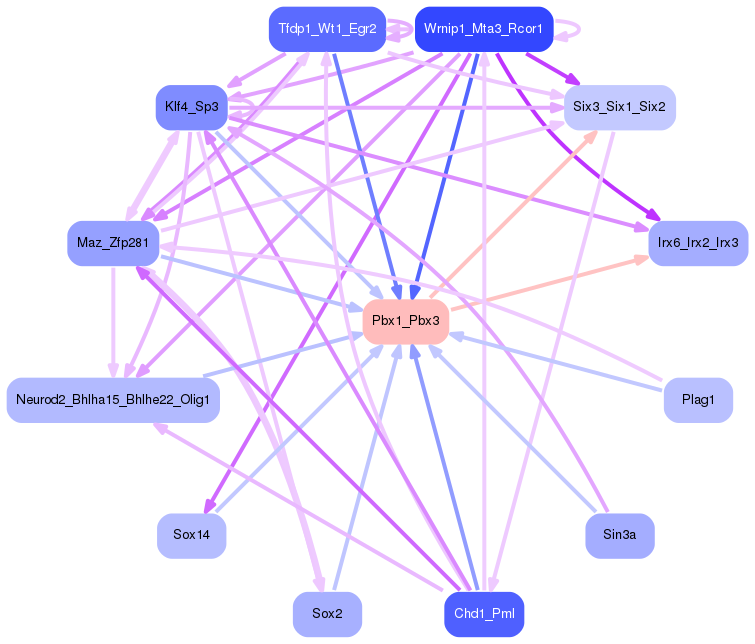
First level regulatory network of Pbx1_Pbx3
Gene Ontology Analysis
Gene overrepresentation in biological process category:
| Log-likelihood per target | Total log-likelihood | Term | Description |
|---|---|---|---|
| 0.1 | 0.4 | GO:0060061 | Spemann organizer formation(GO:0060061) |
| 0.1 | 0.4 | GO:0072268 | specification of loop of Henle identity(GO:0072086) pattern specification involved in metanephros development(GO:0072268) |
| 0.1 | 0.2 | GO:1903588 | negative regulation of blood vessel endothelial cell proliferation involved in sprouting angiogenesis(GO:1903588) |
| 0.1 | 0.2 | GO:0060648 | mammary gland bud morphogenesis(GO:0060648) |
| 0.1 | 0.2 | GO:0021797 | neuroblast differentiation(GO:0014016) forebrain anterior/posterior pattern specification(GO:0021797) |
| 0.0 | 0.1 | GO:1904207 | regulation of chemokine (C-C motif) ligand 2 secretion(GO:1904207) positive regulation of chemokine (C-C motif) ligand 2 secretion(GO:1904209) positive regulation of metalloendopeptidase activity(GO:1904685) |
| 0.0 | 0.1 | GO:2001201 | calcium-independent cell-matrix adhesion(GO:0007161) interaction with other organism via secreted substance involved in symbiotic interaction(GO:0052047) regulation of transforming growth factor-beta secretion(GO:2001201) |
| 0.0 | 0.1 | GO:0033058 | directional locomotion(GO:0033058) |
| 0.0 | 0.1 | GO:2000820 | negative regulation of transcription from RNA polymerase II promoter involved in smooth muscle cell differentiation(GO:2000820) |
| 0.0 | 0.1 | GO:0021817 | nucleokinesis involved in cell motility in cerebral cortex radial glia guided migration(GO:0021817) nuclear migration along microtubule(GO:0030473) nuclear matrix anchoring at nuclear membrane(GO:0090292) |
| 0.0 | 0.1 | GO:0044778 | meiotic DNA integrity checkpoint(GO:0044778) |
| 0.0 | 0.1 | GO:2000182 | cellular response to nitrite(GO:0071250) response to nitrite(GO:0080033) response to resveratrol(GO:1904638) regulation of progesterone biosynthetic process(GO:2000182) |
| 0.0 | 0.1 | GO:0060354 | negative regulation of cell adhesion molecule production(GO:0060354) |
| 0.0 | 0.1 | GO:0009992 | cellular water homeostasis(GO:0009992) |
| 0.0 | 0.1 | GO:2000660 | negative regulation of interleukin-1-mediated signaling pathway(GO:2000660) |
| 0.0 | 0.1 | GO:0071387 | cellular response to cortisol stimulus(GO:0071387) |
| 0.0 | 0.3 | GO:0042759 | long-chain fatty acid biosynthetic process(GO:0042759) |
| 0.0 | 0.1 | GO:0046725 | negative regulation by virus of viral protein levels in host cell(GO:0046725) |
| 0.0 | 0.1 | GO:0006419 | alanyl-tRNA aminoacylation(GO:0006419) |
| 0.0 | 0.1 | GO:0045041 | protein import into mitochondrial intermembrane space(GO:0045041) |
| 0.0 | 0.1 | GO:0071104 | response to interleukin-9(GO:0071104) |
| 0.0 | 0.1 | GO:0002317 | plasma cell differentiation(GO:0002317) |
| 0.0 | 0.0 | GO:1902527 | positive regulation of protein monoubiquitination(GO:1902527) |
| 0.0 | 0.0 | GO:0015692 | nickel cation transport(GO:0015675) vanadium ion transport(GO:0015676) lead ion transport(GO:0015692) nickel cation transmembrane transport(GO:0035444) |
| 0.0 | 0.0 | GO:0030240 | skeletal muscle thin filament assembly(GO:0030240) |
| 0.0 | 0.3 | GO:0045745 | positive regulation of G-protein coupled receptor protein signaling pathway(GO:0045745) |
| 0.0 | 0.0 | GO:0061113 | positive regulation of hh target transcription factor activity(GO:0007228) pancreas morphogenesis(GO:0061113) |
| 0.0 | 0.0 | GO:0019262 | N-acetylneuraminate catabolic process(GO:0019262) |
Gene overrepresentation in cellular component category:
| Log-likelihood per target | Total log-likelihood | Term | Description |
|---|---|---|---|
| 0.0 | 0.1 | GO:0005945 | 6-phosphofructokinase complex(GO:0005945) |
| 0.0 | 0.1 | GO:0033269 | internode region of axon(GO:0033269) |
| 0.0 | 0.1 | GO:0014731 | spectrin-associated cytoskeleton(GO:0014731) |
| 0.0 | 1.3 | GO:0031594 | neuromuscular junction(GO:0031594) |
| 0.0 | 0.0 | GO:0070826 | paraferritin complex(GO:0070826) |
| 0.0 | 0.1 | GO:0030896 | checkpoint clamp complex(GO:0030896) |
| 0.0 | 0.0 | GO:0034774 | secretory granule lumen(GO:0034774) |
| 0.0 | 0.1 | GO:0005577 | fibrinogen complex(GO:0005577) |
| 0.0 | 0.1 | GO:0034992 | microtubule organizing center attachment site(GO:0034992) LINC complex(GO:0034993) |
Gene overrepresentation in molecular function category:
| Log-likelihood per target | Total log-likelihood | Term | Description |
|---|---|---|---|
| 0.0 | 0.4 | GO:0019911 | structural constituent of myelin sheath(GO:0019911) |
| 0.0 | 0.2 | GO:0008321 | Ral guanyl-nucleotide exchange factor activity(GO:0008321) |
| 0.0 | 0.1 | GO:0004809 | tRNA (guanine-N2-)-methyltransferase activity(GO:0004809) |
| 0.0 | 0.1 | GO:0035939 | microsatellite binding(GO:0035939) |
| 0.0 | 0.4 | GO:0048018 | receptor agonist activity(GO:0048018) |
| 0.0 | 0.1 | GO:0033149 | FFAT motif binding(GO:0033149) |
| 0.0 | 0.1 | GO:0000703 | oxidized pyrimidine nucleobase lesion DNA N-glycosylase activity(GO:0000703) |
| 0.0 | 0.1 | GO:0003872 | 6-phosphofructokinase activity(GO:0003872) |
| 0.0 | 0.1 | GO:0004813 | alanine-tRNA ligase activity(GO:0004813) |
| 0.0 | 0.0 | GO:0031752 | D5 dopamine receptor binding(GO:0031752) |
| 0.0 | 0.1 | GO:0045340 | mercury ion binding(GO:0045340) |
| 0.0 | 0.0 | GO:0015639 | cadmium ion transmembrane transporter activity(GO:0015086) lead ion transmembrane transporter activity(GO:0015094) nickel cation transmembrane transporter activity(GO:0015099) vanadium ion transmembrane transporter activity(GO:0015100) ferrous iron uptake transmembrane transporter activity(GO:0015639) chromium ion transmembrane transporter activity(GO:0070835) |
| 0.0 | 0.0 | GO:0031559 | lanosterol synthase activity(GO:0000250) oxidosqualene cyclase activity(GO:0031559) |
| 0.0 | 0.1 | GO:0004977 | melanocortin receptor activity(GO:0004977) |
| 0.0 | 0.1 | GO:0005332 | gamma-aminobutyric acid:sodium symporter activity(GO:0005332) |
| 0.0 | 0.0 | GO:0004082 | bisphosphoglycerate mutase activity(GO:0004082) phosphoglycerate mutase activity(GO:0004619) 2,3-bisphosphoglycerate-dependent phosphoglycerate mutase activity(GO:0046538) |
| 0.0 | 0.1 | GO:0016308 | 1-phosphatidylinositol-4-phosphate 5-kinase activity(GO:0016308) |
| 0.0 | 0.0 | GO:0016715 | oxidoreductase activity, acting on paired donors, with incorporation or reduction of molecular oxygen, reduced ascorbate as one donor, and incorporation of one atom of oxygen(GO:0016715) |
Gene overrepresentation in curated gene sets: canonical pathways category:
| Log-likelihood per target | Total log-likelihood | Term | Description |
|---|---|---|---|
| 0.0 | 0.1 | ST PAC1 RECEPTOR PATHWAY | PAC1 Receptor Pathway |
| 0.0 | 0.4 | PID WNT SIGNALING PATHWAY | Wnt signaling network |
Gene overrepresentation in curated gene sets: REACTOME pathways category:
| Log-likelihood per target | Total log-likelihood | Term | Description |
|---|---|---|---|
| 0.0 | 1.4 | REACTOME ADHERENS JUNCTIONS INTERACTIONS | Genes involved in Adherens junctions interactions |
| 0.0 | 0.2 | REACTOME SIGNALING BY NOTCH4 | Genes involved in Signaling by NOTCH4 |
| 0.0 | 0.0 | REACTOME PERK REGULATED GENE EXPRESSION | Genes involved in PERK regulated gene expression |