Project
GSE49485: Hypoxia transcriptome sequencing of rat brain.
Navigation
Downloads
Results for Olig2_Olig3
Z-value: 0.40
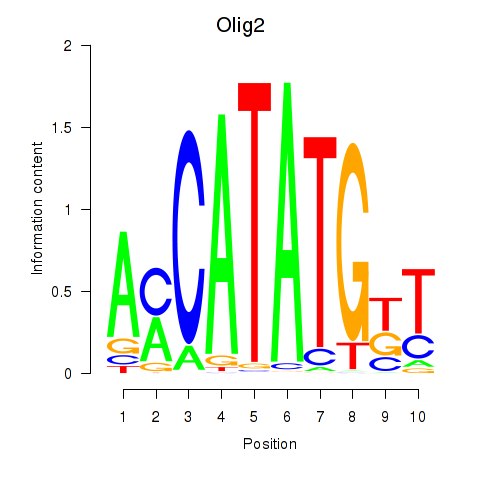
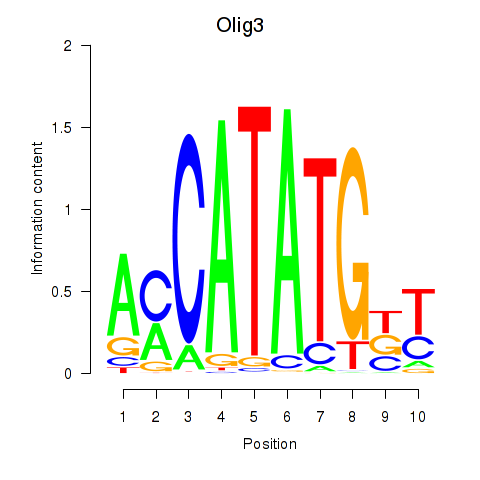
Motif logo
Transcription factors associated with Olig2_Olig3
| Gene Symbol | Gene ID | Gene Info |
|---|---|---|
|
Olig2
|
ENSRNOG00000028658 | oligodendrocyte lineage transcription factor 2 |
|
Olig3
|
ENSRNOG00000012057 | oligodendrocyte transcription factor 3 |
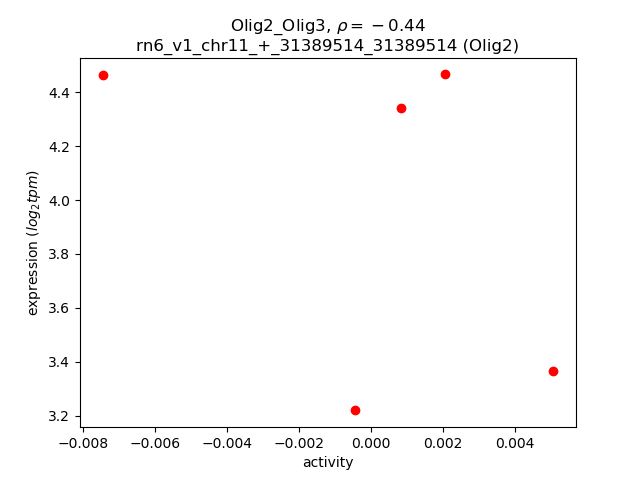
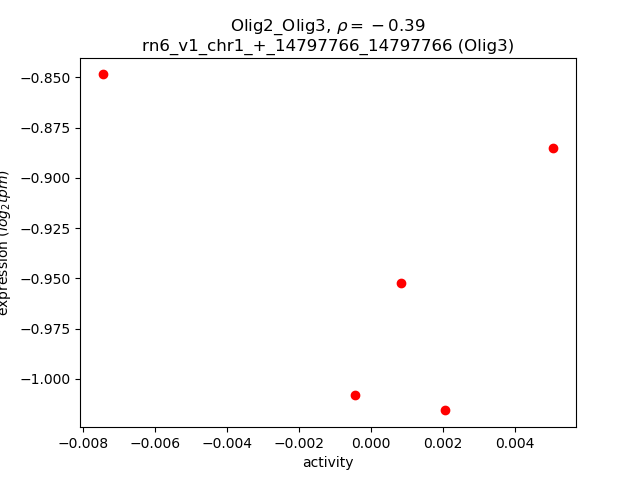
Activity-expression correlation:
| Gene | Promoter | Pearson corr. coef. | P-value | Plot |
|---|---|---|---|---|
| Olig2 | rn6_v1_chr11_+_31389514_31389514 | -0.44 | 4.6e-01 | Click! |
| Olig3 | rn6_v1_chr1_+_14797766_14797766 | -0.39 | 5.1e-01 | Click! |
Activity profile of Olig2_Olig3 motif
Sorted Z-values of Olig2_Olig3 motif
| Promoter | Log-likelihood | Transcript | Gene | Gene Info |
|---|---|---|---|---|
| chr10_-_51576376 | 0.32 |
ENSRNOT00000004829
|
Arhgap44
|
Rho GTPase activating protein 44 |
| chrX_-_76708878 | 0.27 |
ENSRNOT00000045534
|
Atrx
|
ATRX, chromatin remodeler |
| chr16_-_70705128 | 0.23 |
ENSRNOT00000071258
|
Rnf170
|
ring finger protein 170 |
| chr20_+_6211420 | 0.23 |
ENSRNOT00000000624
|
Kctd20
|
potassium channel tetramerization domain containing 20 |
| chr10_+_11393103 | 0.22 |
ENSRNOT00000076022
|
Adcy9
|
adenylate cyclase 9 |
| chr9_-_112027155 | 0.22 |
ENSRNOT00000021258
ENSRNOT00000080962 |
Pja2
|
praja ring finger ubiquitin ligase 2 |
| chr9_+_16302578 | 0.21 |
ENSRNOT00000021762
|
Gltscr1l
|
GLTSCR1-like |
| chr18_-_68551558 | 0.20 |
ENSRNOT00000016369
|
Rab27b
|
RAB27B, member RAS oncogene family |
| chr10_-_16046033 | 0.19 |
ENSRNOT00000089460
|
Cpeb4
|
cytoplasmic polyadenylation element binding protein 4 |
| chr2_+_196594303 | 0.19 |
ENSRNOT00000064442
ENSRNOT00000044738 |
Arnt
|
aryl hydrocarbon receptor nuclear translocator |
| chr5_-_169630340 | 0.19 |
ENSRNOT00000087043
|
Kcnab2
|
potassium voltage-gated channel subfamily A regulatory beta subunit 2 |
| chr10_-_16045835 | 0.19 |
ENSRNOT00000064832
|
Cpeb4
|
cytoplasmic polyadenylation element binding protein 4 |
| chr2_-_177924970 | 0.18 |
ENSRNOT00000029340
|
Rapgef2
|
Rap guanine nucleotide exchange factor 2 |
| chr1_+_99505677 | 0.18 |
ENSRNOT00000024645
|
Zfp719
|
zinc finger protein 719 |
| chr3_+_8817076 | 0.17 |
ENSRNOT00000078932
|
Lrrc8a
|
leucine rich repeat containing 8 family, member A |
| chr6_+_26566494 | 0.17 |
ENSRNOT00000079292
|
Gtf3c2
|
general transcription factor IIIC subunit 2 |
| chr20_+_5535432 | 0.17 |
ENSRNOT00000040859
|
Syngap1
|
synaptic Ras GTPase activating protein 1 |
| chr13_-_88642011 | 0.17 |
ENSRNOT00000067037
|
LOC100361087
|
hypothetical LOC100361087 |
| chr10_+_11392625 | 0.16 |
ENSRNOT00000072802
|
Adcy9
|
adenylate cyclase 9 |
| chr2_-_149444548 | 0.16 |
ENSRNOT00000018600
|
P2ry12
|
purinergic receptor P2Y12 |
| chr2_+_122368265 | 0.16 |
ENSRNOT00000078321
|
Atp11b
|
ATPase phospholipid transporting 11B (putative) |
| chrX_-_76924362 | 0.16 |
ENSRNOT00000078997
|
Atrx
|
ATRX, chromatin remodeler |
| chr7_+_70283710 | 0.16 |
ENSRNOT00000075371
|
Ctdsp2
|
CTD small phosphatase 2 |
| chr5_-_2982603 | 0.16 |
ENSRNOT00000045460
|
Kcnb2
|
potassium voltage-gated channel subfamily B member 2 |
| chr10_-_56530842 | 0.15 |
ENSRNOT00000077451
|
AABR07029863.3
|
|
| chr8_-_63750531 | 0.15 |
ENSRNOT00000009496
|
Neo1
|
neogenin 1 |
| chr10_-_63952726 | 0.15 |
ENSRNOT00000090461
|
Doc2b
|
double C2 domain beta |
| chrX_+_15113878 | 0.15 |
ENSRNOT00000007464
|
Wdr13
|
WD repeat domain 13 |
| chr5_-_59638385 | 0.14 |
ENSRNOT00000060203
ENSRNOT00000077367 |
Rnf38
|
ring finger protein 38 |
| chr3_-_145810834 | 0.14 |
ENSRNOT00000075429
|
LOC102555217
|
zinc finger protein 120-like |
| chr17_-_44643362 | 0.14 |
ENSRNOT00000091041
|
Zfp184
|
zinc finger protein 184 |
| chr9_-_81586116 | 0.14 |
ENSRNOT00000089952
|
Tmbim1
|
transmembrane BAX inhibitor motif containing 1 |
| chr5_-_161875362 | 0.14 |
ENSRNOT00000078237
|
Prdm2
|
PR/SET domain 2 |
| chr7_-_117151694 | 0.13 |
ENSRNOT00000051294
|
Nrbp2
|
nuclear receptor binding protein 2 |
| chr17_-_10208360 | 0.13 |
ENSRNOT00000087397
|
Unc5a
|
unc-5 netrin receptor A |
| chr3_+_150135821 | 0.13 |
ENSRNOT00000047286
|
Zfp341
|
zinc finger protein 341 |
| chr8_-_84506328 | 0.13 |
ENSRNOT00000064754
|
Mlip
|
muscular LMNA-interacting protein |
| chr12_-_43576754 | 0.13 |
ENSRNOT00000042331
ENSRNOT00000081780 |
Med13l
|
mediator complex subunit 13-like |
| chr6_+_43234526 | 0.13 |
ENSRNOT00000086808
|
Asap2
|
ArfGAP with SH3 domain, ankyrin repeat and PH domain 2 |
| chr8_-_28044876 | 0.13 |
ENSRNOT00000072152
|
Acad8
|
acyl-CoA dehydrogenase family, member 8 |
| chr19_+_52664322 | 0.12 |
ENSRNOT00000082754
|
Crispld2
|
cysteine-rich secretory protein LCCL domain containing 2 |
| chr3_+_40038336 | 0.12 |
ENSRNOT00000048804
|
Galnt13
|
polypeptide N-acetylgalactosaminyltransferase 13 |
| chr10_+_90731865 | 0.12 |
ENSRNOT00000064429
|
Adam11
|
ADAM metallopeptidase domain 11 |
| chr6_+_52663112 | 0.12 |
ENSRNOT00000013842
|
Atxn7l1
|
ataxin 7-like 1 |
| chr3_+_172155496 | 0.12 |
ENSRNOT00000066279
|
Stx16
|
syntaxin 16 |
| chr3_-_13525983 | 0.11 |
ENSRNOT00000082036
|
Pbx3
|
PBX homeobox 3 |
| chr16_-_83438561 | 0.11 |
ENSRNOT00000057461
|
Col4a2
|
collagen type IV alpha 2 chain |
| chr11_-_88972176 | 0.11 |
ENSRNOT00000002498
|
Pkp2
|
plakophilin 2 |
| chr9_+_121831716 | 0.11 |
ENSRNOT00000056250
ENSRNOT00000056251 |
Yes1
|
YES proto-oncogene 1, Src family tyrosine kinase |
| chrX_-_82743753 | 0.11 |
ENSRNOT00000003512
|
Rps6ka6
|
ribosomal protein S6 kinase A6 |
| chr7_-_114848414 | 0.11 |
ENSRNOT00000032620
|
Slc45a4
|
solute carrier family 45, member 4 |
| chr3_+_145764932 | 0.11 |
ENSRNOT00000075257
|
AABR07054264.1
|
|
| chr5_-_8864578 | 0.11 |
ENSRNOT00000008480
|
Cspp1
|
centrosome and spindle pole associated protein 1 |
| chr9_+_112360419 | 0.10 |
ENSRNOT00000086682
|
Man2a1
|
mannosidase, alpha, class 2A, member 1 |
| chr1_-_217620420 | 0.10 |
ENSRNOT00000092783
|
Cttn
|
cortactin |
| chr13_+_110257571 | 0.10 |
ENSRNOT00000005715
|
Ints7
|
integrator complex subunit 7 |
| chr13_+_43850751 | 0.10 |
ENSRNOT00000004995
|
Mgat5
|
mannosyl (alpha-1,6-)-glycoprotein beta-1,6-N-acetyl-glucosaminyltransferase |
| chr15_-_100348760 | 0.10 |
ENSRNOT00000085607
|
AABR07019341.1
|
|
| chr10_+_32824 | 0.10 |
ENSRNOT00000077828
|
LOC103689943
|
meiosis arrest female protein 1-like |
| chr3_+_36173002 | 0.10 |
ENSRNOT00000038906
|
LOC499796
|
LRRGT00012 |
| chr9_-_88816898 | 0.10 |
ENSRNOT00000083667
|
Slc19a3
|
solute carrier family 19 member 3 |
| chr5_-_59553416 | 0.10 |
ENSRNOT00000090490
|
Gne
|
glucosamine (UDP-N-acetyl)-2-epimerase/N-acetylmannosamine kinase |
| chr19_-_22632071 | 0.10 |
ENSRNOT00000077275
|
Gpt2
|
glutamic--pyruvic transaminase 2 |
| chr5_-_12526962 | 0.10 |
ENSRNOT00000092104
|
St18
|
suppression of tumorigenicity 18 |
| chr17_+_77601877 | 0.10 |
ENSRNOT00000091554
ENSRNOT00000024872 |
Prpf18
|
pre-mRNA processing factor 18 |
| chr7_+_117456039 | 0.10 |
ENSRNOT00000051754
|
Mroh1
|
maestro heat-like repeat family member 1 |
| chr1_+_98627372 | 0.09 |
ENSRNOT00000030370
|
Dzf17
|
zinc finger protein 17 |
| chr1_-_61872975 | 0.09 |
ENSRNOT00000078809
|
AABR07001910.1
|
|
| chr14_-_28856214 | 0.09 |
ENSRNOT00000044659
|
Adgrl3
|
adhesion G protein-coupled receptor L3 |
| chr5_+_58636083 | 0.09 |
ENSRNOT00000067281
|
Unc13b
|
unc-13 homolog B |
| chr14_+_63405408 | 0.09 |
ENSRNOT00000086658
|
AABR07015559.1
|
|
| chr17_-_86657473 | 0.09 |
ENSRNOT00000078827
|
AABR07028795.1
|
|
| chr4_-_155740193 | 0.09 |
ENSRNOT00000043229
|
LOC102550396
|
LRRGT00188 |
| chrX_+_120901495 | 0.09 |
ENSRNOT00000040742
|
Wdr44
|
WD repeat domain 44 |
| chr6_+_127941526 | 0.09 |
ENSRNOT00000033897
|
LOC500712
|
Ab1-233 |
| chr20_-_5485837 | 0.09 |
ENSRNOT00000092272
ENSRNOT00000000559 ENSRNOT00000092597 |
Daxx
|
death-domain associated protein |
| chr10_+_65523193 | 0.09 |
ENSRNOT00000016084
|
RGD1307929
|
similar to CG14967-PA |
| chr1_+_100299626 | 0.09 |
ENSRNOT00000092327
ENSRNOT00000044257 |
Shank1
|
SH3 and multiple ankyrin repeat domains 1 |
| chr1_+_88885937 | 0.09 |
ENSRNOT00000029719
|
Nfkbid
|
NFKB inhibitor delta |
| chr10_-_83128297 | 0.09 |
ENSRNOT00000082160
|
Kat7
|
lysine acetyltransferase 7 |
| chr5_+_76092287 | 0.08 |
ENSRNOT00000020207
|
Zfp483
|
zinc finger protein 483 |
| chr11_+_57207656 | 0.08 |
ENSRNOT00000038207
ENSRNOT00000085754 |
Plcxd2
|
phosphatidylinositol-specific phospholipase C, X domain containing 2 |
| chr7_+_20262680 | 0.08 |
ENSRNOT00000046378
|
LOC300308
|
similar to hypothetical protein 4930509O22 |
| chr4_-_51586881 | 0.08 |
ENSRNOT00000064983
|
Iqub
|
IQ motif and ubiquitin domain containing |
| chr20_-_5212624 | 0.08 |
ENSRNOT00000074261
|
LOC103689996
|
antigen peptide transporter 2 |
| chr5_-_77945016 | 0.08 |
ENSRNOT00000076223
|
Zfp37
|
zinc finger protein 37 |
| chr7_-_104749552 | 0.08 |
ENSRNOT00000079981
|
Asap1
|
ArfGAP with SH3 domain, ankyrin repeat and PH domain 1 |
| chr13_+_103171047 | 0.08 |
ENSRNOT00000003216
|
Rab3gap2
|
RAB3 GTPase activating non-catalytic protein subunit 2 |
| chr17_+_77176716 | 0.08 |
ENSRNOT00000083342
ENSRNOT00000024162 |
Optn
|
optineurin |
| chr7_+_141642777 | 0.08 |
ENSRNOT00000079811
|
AABR07058884.2
|
|
| chr5_+_74874306 | 0.08 |
ENSRNOT00000076918
|
Akap2
|
A-kinase anchoring protein 2 |
| chr17_-_8331032 | 0.08 |
ENSRNOT00000016704
|
Smad5
|
SMAD family member 5 |
| chr8_+_115546712 | 0.08 |
ENSRNOT00000079801
|
Dcaf1
|
DDB1 and CUL4 associated factor 1 |
| chr8_-_48634797 | 0.08 |
ENSRNOT00000012868
|
Hinfp
|
histone H4 transcription factor |
| chr13_-_67206688 | 0.08 |
ENSRNOT00000003630
ENSRNOT00000090693 |
Pla2g4a
|
phospholipase A2 group IVA |
| chr17_+_87274944 | 0.07 |
ENSRNOT00000073718
|
Etl4
|
enhancer trap locus 4 |
| chr4_+_88695590 | 0.07 |
ENSRNOT00000087835
|
Ppm1k
|
protein phosphatase, Mg2+/Mn2+ dependent, 1K |
| chr1_+_274688580 | 0.07 |
ENSRNOT00000020580
|
Shoc2
|
SHOC2 leucine-rich repeat scaffold protein |
| chr1_+_124625985 | 0.07 |
ENSRNOT00000021068
|
Otud7a
|
OTU deubiquitinase 7A |
| chr8_-_23390773 | 0.07 |
ENSRNOT00000019601
ENSRNOT00000071846 |
Anln
|
anillin, actin binding protein |
| chr5_+_121952977 | 0.07 |
ENSRNOT00000008278
|
Pde4b
|
phosphodiesterase 4B |
| chr4_-_22424862 | 0.07 |
ENSRNOT00000082359
|
Abcb1a
|
ATP binding cassette subfamily B member 1A |
| chr16_-_71237118 | 0.07 |
ENSRNOT00000066974
|
Nsd3
|
nuclear receptor binding SET domain protein 3 |
| chr2_-_189395746 | 0.07 |
ENSRNOT00000089042
|
Ubap2l
|
ubiquitin associated protein 2-like |
| chrX_-_29648359 | 0.07 |
ENSRNOT00000086721
ENSRNOT00000006777 |
Gpm6b
|
glycoprotein m6b |
| chr9_-_92405117 | 0.07 |
ENSRNOT00000079452
|
Trip12
|
thyroid hormone receptor interactor 12 |
| chr3_-_66335869 | 0.07 |
ENSRNOT00000079781
ENSRNOT00000043238 ENSRNOT00000073412 ENSRNOT00000057878 ENSRNOT00000079212 |
Cerkl
|
ceramide kinase-like |
| chr3_+_128756799 | 0.07 |
ENSRNOT00000049855
ENSRNOT00000042853 |
Plcb4
|
phospholipase C, beta 4 |
| chr8_+_69971778 | 0.07 |
ENSRNOT00000058007
ENSRNOT00000037941 ENSRNOT00000050649 |
Megf11
|
multiple EGF-like-domains 11 |
| chr2_-_54777729 | 0.07 |
ENSRNOT00000082548
|
C7
|
complement C7 |
| chr10_+_73868943 | 0.07 |
ENSRNOT00000081012
|
Tubd1
|
tubulin, delta 1 |
| chr6_+_60566196 | 0.07 |
ENSRNOT00000006709
ENSRNOT00000075193 |
Dock4
|
dedicator of cytokinesis 4 |
| chr20_+_3146856 | 0.06 |
ENSRNOT00000050159
|
RT1-N2
|
RT1 class Ib, locus N2 |
| chr7_-_117978787 | 0.06 |
ENSRNOT00000074262
|
Zfp647
|
zinc finger protein 647 |
| chr1_-_72461547 | 0.06 |
ENSRNOT00000022480
|
Ssc5d
|
scavenger receptor cysteine rich family member with 5 domains |
| chr3_-_25212049 | 0.06 |
ENSRNOT00000040023
|
Lrp1b
|
LDL receptor related protein 1B |
| chr1_-_37932084 | 0.06 |
ENSRNOT00000022527
|
LOC102547287
|
zinc finger protein 728-like |
| chr14_-_114649173 | 0.06 |
ENSRNOT00000083528
|
Sptbn1
|
spectrin, beta, non-erythrocytic 1 |
| chr10_-_109278510 | 0.06 |
ENSRNOT00000038993
|
Tepsin
|
TEPSIN, adaptor related protein complex 4 accessory protein |
| chr13_+_82552550 | 0.06 |
ENSRNOT00000003817
ENSRNOT00000076722 ENSRNOT00000076607 |
Slc19a2
|
solute carrier family 19 member 2 |
| chr3_+_147713821 | 0.06 |
ENSRNOT00000007558
|
Csnk2a1
|
casein kinase 2 alpha 1 |
| chr8_-_78397123 | 0.06 |
ENSRNOT00000087270
ENSRNOT00000084925 |
Tcf12
|
transcription factor 12 |
| chr3_-_37445907 | 0.06 |
ENSRNOT00000006172
|
Rbm43
|
RNA binding motif protein 43 |
| chr12_+_25435567 | 0.06 |
ENSRNOT00000092982
|
Gtf2i
|
general transcription factor II I |
| chr10_+_74959285 | 0.06 |
ENSRNOT00000010296
|
Rnf43
|
ring finger protein 43 |
| chr2_-_248789508 | 0.06 |
ENSRNOT00000090705
|
Pkn2
|
protein kinase N2 |
| chr1_+_248402980 | 0.06 |
ENSRNOT00000043517
|
Chchd4
|
coiled-coil-helix-coiled-coil-helix domain containing 4 |
| chr1_-_264706476 | 0.06 |
ENSRNOT00000045446
|
AC121209.1
|
|
| chr9_+_16508799 | 0.05 |
ENSRNOT00000021803
|
Rpl7l1
|
ribosomal protein L7-like 1 |
| chr4_+_157438605 | 0.05 |
ENSRNOT00000079988
|
AC115420.4
|
|
| chr6_+_126874193 | 0.05 |
ENSRNOT00000011775
|
Unc79
|
unc-79 homolog (C. elegans) |
| chr3_+_155297566 | 0.05 |
ENSRNOT00000021435
ENSRNOT00000084866 |
Dhx35
|
DEAH-box helicase 35 |
| chr1_+_192379543 | 0.05 |
ENSRNOT00000078705
|
Prkcb
|
protein kinase C, beta |
| chr8_-_47339343 | 0.05 |
ENSRNOT00000081007
|
Arhgef12
|
Rho guanine nucleotide exchange factor 12 |
| chr2_-_210454737 | 0.05 |
ENSRNOT00000079993
|
Ahcyl1
|
adenosylhomocysteinase-like 1 |
| chr6_+_136245027 | 0.05 |
ENSRNOT00000086997
|
LOC103692719
|
tRNA (adenine(58)-N(1))-methyltransferase catalytic subunit TRMT61A |
| chr16_-_25192675 | 0.05 |
ENSRNOT00000032289
|
March1
|
membrane associated ring-CH-type finger 1 |
| chr1_-_200548317 | 0.05 |
ENSRNOT00000088610
|
AABR07005806.1
|
|
| chr4_-_66336901 | 0.05 |
ENSRNOT00000035326
|
AABR07060293.1
|
|
| chr2_+_257626383 | 0.05 |
ENSRNOT00000080993
|
Zzz3
|
zinc finger, ZZ-type containing 3 |
| chr2_+_123617794 | 0.05 |
ENSRNOT00000080632
|
RGD1307100
|
similar to RIKEN cDNA D630029K19 |
| chrX_-_23246719 | 0.05 |
ENSRNOT00000085588
|
AABR07037536.1
|
|
| chr1_-_246010594 | 0.05 |
ENSRNOT00000023762
|
Rfx3
|
regulatory factor X3 |
| chr3_+_177310753 | 0.05 |
ENSRNOT00000031448
|
Myt1
|
myelin transcription factor 1 |
| chr16_+_32457521 | 0.05 |
ENSRNOT00000083579
|
Clcn3
|
chloride voltage-gated channel 3 |
| chr19_+_37852833 | 0.05 |
ENSRNOT00000006345
|
Nrn1l
|
neuritin 1-like |
| chr1_-_156296161 | 0.05 |
ENSRNOT00000025653
|
Crebzf
|
CREB/ATF bZIP transcription factor |
| chr10_-_62184874 | 0.05 |
ENSRNOT00000004229
|
Rpa1
|
replication protein A1 |
| chr8_-_84522588 | 0.05 |
ENSRNOT00000076213
|
Mlip
|
muscular LMNA-interacting protein |
| chr13_+_113691932 | 0.05 |
ENSRNOT00000084709
|
Cd34
|
CD34 molecule |
| chr7_-_118518193 | 0.05 |
ENSRNOT00000075636
|
LOC102555083
|
zinc finger protein 250-like |
| chr1_+_259958310 | 0.05 |
ENSRNOT00000019751
|
LOC103689954
|
ectonucleoside triphosphate diphosphohydrolase 1 |
| chr6_-_51297712 | 0.05 |
ENSRNOT00000082985
|
Prkar2b
|
protein kinase cAMP-dependent type 2 regulatory subunit beta |
| chr8_-_48597867 | 0.05 |
ENSRNOT00000077958
|
Nlrx1
|
NLR family member X1 |
| chr1_-_156354353 | 0.05 |
ENSRNOT00000042163
|
Sytl2
|
synaptotagmin-like 2 |
| chr3_+_80468154 | 0.05 |
ENSRNOT00000021837
|
Ckap5
|
cytoskeleton associated protein 5 |
| chr2_-_118989127 | 0.05 |
ENSRNOT00000014871
|
Gnb4
|
G protein subunit beta 4 |
| chr18_-_61788859 | 0.05 |
ENSRNOT00000034075
ENSRNOT00000034069 |
Ccbe1
|
collagen and calcium binding EGF domains 1 |
| chr2_-_35870578 | 0.05 |
ENSRNOT00000066069
|
Rnf180
|
ring finger protein 180 |
| chr11_-_88273254 | 0.05 |
ENSRNOT00000002533
|
Mapk1
|
mitogen activated protein kinase 1 |
| chr14_+_113867209 | 0.05 |
ENSRNOT00000067591
|
Ccdc88a
|
coiled coil domain containing 88A |
| chr17_-_58301260 | 0.04 |
ENSRNOT00000083331
|
Adarb2
|
adenosine deaminase, RNA-specific, B2 |
| chr2_-_196377883 | 0.04 |
ENSRNOT00000028661
|
Gabpb2
|
GA binding protein transcription factor, beta subunit 2 |
| chr8_-_116855062 | 0.04 |
ENSRNOT00000050344
|
Rnf123
|
ring finger protein 123 |
| chr1_-_212354273 | 0.04 |
ENSRNOT00000024573
|
Tubgcp2
|
tubulin, gamma complex associated protein 2 |
| chr18_+_70192493 | 0.04 |
ENSRNOT00000020472
|
Cxxc1
|
CXXC finger protein 1 |
| chr18_-_399242 | 0.04 |
ENSRNOT00000045926
|
F8
|
coagulation factor VIII |
| chr4_+_96562725 | 0.04 |
ENSRNOT00000009094
|
Ndnf
|
neuron-derived neurotrophic factor |
| chr18_-_57201740 | 0.04 |
ENSRNOT00000026227
|
Ablim3
|
actin binding LIM protein family, member 3 |
| chr12_-_43940798 | 0.04 |
ENSRNOT00000001485
|
RGD1562310
|
similar to hypothetical protein FLJ21415 |
| chrX_+_6273733 | 0.04 |
ENSRNOT00000074275
|
Ndp
|
NDP, norrin cystine knot growth factor |
| chr17_-_89881919 | 0.04 |
ENSRNOT00000090982
|
LOC100910957
|
acyl-CoA-binding domain-containing protein 5-like |
| chr14_+_100311173 | 0.04 |
ENSRNOT00000031275
|
Ppp3r1
|
protein phosphatase 3, regulatory subunit B, alpha |
| chr7_+_74350479 | 0.04 |
ENSRNOT00000089034
|
AABR07057495.1
|
|
| chr8_+_99880073 | 0.04 |
ENSRNOT00000010765
|
Plscr4
|
phospholipid scramblase 4 |
| chr3_+_152402520 | 0.04 |
ENSRNOT00000027086
|
Cnbd2
|
cyclic nucleotide binding domain containing 2 |
| chr12_+_25450286 | 0.04 |
ENSRNOT00000092956
|
Gtf2i
|
general transcription factor II I |
| chr4_+_78378313 | 0.04 |
ENSRNOT00000083891
|
Gimap5
|
GTPase, IMAP family member 5 |
| chr13_+_67611708 | 0.04 |
ENSRNOT00000063833
|
Tpr
|
translocated promoter region, nuclear basket protein |
| chr1_+_87045796 | 0.04 |
ENSRNOT00000027620
|
Lgals7
|
galectin 7 |
| chr6_-_54020406 | 0.04 |
ENSRNOT00000086038
|
Hdac9
|
histone deacetylase 9 |
| chr1_+_116604550 | 0.04 |
ENSRNOT00000083587
|
Ube3a
|
ubiquitin protein ligase E3A |
| chr14_+_17247362 | 0.04 |
ENSRNOT00000030222
|
Sdad1
|
SDA1 domain containing 1 |
| chr5_+_76748749 | 0.04 |
ENSRNOT00000022054
|
AABR07048397.1
|
|
| chr6_+_109710781 | 0.04 |
ENSRNOT00000012895
|
Ttll5
|
tubulin tyrosine ligase like 5 |
| chr10_-_67285617 | 0.04 |
ENSRNOT00000019044
|
Utp6
|
UTP6 small subunit processome component |
| chr5_-_147886615 | 0.04 |
ENSRNOT00000087556
|
Kpna6
|
karyopherin subunit alpha 6 |
| chr1_+_84758233 | 0.04 |
ENSRNOT00000072734
|
AABR07002775.1
|
|
| chr9_+_6970507 | 0.04 |
ENSRNOT00000079488
|
St6gal2
|
ST6 beta-galactoside alpha-2,6-sialyltransferase 2 |
| chr15_-_13228607 | 0.04 |
ENSRNOT00000042010
ENSRNOT00000088214 |
Ptprg
|
protein tyrosine phosphatase, receptor type, G |
| chr2_-_178521038 | 0.04 |
ENSRNOT00000033107
|
Rxfp1
|
relaxin/insulin-like family peptide receptor 1 |
| chr20_+_7767395 | 0.04 |
ENSRNOT00000084771
|
Zfp523
|
zinc finger protein 523 |
| chr2_+_127489771 | 0.04 |
ENSRNOT00000093581
|
Intu
|
inturned planar cell polarity protein |
| chr4_-_151428894 | 0.04 |
ENSRNOT00000010556
|
Adipor2
|
adiponectin receptor 2 |
| chr3_+_111826297 | 0.04 |
ENSRNOT00000081897
|
Pla2g4b
|
phospholipase A2 group IVB |
| chr1_+_199351628 | 0.04 |
ENSRNOT00000078578
|
Bckdk
|
branched chain ketoacid dehydrogenase kinase |
| chr9_-_54351339 | 0.04 |
ENSRNOT00000080522
|
Stat1
|
signal transducer and activator of transcription 1 |
| chr6_+_27887797 | 0.04 |
ENSRNOT00000015827
|
Asxl2
|
additional sex combs like 2, transcriptional regulator |
| chr5_-_19559244 | 0.04 |
ENSRNOT00000014289
ENSRNOT00000089666 |
Nsmaf
|
neutral sphingomyelinase activation associated factor |
| chr4_+_68656928 | 0.04 |
ENSRNOT00000016232
|
Tas2r108
|
taste receptor, type 2, member 108 |
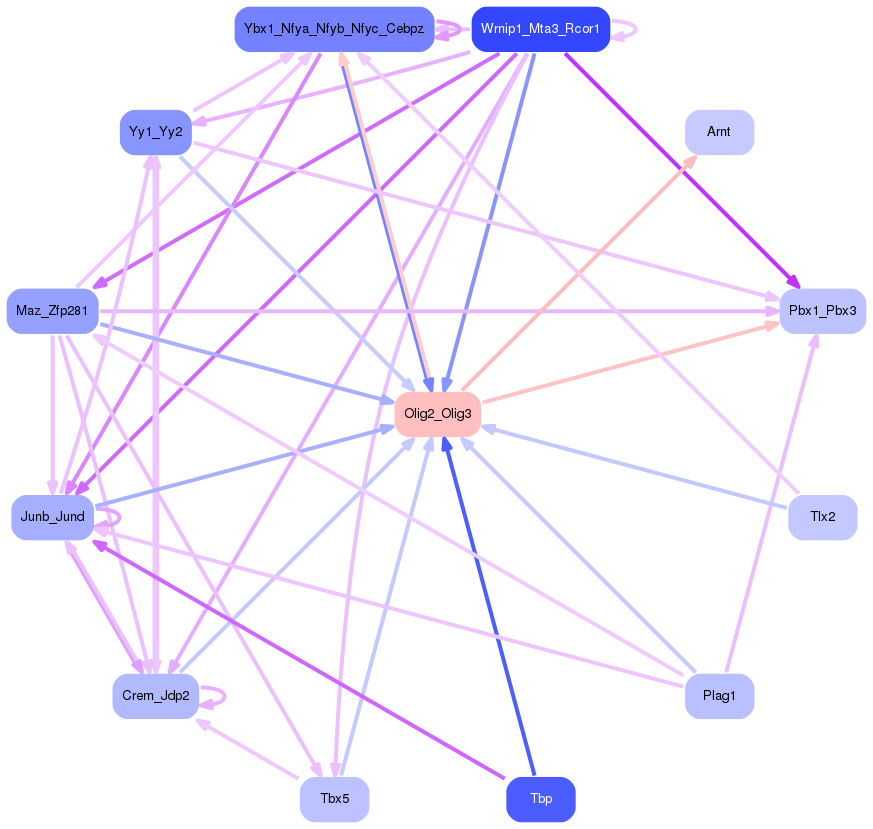
Network of associatons between targets according to the STRING database.

First level regulatory network of Olig2_Olig3
Gene Ontology Analysis
Gene overrepresentation in biological process category:
| Log-likelihood per target | Total log-likelihood | Term | Description |
|---|---|---|---|
| 0.1 | 0.4 | GO:1901581 | post-embryonic appendage morphogenesis(GO:0035120) post-embryonic limb morphogenesis(GO:0035127) post-embryonic forelimb morphogenesis(GO:0035128) telomeric repeat-containing RNA transcription(GO:0097393) telomeric repeat-containing RNA transcription from RNA pol II promoter(GO:0097394) regulation of telomeric RNA transcription from RNA pol II promoter(GO:1901580) negative regulation of telomeric RNA transcription from RNA pol II promoter(GO:1901581) positive regulation of telomeric RNA transcription from RNA pol II promoter(GO:1901582) |
| 0.1 | 0.3 | GO:0098886 | modification of dendritic spine(GO:0098886) |
| 0.1 | 0.2 | GO:1904139 | microglial cell migration(GO:1904124) regulation of microglial cell migration(GO:1904139) |
| 0.1 | 0.2 | GO:0071934 | thiamine transmembrane transport(GO:0071934) |
| 0.0 | 0.4 | GO:2000766 | negative regulation of cytoplasmic translation(GO:2000766) |
| 0.0 | 0.1 | GO:0015770 | disaccharide transport(GO:0015766) sucrose transport(GO:0015770) oligosaccharide transport(GO:0015772) |
| 0.0 | 0.2 | GO:1900377 | negative regulation of melanin biosynthetic process(GO:0048022) negative regulation of secondary metabolite biosynthetic process(GO:1900377) |
| 0.0 | 0.1 | GO:0046380 | N-acetylglucosamine biosynthetic process(GO:0006045) N-acetylneuraminate biosynthetic process(GO:0046380) |
| 0.0 | 0.1 | GO:0000350 | generation of catalytic spliceosome for second transesterification step(GO:0000350) |
| 0.0 | 0.1 | GO:0071454 | cellular response to anoxia(GO:0071454) |
| 0.0 | 0.1 | GO:0000189 | MAPK import into nucleus(GO:0000189) |
| 0.0 | 0.1 | GO:0072720 | response to dithiothreitol(GO:0072720) |
| 0.0 | 0.1 | GO:0035408 | histone H3-T6 phosphorylation(GO:0035408) |
| 0.0 | 0.1 | GO:1903373 | positive regulation of endoplasmic reticulum tubular network organization(GO:1903373) |
| 0.0 | 0.1 | GO:1990164 | histone H2A phosphorylation(GO:1990164) |
| 0.0 | 0.1 | GO:0042851 | L-alanine metabolic process(GO:0042851) |
| 0.0 | 0.0 | GO:0044467 | glial cell-derived neurotrophic factor secretion(GO:0044467) regulation of glial cell-derived neurotrophic factor secretion(GO:1900166) positive regulation of glial cell-derived neurotrophic factor secretion(GO:1900168) |
| 0.0 | 0.1 | GO:1901898 | negative regulation of relaxation of cardiac muscle(GO:1901898) |
| 0.0 | 0.1 | GO:0010808 | positive regulation of synaptic vesicle priming(GO:0010808) |
| 0.0 | 0.1 | GO:0034334 | desmosome assembly(GO:0002159) adherens junction maintenance(GO:0034334) |
| 0.0 | 0.1 | GO:1904694 | negative regulation of vascular smooth muscle contraction(GO:1904694) |
| 0.0 | 0.1 | GO:0050893 | sensory processing(GO:0050893) |
| 0.0 | 0.4 | GO:0071880 | adenylate cyclase-activating adrenergic receptor signaling pathway(GO:0071880) |
| 0.0 | 0.1 | GO:0001880 | Mullerian duct regression(GO:0001880) |
| 0.0 | 0.2 | GO:0070995 | NADPH oxidation(GO:0070995) |
| 0.0 | 0.2 | GO:0071985 | multivesicular body sorting pathway(GO:0071985) |
| 0.0 | 0.1 | GO:0090521 | glomerular visceral epithelial cell migration(GO:0090521) |
| 0.0 | 0.1 | GO:1905231 | carbohydrate export(GO:0033231) cellular response to mycotoxin(GO:0036146) daunorubicin transport(GO:0043215) response to borneol(GO:1905230) cellular response to borneol(GO:1905231) response to codeine(GO:1905233) response to quercetin(GO:1905235) drug transport across blood-brain barrier(GO:1990962) establishment of blood-retinal barrier(GO:1990963) |
| 0.0 | 0.2 | GO:0002329 | pre-B cell differentiation(GO:0002329) |
| 0.0 | 0.1 | GO:1902044 | regulation of Fas signaling pathway(GO:1902044) |
| 0.0 | 0.1 | GO:0033564 | anterior/posterior axon guidance(GO:0033564) |
| 0.0 | 0.1 | GO:0033183 | negative regulation of histone ubiquitination(GO:0033183) regulation of histone H2A K63-linked ubiquitination(GO:1901314) negative regulation of histone H2A K63-linked ubiquitination(GO:1901315) |
| 0.0 | 0.1 | GO:2000078 | glandular epithelial cell maturation(GO:0002071) positive regulation of type B pancreatic cell development(GO:2000078) |
| 0.0 | 0.1 | GO:0097401 | synaptic vesicle lumen acidification(GO:0097401) |
| 0.0 | 0.1 | GO:0042494 | detection of bacterial lipoprotein(GO:0042494) |
| 0.0 | 0.0 | GO:1901492 | positive regulation of vascular endothelial growth factor signaling pathway(GO:1900748) positive regulation of lymphangiogenesis(GO:1901492) |
| 0.0 | 0.0 | GO:1903566 | positive regulation of protein localization to cilium(GO:1903566) |
| 0.0 | 0.2 | GO:0031340 | positive regulation of vesicle fusion(GO:0031340) |
| 0.0 | 0.0 | GO:0007597 | blood coagulation, intrinsic pathway(GO:0007597) |
| 0.0 | 0.1 | GO:0070245 | positive regulation of thymocyte apoptotic process(GO:0070245) |
| 0.0 | 0.1 | GO:0014886 | transition between slow and fast fiber(GO:0014886) |
| 0.0 | 0.1 | GO:0051581 | negative regulation of neurotransmitter uptake(GO:0051581) regulation of serotonin uptake(GO:0051611) negative regulation of serotonin uptake(GO:0051612) |
| 0.0 | 0.2 | GO:0043619 | regulation of transcription from RNA polymerase II promoter in response to oxidative stress(GO:0043619) |
| 0.0 | 0.2 | GO:0061469 | regulation of type B pancreatic cell proliferation(GO:0061469) |
| 0.0 | 0.1 | GO:1903527 | positive regulation of membrane tubulation(GO:1903527) |
| 0.0 | 0.1 | GO:0098885 | modification of postsynaptic actin cytoskeleton(GO:0098885) |
| 0.0 | 0.1 | GO:0002729 | positive regulation of natural killer cell cytokine production(GO:0002729) |
| 0.0 | 0.0 | GO:0014846 | esophagus smooth muscle contraction(GO:0014846) |
| 0.0 | 0.0 | GO:0072139 | glomerular parietal epithelial cell differentiation(GO:0072139) |
| 0.0 | 0.0 | GO:0044778 | meiotic DNA integrity checkpoint(GO:0044778) |
| 0.0 | 0.2 | GO:0090161 | Golgi ribbon formation(GO:0090161) |
| 0.0 | 0.1 | GO:0034472 | snRNA 3'-end processing(GO:0034472) |
| 0.0 | 0.2 | GO:0048681 | negative regulation of axon regeneration(GO:0048681) |
Gene overrepresentation in cellular component category:
| Log-likelihood per target | Total log-likelihood | Term | Description |
|---|---|---|---|
| 0.1 | 0.4 | GO:1990707 | subtelomeric heterochromatin(GO:1990421) nuclear subtelomeric heterochromatin(GO:1990707) |
| 0.0 | 0.2 | GO:0032585 | multivesicular body membrane(GO:0032585) |
| 0.0 | 0.2 | GO:0000127 | transcription factor TFIIIC complex(GO:0000127) |
| 0.0 | 0.4 | GO:1990124 | messenger ribonucleoprotein complex(GO:1990124) |
| 0.0 | 0.1 | GO:0098871 | postsynaptic actin cytoskeleton(GO:0098871) postsynaptic cytoskeleton(GO:0099571) |
| 0.0 | 0.4 | GO:0008074 | guanylate cyclase complex, soluble(GO:0008074) |
| 0.0 | 0.0 | GO:0008275 | gamma-tubulin small complex(GO:0008275) |
| 0.0 | 0.1 | GO:0005956 | protein kinase CK2 complex(GO:0005956) |
| 0.0 | 0.1 | GO:0005587 | collagen type IV trimer(GO:0005587) network-forming collagen trimer(GO:0098642) collagen network(GO:0098645) |
| 0.0 | 0.2 | GO:0044224 | juxtaparanode region of axon(GO:0044224) |
| 0.0 | 0.0 | GO:0005592 | collagen type XI trimer(GO:0005592) |
| 0.0 | 0.1 | GO:0044305 | calyx of Held(GO:0044305) |
| 0.0 | 0.1 | GO:0042825 | TAP complex(GO:0042825) |
| 0.0 | 0.1 | GO:0032437 | cuticular plate(GO:0032437) |
| 0.0 | 0.2 | GO:0031235 | intrinsic component of the cytoplasmic side of the plasma membrane(GO:0031235) |
Gene overrepresentation in molecular function category:
| Log-likelihood per target | Total log-likelihood | Term | Description |
|---|---|---|---|
| 0.1 | 0.4 | GO:0015616 | DNA translocase activity(GO:0015616) |
| 0.1 | 0.2 | GO:0004874 | aryl hydrocarbon receptor activity(GO:0004874) |
| 0.1 | 0.2 | GO:0015563 | thiamine transmembrane transporter activity(GO:0015234) uptake transmembrane transporter activity(GO:0015563) |
| 0.0 | 0.1 | GO:0015157 | sucrose:proton symporter activity(GO:0008506) sucrose transmembrane transporter activity(GO:0008515) disaccharide transmembrane transporter activity(GO:0015154) oligosaccharide transmembrane transporter activity(GO:0015157) |
| 0.0 | 0.1 | GO:0009384 | N-acylmannosamine kinase activity(GO:0009384) |
| 0.0 | 0.1 | GO:0047635 | L-alanine:2-oxoglutarate aminotransferase activity(GO:0004021) alanine-oxo-acid transaminase activity(GO:0047635) |
| 0.0 | 0.1 | GO:0000386 | second spliceosomal transesterification activity(GO:0000386) |
| 0.0 | 0.2 | GO:0031697 | beta-1 adrenergic receptor binding(GO:0031697) |
| 0.0 | 0.2 | GO:0008420 | CTD phosphatase activity(GO:0008420) |
| 0.0 | 0.4 | GO:0000900 | translation repressor activity, nucleic acid binding(GO:0000900) |
| 0.0 | 0.1 | GO:0030144 | alpha-1,6-mannosylglycoprotein 6-beta-N-acetylglucosaminyltransferase activity(GO:0030144) |
| 0.0 | 0.2 | GO:0001609 | G-protein coupled adenosine receptor activity(GO:0001609) |
| 0.0 | 0.1 | GO:0005042 | netrin receptor activity(GO:0005042) |
| 0.0 | 0.1 | GO:0035403 | histone kinase activity (H3-T6 specific)(GO:0035403) |
| 0.0 | 0.2 | GO:0005225 | volume-sensitive anion channel activity(GO:0005225) |
| 0.0 | 0.1 | GO:0015440 | peptide-transporting ATPase activity(GO:0015440) |
| 0.0 | 0.2 | GO:0070700 | BMP receptor binding(GO:0070700) |
| 0.0 | 0.1 | GO:0001729 | ceramide kinase activity(GO:0001729) |
| 0.0 | 0.4 | GO:0004383 | guanylate cyclase activity(GO:0004383) |
| 0.0 | 0.1 | GO:0001155 | TFIIIA-class transcription factor binding(GO:0001155) |
| 0.0 | 0.1 | GO:0035184 | histone threonine kinase activity(GO:0035184) |
| 0.0 | 0.1 | GO:0090555 | phosphatidylethanolamine-translocating ATPase activity(GO:0090555) |
| 0.0 | 0.2 | GO:0004012 | phospholipid-translocating ATPase activity(GO:0004012) |
| 0.0 | 0.1 | GO:0004013 | adenosylhomocysteinase activity(GO:0004013) trialkylsulfonium hydrolase activity(GO:0016802) |
| 0.0 | 0.1 | GO:0047498 | calcium-dependent phospholipase A2 activity(GO:0047498) |
| 0.0 | 0.0 | GO:0016230 | sphingomyelin phosphodiesterase activator activity(GO:0016230) |
| 0.0 | 0.1 | GO:0071532 | GKAP/Homer scaffold activity(GO:0030160) ankyrin repeat binding(GO:0071532) |
| 0.0 | 0.0 | GO:0004937 | alpha1-adrenergic receptor activity(GO:0004937) |
| 0.0 | 0.0 | GO:0001069 | regulatory region RNA binding(GO:0001069) |
| 0.0 | 0.0 | GO:0001605 | adrenomedullin receptor activity(GO:0001605) |
| 0.0 | 0.3 | GO:0034236 | protein kinase A catalytic subunit binding(GO:0034236) |
| 0.0 | 0.1 | GO:0004653 | polypeptide N-acetylgalactosaminyltransferase activity(GO:0004653) |
| 0.0 | 0.1 | GO:0019992 | diacylglycerol binding(GO:0019992) |
| 0.0 | 0.0 | GO:0003835 | beta-galactoside alpha-2,6-sialyltransferase activity(GO:0003835) |
Gene overrepresentation in curated gene sets: canonical pathways category:
| Log-likelihood per target | Total log-likelihood | Term | Description |
|---|---|---|---|
| 0.0 | 0.4 | PID LPA4 PATHWAY | LPA4-mediated signaling events |
Gene overrepresentation in curated gene sets: REACTOME pathways category:
| Log-likelihood per target | Total log-likelihood | Term | Description |
|---|---|---|---|
| 0.0 | 0.4 | REACTOME ADENYLATE CYCLASE ACTIVATING PATHWAY | Genes involved in Adenylate cyclase activating pathway |
| 0.0 | 0.1 | REACTOME P2Y RECEPTORS | Genes involved in P2Y receptors |