Project
GSE49485: Hypoxia transcriptome sequencing of rat brain.
Navigation
Downloads
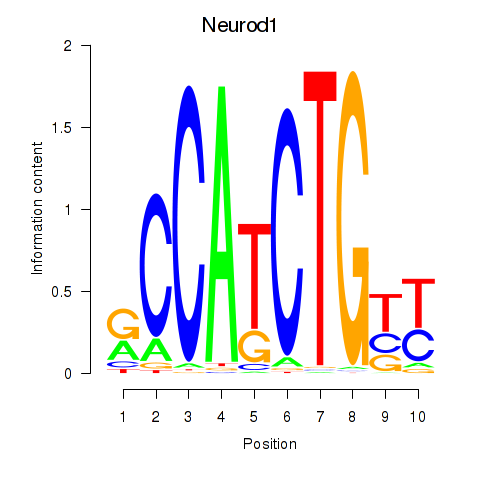
Results for Neurod1
Z-value: 0.72
Motif logo
Transcription factors associated with Neurod1
| Gene Symbol | Gene ID | Gene Info |
|---|---|---|
|
Neurod1
|
ENSRNOG00000005609 | neuronal differentiation 1 |
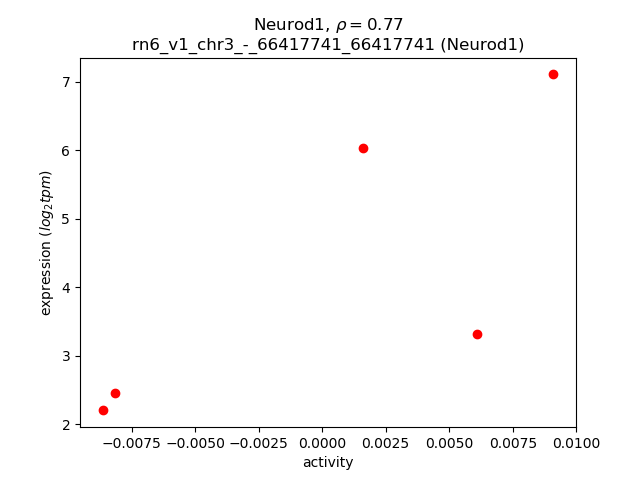
Activity-expression correlation:
| Gene | Promoter | Pearson corr. coef. | P-value | Plot |
|---|---|---|---|---|
| Neurod1 | rn6_v1_chr3_-_66417741_66417741 | 0.77 | 1.3e-01 | Click! |
Activity profile of Neurod1 motif
Sorted Z-values of Neurod1 motif
| Promoter | Log-likelihood | Transcript | Gene | Gene Info |
|---|---|---|---|---|
| chr4_+_86275717 | 0.56 |
ENSRNOT00000016414
|
Ppp1r17
|
protein phosphatase 1, regulatory subunit 17 |
| chr3_-_66417741 | 0.56 |
ENSRNOT00000007662
|
Neurod1
|
neuronal differentiation 1 |
| chr20_-_5064469 | 0.41 |
ENSRNOT00000001120
|
Ly6g6d
|
lymphocyte antigen 6 complex, locus G6D |
| chr9_+_25410669 | 0.38 |
ENSRNOT00000030912
ENSRNOT00000090920 |
Tfap2b
|
transcription factor AP-2 beta |
| chr4_-_482645 | 0.37 |
ENSRNOT00000062073
ENSRNOT00000071713 |
Cnpy1
|
canopy FGF signaling regulator 1 |
| chr10_+_74959285 | 0.29 |
ENSRNOT00000010296
|
Rnf43
|
ring finger protein 43 |
| chr4_+_6282278 | 0.29 |
ENSRNOT00000010349
|
Kmt2c
|
lysine methyltransferase 2C |
| chr20_-_27083410 | 0.25 |
ENSRNOT00000000432
|
Atoh7
|
atonal bHLH transcription factor 7 |
| chr5_-_12526962 | 0.24 |
ENSRNOT00000092104
|
St18
|
suppression of tumorigenicity 18 |
| chr4_+_84854386 | 0.22 |
ENSRNOT00000013620
|
Mturn
|
maturin, neural progenitor differentiation regulator homolog |
| chr4_+_157125998 | 0.21 |
ENSRNOT00000078349
|
C1r
|
complement C1r |
| chr5_+_90818736 | 0.21 |
ENSRNOT00000093480
ENSRNOT00000009083 |
Kdm4c
|
lysine demethylase 4C |
| chr1_+_84411726 | 0.20 |
ENSRNOT00000025303
|
Akt2
|
AKT serine/threonine kinase 2 |
| chr5_-_12563429 | 0.20 |
ENSRNOT00000059625
|
St18
|
suppression of tumorigenicity 18 |
| chr1_-_124803363 | 0.19 |
ENSRNOT00000066380
|
Klf13
|
Kruppel-like factor 13 |
| chr12_-_36398206 | 0.19 |
ENSRNOT00000090944
ENSRNOT00000058492 |
Tmem132b
|
transmembrane protein 132B |
| chr5_+_154522119 | 0.18 |
ENSRNOT00000072618
|
E2f2
|
E2F transcription factor 2 |
| chr5_-_155772040 | 0.18 |
ENSRNOT00000036788
|
Cela3b
|
chymotrypsin-like elastase family, member 3B |
| chr3_+_175144495 | 0.16 |
ENSRNOT00000082601
ENSRNOT00000088026 |
Cdh4
|
cadherin 4 |
| chr1_+_198214797 | 0.15 |
ENSRNOT00000068543
|
Tbx6
|
T-box 6 |
| chr10_+_34185898 | 0.14 |
ENSRNOT00000003339
|
Trim7
|
tripartite motif-containing 7 |
| chr3_+_11207542 | 0.14 |
ENSRNOT00000013546
|
Prrc2b
|
proline-rich coiled-coil 2B |
| chr1_+_80000165 | 0.13 |
ENSRNOT00000084912
|
Six5
|
SIX homeobox 5 |
| chr18_-_57245666 | 0.13 |
ENSRNOT00000080365
|
Ablim3
|
actin binding LIM protein family, member 3 |
| chr4_+_153217782 | 0.13 |
ENSRNOT00000015499
|
Cecr2
|
CECR2, histone acetyl-lysine reader |
| chr1_-_242765807 | 0.13 |
ENSRNOT00000020763
|
Pgm5
|
phosphoglucomutase 5 |
| chr5_+_98469047 | 0.12 |
ENSRNOT00000041374
|
Lurap1l
|
leucine rich adaptor protein 1-like |
| chr12_-_25638797 | 0.12 |
ENSRNOT00000002033
|
Gatsl2
|
GATS protein-like 2 |
| chr10_-_108196217 | 0.12 |
ENSRNOT00000075440
|
Cbx4
|
chromobox 4 |
| chr8_+_70112925 | 0.11 |
ENSRNOT00000082401
|
Megf11
|
multiple EGF-like-domains 11 |
| chr16_+_46731403 | 0.11 |
ENSRNOT00000017624
|
Tenm3
|
teneurin transmembrane protein 3 |
| chrX_-_10218583 | 0.11 |
ENSRNOT00000013382
|
Nyx
|
nyctalopin |
| chr9_+_16702460 | 0.11 |
ENSRNOT00000061432
|
Ptk7
|
protein tyrosine kinase 7 |
| chr15_-_37383277 | 0.11 |
ENSRNOT00000011711
|
Gjb2
|
gap junction protein, beta 2 |
| chr3_+_62648447 | 0.10 |
ENSRNOT00000002111
|
Agps
|
alkylglycerone phosphate synthase |
| chr2_+_102685513 | 0.10 |
ENSRNOT00000033940
|
Bhlhe22
|
basic helix-loop-helix family, member e22 |
| chr1_+_263186235 | 0.10 |
ENSRNOT00000021876
|
Cnnm1
|
cyclin and CBS domain divalent metal cation transport mediator 1 |
| chr14_+_104250617 | 0.10 |
ENSRNOT00000079874
|
Spred2
|
sprouty-related, EVH1 domain containing 2 |
| chr1_+_213451721 | 0.10 |
ENSRNOT00000045652
|
Olr315
|
olfactory receptor 315 |
| chr2_+_189629297 | 0.09 |
ENSRNOT00000049810
|
Dennd4b
|
DENN domain containing 4B |
| chr10_+_11206226 | 0.09 |
ENSRNOT00000006979
|
Tfap4
|
transcription factor AP-4 |
| chr17_-_43627629 | 0.09 |
ENSRNOT00000022965
|
Hist1h2af
|
histone cluster 1, H2af |
| chr17_-_77093308 | 0.09 |
ENSRNOT00000024110
|
Ccdc3
|
coiled-coil domain containing 3 |
| chr2_+_196594303 | 0.09 |
ENSRNOT00000064442
ENSRNOT00000044738 |
Arnt
|
aryl hydrocarbon receptor nuclear translocator |
| chrX_-_159841072 | 0.09 |
ENSRNOT00000001158
|
Arhgef6
|
Rac/Cdc42 guanine nucleotide exchange factor 6 |
| chr10_+_104451222 | 0.09 |
ENSRNOT00000088665
ENSRNOT00000071694 |
Smim5
|
small integral membrane protein 5 |
| chr7_-_119768082 | 0.08 |
ENSRNOT00000009612
|
Sstr3
|
somatostatin receptor 3 |
| chr7_+_12146642 | 0.08 |
ENSRNOT00000085899
|
Tcf3
|
transcription factor 3 |
| chr1_+_71434819 | 0.08 |
ENSRNOT00000059069
|
Zfp787
|
zinc finger protein 787 |
| chr5_-_154363329 | 0.08 |
ENSRNOT00000064596
|
Eloa
|
elongin A |
| chr16_+_20873642 | 0.08 |
ENSRNOT00000004891
|
Ddx49
|
DEAD-box helicase 49 |
| chr9_+_2190915 | 0.08 |
ENSRNOT00000077417
|
Satb1
|
SATB homeobox 1 |
| chr13_-_90443157 | 0.08 |
ENSRNOT00000006862
|
Nhlh1
|
nescient helix loop helix 1 |
| chr6_-_51018050 | 0.08 |
ENSRNOT00000082691
|
Gpr22
|
G protein-coupled receptor 22 |
| chr2_-_149088787 | 0.08 |
ENSRNOT00000064833
|
Clrn1
|
clarin 1 |
| chr19_-_34752695 | 0.08 |
ENSRNOT00000052018
|
Nr3c2
|
nuclear receptor subfamily 3, group C, member 2 |
| chr17_+_66548818 | 0.08 |
ENSRNOT00000024361
|
Anlnl1
|
anillin, actin binding protein-like 1 |
| chr14_+_80195715 | 0.08 |
ENSRNOT00000010784
|
Sh3tc1
|
SH3 domain and tetratricopeptide repeats 1 |
| chr8_-_119012671 | 0.08 |
ENSRNOT00000028435
|
Pth1r
|
parathyroid hormone 1 receptor |
| chr1_-_42467586 | 0.07 |
ENSRNOT00000029416
|
Fbxo5
|
F-box protein 5 |
| chr14_-_82287706 | 0.07 |
ENSRNOT00000080695
|
Fgfr3
|
fibroblast growth factor receptor 3 |
| chr7_-_130101858 | 0.07 |
ENSRNOT00000007954
|
Tubgcp6
|
tubulin, gamma complex associated protein 6 |
| chr2_+_113066885 | 0.07 |
ENSRNOT00000034960
|
Ghsr
|
growth hormone secretagogue receptor |
| chr11_-_90406797 | 0.07 |
ENSRNOT00000073049
|
Snai2
|
snail family transcriptional repressor 2 |
| chr12_-_21761487 | 0.07 |
ENSRNOT00000082910
|
LOC102550456
|
TSC22 domain family protein 4-like |
| chr15_+_43905099 | 0.07 |
ENSRNOT00000016568
|
Ebf2
|
early B-cell factor 2 |
| chr4_-_158704170 | 0.07 |
ENSRNOT00000082009
|
Ntf3
|
neurotrophin 3 |
| chr3_-_72171078 | 0.06 |
ENSRNOT00000009817
|
Serping1
|
serpin family G member 1 |
| chr1_+_278557792 | 0.06 |
ENSRNOT00000023414
|
Atrnl1
|
attractin like 1 |
| chrX_+_157353730 | 0.06 |
ENSRNOT00000080691
|
Haus7
|
HAUS augmin-like complex, subunit 7 |
| chr8_-_78397123 | 0.06 |
ENSRNOT00000087270
ENSRNOT00000084925 |
Tcf12
|
transcription factor 12 |
| chr15_-_86105273 | 0.06 |
ENSRNOT00000012600
ENSRNOT00000064942 |
Tbc1d4
|
TBC1 domain family, member 4 |
| chr2_-_32518643 | 0.06 |
ENSRNOT00000061032
|
Mast4
|
microtubule associated serine/threonine kinase family member 4 |
| chrX_-_123474154 | 0.06 |
ENSRNOT00000092415
ENSRNOT00000092455 |
RGD1564541
|
similar to hypothetical protein FLJ22965 |
| chr4_-_125929002 | 0.06 |
ENSRNOT00000083271
|
Magi1
|
membrane associated guanylate kinase, WW and PDZ domain containing 1 |
| chr3_+_79713567 | 0.06 |
ENSRNOT00000012110
|
C1qtnf4
|
C1q and tumor necrosis factor related protein 4 |
| chr2_+_58462949 | 0.05 |
ENSRNOT00000080618
|
Nadk2
|
NAD kinase 2, mitochondrial |
| chrX_-_15707436 | 0.05 |
ENSRNOT00000085907
|
Syp
|
synaptophysin |
| chr20_+_4392626 | 0.05 |
ENSRNOT00000000495
|
Prrt1
|
proline-rich transmembrane protein 1 |
| chr12_+_12374790 | 0.05 |
ENSRNOT00000001347
|
Tecpr1
|
tectonin beta-propeller repeat containing 1 |
| chr6_+_26537707 | 0.05 |
ENSRNOT00000050102
|
Zfp513
|
zinc finger protein 513 |
| chr7_-_107391184 | 0.05 |
ENSRNOT00000056793
|
Tmem71
|
transmembrane protein 71 |
| chr1_+_80279706 | 0.05 |
ENSRNOT00000047105
|
Ppp1r13l
|
protein phosphatase 1, regulatory subunit 13 like |
| chr6_-_10515370 | 0.05 |
ENSRNOT00000020845
|
Atp6v1e2
|
ATPase H+ transporting V1 subunit E2 |
| chr14_+_60857989 | 0.05 |
ENSRNOT00000034411
|
Ccdc149
|
coiled-coil domain containing 149 |
| chr8_-_22874637 | 0.05 |
ENSRNOT00000064551
ENSRNOT00000090424 |
Dock6
|
dedicator of cytokinesis 6 |
| chr15_+_110114148 | 0.05 |
ENSRNOT00000006264
|
Itgbl1
|
integrin subunit beta like 1 |
| chr1_+_220353356 | 0.05 |
ENSRNOT00000080189
|
Cd248
|
CD248 molecule |
| chr10_-_68517564 | 0.05 |
ENSRNOT00000086961
|
Asic2
|
acid sensing ion channel subunit 2 |
| chr1_-_193328371 | 0.05 |
ENSRNOT00000019304
ENSRNOT00000031770 ENSRNOT00000019309 |
Arhgap17
|
Rho GTPase activating protein 17 |
| chrX_+_156655960 | 0.05 |
ENSRNOT00000085723
|
Mecp2
|
methyl CpG binding protein 2 |
| chr13_-_98772968 | 0.05 |
ENSRNOT00000057735
|
Stum
|
stum, mechanosensory transduction mediator homolog |
| chr9_-_100253609 | 0.05 |
ENSRNOT00000036061
|
Kif1a
|
kinesin family member 1A |
| chr8_+_68526093 | 0.04 |
ENSRNOT00000011385
|
Aagab
|
alpha- and gamma-adaptin binding protein |
| chr5_+_64566804 | 0.04 |
ENSRNOT00000073192
|
LOC103690035
|
TGF-beta receptor type-1-like |
| chr17_+_87274944 | 0.04 |
ENSRNOT00000073718
|
Etl4
|
enhancer trap locus 4 |
| chr10_-_104659188 | 0.04 |
ENSRNOT00000010887
|
Trim47
|
tripartite motif-containing 47 |
| chr5_-_100647727 | 0.04 |
ENSRNOT00000067435
|
Nfib
|
nuclear factor I/B |
| chr7_+_71057911 | 0.04 |
ENSRNOT00000037218
|
Rdh16
|
retinol dehydrogenase 16 (all-trans) |
| chr10_+_106812739 | 0.04 |
ENSRNOT00000074225
|
Syngr2
|
synaptogyrin 2 |
| chr13_+_52662996 | 0.04 |
ENSRNOT00000047682
|
Tnnt2
|
troponin T2, cardiac type |
| chr3_-_38090526 | 0.04 |
ENSRNOT00000059430
|
Cacnb4
|
calcium voltage-gated channel auxiliary subunit beta 4 |
| chr2_-_172361779 | 0.04 |
ENSRNOT00000085876
|
Schip1
|
schwannomin interacting protein 1 |
| chr1_-_89007041 | 0.04 |
ENSRNOT00000032363
|
Proser3
|
proline and serine rich 3 |
| chr4_-_84740909 | 0.04 |
ENSRNOT00000013088
|
Scrn1
|
secernin 1 |
| chr5_+_151362019 | 0.04 |
ENSRNOT00000077083
ENSRNOT00000067801 |
Wasf2
|
WAS protein family, member 2 |
| chrX_+_159158194 | 0.04 |
ENSRNOT00000043820
ENSRNOT00000001169 ENSRNOT00000083502 |
Fhl1
|
four and a half LIM domains 1 |
| chr4_-_85915099 | 0.04 |
ENSRNOT00000016182
|
Neurod6
|
neuronal differentiation 6 |
| chr8_-_71337746 | 0.03 |
ENSRNOT00000021554
|
Zfp609
|
zinc finger protein 609 |
| chr5_-_39650894 | 0.03 |
ENSRNOT00000010421
ENSRNOT00000089522 |
Ufl1
|
Ufm1-specific ligase 1 |
| chr4_-_7252950 | 0.03 |
ENSRNOT00000084777
ENSRNOT00000087120 |
Agap3
|
ArfGAP with GTPase domain, ankyrin repeat and PH domain 3 |
| chr9_+_80118029 | 0.03 |
ENSRNOT00000023068
|
Igfbp2
|
insulin-like growth factor binding protein 2 |
| chr2_+_77868412 | 0.03 |
ENSRNOT00000065897
ENSRNOT00000014022 |
Myo10
|
myosin X |
| chr1_+_167870452 | 0.03 |
ENSRNOT00000025027
|
Olr63
|
olfactory receptor 63 |
| chr7_+_125576327 | 0.03 |
ENSRNOT00000016679
|
Prr5
|
proline rich 5 |
| chr5_-_136166786 | 0.03 |
ENSRNOT00000026201
|
Rnf220
|
ring finger protein 220 |
| chr13_+_47454591 | 0.03 |
ENSRNOT00000005791
|
LOC498222
|
similar to specifically androgen-regulated protein |
| chr14_-_23002011 | 0.03 |
ENSRNOT00000002736
|
Ythdc1
|
YTH domain containing 1 |
| chr4_+_155654911 | 0.03 |
ENSRNOT00000087883
|
Foxj2
|
forkhead box J2 |
| chr20_-_2103864 | 0.03 |
ENSRNOT00000001014
|
Rnf39
|
ring finger protein 39 |
| chr20_+_13732198 | 0.03 |
ENSRNOT00000008608
|
LOC103694877
|
macrophage migration inhibitory factor |
| chr5_-_34813116 | 0.03 |
ENSRNOT00000017479
|
Nkain3
|
Sodium/potassium transporting ATPase interacting 3 |
| chr2_+_95008477 | 0.03 |
ENSRNOT00000015327
|
Tpd52
|
tumor protein D52 |
| chr1_+_220446425 | 0.03 |
ENSRNOT00000027339
|
LOC100911932
|
endosialin-like |
| chr1_+_150310319 | 0.03 |
ENSRNOT00000042081
|
Olr34
|
olfactory receptor 34 |
| chr19_-_55510460 | 0.03 |
ENSRNOT00000019820
|
Cbfa2t3
|
CBFA2/RUNX1 translocation partner 3 |
| chr3_-_2534663 | 0.03 |
ENSRNOT00000049297
ENSRNOT00000044246 |
Grin1
|
glutamate ionotropic receptor NMDA type subunit 1 |
| chr2_-_206222248 | 0.03 |
ENSRNOT00000026075
|
Olfml3
|
olfactomedin-like 3 |
| chr14_+_44413636 | 0.03 |
ENSRNOT00000003552
|
Smim14
|
small integral membrane protein 14 |
| chr1_-_64446818 | 0.03 |
ENSRNOT00000081980
|
Myadm
|
myeloid-associated differentiation marker |
| chr3_-_2534375 | 0.02 |
ENSRNOT00000037725
|
Grin1
|
glutamate ionotropic receptor NMDA type subunit 1 |
| chr14_-_3300200 | 0.02 |
ENSRNOT00000037931
|
Btbd8
|
BTB (POZ) domain containing 8 |
| chr3_+_172195844 | 0.02 |
ENSRNOT00000034915
|
Npepl1
|
aminopeptidase-like 1 |
| chr2_+_198417619 | 0.02 |
ENSRNOT00000085945
|
Hist2h3c2
|
histone cluster 2, H3c2 |
| chr4_-_159697207 | 0.02 |
ENSRNOT00000086440
|
Ccnd2
|
cyclin D2 |
| chr18_+_60392376 | 0.02 |
ENSRNOT00000023890
|
Nedd4l
|
neural precursor cell expressed, developmentally down-regulated 4-like, E3 ubiquitin protein ligase |
| chr7_+_70980422 | 0.02 |
ENSRNOT00000077912
|
Rdh16
|
retinol dehydrogenase 16 (all-trans) |
| chr10_-_65200109 | 0.02 |
ENSRNOT00000030501
|
Nufip2
|
NUFIP2, FMR1 interacting protein 2 |
| chr3_-_177078594 | 0.02 |
ENSRNOT00000020695
|
Uckl1
|
uridine-cytidine kinase 1-like 1 |
| chr11_-_86303453 | 0.02 |
ENSRNOT00000071453
|
LOC498122
|
similar to CG15908-PA |
| chr3_-_110556808 | 0.02 |
ENSRNOT00000092158
ENSRNOT00000045362 |
RGD1565536
|
similar to hypothetical protein |
| chr14_+_36071376 | 0.02 |
ENSRNOT00000082183
|
Lnx1
|
ligand of numb-protein X 1 |
| chr20_-_2211995 | 0.02 |
ENSRNOT00000077201
|
Trim26
|
tripartite motif-containing 26 |
| chr10_+_86860685 | 0.02 |
ENSRNOT00000084644
|
Rara
|
retinoic acid receptor, alpha |
| chr3_+_161413298 | 0.02 |
ENSRNOT00000023965
ENSRNOT00000088776 |
Mmp9
|
matrix metallopeptidase 9 |
| chr2_-_211001258 | 0.02 |
ENSRNOT00000037336
|
Atxn7l2
|
ataxin 7-like 2 |
| chr9_+_16749809 | 0.02 |
ENSRNOT00000028786
|
Cul9
|
cullin 9 |
| chr4_-_132296413 | 0.02 |
ENSRNOT00000052326
|
RGD1560513
|
similar to macrophage migration inhibitory factor |
| chr5_-_40237591 | 0.02 |
ENSRNOT00000011393
|
Fut9
|
fucosyltransferase 9 |
| chr5_+_158042587 | 0.02 |
ENSRNOT00000090593
|
Tas1r2
|
taste 1 receptor member 2 |
| chr8_-_39734214 | 0.01 |
ENSRNOT00000040106
|
Slc37a2
|
solute carrier family 37 member 2 |
| chr10_+_45322248 | 0.01 |
ENSRNOT00000047268
|
Trim11
|
tripartite motif-containing 11 |
| chr10_+_90217924 | 0.01 |
ENSRNOT00000028388
|
Asb16
|
ankyrin repeat and SOCS box-containing 16 |
| chr1_+_101161252 | 0.01 |
ENSRNOT00000028064
ENSRNOT00000064184 |
Slc17a7
|
solute carrier family 17 member 7 |
| chr14_+_83412968 | 0.01 |
ENSRNOT00000024993
|
Eif4enif1
|
eukaryotic translation initiation factor 4E nuclear import factor 1 |
| chr5_+_145257714 | 0.01 |
ENSRNOT00000019214
|
Dlgap3
|
DLG associated protein 3 |
| chr5_+_64053946 | 0.01 |
ENSRNOT00000011622
|
Invs
|
inversin |
| chr1_-_125967756 | 0.01 |
ENSRNOT00000031488
|
Fam189a1
|
family with sequence similarity 189, member A1 |
| chr14_+_12218553 | 0.01 |
ENSRNOT00000003237
|
Prkg2
|
protein kinase, cGMP-dependent, type II |
| chr17_+_2690062 | 0.01 |
ENSRNOT00000024937
|
Olr1653
|
olfactory receptor 1653 |
| chr13_+_74154835 | 0.01 |
ENSRNOT00000059524
|
Abl2
|
ABL proto-oncogene 2, non-receptor tyrosine kinase |
| chr15_-_45927804 | 0.01 |
ENSRNOT00000086271
|
Ints6
|
integrator complex subunit 6 |
| chr12_-_46920952 | 0.01 |
ENSRNOT00000001532
|
Msi1
|
musashi RNA-binding protein 1 |
| chr6_-_108596446 | 0.01 |
ENSRNOT00000031331
ENSRNOT00000077458 ENSRNOT00000082792 |
Ltbp2
|
latent transforming growth factor beta binding protein 2 |
| chr3_-_2456041 | 0.01 |
ENSRNOT00000062001
|
Rnf224
|
ring finger protein 224 |
| chrX_+_128493614 | 0.01 |
ENSRNOT00000044240
|
Stag2
|
stromal antigen 2 |
| chr16_-_7412150 | 0.01 |
ENSRNOT00000047252
|
RGD1564325
|
similar to ribosomal protein S24 |
| chr7_+_13673934 | 0.01 |
ENSRNOT00000048564
|
Olr1085
|
olfactory receptor 1085 |
| chr9_+_15309127 | 0.01 |
ENSRNOT00000019177
|
Prickle4
|
prickle planar cell polarity protein 4 |
| chr11_+_87374690 | 0.01 |
ENSRNOT00000086117
|
Aifm3
|
apoptosis inducing factor, mitochondria associated 3 |
| chr16_-_20800646 | 0.01 |
ENSRNOT00000083281
|
Comp
|
cartilage oligomeric matrix protein |
| chr9_-_92524739 | 0.01 |
ENSRNOT00000089889
|
Slc16a14
|
solute carrier family 16, member 14 |
| chr15_+_39945095 | 0.01 |
ENSRNOT00000016826
|
Shisa2
|
shisa family member 2 |
| chr8_+_62925357 | 0.01 |
ENSRNOT00000011074
ENSRNOT00000090588 |
Stra6
|
stimulated by retinoic acid 6 |
| chr10_+_17542374 | 0.01 |
ENSRNOT00000064079
|
Fbxw11
|
F-box and WD repeat domain containing 11 |
| chr7_-_63578490 | 0.01 |
ENSRNOT00000007295
|
Rassf3
|
Ras association domain family member 3 |
| chr8_-_55171718 | 0.01 |
ENSRNOT00000080736
|
LOC689959
|
hypothetical protein LOC689959 |
| chr14_+_79446057 | 0.01 |
ENSRNOT00000037061
|
Tada2b
|
transcriptional adaptor 2B |
| chr6_-_27512287 | 0.01 |
ENSRNOT00000085937
ENSRNOT00000081278 ENSRNOT00000081323 |
Selenoi
|
selenoprotein I |
| chr15_+_34251606 | 0.01 |
ENSRNOT00000025725
|
Fitm1
|
fat storage-inducing transmembrane protein 1 |
| chr16_-_21380331 | 0.01 |
ENSRNOT00000015247
|
Atp13a1
|
ATPase 13A1 |
| chr7_-_2912491 | 0.00 |
ENSRNOT00000048453
|
AC128207.1
|
|
| chr5_-_100647298 | 0.00 |
ENSRNOT00000067538
ENSRNOT00000013092 |
Nfib
|
nuclear factor I/B |
| chr2_-_143104412 | 0.00 |
ENSRNOT00000058116
|
Ufm1
|
ubiquitin-fold modifier 1 |
| chr9_-_85243001 | 0.00 |
ENSRNOT00000020219
|
Scg2
|
secretogranin II |
| chr13_+_80517536 | 0.00 |
ENSRNOT00000004386
|
Myoc
|
myocilin |
| chr1_-_206282575 | 0.00 |
ENSRNOT00000024974
|
Adam12
|
ADAM metallopeptidase domain 12 |
| chr9_-_99659425 | 0.00 |
ENSRNOT00000051686
|
Olr1343
|
olfactory receptor 1343 |
| chr14_+_37116492 | 0.00 |
ENSRNOT00000002921
|
Sgcb
|
sarcoglycan, beta |
| chr2_+_212257225 | 0.00 |
ENSRNOT00000077883
|
Vav3
|
vav guanine nucleotide exchange factor 3 |
| chr13_+_99184564 | 0.00 |
ENSRNOT00000004379
|
Pycr2
|
pyrroline-5-carboxylate reductase family, member 2 |
| chr3_+_37545238 | 0.00 |
ENSRNOT00000070792
|
Tnfaip6
|
TNF alpha induced protein 6 |
| chr8_+_40258985 | 0.00 |
ENSRNOT00000044652
|
Olr1196
|
olfactory receptor 1196 |
| chr12_-_24537313 | 0.00 |
ENSRNOT00000001975
|
Baz1b
|
bromodomain adjacent to zinc finger domain, 1B |
| chr8_+_108958046 | 0.00 |
ENSRNOT00000079618
ENSRNOT00000066917 |
Stag1
|
stromal antigen 1 |
| chr7_-_15706893 | 0.00 |
ENSRNOT00000042742
|
Olr1092
|
olfactory receptor 1092 |
| chr2_-_211235440 | 0.00 |
ENSRNOT00000033015
ENSRNOT00000091896 |
Sars
|
seryl-tRNA synthetase |
| chr4_+_145238947 | 0.00 |
ENSRNOT00000067396
ENSRNOT00000091934 |
Cpne9
|
copine family member 9 |
| chr16_-_20873344 | 0.00 |
ENSRNOT00000027381
|
Cope
|
coatomer protein complex, subunit epsilon |
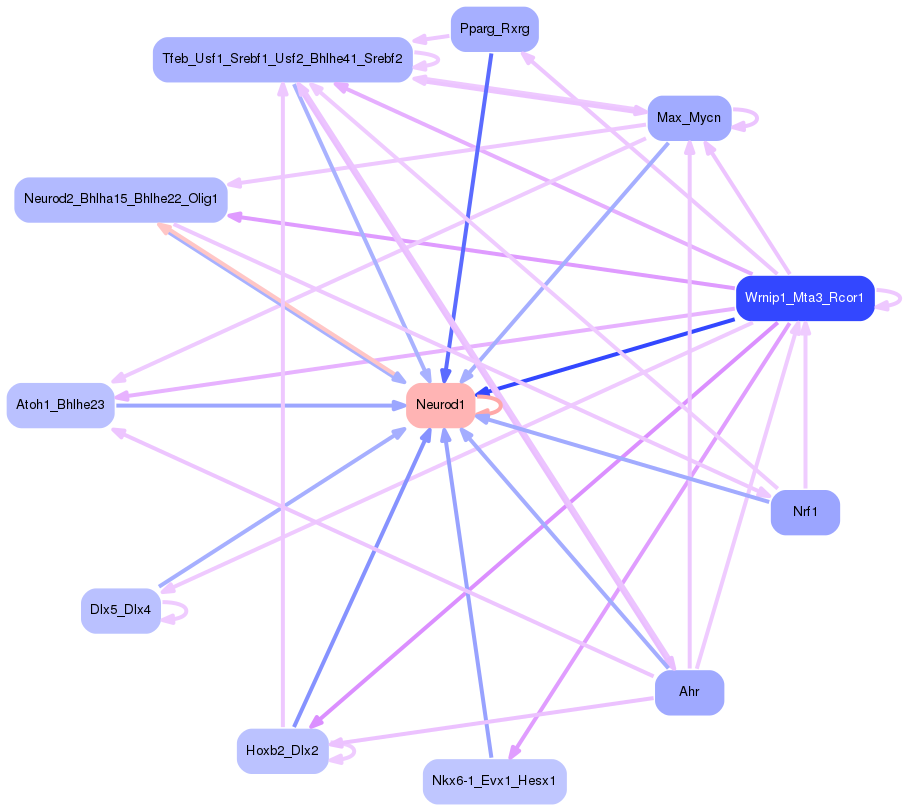
Network of associatons between targets according to the STRING database.

First level regulatory network of Neurod1
Gene Ontology Analysis
Gene overrepresentation in biological process category:
| Log-likelihood per target | Total log-likelihood | Term | Description |
|---|---|---|---|
| 0.1 | 0.6 | GO:0060729 | intestinal epithelial structure maintenance(GO:0060729) |
| 0.1 | 0.2 | GO:0009644 | response to high light intensity(GO:0009644) |
| 0.1 | 0.4 | GO:0097070 | ductus arteriosus closure(GO:0097070) |
| 0.0 | 0.2 | GO:0014043 | negative regulation of neuron maturation(GO:0014043) |
| 0.0 | 0.2 | GO:1990086 | lens fiber cell apoptotic process(GO:1990086) |
| 0.0 | 0.1 | GO:0031959 | mineralocorticoid receptor signaling pathway(GO:0031959) |
| 0.0 | 0.1 | GO:0007056 | spindle assembly involved in female meiosis(GO:0007056) |
| 0.0 | 0.0 | GO:1903860 | negative regulation of dendrite extension(GO:1903860) |
| 0.0 | 0.2 | GO:1900113 | negative regulation of histone H3-K9 trimethylation(GO:1900113) |
| 0.0 | 0.1 | GO:0043134 | hindgut contraction(GO:0043133) regulation of hindgut contraction(GO:0043134) |
| 0.0 | 0.1 | GO:1901420 | negative regulation of vitamin D receptor signaling pathway(GO:0070563) negative regulation of response to alcohol(GO:1901420) |
| 0.0 | 0.1 | GO:0021960 | anterior commissure morphogenesis(GO:0021960) |
| 0.0 | 0.1 | GO:2000474 | regulation of opioid receptor signaling pathway(GO:2000474) |
| 0.0 | 0.3 | GO:0061029 | eyelid development in camera-type eye(GO:0061029) |
| 0.0 | 0.1 | GO:0038170 | somatostatin receptor signaling pathway(GO:0038169) somatostatin signaling pathway(GO:0038170) |
| 0.0 | 0.1 | GO:1900673 | olefin metabolic process(GO:1900673) |
| 0.0 | 0.1 | GO:0007403 | glial cell fate determination(GO:0007403) |
| 0.0 | 0.1 | GO:0019388 | galactose catabolic process(GO:0019388) |
| 0.0 | 0.1 | GO:0046504 | ether lipid biosynthetic process(GO:0008611) glycerol ether biosynthetic process(GO:0046504) ether biosynthetic process(GO:1901503) |
| 0.0 | 0.1 | GO:0061144 | alveolar secondary septum development(GO:0061144) |
| 0.0 | 0.2 | GO:0021554 | optic nerve development(GO:0021554) |
| 0.0 | 0.0 | GO:0032972 | regulation of muscle filament sliding speed(GO:0032972) |
| 0.0 | 0.2 | GO:0045647 | negative regulation of erythrocyte differentiation(GO:0045647) |
| 0.0 | 0.1 | GO:0014842 | regulation of skeletal muscle satellite cell proliferation(GO:0014842) |
| 0.0 | 0.1 | GO:0032483 | regulation of Rab protein signal transduction(GO:0032483) |
| 0.0 | 0.1 | GO:0001842 | neural fold formation(GO:0001842) |
| 0.0 | 0.4 | GO:0095500 | acetylcholine receptor signaling pathway(GO:0095500) signal transduction involved in cellular response to ammonium ion(GO:1903831) response to acetylcholine(GO:1905144) cellular response to acetylcholine(GO:1905145) |
| 0.0 | 0.1 | GO:0097264 | self proteolysis(GO:0097264) |
| 0.0 | 0.1 | GO:0051418 | interphase microtubule nucleation by interphase microtubule organizing center(GO:0051415) microtubule nucleation by microtubule organizing center(GO:0051418) |
| 0.0 | 0.3 | GO:0032801 | receptor catabolic process(GO:0032801) |
| 0.0 | 0.1 | GO:2001269 | positive regulation of cysteine-type endopeptidase activity involved in apoptotic signaling pathway(GO:2001269) |
| 0.0 | 0.1 | GO:0006741 | NADP biosynthetic process(GO:0006741) |
| 0.0 | 0.1 | GO:0033152 | immunoglobulin V(D)J recombination(GO:0033152) |
Gene overrepresentation in cellular component category:
| Log-likelihood per target | Total log-likelihood | Term | Description |
|---|---|---|---|
| 0.0 | 0.1 | GO:0008274 | gamma-tubulin large complex(GO:0000931) gamma-tubulin ring complex(GO:0008274) |
| 0.0 | 0.3 | GO:0044666 | MLL3/4 complex(GO:0044666) |
| 0.0 | 0.2 | GO:0032593 | insulin-responsive compartment(GO:0032593) |
| 0.0 | 0.1 | GO:0044307 | dendritic branch(GO:0044307) |
| 0.0 | 0.1 | GO:0031010 | ISWI-type complex(GO:0031010) |
| 0.0 | 0.1 | GO:0070449 | elongin complex(GO:0070449) |
| 0.0 | 0.0 | GO:1990584 | cardiac Troponin complex(GO:1990584) |
Gene overrepresentation in molecular function category:
| Log-likelihood per target | Total log-likelihood | Term | Description |
|---|---|---|---|
| 0.1 | 0.6 | GO:0004865 | protein serine/threonine phosphatase inhibitor activity(GO:0004865) |
| 0.0 | 0.4 | GO:0030550 | acetylcholine receptor inhibitor activity(GO:0030550) |
| 0.0 | 0.1 | GO:0004874 | aryl hydrocarbon receptor activity(GO:0004874) |
| 0.0 | 0.1 | GO:0071936 | coreceptor activity involved in Wnt signaling pathway(GO:0071936) |
| 0.0 | 0.1 | GO:0004614 | phosphoglucomutase activity(GO:0004614) |
| 0.0 | 0.1 | GO:0070644 | vitamin D response element binding(GO:0070644) |
| 0.0 | 0.9 | GO:0001105 | RNA polymerase II transcription coactivator activity(GO:0001105) |
| 0.0 | 0.1 | GO:0004994 | somatostatin receptor activity(GO:0004994) |
| 0.0 | 0.0 | GO:0045322 | unmethylated CpG binding(GO:0045322) |
| 0.0 | 0.1 | GO:0005173 | stem cell factor receptor binding(GO:0005173) |
| 0.0 | 0.1 | GO:0005131 | growth hormone receptor binding(GO:0005131) |
| 0.0 | 0.3 | GO:0042800 | histone methyltransferase activity (H3-K4 specific)(GO:0042800) |
| 0.0 | 0.1 | GO:0005166 | neurotrophin p75 receptor binding(GO:0005166) |
| 0.0 | 0.0 | GO:0060002 | plus-end directed microfilament motor activity(GO:0060002) |
| 0.0 | 0.2 | GO:0032454 | histone demethylase activity (H3-K9 specific)(GO:0032454) |
| 0.0 | 0.0 | GO:0030172 | troponin C binding(GO:0030172) |
| 0.0 | 0.1 | GO:1904315 | transmitter-gated ion channel activity involved in regulation of postsynaptic membrane potential(GO:1904315) |
Gene overrepresentation in curated gene sets: canonical pathways category:
| Log-likelihood per target | Total log-likelihood | Term | Description |
|---|---|---|---|
| 0.0 | 0.2 | SA REG CASCADE OF CYCLIN EXPR | Expression of cyclins regulates progression through the cell cycle by activating cyclin-dependent kinases. |
Gene overrepresentation in curated gene sets: REACTOME pathways category:
| Log-likelihood per target | Total log-likelihood | Term | Description |
|---|---|---|---|
| 0.0 | 0.7 | REACTOME REGULATION OF GENE EXPRESSION IN BETA CELLS | Genes involved in Regulation of gene expression in beta cells |
| 0.0 | 0.2 | REACTOME CDC6 ASSOCIATION WITH THE ORC ORIGIN COMPLEX | Genes involved in CDC6 association with the ORC:origin complex |