Project
GSE49485: Hypoxia transcriptome sequencing of rat brain.
Navigation
Downloads
Results for Myf6
Z-value: 1.27
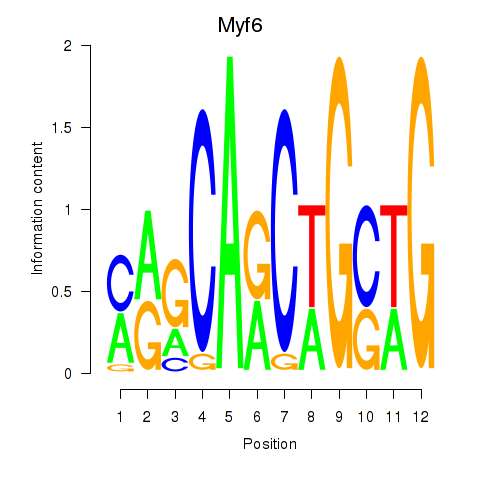
Motif logo
Transcription factors associated with Myf6
| Gene Symbol | Gene ID | Gene Info |
|---|---|---|
|
Myf6
|
ENSRNOG00000004878 | myogenic factor 6 |
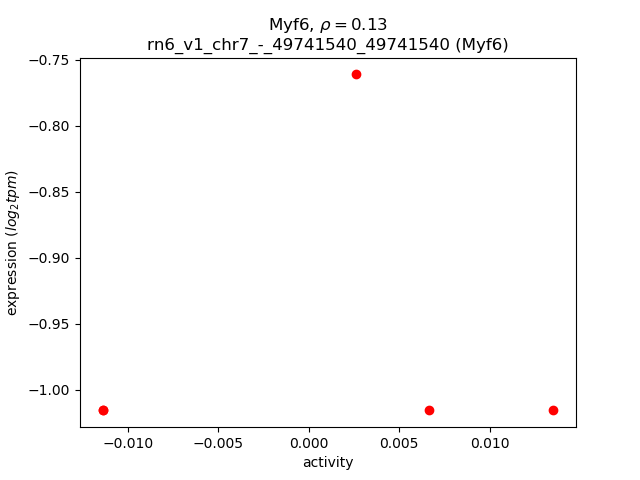
Activity-expression correlation:
| Gene | Promoter | Pearson corr. coef. | P-value | Plot |
|---|---|---|---|---|
| Myf6 | rn6_v1_chr7_-_49741540_49741540 | 0.13 | 8.3e-01 | Click! |
Activity profile of Myf6 motif
Sorted Z-values of Myf6 motif
| Promoter | Log-likelihood | Transcript | Gene | Gene Info |
|---|---|---|---|---|
| chr3_-_9037942 | 1.27 |
ENSRNOT00000036770
|
Ier5l
|
immediate early response 5-like |
| chr4_+_32373641 | 1.10 |
ENSRNOT00000076086
|
Dlx6
|
distal-less homeobox 6 |
| chr15_-_61947764 | 0.92 |
ENSRNOT00000017400
|
Cnmd
|
chondromodulin |
| chr7_-_143967484 | 0.92 |
ENSRNOT00000081758
|
Sp7
|
Sp7 transcription factor |
| chr6_-_110904288 | 0.71 |
ENSRNOT00000014645
|
Irf2bpl
|
interferon regulatory factor 2 binding protein-like |
| chr10_-_90151042 | 0.63 |
ENSRNOT00000055187
|
Hdac5
|
histone deacetylase 5 |
| chr2_-_260596777 | 0.61 |
ENSRNOT00000009370
|
Lhx8
|
LIM homeobox 8 |
| chr20_+_8165307 | 0.55 |
ENSRNOT00000000637
|
Pim1
|
Pim-1 proto-oncogene, serine/threonine kinase |
| chr15_+_50891127 | 0.55 |
ENSRNOT00000020728
|
Stc1
|
stanniocalcin 1 |
| chr15_-_34198921 | 0.47 |
ENSRNOT00000024991
|
Nrl
|
neural retina leucine zipper |
| chr3_-_58181971 | 0.43 |
ENSRNOT00000002076
|
Dlx2
|
distal-less homeobox 2 |
| chr3_+_13838304 | 0.41 |
ENSRNOT00000025067
|
Hspa5
|
heat shock protein family A member 5 |
| chr11_+_33909439 | 0.38 |
ENSRNOT00000002310
|
Cbr3
|
carbonyl reductase 3 |
| chr18_-_29015552 | 0.38 |
ENSRNOT00000028713
|
Nrg2
|
neuregulin 2 |
| chr12_+_19714324 | 0.37 |
ENSRNOT00000072303
|
RGD1559588
|
similar to cell surface receptor FDFACT |
| chr1_-_82610350 | 0.34 |
ENSRNOT00000028177
|
Cyp2s1
|
cytochrome P450, family 2, subfamily s, polypeptide 1 |
| chr2_+_210381829 | 0.34 |
ENSRNOT00000024611
|
Alx3
|
ALX homeobox 3 |
| chr11_+_33845463 | 0.34 |
ENSRNOT00000041838
|
Cbr1
|
carbonyl reductase 1 |
| chr5_+_128865389 | 0.33 |
ENSRNOT00000068697
|
Calr4
|
calreticulin 4 |
| chr12_-_40227297 | 0.33 |
ENSRNOT00000030600
|
Fam109a
|
family with sequence similarity 109, member A |
| chr17_+_4846789 | 0.32 |
ENSRNOT00000073271
|
Gas1
|
growth arrest-specific 1 |
| chr19_-_25288335 | 0.32 |
ENSRNOT00000050214
|
Nanos3
|
nanos C2HC-type zinc finger 3 |
| chr11_+_33812989 | 0.31 |
ENSRNOT00000042283
ENSRNOT00000075985 |
Cbr1
|
carbonyl reductase 1 |
| chr17_-_89163113 | 0.31 |
ENSRNOT00000050445
|
LOC100360843
|
ribosomal protein S19-like |
| chr2_-_192697800 | 0.30 |
ENSRNOT00000066614
|
NEWGENE_2324572
|
small proline rich protein 4 |
| chr12_+_22153983 | 0.29 |
ENSRNOT00000080775
ENSRNOT00000001894 |
Pcolce
|
procollagen C-endopeptidase enhancer |
| chr1_-_261446570 | 0.28 |
ENSRNOT00000020182
|
Sfrp5
|
secreted frizzled-related protein 5 |
| chr18_+_32594958 | 0.26 |
ENSRNOT00000018511
|
Spry4
|
sprouty RTK signaling antagonist 4 |
| chr5_+_98469047 | 0.26 |
ENSRNOT00000041374
|
Lurap1l
|
leucine rich adaptor protein 1-like |
| chr10_+_90550147 | 0.26 |
ENSRNOT00000032944
|
Fzd2
|
frizzled class receptor 2 |
| chr12_+_22165486 | 0.25 |
ENSRNOT00000001890
|
Mospd3
|
motile sperm domain containing 3 |
| chr6_-_27190126 | 0.25 |
ENSRNOT00000068412
ENSRNOT00000013107 |
Kcnk3
|
potassium two pore domain channel subfamily K member 3 |
| chr1_+_7305658 | 0.25 |
ENSRNOT00000056227
|
AABR07000261.1
|
|
| chr2_+_187344056 | 0.24 |
ENSRNOT00000025314
|
Nes
|
nestin |
| chr4_-_132171153 | 0.24 |
ENSRNOT00000015058
ENSRNOT00000015075 |
Prok2
|
prokineticin 2 |
| chr10_+_55940533 | 0.24 |
ENSRNOT00000012061
|
RGD1563441
|
similar to RIKEN cDNA A030009H04 |
| chr7_+_129812789 | 0.24 |
ENSRNOT00000006357
|
Creld2
|
cysteine-rich with EGF-like domains 2 |
| chr10_+_105393072 | 0.23 |
ENSRNOT00000013359
|
Ubald2
|
UBA-like domain containing 2 |
| chr5_-_17061837 | 0.23 |
ENSRNOT00000011892
|
Penk
|
proenkephalin |
| chr1_+_101783621 | 0.23 |
ENSRNOT00000067679
|
Lmtk3
|
lemur tyrosine kinase 3 |
| chr1_+_8933831 | 0.23 |
ENSRNOT00000076049
ENSRNOT00000016215 |
Nmbr
|
neuromedin B receptor |
| chr17_+_85500113 | 0.22 |
ENSRNOT00000091937
|
AABR07028768.1
|
|
| chr9_+_49479023 | 0.22 |
ENSRNOT00000050922
ENSRNOT00000077111 |
Pou3f3
|
POU class 3 homeobox 3 |
| chr16_+_83522162 | 0.22 |
ENSRNOT00000057386
|
Col4a1
|
collagen type IV alpha 1 chain |
| chr4_-_119889949 | 0.22 |
ENSRNOT00000033687
|
H1fx
|
H1 histone family, member X |
| chr4_-_64330996 | 0.22 |
ENSRNOT00000016088
|
Ptn
|
pleiotrophin |
| chr9_+_82120059 | 0.22 |
ENSRNOT00000057368
|
Cdk5r2
|
cyclin-dependent kinase 5 regulatory subunit 2 |
| chr10_-_106976040 | 0.21 |
ENSRNOT00000003940
|
Socs3
|
suppressor of cytokine signaling 3 |
| chr20_-_3739968 | 0.21 |
ENSRNOT00000074049
ENSRNOT00000084918 |
Cchcr1
|
coiled-coil alpha-helical rod protein 1 |
| chr13_+_85818427 | 0.21 |
ENSRNOT00000077227
ENSRNOT00000006117 |
Rxrg
|
retinoid X receptor gamma |
| chr6_+_137997335 | 0.21 |
ENSRNOT00000006872
|
Tmem121
|
transmembrane protein 121 |
| chr9_-_82699551 | 0.21 |
ENSRNOT00000020673
|
Obsl1
|
obscurin-like 1 |
| chr11_+_31428358 | 0.20 |
ENSRNOT00000002827
|
Olig1
|
oligodendrocyte transcription factor 1 |
| chr6_-_45669148 | 0.20 |
ENSRNOT00000010092
|
Rsad2
|
radical S-adenosyl methionine domain containing 2 |
| chr1_-_226501920 | 0.20 |
ENSRNOT00000050716
|
Lrrc10b
|
leucine rich repeat containing 10B |
| chr6_-_131926272 | 0.20 |
ENSRNOT00000084057
ENSRNOT00000088421 |
Bcl11b
|
B-cell CLL/lymphoma 11B |
| chr4_-_77489535 | 0.20 |
ENSRNOT00000008728
|
Pdia4
|
protein disulfide isomerase family A, member 4 |
| chr5_+_145079803 | 0.20 |
ENSRNOT00000084202
|
Sfpq
|
splicing factor proline and glutamine rich |
| chr16_-_20860767 | 0.20 |
ENSRNOT00000027275
ENSRNOT00000092417 |
Gdf1
Cers1
|
growth differentiation factor 1 ceramide synthase 1 |
| chr3_+_151285249 | 0.19 |
ENSRNOT00000055254
|
Procr
|
protein C receptor |
| chr1_+_101178104 | 0.19 |
ENSRNOT00000028072
|
Pth2
|
parathyroid hormone 2 |
| chr1_-_88111293 | 0.19 |
ENSRNOT00000077195
|
Spred3
|
sprouty-related, EVH1 domain containing 3 |
| chr2_-_188672226 | 0.19 |
ENSRNOT00000027970
ENSRNOT00000050868 |
Adam15
|
ADAM metallopeptidase domain 15 |
| chr9_+_81644975 | 0.18 |
ENSRNOT00000057480
|
Catip
|
ciliogenesis associated TTC17 interacting protein |
| chrX_-_14890606 | 0.18 |
ENSRNOT00000049864
|
RGD1560784
|
similar to RIKEN cDNA B630019K06 |
| chr17_+_76079720 | 0.18 |
ENSRNOT00000073933
|
Proser2
|
proline and serine rich 2 |
| chr9_+_94279155 | 0.18 |
ENSRNOT00000065805
|
Prss56
|
protease, serine, 56 |
| chr20_+_5351605 | 0.18 |
ENSRNOT00000089306
ENSRNOT00000041590 ENSRNOT00000081240 ENSRNOT00000082538 |
RT1-A1
|
RT1 class Ia, locus A1 |
| chr4_-_117490721 | 0.17 |
ENSRNOT00000021103
|
Nat8f3
|
N-acetyltransferase 8 (GCN5-related) family member 3 |
| chr6_+_132246602 | 0.17 |
ENSRNOT00000009896
|
Cyp46a1
|
cytochrome P450, family 46, subfamily a, polypeptide 1 |
| chr9_-_15214596 | 0.17 |
ENSRNOT00000039102
|
Tfeb
|
transcription factor EB |
| chr17_+_49322205 | 0.17 |
ENSRNOT00000017713
|
Pou6f2
|
POU domain, class 6, transcription factor 2 |
| chr12_+_25119355 | 0.17 |
ENSRNOT00000034629
|
Lat2
|
linker for activation of T cells family, member 2 |
| chr18_+_27657628 | 0.17 |
ENSRNOT00000026303
|
Egr1
|
early growth response 1 |
| chr17_-_9791781 | 0.16 |
ENSRNOT00000090536
|
Rgs14
|
regulator of G-protein signaling 14 |
| chr6_+_1657331 | 0.16 |
ENSRNOT00000049672
ENSRNOT00000079864 |
Qpct
|
glutaminyl-peptide cyclotransferase |
| chr7_-_58587787 | 0.16 |
ENSRNOT00000005814
|
Lgr5
|
leucine rich repeat containing G protein coupled receptor 5 |
| chr1_-_31122093 | 0.16 |
ENSRNOT00000016712
|
NEWGENE_1307525
|
SOGA family member 3 |
| chr14_-_80973456 | 0.16 |
ENSRNOT00000013257
|
Hgfac
|
HGF activator |
| chr6_+_98284170 | 0.16 |
ENSRNOT00000031979
|
Rhoj
|
ras homolog family member J |
| chr1_-_220883062 | 0.16 |
ENSRNOT00000084065
|
LOC102551929
|
melanoma-associated antigen G1-like |
| chr4_+_157374318 | 0.16 |
ENSRNOT00000071027
|
AC115420.2
|
|
| chr8_-_108261021 | 0.16 |
ENSRNOT00000040710
|
LOC100912210
|
40S ribosomal protein S25-like |
| chr3_-_147865393 | 0.16 |
ENSRNOT00000009852
|
Sox12
|
SRY box 12 |
| chr13_-_55878094 | 0.16 |
ENSRNOT00000014218
|
Lhx9
|
LIM homeobox 9 |
| chr15_-_14622587 | 0.16 |
ENSRNOT00000086502
|
Synpr
|
synaptoporin |
| chr1_-_47307488 | 0.16 |
ENSRNOT00000090033
|
Ezr
|
ezrin |
| chr6_+_108820774 | 0.16 |
ENSRNOT00000089683
ENSRNOT00000080038 ENSRNOT00000006492 |
Ylpm1
|
YLP motif containing 1 |
| chr4_-_64831473 | 0.16 |
ENSRNOT00000033268
|
Dgki
|
diacylglycerol kinase, iota |
| chr11_-_87449940 | 0.16 |
ENSRNOT00000002560
|
Slc7a4
|
solute carrier family 7, member 4 |
| chr8_+_115511974 | 0.16 |
ENSRNOT00000067683
|
Timm8a1
|
translocase of inner mitochondrial membrane 8 homolog A1 (yeast) |
| chr5_-_153625869 | 0.16 |
ENSRNOT00000024464
|
Clic4
|
chloride intracellular channel 4 |
| chr8_+_49676540 | 0.15 |
ENSRNOT00000022032
ENSRNOT00000082205 |
Fxyd6
|
FXYD domain-containing ion transport regulator 6 |
| chr12_-_22126350 | 0.15 |
ENSRNOT00000076328
|
Sap25
|
Sin3A-associated protein 25 |
| chr9_+_9721105 | 0.15 |
ENSRNOT00000073042
ENSRNOT00000075494 |
C3
|
complement C3 |
| chr10_-_56429748 | 0.15 |
ENSRNOT00000020675
ENSRNOT00000092704 |
Spem1
|
spermatid maturation 1 |
| chr1_+_85213652 | 0.15 |
ENSRNOT00000092044
|
Nccrp1
|
non-specific cytotoxic cell receptor protein 1 homolog (zebrafish) |
| chr11_+_78029038 | 0.15 |
ENSRNOT00000089540
|
P3h2
|
prolyl 3-hydroxylase 2 |
| chr20_+_42966140 | 0.14 |
ENSRNOT00000000707
|
Marcks
|
myristoylated alanine rich protein kinase C substrate |
| chr1_-_88690534 | 0.14 |
ENSRNOT00000072570
|
Ovol3
|
ovo-like zinc finger 3 |
| chrX_-_124516705 | 0.14 |
ENSRNOT00000061493
|
LOC108348144
|
NADH dehydrogenase [ubiquinone] 1 alpha subcomplex subunit 1 |
| chr13_-_37287458 | 0.14 |
ENSRNOT00000003391
|
Insig2
|
insulin induced gene 2 |
| chr10_-_108196217 | 0.14 |
ENSRNOT00000075440
|
Cbx4
|
chromobox 4 |
| chr19_+_57484634 | 0.14 |
ENSRNOT00000025695
|
Arv1
|
ARV1 homolog, fatty acid homeostasis modulator |
| chr4_-_181477281 | 0.14 |
ENSRNOT00000055463
|
Mansc4
|
MANSC domain containing 4 |
| chr13_+_85110098 | 0.14 |
ENSRNOT00000087368
|
Fam78b
|
family with sequence similarity 78, member B |
| chr5_-_36683356 | 0.14 |
ENSRNOT00000009043
|
Pou3f2
|
POU class 3 homeobox 2 |
| chr1_+_101214593 | 0.14 |
ENSRNOT00000028086
|
Tead2
|
TEA domain transcription factor 2 |
| chr17_+_9639330 | 0.14 |
ENSRNOT00000018232
|
Dok3
|
docking protein 3 |
| chr2_-_188645196 | 0.14 |
ENSRNOT00000083793
|
Efna3
|
ephrin A3 |
| chr19_+_25391700 | 0.14 |
ENSRNOT00000011163
|
LOC100359539
|
ribonucleotide reductase M2 polypeptide |
| chr3_+_160231914 | 0.14 |
ENSRNOT00000014411
|
Kcnk15
|
potassium two pore domain channel subfamily K member 15 |
| chr8_+_107106982 | 0.13 |
ENSRNOT00000072574
|
LOC684395
|
hypothetical protein LOC684395 |
| chr4_+_96562725 | 0.13 |
ENSRNOT00000009094
|
Ndnf
|
neuron-derived neurotrophic factor |
| chr1_+_101412736 | 0.13 |
ENSRNOT00000067468
|
Lhb
|
luteinizing hormone beta polypeptide |
| chr19_+_26142720 | 0.13 |
ENSRNOT00000005270
|
RGD1564093
|
similar to RIKEN cDNA 2310036O22 |
| chr6_+_26602144 | 0.13 |
ENSRNOT00000008037
|
Ucn
|
urocortin |
| chr12_-_42492526 | 0.13 |
ENSRNOT00000084018
|
Tbx3
|
T-box 3 |
| chr20_-_4677506 | 0.13 |
ENSRNOT00000061297
|
RT1-CE6
|
RT1 class I, locus CE6 |
| chr2_+_23385183 | 0.13 |
ENSRNOT00000014860
|
Arsb
|
arylsulfatase B |
| chr10_+_45289741 | 0.13 |
ENSRNOT00000066190
|
Hist3h2ba
|
histone cluster 3, H2ba |
| chrX_+_62366453 | 0.13 |
ENSRNOT00000089828
|
Arx
|
aristaless related homeobox |
| chr16_-_48437223 | 0.13 |
ENSRNOT00000013005
ENSRNOT00000059401 |
Enpp6
|
ectonucleotide pyrophosphatase/phosphodiesterase 6 |
| chr4_-_178168690 | 0.13 |
ENSRNOT00000020729
|
Sox5
|
SRY box 5 |
| chr20_-_5533448 | 0.13 |
ENSRNOT00000000568
|
Cuta
|
cutA divalent cation tolerance homolog |
| chr20_-_4792450 | 0.13 |
ENSRNOT00000091344
|
RT1-CE6
|
RT1 class I, locus CE6 |
| chr20_-_5533600 | 0.13 |
ENSRNOT00000072319
|
Cuta
|
cutA divalent cation tolerance homolog |
| chr10_-_14022452 | 0.13 |
ENSRNOT00000016554
|
Npw
|
neuropeptide W |
| chr8_+_130401470 | 0.13 |
ENSRNOT00000043346
|
Zbtb47
|
zinc finger and BTB domain containing 47 |
| chr5_-_155258392 | 0.13 |
ENSRNOT00000017065
|
C1qc
|
complement C1q C chain |
| chrX_+_88298266 | 0.12 |
ENSRNOT00000041508
|
AABR07039936.1
|
|
| chrX_-_38196060 | 0.12 |
ENSRNOT00000006741
ENSRNOT00000006438 |
Sh3kbp1
|
SH3 domain-containing kinase-binding protein 1 |
| chrX_-_106607352 | 0.12 |
ENSRNOT00000082858
|
AABR07040624.1
|
|
| chr13_-_112099336 | 0.12 |
ENSRNOT00000009158
ENSRNOT00000044161 |
Camk1g
|
calcium/calmodulin-dependent protein kinase IG |
| chr19_-_53754602 | 0.12 |
ENSRNOT00000035651
|
Fam92b
|
family with sequence similarity 92, member B |
| chr20_-_4792283 | 0.12 |
ENSRNOT00000061027
|
RT1-CE1
|
RT1 class I, locus1 |
| chr4_+_55715744 | 0.12 |
ENSRNOT00000010429
|
Arf5
|
ADP-ribosylation factor 5 |
| chr1_-_218920094 | 0.12 |
ENSRNOT00000022213
|
Lrp5
|
LDL receptor related protein 5 |
| chr2_+_188844073 | 0.12 |
ENSRNOT00000028117
|
Kcnn3
|
potassium calcium-activated channel subfamily N member 3 |
| chr7_+_93376277 | 0.12 |
ENSRNOT00000017602
|
LOC100359763
|
ribosomal protein S25-like |
| chr8_+_48472824 | 0.12 |
ENSRNOT00000010463
ENSRNOT00000090780 |
Mcam
|
melanoma cell adhesion molecule |
| chr9_-_78969013 | 0.12 |
ENSRNOT00000019772
ENSRNOT00000057585 |
Fn1
|
fibronectin 1 |
| chr1_-_218100272 | 0.11 |
ENSRNOT00000028411
ENSRNOT00000088588 |
Ccnd1
|
cyclin D1 |
| chr1_-_220096319 | 0.11 |
ENSRNOT00000091787
ENSRNOT00000073983 |
Ccs
|
copper chaperone for superoxide dismutase |
| chr18_+_56071478 | 0.11 |
ENSRNOT00000025344
ENSRNOT00000025354 |
Cd74
|
CD74 molecule |
| chr7_+_123168811 | 0.11 |
ENSRNOT00000007091
|
Csdc2
|
cold shock domain containing C2 |
| chr10_+_93520132 | 0.11 |
ENSRNOT00000055137
|
Mrc2
|
mannose receptor, C type 2 |
| chr8_-_22874637 | 0.11 |
ENSRNOT00000064551
ENSRNOT00000090424 |
Dock6
|
dedicator of cytokinesis 6 |
| chr2_-_250235435 | 0.11 |
ENSRNOT00000088618
|
Lmo4
|
LIM domain only 4 |
| chr1_+_220416018 | 0.11 |
ENSRNOT00000027233
|
B4gat1
|
beta-1,4-glucuronyltransferase 1 |
| chr10_+_31561895 | 0.11 |
ENSRNOT00000048485
|
Havcr2
|
hepatitis A virus cellular receptor 2 |
| chr5_-_155381732 | 0.11 |
ENSRNOT00000033670
|
Zbtb40
|
zinc finger and BTB domain containing 40 |
| chr14_-_84170301 | 0.11 |
ENSRNOT00000080413
|
Slc35e4
|
solute carrier family 35, member E4 |
| chr12_+_47218969 | 0.11 |
ENSRNOT00000081343
ENSRNOT00000038395 |
Unc119b
|
unc-119 lipid binding chaperone B |
| chr2_-_250241590 | 0.10 |
ENSRNOT00000077221
ENSRNOT00000067502 |
Lmo4
|
LIM domain only 4 |
| chr14_-_34218961 | 0.10 |
ENSRNOT00000072588
|
LOC686911
|
similar to Exocyst complex component 1 (Exocyst complex component Sec3) |
| chr7_+_145117951 | 0.10 |
ENSRNOT00000055272
|
Pde1b
|
phosphodiesterase 1B |
| chr9_+_81644355 | 0.10 |
ENSRNOT00000071700
|
Catip
|
ciliogenesis associated TTC17 interacting protein |
| chr9_-_79898912 | 0.10 |
ENSRNOT00000022076
|
March4
|
membrane associated ring-CH-type finger 4 |
| chr19_+_10731855 | 0.10 |
ENSRNOT00000022277
|
Pllp
|
plasmolipin |
| chr2_+_192538899 | 0.10 |
ENSRNOT00000045691
ENSRNOT00000085931 |
LOC102550416
|
small proline-rich protein 2I-like |
| chr1_-_78851719 | 0.10 |
ENSRNOT00000022603
|
Calm2
|
calmodulin 2 |
| chr2_+_198772937 | 0.10 |
ENSRNOT00000028812
|
Itga10
|
integrin subunit alpha 10 |
| chr20_-_28814636 | 0.10 |
ENSRNOT00000086030
|
Sept10
|
septin 10 |
| chr1_+_21525421 | 0.10 |
ENSRNOT00000017911
|
Arg1
|
arginase 1 |
| chr7_-_134560713 | 0.10 |
ENSRNOT00000006621
|
Yaf2
|
YY1 associated factor 2 |
| chr7_+_14559878 | 0.10 |
ENSRNOT00000007428
|
Cyp4f5
|
cytochrome P450, family 4, subfamily f, polypeptide 5 |
| chr15_+_52451161 | 0.10 |
ENSRNOT00000018725
|
Dok2
|
docking protein 2 |
| chr9_+_98313632 | 0.10 |
ENSRNOT00000027012
|
Ramp1
|
receptor activity modifying protein 1 |
| chr6_+_10912383 | 0.10 |
ENSRNOT00000061747
ENSRNOT00000086247 |
Ttc7a
|
tetratricopeptide repeat domain 7A |
| chr1_+_261389804 | 0.10 |
ENSRNOT00000064160
|
Marveld1
|
MARVEL domain containing 1 |
| chr1_+_79981355 | 0.10 |
ENSRNOT00000020134
|
Dmwd
|
dystrophia myotonica, WD repeat containing |
| chr15_-_33725188 | 0.09 |
ENSRNOT00000083941
|
Zfhx2
|
zinc finger homeobox 2 |
| chr9_-_82461903 | 0.09 |
ENSRNOT00000026654
|
Ptprn
|
protein tyrosine phosphatase, receptor type, N |
| chr18_+_83777665 | 0.09 |
ENSRNOT00000018682
|
Cbln2
|
cerebellin 2 precursor |
| chr4_-_83137527 | 0.09 |
ENSRNOT00000039580
|
Jazf1
|
JAZF zinc finger 1 |
| chr2_-_183031214 | 0.09 |
ENSRNOT00000013260
|
LOC679811
|
similar to RIKEN cDNA D930015E06 |
| chr8_+_118333706 | 0.09 |
ENSRNOT00000028278
|
Cspg5
|
chondroitin sulfate proteoglycan 5 |
| chr17_+_13670520 | 0.09 |
ENSRNOT00000019442
|
Shc3
|
SHC adaptor protein 3 |
| chr1_-_210739600 | 0.09 |
ENSRNOT00000031734
|
Tcerg1l
|
transcription elongation regulator 1-like |
| chr13_+_63526486 | 0.09 |
ENSRNOT00000003788
|
Brinp3
|
BMP/retinoic acid inducible neural specific 3 |
| chr2_-_219262901 | 0.09 |
ENSRNOT00000037068
|
Gpr88
|
G-protein coupled receptor 88 |
| chr8_+_117780891 | 0.09 |
ENSRNOT00000077236
|
Shisa5
|
shisa family member 5 |
| chr1_+_226897625 | 0.09 |
ENSRNOT00000029443
|
Slc15a3
|
solute carrier family 15 member 3 |
| chr17_-_54714914 | 0.09 |
ENSRNOT00000024336
|
Zeb1
|
zinc finger E-box binding homeobox 1 |
| chr9_+_80118029 | 0.09 |
ENSRNOT00000023068
|
Igfbp2
|
insulin-like growth factor binding protein 2 |
| chr1_-_101131012 | 0.09 |
ENSRNOT00000082283
ENSRNOT00000093498 ENSRNOT00000093559 |
Flt3lg
Rpl13a
|
fms-related tyrosine kinase 3 ligand ribosomal protein L13A |
| chr19_-_43596801 | 0.09 |
ENSRNOT00000025625
|
Fa2h
|
fatty acid 2-hydroxylase |
| chr8_+_119135013 | 0.09 |
ENSRNOT00000056114
|
Prss50
|
protease, serine, 50 |
| chr1_-_222177421 | 0.09 |
ENSRNOT00000078393
|
Esrra
|
estrogen related receptor, alpha |
| chr13_-_97282299 | 0.09 |
ENSRNOT00000004244
|
Mixl1
|
Mix paired-like homeobox 1 |
| chr4_-_170620703 | 0.09 |
ENSRNOT00000011930
|
Plbd1
|
phospholipase B domain containing 1 |
| chr2_-_250232295 | 0.08 |
ENSRNOT00000082132
|
Lmo4
|
LIM domain only 4 |
| chr1_-_265420503 | 0.08 |
ENSRNOT00000072223
|
Fbxw4
|
F-box and WD repeat domain containing 4 |
| chr2_-_94730308 | 0.08 |
ENSRNOT00000081553
|
Zbtb10
|
zinc finger and BTB domain containing 10 |
| chr11_-_83546674 | 0.08 |
ENSRNOT00000044896
|
Ephb3
|
Eph receptor B3 |
| chr6_-_65319527 | 0.08 |
ENSRNOT00000005618
|
Stxbp6
|
syntaxin binding protein 6 |
| chr3_+_175144495 | 0.08 |
ENSRNOT00000082601
ENSRNOT00000088026 |
Cdh4
|
cadherin 4 |
| chr7_-_119996824 | 0.08 |
ENSRNOT00000011079
|
Mfng
|
MFNG O-fucosylpeptide 3-beta-N-acetylglucosaminyltransferase |
| chr7_-_140401686 | 0.08 |
ENSRNOT00000083955
|
Fkbp11
|
FK506 binding protein 11 |
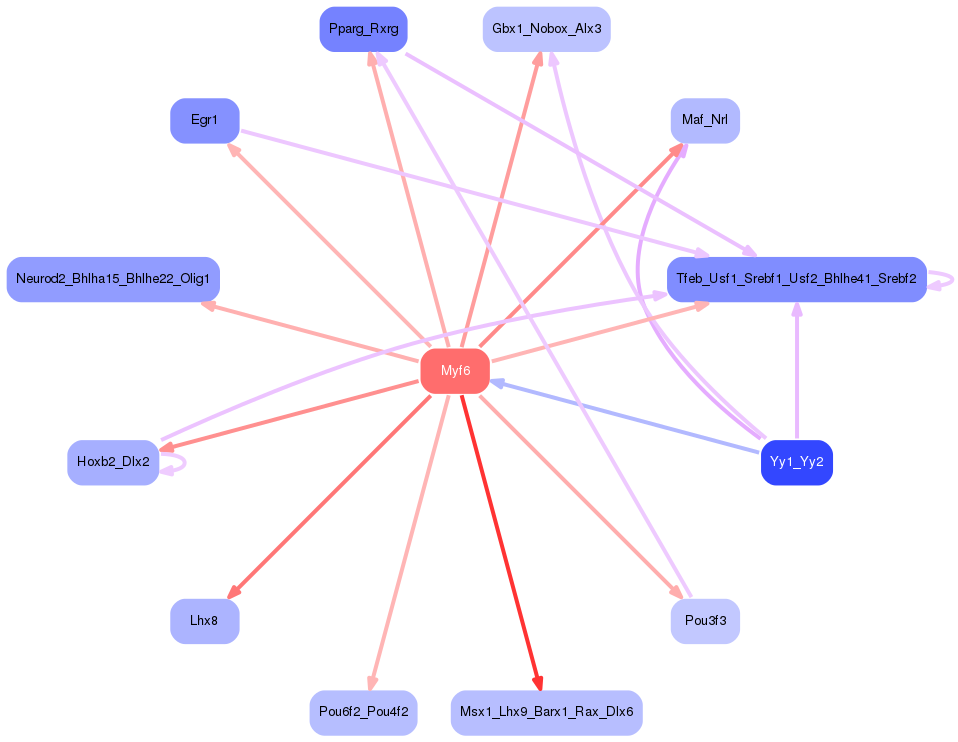
Network of associatons between targets according to the STRING database.

First level regulatory network of Myf6
Gene Ontology Analysis
Gene overrepresentation in biological process category:
| Log-likelihood per target | Total log-likelihood | Term | Description |
|---|---|---|---|
| 0.3 | 1.0 | GO:1901662 | phylloquinone metabolic process(GO:0042374) phylloquinone catabolic process(GO:0042376) quinone catabolic process(GO:1901662) |
| 0.2 | 0.5 | GO:0007468 | regulation of rhodopsin gene expression(GO:0007468) |
| 0.1 | 1.7 | GO:0001886 | endothelial cell morphogenesis(GO:0001886) |
| 0.1 | 0.4 | GO:0021882 | regulation of transcription from RNA polymerase II promoter involved in forebrain neuron fate commitment(GO:0021882) commitment of multipotent stem cells to neuronal lineage in forebrain(GO:0021898) |
| 0.1 | 0.4 | GO:0021589 | hindbrain structural organization(GO:0021577) cerebellum structural organization(GO:0021589) |
| 0.1 | 0.3 | GO:2000040 | Wnt signaling pathway involved in digestive tract morphogenesis(GO:0044333) regulation of planar cell polarity pathway involved in axis elongation(GO:2000040) negative regulation of planar cell polarity pathway involved in axis elongation(GO:2000041) |
| 0.1 | 0.3 | GO:0007199 | G-protein coupled receptor signaling pathway coupled to cGMP nucleotide second messenger(GO:0007199) |
| 0.1 | 0.3 | GO:0034165 | positive regulation of toll-like receptor 9 signaling pathway(GO:0034165) |
| 0.1 | 0.3 | GO:0021586 | pons maturation(GO:0021586) |
| 0.1 | 0.2 | GO:0051867 | general adaptation syndrome, behavioral process(GO:0051867) |
| 0.1 | 0.2 | GO:0031989 | bombesin receptor signaling pathway(GO:0031989) |
| 0.1 | 0.6 | GO:0070561 | vitamin D receptor signaling pathway(GO:0070561) |
| 0.1 | 0.7 | GO:0046543 | development of secondary female sexual characteristics(GO:0046543) |
| 0.1 | 0.3 | GO:1904395 | positive regulation of skeletal muscle acetylcholine-gated channel clustering(GO:1904395) |
| 0.1 | 0.2 | GO:0072720 | response to dithiothreitol(GO:0072720) |
| 0.1 | 0.2 | GO:0042222 | interleukin-1 biosynthetic process(GO:0042222) |
| 0.1 | 0.2 | GO:0045105 | intermediate filament polymerization or depolymerization(GO:0045105) |
| 0.1 | 0.2 | GO:0002462 | tolerance induction to nonself antigen(GO:0002462) |
| 0.1 | 0.2 | GO:0072021 | ascending thin limb development(GO:0072021) metanephric ascending thin limb development(GO:0072218) |
| 0.1 | 0.2 | GO:0010070 | zygote asymmetric cell division(GO:0010070) |
| 0.1 | 0.2 | GO:0035262 | gonad morphogenesis(GO:0035262) |
| 0.1 | 0.6 | GO:2000615 | regulation of histone H3-K9 acetylation(GO:2000615) |
| 0.1 | 0.2 | GO:0001905 | activation of membrane attack complex(GO:0001905) regulation of activation of membrane attack complex(GO:0001969) |
| 0.1 | 0.2 | GO:1903334 | positive regulation of protein folding(GO:1903334) |
| 0.0 | 0.9 | GO:0060218 | hematopoietic stem cell differentiation(GO:0060218) |
| 0.0 | 0.1 | GO:0060931 | sinoatrial node cell development(GO:0060931) |
| 0.0 | 0.2 | GO:2001013 | epithelial cell proliferation involved in renal tubule morphogenesis(GO:2001013) |
| 0.0 | 0.1 | GO:2001201 | regulation of transforming growth factor-beta secretion(GO:2001201) |
| 0.0 | 0.1 | GO:1903367 | positive regulation of fear response(GO:1903367) positive regulation of behavioral fear response(GO:2000987) |
| 0.0 | 0.2 | GO:0060708 | spongiotrophoblast differentiation(GO:0060708) |
| 0.0 | 0.2 | GO:1902896 | terminal web assembly(GO:1902896) |
| 0.0 | 0.2 | GO:0030885 | regulation of myeloid dendritic cell activation(GO:0030885) |
| 0.0 | 0.1 | GO:0043314 | negative regulation of neutrophil degranulation(GO:0043314) |
| 0.0 | 0.2 | GO:0002568 | somatic diversification of T cell receptor genes(GO:0002568) somatic recombination of T cell receptor gene segments(GO:0002681) T cell receptor V(D)J recombination(GO:0033153) |
| 0.0 | 0.1 | GO:0018199 | peptidyl-glutamine modification(GO:0018199) |
| 0.0 | 0.3 | GO:0042473 | outer ear morphogenesis(GO:0042473) |
| 0.0 | 0.2 | GO:0021979 | hypothalamus cell differentiation(GO:0021979) |
| 0.0 | 0.0 | GO:0097374 | sensory neuron axon guidance(GO:0097374) |
| 0.0 | 0.3 | GO:0061299 | retina vasculature morphogenesis in camera-type eye(GO:0061299) |
| 0.0 | 0.1 | GO:0051464 | positive regulation of cortisol secretion(GO:0051464) |
| 0.0 | 0.2 | GO:0000320 | re-entry into mitotic cell cycle(GO:0000320) |
| 0.0 | 0.1 | GO:0014736 | negative regulation of muscle atrophy(GO:0014736) |
| 0.0 | 0.3 | GO:0061042 | vascular wound healing(GO:0061042) |
| 0.0 | 0.1 | GO:0002905 | mature B cell apoptotic process(GO:0002901) regulation of mature B cell apoptotic process(GO:0002905) negative regulation of mature B cell apoptotic process(GO:0002906) |
| 0.0 | 0.1 | GO:2000741 | positive regulation of mesenchymal stem cell differentiation(GO:2000741) |
| 0.0 | 0.2 | GO:1902177 | positive regulation of oxidative stress-induced intrinsic apoptotic signaling pathway(GO:1902177) |
| 0.0 | 0.1 | GO:0030309 | poly-N-acetyllactosamine metabolic process(GO:0030309) poly-N-acetyllactosamine biosynthetic process(GO:0030311) |
| 0.0 | 0.1 | GO:0061107 | seminal vesicle development(GO:0061107) |
| 0.0 | 0.2 | GO:0071688 | striated muscle myosin thick filament assembly(GO:0071688) |
| 0.0 | 0.1 | GO:0031584 | activation of phospholipase D activity(GO:0031584) |
| 0.0 | 0.1 | GO:0032383 | regulation of intracellular lipid transport(GO:0032377) regulation of intracellular sterol transport(GO:0032380) regulation of intracellular cholesterol transport(GO:0032383) |
| 0.0 | 0.1 | GO:0045113 | regulation of integrin biosynthetic process(GO:0045113) |
| 0.0 | 0.1 | GO:0072513 | positive regulation of secondary heart field cardioblast proliferation(GO:0072513) |
| 0.0 | 0.0 | GO:0034635 | glutathione transport(GO:0034635) tripeptide transport(GO:0042939) |
| 0.0 | 0.1 | GO:1902023 | regulation of amino acid import(GO:0010958) L-arginine import(GO:0043091) arginine import(GO:0090467) L-arginine transport(GO:1902023) |
| 0.0 | 0.3 | GO:0021527 | spinal cord association neuron differentiation(GO:0021527) |
| 0.0 | 0.1 | GO:0036166 | DNA methylation on cytosine within a CG sequence(GO:0010424) phenotypic switching(GO:0036166) |
| 0.0 | 0.0 | GO:1904393 | regulation of skeletal muscle acetylcholine-gated channel clustering(GO:1904393) |
| 0.0 | 0.1 | GO:2000474 | regulation of opioid receptor signaling pathway(GO:2000474) |
| 0.0 | 0.3 | GO:1900153 | regulation of nuclear-transcribed mRNA catabolic process, deadenylation-dependent decay(GO:1900151) positive regulation of nuclear-transcribed mRNA catabolic process, deadenylation-dependent decay(GO:1900153) |
| 0.0 | 0.0 | GO:0060066 | oviduct development(GO:0060066) |
| 0.0 | 0.1 | GO:0061743 | motor learning(GO:0061743) |
| 0.0 | 0.1 | GO:0035672 | oligopeptide transmembrane transport(GO:0035672) |
| 0.0 | 0.1 | GO:0048752 | semicircular canal morphogenesis(GO:0048752) semicircular canal development(GO:0060872) |
| 0.0 | 0.0 | GO:0045163 | clustering of voltage-gated potassium channels(GO:0045163) |
| 0.0 | 0.2 | GO:1900121 | negative regulation of receptor binding(GO:1900121) |
| 0.0 | 0.0 | GO:0030908 | intein-mediated protein splicing(GO:0016539) protein splicing(GO:0030908) |
| 0.0 | 0.3 | GO:0035115 | embryonic forelimb morphogenesis(GO:0035115) |
| 0.0 | 0.1 | GO:0051343 | positive regulation of cyclic-nucleotide phosphodiesterase activity(GO:0051343) |
| 0.0 | 0.0 | GO:0014707 | branchiomeric skeletal muscle development(GO:0014707) |
| 0.0 | 0.1 | GO:0045650 | negative regulation of macrophage differentiation(GO:0045650) |
| 0.0 | 0.0 | GO:2000568 | defense response to nematode(GO:0002215) memory T cell activation(GO:0035709) positive regulation of memory T cell differentiation(GO:0043382) negative regulation of regulatory T cell differentiation(GO:0045590) regulation of memory T cell activation(GO:2000567) positive regulation of memory T cell activation(GO:2000568) |
| 0.0 | 0.0 | GO:0070172 | positive regulation of tooth mineralization(GO:0070172) |
| 0.0 | 0.1 | GO:0044313 | protein K6-linked deubiquitination(GO:0044313) |
| 0.0 | 0.1 | GO:0032286 | central nervous system myelin maintenance(GO:0032286) |
| 0.0 | 0.1 | GO:2000382 | positive regulation of mesoderm development(GO:2000382) |
| 0.0 | 0.1 | GO:0038169 | somatostatin receptor signaling pathway(GO:0038169) somatostatin signaling pathway(GO:0038170) |
| 0.0 | 0.2 | GO:0016127 | cholesterol catabolic process(GO:0006707) sterol catabolic process(GO:0016127) |
| 0.0 | 0.1 | GO:1900108 | negative regulation of nodal signaling pathway(GO:1900108) |
| 0.0 | 0.2 | GO:0071294 | cellular response to zinc ion(GO:0071294) |
| 0.0 | 0.7 | GO:0021884 | forebrain neuron development(GO:0021884) |
| 0.0 | 0.0 | GO:0072344 | rescue of stalled ribosome(GO:0072344) |
| 0.0 | 0.1 | GO:0015793 | glycerol transport(GO:0015793) |
| 0.0 | 0.1 | GO:0071787 | endoplasmic reticulum tubular network assembly(GO:0071787) |
| 0.0 | 0.1 | GO:0060050 | positive regulation of protein glycosylation(GO:0060050) |
| 0.0 | 0.2 | GO:0051601 | exocyst localization(GO:0051601) |
| 0.0 | 0.1 | GO:1902534 | single-organism membrane invagination(GO:1902534) |
| 0.0 | 0.1 | GO:0060363 | cranial suture morphogenesis(GO:0060363) |
| 0.0 | 0.1 | GO:0019695 | choline metabolic process(GO:0019695) |
| 0.0 | 0.2 | GO:0019373 | epoxygenase P450 pathway(GO:0019373) |
| 0.0 | 0.1 | GO:0045743 | positive regulation of fibroblast growth factor receptor signaling pathway(GO:0045743) |
| 0.0 | 1.0 | GO:0060021 | palate development(GO:0060021) |
| 0.0 | 0.0 | GO:0060455 | negative regulation of gastric acid secretion(GO:0060455) |
| 0.0 | 0.1 | GO:0072386 | plus-end-directed vesicle transport along microtubule(GO:0072383) plus-end-directed organelle transport along microtubule(GO:0072386) |
| 0.0 | 0.1 | GO:0014722 | regulation of skeletal muscle contraction by calcium ion signaling(GO:0014722) |
| 0.0 | 0.1 | GO:0031442 | positive regulation of mRNA 3'-end processing(GO:0031442) |
| 0.0 | 0.1 | GO:0097011 | cellular response to granulocyte macrophage colony-stimulating factor stimulus(GO:0097011) response to granulocyte macrophage colony-stimulating factor(GO:0097012) |
| 0.0 | 0.2 | GO:0072710 | response to hydroxyurea(GO:0072710) cellular response to hydroxyurea(GO:0072711) |
| 0.0 | 0.0 | GO:0001554 | luteolysis(GO:0001554) |
| 0.0 | 0.1 | GO:1900747 | negative regulation of vascular endothelial growth factor signaling pathway(GO:1900747) |
| 0.0 | 0.0 | GO:0006567 | threonine catabolic process(GO:0006567) |
| 0.0 | 0.1 | GO:0070236 | negative regulation of activation-induced cell death of T cells(GO:0070236) |
| 0.0 | 0.0 | GO:0015014 | heparan sulfate proteoglycan biosynthetic process, polysaccharide chain biosynthetic process(GO:0015014) |
| 0.0 | 0.3 | GO:0018149 | peptide cross-linking(GO:0018149) |
| 0.0 | 0.1 | GO:0019511 | peptidyl-proline hydroxylation(GO:0019511) |
| 0.0 | 0.1 | GO:1900034 | regulation of cellular response to heat(GO:1900034) |
| 0.0 | 0.0 | GO:1904154 | positive regulation of retrograde protein transport, ER to cytosol(GO:1904154) endoplasmic reticulum mannose trimming(GO:1904380) |
| 0.0 | 0.1 | GO:0000056 | ribosomal small subunit export from nucleus(GO:0000056) |
| 0.0 | 0.0 | GO:1901187 | regulation of ephrin receptor signaling pathway(GO:1901187) |
| 0.0 | 0.1 | GO:0034372 | triglyceride-rich lipoprotein particle remodeling(GO:0034370) very-low-density lipoprotein particle remodeling(GO:0034372) high-density lipoprotein particle assembly(GO:0034380) |
| 0.0 | 0.1 | GO:0046959 | habituation(GO:0046959) |
| 0.0 | 0.0 | GO:0051005 | negative regulation of lipoprotein lipase activity(GO:0051005) |
| 0.0 | 0.0 | GO:0090427 | activation of meiosis(GO:0090427) |
Gene overrepresentation in cellular component category:
| Log-likelihood per target | Total log-likelihood | Term | Description |
|---|---|---|---|
| 0.1 | 0.8 | GO:0001674 | female germ cell nucleus(GO:0001674) |
| 0.1 | 0.6 | GO:0090571 | RNA polymerase II transcription repressor complex(GO:0090571) |
| 0.1 | 0.2 | GO:0016533 | cyclin-dependent protein kinase 5 holoenzyme complex(GO:0016533) |
| 0.1 | 0.6 | GO:0034663 | endoplasmic reticulum chaperone complex(GO:0034663) |
| 0.0 | 0.1 | GO:0032937 | SREBP-SCAP-Insig complex(GO:0032937) |
| 0.0 | 0.1 | GO:0071149 | TEAD-2-YAP complex(GO:0071149) |
| 0.0 | 0.2 | GO:0044393 | TCR signalosome(GO:0036398) microspike(GO:0044393) |
| 0.0 | 0.1 | GO:0044307 | dendritic branch(GO:0044307) |
| 0.0 | 0.2 | GO:0032280 | symmetric synapse(GO:0032280) |
| 0.0 | 0.1 | GO:0035692 | macrophage migration inhibitory factor receptor complex(GO:0035692) |
| 0.0 | 0.2 | GO:0042382 | paraspeckles(GO:0042382) |
| 0.0 | 0.2 | GO:0005587 | collagen type IV trimer(GO:0005587) network-forming collagen trimer(GO:0098642) collagen network(GO:0098645) |
| 0.0 | 0.1 | GO:1990393 | 3M complex(GO:1990393) |
| 0.0 | 0.3 | GO:0001533 | cornified envelope(GO:0001533) |
| 0.0 | 0.2 | GO:0030915 | Smc5-Smc6 complex(GO:0030915) |
| 0.0 | 0.1 | GO:0031680 | G-protein beta/gamma-subunit complex(GO:0031680) |
| 0.0 | 0.1 | GO:0005785 | signal recognition particle receptor complex(GO:0005785) |
| 0.0 | 0.1 | GO:0005577 | fibrinogen complex(GO:0005577) |
| 0.0 | 0.1 | GO:0045298 | tubulin complex(GO:0045298) |
| 0.0 | 0.0 | GO:0036488 | CHOP-C/EBP complex(GO:0036488) |
| 0.0 | 0.1 | GO:0097452 | GAIT complex(GO:0097452) |
| 0.0 | 0.1 | GO:0005642 | annulate lamellae(GO:0005642) |
| 0.0 | 0.1 | GO:0046696 | lipopolysaccharide receptor complex(GO:0046696) |
| 0.0 | 0.1 | GO:0005726 | perichromatin fibrils(GO:0005726) |
| 0.0 | 0.2 | GO:0042612 | MHC class I protein complex(GO:0042612) |
| 0.0 | 0.1 | GO:0042788 | polysomal ribosome(GO:0042788) |
| 0.0 | 0.1 | GO:0042719 | mitochondrial intermembrane space protein transporter complex(GO:0042719) |
Gene overrepresentation in molecular function category:
| Log-likelihood per target | Total log-likelihood | Term | Description |
|---|---|---|---|
| 0.2 | 1.0 | GO:0004090 | carbonyl reductase (NADPH) activity(GO:0004090) |
| 0.2 | 0.6 | GO:0001226 | RNA polymerase II transcription corepressor binding(GO:0001226) |
| 0.1 | 0.2 | GO:0004946 | bombesin receptor activity(GO:0004946) |
| 0.1 | 0.9 | GO:0017151 | DEAD/H-box RNA helicase binding(GO:0017151) |
| 0.1 | 0.3 | GO:0005006 | epidermal growth factor-activated receptor activity(GO:0005006) |
| 0.1 | 0.2 | GO:0035373 | chondroitin sulfate proteoglycan binding(GO:0035373) |
| 0.1 | 0.2 | GO:0031714 | C5a anaphylatoxin chemotactic receptor binding(GO:0031714) |
| 0.0 | 0.1 | GO:0019797 | procollagen-proline 3-dioxygenase activity(GO:0019797) |
| 0.0 | 0.6 | GO:0043024 | ribosomal small subunit binding(GO:0043024) |
| 0.0 | 0.2 | GO:0044729 | hemi-methylated DNA-binding(GO:0044729) |
| 0.0 | 0.2 | GO:0001515 | opioid peptide activity(GO:0001515) |
| 0.0 | 0.2 | GO:0022841 | potassium ion leak channel activity(GO:0022841) |
| 0.0 | 0.2 | GO:0004886 | 9-cis retinoic acid receptor activity(GO:0004886) |
| 0.0 | 0.5 | GO:0043522 | leucine zipper domain binding(GO:0043522) |
| 0.0 | 0.1 | GO:0099567 | N-terminal myristoylation domain binding(GO:0031997) calcium ion binding involved in regulation of postsynaptic cytosolic calcium ion concentration(GO:0099567) |
| 0.0 | 0.1 | GO:0051431 | corticotropin-releasing hormone receptor 2 binding(GO:0051431) |
| 0.0 | 0.1 | GO:0071936 | coreceptor activity involved in Wnt signaling pathway(GO:0071936) |
| 0.0 | 0.1 | GO:0035673 | oligopeptide transmembrane transporter activity(GO:0035673) |
| 0.0 | 0.2 | GO:0050291 | sphingosine N-acyltransferase activity(GO:0050291) |
| 0.0 | 0.1 | GO:0008532 | N-acetyllactosaminide beta-1,3-N-acetylglucosaminyltransferase activity(GO:0008532) |
| 0.0 | 0.4 | GO:0051787 | misfolded protein binding(GO:0051787) |
| 0.0 | 0.2 | GO:0008889 | glycerophosphodiester phosphodiesterase activity(GO:0008889) |
| 0.0 | 0.2 | GO:0030881 | beta-2-microglobulin binding(GO:0030881) |
| 0.0 | 0.1 | GO:0004948 | calcitonin receptor activity(GO:0004948) |
| 0.0 | 0.1 | GO:0004748 | ribonucleoside-diphosphate reductase activity, thioredoxin disulfide as acceptor(GO:0004748) oxidoreductase activity, acting on CH or CH2 groups, disulfide as acceptor(GO:0016728) ribonucleoside-diphosphate reductase activity(GO:0061731) |
| 0.0 | 0.1 | GO:1904315 | transmitter-gated ion channel activity involved in regulation of postsynaptic membrane potential(GO:1904315) |
| 0.0 | 0.1 | GO:0016721 | superoxide dismutase activity(GO:0004784) oxidoreductase activity, acting on superoxide radicals as acceptor(GO:0016721) |
| 0.0 | 0.1 | GO:0005294 | neutral L-amino acid secondary active transmembrane transporter activity(GO:0005294) |
| 0.0 | 0.2 | GO:0005095 | GTPase inhibitor activity(GO:0005095) |
| 0.0 | 0.2 | GO:0031730 | CCR5 chemokine receptor binding(GO:0031730) |
| 0.0 | 0.1 | GO:0098639 | collagen binding involved in cell-matrix adhesion(GO:0098639) |
| 0.0 | 0.1 | GO:0042289 | MHC class II protein binding(GO:0042289) |
| 0.0 | 0.1 | GO:0004065 | arylsulfatase activity(GO:0004065) |
| 0.0 | 0.4 | GO:0042288 | MHC class I protein binding(GO:0042288) |
| 0.0 | 0.2 | GO:0001206 | transcriptional repressor activity, RNA polymerase II distal enhancer sequence-specific binding(GO:0001206) |
| 0.0 | 0.1 | GO:0034186 | apolipoprotein A-I binding(GO:0034186) |
| 0.0 | 0.1 | GO:0035877 | death effector domain binding(GO:0035877) |
| 0.0 | 0.4 | GO:0071837 | HMG box domain binding(GO:0071837) |
| 0.0 | 0.1 | GO:0045340 | mercury ion binding(GO:0045340) |
| 0.0 | 0.2 | GO:0097493 | structural molecule activity conferring elasticity(GO:0097493) |
| 0.0 | 0.1 | GO:0005173 | stem cell factor receptor binding(GO:0005173) |
| 0.0 | 0.2 | GO:0015037 | peptide disulfide oxidoreductase activity(GO:0015037) |
| 0.0 | 0.1 | GO:0099609 | microtubule lateral binding(GO:0099609) |
| 0.0 | 0.1 | GO:0004994 | somatostatin receptor activity(GO:0004994) |
| 0.0 | 0.1 | GO:0004609 | phosphatidylserine decarboxylase activity(GO:0004609) |
| 0.0 | 0.1 | GO:0005030 | neurotrophin receptor activity(GO:0005030) |
| 0.0 | 0.2 | GO:0042813 | Wnt-activated receptor activity(GO:0042813) |
| 0.0 | 0.5 | GO:0016712 | oxidoreductase activity, acting on paired donors, with incorporation or reduction of molecular oxygen, reduced flavin or flavoprotein as one donor, and incorporation of one atom of oxygen(GO:0016712) |
| 0.0 | 0.2 | GO:0017049 | GTP-Rho binding(GO:0017049) |
| 0.0 | 0.2 | GO:0005092 | GDP-dissociation inhibitor activity(GO:0005092) |
| 0.0 | 0.1 | GO:0071723 | lipoteichoic acid binding(GO:0070891) lipopeptide binding(GO:0071723) |
| 0.0 | 0.1 | GO:0016286 | small conductance calcium-activated potassium channel activity(GO:0016286) |
| 0.0 | 0.1 | GO:0046976 | histone methyltransferase activity (H3-K27 specific)(GO:0046976) |
| 0.0 | 0.2 | GO:0001134 | transcription factor activity, transcription factor recruiting(GO:0001134) |
| 0.0 | 0.0 | GO:0016453 | C-acetyltransferase activity(GO:0016453) |
| 0.0 | 0.1 | GO:0010858 | calcium-dependent protein kinase regulator activity(GO:0010858) |
| 0.0 | 0.2 | GO:0044548 | S100 protein binding(GO:0044548) |
Gene overrepresentation in curated gene sets: canonical pathways category:
| Log-likelihood per target | Total log-likelihood | Term | Description |
|---|---|---|---|
| 0.0 | 0.5 | PID IL5 PATHWAY | IL5-mediated signaling events |
| 0.0 | 0.3 | PID ERBB NETWORK PATHWAY | ErbB receptor signaling network |
| 0.0 | 0.2 | PID P38 GAMMA DELTA PATHWAY | Signaling mediated by p38-gamma and p38-delta |
| 0.0 | 0.7 | PID DELTA NP63 PATHWAY | Validated transcriptional targets of deltaNp63 isoforms |
| 0.0 | 0.1 | PID FCER1 PATHWAY | Fc-epsilon receptor I signaling in mast cells |
| 0.0 | 0.2 | PID SYNDECAN 3 PATHWAY | Syndecan-3-mediated signaling events |
| 0.0 | 0.5 | PID IL6 7 PATHWAY | IL6-mediated signaling events |
| 0.0 | 0.3 | PID INTEGRIN A9B1 PATHWAY | Alpha9 beta1 integrin signaling events |
Gene overrepresentation in curated gene sets: REACTOME pathways category:
| Log-likelihood per target | Total log-likelihood | Term | Description |
|---|---|---|---|
| 0.0 | 0.4 | REACTOME ACTIVATION OF CHAPERONE GENES BY ATF6 ALPHA | Genes involved in Activation of Chaperone Genes by ATF6-alpha |
| 0.0 | 0.1 | REACTOME NOTCH HLH TRANSCRIPTION PATHWAY | Genes involved in Notch-HLH transcription pathway |
| 0.0 | 0.4 | REACTOME DOWNREGULATION OF ERBB2 ERBB3 SIGNALING | Genes involved in Downregulation of ERBB2:ERBB3 signaling |
| 0.0 | 0.1 | REACTOME ANDROGEN BIOSYNTHESIS | Genes involved in Androgen biosynthesis |
| 0.0 | 0.2 | REACTOME IL 6 SIGNALING | Genes involved in Interleukin-6 signaling |
| 0.0 | 0.5 | REACTOME CYTOCHROME P450 ARRANGED BY SUBSTRATE TYPE | Genes involved in Cytochrome P450 - arranged by substrate type |
| 0.0 | 0.3 | REACTOME INITIAL TRIGGERING OF COMPLEMENT | Genes involved in Initial triggering of complement |
| 0.0 | 0.1 | REACTOME THE ACTIVATION OF ARYLSULFATASES | Genes involved in The activation of arylsulfatases |
| 0.0 | 0.2 | REACTOME RAS ACTIVATION UOPN CA2 INFUX THROUGH NMDA RECEPTOR | Genes involved in Ras activation uopn Ca2+ infux through NMDA receptor |
| 0.0 | 0.6 | REACTOME NOTCH1 INTRACELLULAR DOMAIN REGULATES TRANSCRIPTION | Genes involved in NOTCH1 Intracellular Domain Regulates Transcription |
| 0.0 | 0.1 | REACTOME TIE2 SIGNALING | Genes involved in Tie2 Signaling |