Project
GSE49485: Hypoxia transcriptome sequencing of rat brain.
Navigation
Downloads
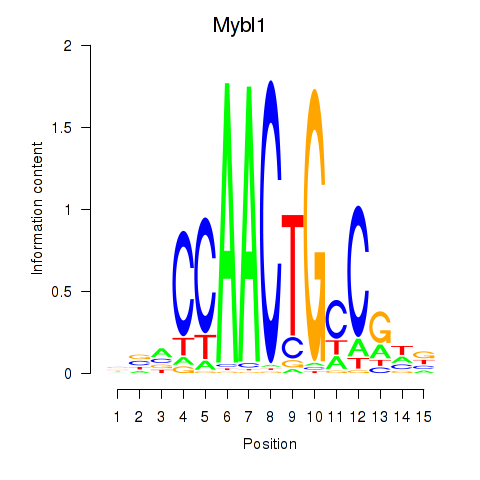
Results for Mybl1
Z-value: 0.99
Motif logo
Transcription factors associated with Mybl1
| Gene Symbol | Gene ID | Gene Info |
|---|---|---|
|
Mybl1
|
ENSRNOG00000021669 | myeloblastosis oncogene-like 1 |
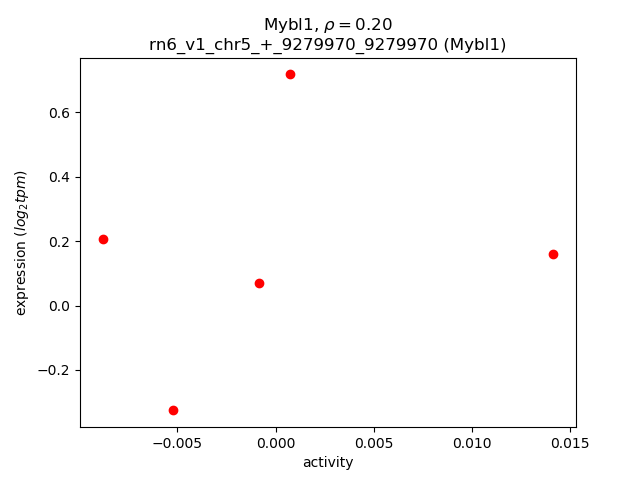
Activity-expression correlation:
| Gene | Promoter | Pearson corr. coef. | P-value | Plot |
|---|---|---|---|---|
| Mybl1 | rn6_v1_chr5_+_9279970_9279970 | 0.20 | 7.5e-01 | Click! |
Activity profile of Mybl1 motif
Sorted Z-values of Mybl1 motif
| Promoter | Log-likelihood | Transcript | Gene | Gene Info |
|---|---|---|---|---|
| chr18_-_15540177 | 0.47 |
ENSRNOT00000022113
|
Ttr
|
transthyretin |
| chrM_+_9870 | 0.39 |
ENSRNOT00000044582
|
Mt-nd4l
|
mitochondrially encoded NADH 4L dehydrogenase |
| chr5_+_6373583 | 0.37 |
ENSRNOT00000084749
|
AABR07046778.1
|
|
| chr20_-_3793985 | 0.37 |
ENSRNOT00000049540
ENSRNOT00000086293 |
RT1-CE16
|
RT1 class I, locus CE16 |
| chr8_-_55696601 | 0.31 |
ENSRNOT00000016127
|
RGD1562914
|
RGD1562914 |
| chr1_+_213583606 | 0.30 |
ENSRNOT00000088899
|
AC109844.1
|
|
| chr2_+_118547190 | 0.29 |
ENSRNOT00000083676
ENSRNOT00000090301 ENSRNOT00000013410 |
Kcnmb2
|
potassium calcium-activated channel subfamily M regulatory beta subunit 2 |
| chr9_-_9143189 | 0.27 |
ENSRNOT00000089904
|
MGC116197
|
similar to RIKEN cDNA 1700001E04 |
| chr6_-_114488880 | 0.25 |
ENSRNOT00000087560
|
AC118957.1
|
|
| chr8_-_96547568 | 0.25 |
ENSRNOT00000078343
|
RGD1560775
|
similar to RIKEN cDNA 4930579C12 gene |
| chr5_+_131719922 | 0.24 |
ENSRNOT00000010524
|
Spata6
|
spermatogenesis associated 6 |
| chr8_+_52751854 | 0.24 |
ENSRNOT00000072518
|
Nxpe1
|
neurexophilin and PC-esterase domain family, member 1 |
| chr14_+_42007312 | 0.23 |
ENSRNOT00000063985
|
Atp8a1
|
ATPase phospholipid transporting 8A1 |
| chr4_-_26255639 | 0.23 |
ENSRNOT00000031118
|
AC126960.1
|
|
| chr8_-_64572850 | 0.22 |
ENSRNOT00000015415
|
Senp8
|
SUMO/sentrin peptidase family member, NEDD8 specific |
| chr2_-_147819335 | 0.22 |
ENSRNOT00000057909
|
Ankub1
|
ankyrin repeat and ubiquitin domain containing 1 |
| chr8_+_117737387 | 0.22 |
ENSRNOT00000090164
ENSRNOT00000091573 |
Pfkfb4
|
6-phosphofructo-2-kinase/fructose-2,6-biphosphatase 4 |
| chr15_+_33271015 | 0.21 |
ENSRNOT00000073767
|
Psmb11
|
proteasome subunit beta 11 |
| chr10_-_52483325 | 0.21 |
ENSRNOT00000083485
|
AABR07029809.1
|
|
| chr1_+_141488272 | 0.21 |
ENSRNOT00000034042
|
Wdr93
|
WD repeat domain 93 |
| chr2_+_242882306 | 0.21 |
ENSRNOT00000013661
|
Ddit4l
|
DNA-damage-inducible transcript 4-like |
| chr9_-_71651512 | 0.20 |
ENSRNOT00000032782
|
Plekhm3
|
pleckstrin homology domain containing M3 |
| chr9_-_88816898 | 0.20 |
ENSRNOT00000083667
|
Slc19a3
|
solute carrier family 19 member 3 |
| chr6_+_86785771 | 0.20 |
ENSRNOT00000066702
|
Prpf39
|
pre-mRNA processing factor 39 |
| chr16_-_74072541 | 0.20 |
ENSRNOT00000089722
|
AABR07026361.2
|
|
| chr10_+_45659143 | 0.19 |
ENSRNOT00000058327
|
Wnt9a
|
wingless-type MMTV integration site family, member 9A |
| chr9_+_61823531 | 0.19 |
ENSRNOT00000070844
|
Mars2
|
methionyl-tRNA synthetase 2, mitochondrial |
| chr6_-_87427153 | 0.19 |
ENSRNOT00000071999
|
AABR07064622.1
|
|
| chr1_+_61522298 | 0.19 |
ENSRNOT00000029111
|
Zfp51
|
zinc finger protein 51 |
| chr7_-_130107437 | 0.19 |
ENSRNOT00000055865
|
Hdac10
|
histone deacetylase 10 |
| chr7_-_138039630 | 0.19 |
ENSRNOT00000008138
|
Slc38a1
|
solute carrier family 38, member 1 |
| chr3_+_112519808 | 0.18 |
ENSRNOT00000014129
|
Rpusd2
|
RNA pseudouridylate synthase domain containing 2 |
| chr2_-_219628997 | 0.18 |
ENSRNOT00000064484
|
Trmt13
|
tRNA methyltransferase 13 homolog |
| chr13_+_83996080 | 0.18 |
ENSRNOT00000004403
ENSRNOT00000070958 |
Cd247
|
Cd247 molecule |
| chr10_+_88620655 | 0.18 |
ENSRNOT00000055248
|
Hspb9
|
heat shock protein family B (small) member 9 |
| chr4_+_88832178 | 0.17 |
ENSRNOT00000088983
|
Abcg2
|
ATP-binding cassette, subfamily G (WHITE), member 2 |
| chr8_+_103774358 | 0.17 |
ENSRNOT00000014481
|
Xrn1
|
5'-3' exoribonuclease 1 |
| chr16_-_32868680 | 0.17 |
ENSRNOT00000015974
ENSRNOT00000082392 |
Aadat
|
aminoadipate aminotransferase |
| chr5_+_154800226 | 0.17 |
ENSRNOT00000016046
|
Htr1d
|
5-hydroxytryptamine receptor 1D |
| chr2_-_178389608 | 0.17 |
ENSRNOT00000013262
|
Etfdh
|
electron transfer flavoprotein dehydrogenase |
| chr10_-_46145548 | 0.17 |
ENSRNOT00000033483
|
Pld6
|
phospholipase D family, member 6 |
| chrM_+_3904 | 0.16 |
ENSRNOT00000040993
|
Mt-nd2
|
mitochondrially encoded NADH dehydrogenase 2 |
| chr2_+_60131776 | 0.16 |
ENSRNOT00000080786
|
Prlr
|
prolactin receptor |
| chr3_-_176716146 | 0.16 |
ENSRNOT00000017668
|
Srms
|
src-related kinase lacking C-terminal regulatory tyrosine and N-terminal myristylation sites |
| chr15_+_4077091 | 0.16 |
ENSRNOT00000011554
|
Myoz1
|
myozenin 1 |
| chr3_-_2459385 | 0.16 |
ENSRNOT00000014080
|
Cysrt1
|
cysteine rich tail 1 |
| chr7_-_139835876 | 0.16 |
ENSRNOT00000014258
|
Olr1877
|
olfactory receptor 1877 |
| chr10_+_81693770 | 0.16 |
ENSRNOT00000003777
ENSRNOT00000085681 |
Spag9
|
sperm associated antigen 9 |
| chr7_-_138039984 | 0.16 |
ENSRNOT00000089806
|
Slc38a1
|
solute carrier family 38, member 1 |
| chr19_+_9668186 | 0.16 |
ENSRNOT00000016563
|
Cnot1
|
CCR4-NOT transcription complex, subunit 1 |
| chr1_-_247476827 | 0.16 |
ENSRNOT00000021298
|
Insl6
|
insulin-like 6 |
| chrM_+_9451 | 0.16 |
ENSRNOT00000041241
|
Mt-nd3
|
mitochondrially encoded NADH dehydrogenase 3 |
| chr1_-_66212418 | 0.16 |
ENSRNOT00000026074
|
LOC691722
|
hypothetical protein LOC691722 |
| chr16_-_69280109 | 0.16 |
ENSRNOT00000058595
|
AABR07026240.1
|
|
| chr5_+_61954549 | 0.16 |
ENSRNOT00000012637
|
Foxe1
|
forkhead box E1 |
| chr3_+_8534440 | 0.15 |
ENSRNOT00000045827
ENSRNOT00000082672 |
Sptan1
|
spectrin, alpha, non-erythrocytic 1 |
| chr15_+_59216705 | 0.15 |
ENSRNOT00000030097
|
Ccdc122
|
coiled-coil domain containing 122 |
| chrX_+_70256737 | 0.15 |
ENSRNOT00000029298
|
Otud6a
|
OTU deubiquitinase 6A |
| chr5_-_138462864 | 0.15 |
ENSRNOT00000011325
|
Ccdc30
|
coiled-coil domain containing 30 |
| chr7_+_27174882 | 0.15 |
ENSRNOT00000051181
|
Glt8d2
|
glycosyltransferase 8 domain containing 2 |
| chr5_+_153260930 | 0.14 |
ENSRNOT00000023289
ENSRNOT00000082184 |
Rsrp1
|
arginine and serine rich protein 1 |
| chr16_+_70644474 | 0.14 |
ENSRNOT00000045955
|
LOC100359503
|
ribosomal protein S28-like |
| chr2_+_66940057 | 0.14 |
ENSRNOT00000043050
|
Cdh9
|
cadherin 9 |
| chr9_-_10427746 | 0.14 |
ENSRNOT00000071207
|
Catsperd
|
cation channel sperm associated auxiliary subunit delta |
| chr12_-_41625403 | 0.14 |
ENSRNOT00000001876
|
Sds
|
serine dehydratase |
| chr2_-_188689392 | 0.14 |
ENSRNOT00000027986
|
Dcst1
|
DC-STAMP domain containing 1 |
| chr2_-_116161998 | 0.14 |
ENSRNOT00000012560
|
Gpr160
|
G protein-coupled receptor 160 |
| chr3_+_60024013 | 0.14 |
ENSRNOT00000025255
|
Scrn3
|
secernin 3 |
| chrX_-_78911601 | 0.14 |
ENSRNOT00000003188
|
RGD1566265
|
similar to RIKEN cDNA 2610002M06 |
| chrX_+_33599671 | 0.14 |
ENSRNOT00000006843
|
Txlng
|
taxilin gamma |
| chr20_-_14193690 | 0.14 |
ENSRNOT00000058237
|
Upb1
|
beta-ureidopropionase 1 |
| chr6_+_1516158 | 0.13 |
ENSRNOT00000062031
|
LOC103692531
|
uncharacterized LOC103692531 |
| chr3_-_51297852 | 0.13 |
ENSRNOT00000001607
|
Cobll1
|
cordon-bleu WH2 repeat protein-like 1 |
| chr8_+_64573358 | 0.13 |
ENSRNOT00000083558
|
Myo9a
|
myosin IXA |
| chr2_-_165641573 | 0.13 |
ENSRNOT00000013987
|
Trim59
|
tripartite motif-containing 59 |
| chr8_-_21523540 | 0.13 |
ENSRNOT00000085060
|
Zfp266
|
zinc finger protein 266 |
| chr5_+_158090173 | 0.12 |
ENSRNOT00000088766
ENSRNOT00000079516 ENSRNOT00000092026 |
Tas1r2
|
taste 1 receptor member 2 |
| chr16_-_54450426 | 0.12 |
ENSRNOT00000014623
|
Pdgfrl
|
platelet-derived growth factor receptor-like |
| chr2_-_189899325 | 0.12 |
ENSRNOT00000017561
|
Chtop
|
chromatin target of PRMT1 |
| chr4_+_66290389 | 0.12 |
ENSRNOT00000008557
|
Luc7l2
|
LUC7-like 2 pre-mRNA splicing factor |
| chr1_-_65681440 | 0.12 |
ENSRNOT00000026305
|
Zfp128
|
zinc finger protein 128 |
| chr9_+_12472372 | 0.12 |
ENSRNOT00000061476
ENSRNOT00000050485 |
LOC100912293
|
uncharacterized LOC100912293 |
| chr7_+_35069814 | 0.12 |
ENSRNOT00000089228
|
Nr2c1
|
nuclear receptor subfamily 2, group C, member 1 |
| chr4_-_176528110 | 0.12 |
ENSRNOT00000049569
|
Slco1a2
|
solute carrier organic anion transporter family, member 1A2 |
| chr19_+_49016891 | 0.12 |
ENSRNOT00000016713
|
Dynlrb2
|
dynein light chain roadblock-type 2 |
| chr15_+_4091754 | 0.12 |
ENSRNOT00000083467
|
Usp54
|
ubiquitin specific peptidase 54 |
| chr9_+_64434904 | 0.12 |
ENSRNOT00000075508
|
LOC100911305
|
methionine--tRNA ligase, mitochondrial-like |
| chr2_-_251970768 | 0.12 |
ENSRNOT00000020141
|
Wdr63
|
WD repeat domain 63 |
| chr2_-_206997519 | 0.12 |
ENSRNOT00000027042
|
Lrig2
|
leucine-rich repeats and immunoglobulin-like domains 2 |
| chr7_+_71157664 | 0.12 |
ENSRNOT00000005919
|
Sdr9c7
|
short chain dehydrogenase/reductase family 9C, member 7 |
| chr8_-_53758774 | 0.12 |
ENSRNOT00000068040
|
Ankk1
|
ankyrin repeat and kinase domain containing 1 |
| chr11_+_32440237 | 0.12 |
ENSRNOT00000040844
|
Kcne2
|
potassium voltage-gated channel subfamily E regulatory subunit 2 |
| chr10_+_86514830 | 0.12 |
ENSRNOT00000048647
ENSRNOT00000009535 |
Zpbp2
|
zona pellucida binding protein 2 |
| chr9_-_73799427 | 0.12 |
ENSRNOT00000067589
|
Kansl1l
|
KAT8 regulatory NSL complex subunit 1-like |
| chrX_-_35431164 | 0.12 |
ENSRNOT00000004968
|
Scml2
|
sex comb on midleg-like 2 (Drosophila) |
| chr1_+_114046478 | 0.12 |
ENSRNOT00000032254
|
Siglech
|
sialic acid binding Ig-like lectin H |
| chr18_+_45023932 | 0.12 |
ENSRNOT00000039379
|
Fam170a
|
family with sequence similarity 170, member A |
| chr3_+_108544931 | 0.12 |
ENSRNOT00000006809
|
Tmco5a
|
transmembrane and coiled-coil domains 5A |
| chr16_-_69965224 | 0.12 |
ENSRNOT00000093000
|
Prrg3
|
proline rich and Gla domain 3 |
| chr9_-_14599594 | 0.12 |
ENSRNOT00000018138
|
Treml1
|
triggering receptor expressed on myeloid cells-like 1 |
| chr8_+_12355767 | 0.12 |
ENSRNOT00000068445
|
Fam76b
|
family with sequence similarity 76, member B |
| chr9_-_50868238 | 0.12 |
ENSRNOT00000015600
|
Tex30
|
testis expressed 30 |
| chr2_+_72006099 | 0.12 |
ENSRNOT00000034044
|
Cdh12
|
cadherin 12 |
| chr3_-_16537433 | 0.11 |
ENSRNOT00000048523
|
AABR07051533.2
|
|
| chrX_+_158350347 | 0.11 |
ENSRNOT00000066874
|
LOC100909732
|
protein FAM122B-like |
| chr10_+_68232094 | 0.11 |
ENSRNOT00000009172
|
Spaca3
|
sperm acrosome associated 3 |
| chr8_-_39830306 | 0.11 |
ENSRNOT00000040901
|
Ccdc15
|
coiled-coil domain containing 15 |
| chr3_+_124545364 | 0.11 |
ENSRNOT00000050900
|
Prnd
|
prion protein 2 (dublet) |
| chr2_+_188253220 | 0.11 |
ENSRNOT00000027629
|
Ash1l
|
ASH1 like histone lysine methyltransferase |
| chr3_+_110835683 | 0.11 |
ENSRNOT00000072130
|
LOC100911166
|
RNA pseudouridylate synthase domain-containing protein 2-like |
| chrX_-_106607352 | 0.11 |
ENSRNOT00000082858
|
AABR07040624.1
|
|
| chr11_+_1896209 | 0.11 |
ENSRNOT00000000909
|
Cggbp1
|
CGG triplet repeat binding protein 1 |
| chr1_-_222182721 | 0.11 |
ENSRNOT00000078008
|
Tex40
|
testis expressed 40 |
| chrX_+_120859968 | 0.11 |
ENSRNOT00000085185
|
Wdr44
|
WD repeat domain 44 |
| chr7_-_40316532 | 0.11 |
ENSRNOT00000083347
|
RGD1307947
|
similar to RIKEN cDNA C430008C19 |
| chr4_+_113935492 | 0.11 |
ENSRNOT00000035329
|
LOC103692170
|
coiled-coil domain-containing protein 142 |
| chr3_+_6773813 | 0.11 |
ENSRNOT00000065953
ENSRNOT00000013443 |
Olfm1
|
olfactomedin 1 |
| chr11_-_60882379 | 0.11 |
ENSRNOT00000002799
|
Cd200r1
|
CD200 receptor 1 |
| chr18_+_36829062 | 0.11 |
ENSRNOT00000025467
ENSRNOT00000086979 |
Tcerg1
|
transcription elongation regulator 1 |
| chrX_-_68563137 | 0.11 |
ENSRNOT00000034772
|
Ophn1
|
oligophrenin 1 |
| chr8_+_55050284 | 0.11 |
ENSRNOT00000013242
|
Pih1d2
|
PIH1 domain containing 2 |
| chr19_+_15195565 | 0.11 |
ENSRNOT00000090865
ENSRNOT00000078874 |
Ces1d
|
carboxylesterase 1D |
| chr1_-_144601327 | 0.11 |
ENSRNOT00000029244
ENSRNOT00000078144 |
Saxo2
|
stabilizer of axonemal microtubules 2 |
| chr2_+_3750094 | 0.11 |
ENSRNOT00000064743
|
Mctp1
|
multiple C2 and transmembrane domain containing 1 |
| chrX_+_120860178 | 0.10 |
ENSRNOT00000088661
|
Wdr44
|
WD repeat domain 44 |
| chr7_-_15821927 | 0.10 |
ENSRNOT00000050658
|
LOC691422
|
similar to zinc finger protein 101 |
| chr4_-_27638676 | 0.10 |
ENSRNOT00000011377
|
RGD1306626
|
similar to RIKEN cDNA 4930500J03 |
| chr8_+_12823155 | 0.10 |
ENSRNOT00000011008
|
Sesn3
|
sestrin 3 |
| chr4_+_9160067 | 0.10 |
ENSRNOT00000090600
ENSRNOT00000015426 |
Orc5
|
origin recognition complex, subunit 5 |
| chr8_-_48634797 | 0.10 |
ENSRNOT00000012868
|
Hinfp
|
histone H4 transcription factor |
| chrX_+_92596378 | 0.10 |
ENSRNOT00000045001
|
Pcdh11x
|
protocadherin 11 X-linked |
| chr2_+_92559929 | 0.10 |
ENSRNOT00000033404
|
tGap1
|
GTPase activating protein testicular GAP1 |
| chr14_-_115352562 | 0.10 |
ENSRNOT00000050321
|
Erlec1
|
endoplasmic reticulum lectin 1 |
| chr17_-_52477575 | 0.10 |
ENSRNOT00000081290
|
Gli3
|
GLI family zinc finger 3 |
| chr16_+_74292438 | 0.10 |
ENSRNOT00000026197
|
Vdac3
|
voltage-dependent anion channel 3 |
| chr6_+_109617355 | 0.10 |
ENSRNOT00000011599
|
Flvcr2
|
feline leukemia virus subgroup C cellular receptor family, member 2 |
| chr9_-_29647903 | 0.10 |
ENSRNOT00000019062
|
Ogfrl1
|
opioid growth factor receptor-like 1 |
| chr13_+_71192142 | 0.10 |
ENSRNOT00000032157
|
Rnasel
|
ribonuclease L |
| chr13_-_81698833 | 0.10 |
ENSRNOT00000005148
|
Gorab
|
golgin, RAB6-interacting |
| chr9_+_98313632 | 0.10 |
ENSRNOT00000027012
|
Ramp1
|
receptor activity modifying protein 1 |
| chrX_+_29562165 | 0.10 |
ENSRNOT00000006074
|
Ofd1
|
OFD1, centriole and centriolar satellite protein |
| chr1_+_66959610 | 0.10 |
ENSRNOT00000072122
ENSRNOT00000045994 |
Vom1r48
|
vomeronasal 1 receptor 48 |
| chr9_-_73948583 | 0.10 |
ENSRNOT00000018097
|
Myl1
|
myosin, light chain 1 |
| chrX_-_72034099 | 0.10 |
ENSRNOT00000004310
|
Ercc6l
|
ERCC excision repair 6 like, spindle assembly checkpoint helicase |
| chr14_-_84355528 | 0.10 |
ENSRNOT00000006542
|
Sec14l2
|
SEC14-like lipid binding 2 |
| chr4_-_132111079 | 0.10 |
ENSRNOT00000013719
|
Eif4e3
|
eukaryotic translation initiation factor 4E family member 3 |
| chr1_-_82004538 | 0.10 |
ENSRNOT00000087572
|
Pou2f2
|
POU class 2 homeobox 2 |
| chr13_-_84452181 | 0.10 |
ENSRNOT00000005060
|
Mael
|
maelstrom spermatogenic transposon silencer |
| chr9_+_54558202 | 0.10 |
ENSRNOT00000068433
|
Myo1b
|
myosin Ib |
| chr10_-_18443934 | 0.10 |
ENSRNOT00000059895
ENSRNOT00000080021 |
Ranbp17
|
RAN binding protein 17 |
| chr19_+_24846938 | 0.10 |
ENSRNOT00000045974
|
Ddx39a
|
DExD-box helicase 39A |
| chr14_+_39154529 | 0.10 |
ENSRNOT00000003191
|
Gabra4
|
gamma-aminobutyric acid type A receptor alpha4 subunit |
| chr3_-_176144531 | 0.10 |
ENSRNOT00000082266
|
Tcfl5
|
transcription factor like 5 |
| chr4_-_100303047 | 0.10 |
ENSRNOT00000018170
ENSRNOT00000084782 |
Mat2a
|
methionine adenosyltransferase 2A |
| chr14_-_108658371 | 0.10 |
ENSRNOT00000008919
|
Papolg
|
poly(A) polymerase gamma |
| chr16_+_71889235 | 0.10 |
ENSRNOT00000038266
|
Adam32
|
ADAM metallopeptidase domain 32 |
| chr9_+_65534704 | 0.10 |
ENSRNOT00000016730
|
Cflar
|
CASP8 and FADD-like apoptosis regulator |
| chr1_-_53152866 | 0.10 |
ENSRNOT00000085501
|
Fgfr1op
|
Fgfr1 oncogene partner |
| chr5_+_43603043 | 0.09 |
ENSRNOT00000009899
|
Epha7
|
Eph receptor A7 |
| chr9_+_12475006 | 0.09 |
ENSRNOT00000079703
|
LOC100912293
|
uncharacterized LOC100912293 |
| chr4_-_40136061 | 0.09 |
ENSRNOT00000009752
|
Bmt2
|
base methyltransferase of 25S rRNA 2 homolog |
| chr1_+_61733805 | 0.09 |
ENSRNOT00000086029
|
LOC682206
|
similar to Zinc finger protein 208 |
| chr6_+_99433550 | 0.09 |
ENSRNOT00000079359
ENSRNOT00000008504 |
Hspa2
|
heat shock protein family A member 2 |
| chr6_+_18970564 | 0.09 |
ENSRNOT00000090121
ENSRNOT00000030803 |
Cwf19l2
|
CWF19-like 2, cell cycle control (S. pombe) |
| chr6_+_80108655 | 0.09 |
ENSRNOT00000006137
|
Gemin2
|
gem (nuclear organelle) associated protein 2 |
| chr17_+_86066833 | 0.09 |
ENSRNOT00000022661
|
Msrb2
|
methionine sulfoxide reductase B2 |
| chr1_+_5448958 | 0.09 |
ENSRNOT00000061930
|
Epm2a
|
epilepsy, progressive myoclonus type 2A |
| chr1_-_53520788 | 0.09 |
ENSRNOT00000060121
|
Gpr31
|
G protein-coupled receptor 31 |
| chrX_-_107614632 | 0.09 |
ENSRNOT00000057140
|
Tmsbl1
|
thymosin beta-like protein 1 |
| chr7_+_23403891 | 0.09 |
ENSRNOT00000037918
|
Syn3
|
synapsin III |
| chr11_-_70499200 | 0.09 |
ENSRNOT00000002439
|
Slc12a8
|
solute carrier family 12, member 8 |
| chr13_+_83681322 | 0.09 |
ENSRNOT00000004206
|
Mpc2
|
mitochondrial pyruvate carrier 2 |
| chrX_+_14019961 | 0.09 |
ENSRNOT00000004785
|
Sytl5
|
synaptotagmin-like 5 |
| chr3_-_151724654 | 0.09 |
ENSRNOT00000026964
|
Rbm39
|
RNA binding motif protein 39 |
| chr3_+_148438939 | 0.09 |
ENSRNOT00000064196
|
Ttll9
|
tubulin tyrosine ligase like 9 |
| chrX_-_68562873 | 0.09 |
ENSRNOT00000076193
|
Ophn1
|
oligophrenin 1 |
| chr1_+_98228573 | 0.09 |
ENSRNOT00000019278
|
LOC102555672
|
zinc finger protein 850-like |
| chr18_-_40452456 | 0.09 |
ENSRNOT00000004747
|
Mospd4
|
motile sperm domain containing 4 |
| chr6_+_93563446 | 0.09 |
ENSRNOT00000050558
ENSRNOT00000011056 |
LOC690035
|
similar to Protein KIAA0586 |
| chr13_-_67206688 | 0.09 |
ENSRNOT00000003630
ENSRNOT00000090693 |
Pla2g4a
|
phospholipase A2 group IVA |
| chr1_-_101664436 | 0.09 |
ENSRNOT00000028522
|
Sec1
|
secretory blood group 1 |
| chr8_+_48422036 | 0.09 |
ENSRNOT00000036051
|
Usp2
|
ubiquitin specific peptidase 2 |
| chr6_+_79254339 | 0.09 |
ENSRNOT00000073970
|
Sstr1
|
somatostatin receptor 1 |
| chr2_-_192671059 | 0.09 |
ENSRNOT00000012174
|
Sprr1a
|
small proline-rich protein 1A |
| chr3_-_146396299 | 0.09 |
ENSRNOT00000040188
ENSRNOT00000008931 |
Apmap
|
adipocyte plasma membrane associated protein |
| chr1_+_47996521 | 0.09 |
ENSRNOT00000076951
|
Acat2l1
|
acetyl-CoA acetyltransferase 2-like 1 |
| chrX_-_62903530 | 0.09 |
ENSRNOT00000076652
ENSRNOT00000017370 |
Pdk3
|
pyruvate dehydrogenase kinase 3 |
| chr14_+_113530470 | 0.09 |
ENSRNOT00000004919
|
Pnpt1
|
polyribonucleotide nucleotidyltransferase 1 |
| chr4_-_165361623 | 0.09 |
ENSRNOT00000088908
|
Ly49i7
|
immunoreceptor Ly49i7 |
| chr11_+_66932614 | 0.09 |
ENSRNOT00000003189
|
Slc15a2
|
solute carrier family 15 member 2 |
| chr7_+_15242227 | 0.09 |
ENSRNOT00000084634
|
Zfp472
|
zinc finger protein 472 |
| chr8_-_71728654 | 0.09 |
ENSRNOT00000031207
ENSRNOT00000091751 |
Snx22
|
sorting nexin 22 |
| chr11_-_71108184 | 0.09 |
ENSRNOT00000051989
ENSRNOT00000073865 ENSRNOT00000063883 |
Lrch3
|
leucine rich repeats and calponin homology domain containing 3 |
| chr1_-_211956858 | 0.09 |
ENSRNOT00000054886
|
Cfap46
|
cilia and flagella associated protein 46 |
| chr7_-_80796670 | 0.08 |
ENSRNOT00000010539
|
Abra
|
actin-binding Rho activating protein |
| chrX_-_124870329 | 0.08 |
ENSRNOT00000065023
|
Cul4b
|
cullin 4B |
| chr13_-_98478327 | 0.08 |
ENSRNOT00000030135
|
Coq8a
|
coenzyme Q8A |
| chr8_+_115151627 | 0.08 |
ENSRNOT00000064252
|
Abhd14b
|
abhydrolase domain containing 14b |
| chr6_-_8956276 | 0.08 |
ENSRNOT00000079027
|
Six2
|
SIX homeobox 2 |
| chr6_+_137063611 | 0.08 |
ENSRNOT00000017504
|
LOC691485
|
hypothetical protein LOC691485 |
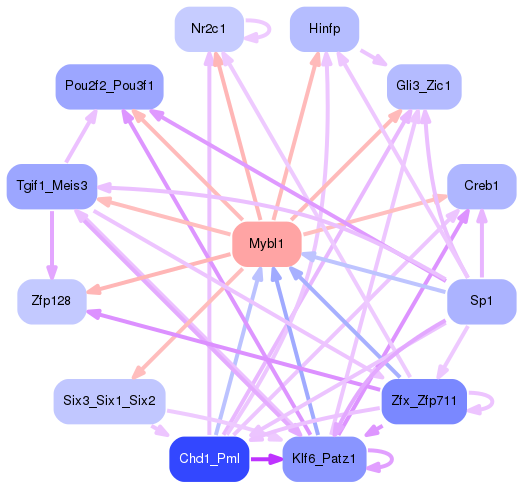
Network of associatons between targets according to the STRING database.

First level regulatory network of Mybl1
Gene Ontology Analysis
Gene overrepresentation in biological process category:
| Log-likelihood per target | Total log-likelihood | Term | Description |
|---|---|---|---|
| 0.1 | 0.3 | GO:0006431 | methionyl-tRNA aminoacylation(GO:0006431) |
| 0.1 | 0.2 | GO:0061091 | regulation of phospholipid translocation(GO:0061091) positive regulation of phospholipid translocation(GO:0061092) |
| 0.1 | 0.6 | GO:0070327 | thyroid hormone transport(GO:0070327) |
| 0.1 | 0.2 | GO:0071934 | thiamine transmembrane transport(GO:0071934) |
| 0.1 | 0.2 | GO:1904612 | glucuronoside metabolic process(GO:0019389) response to 2,3,7,8-tetrachlorodibenzodioxine(GO:1904612) |
| 0.1 | 0.2 | GO:0033512 | L-lysine catabolic process to acetyl-CoA via saccharopine(GO:0033512) |
| 0.1 | 0.2 | GO:0030719 | oocyte construction(GO:0007308) oocyte axis specification(GO:0007309) oocyte anterior/posterior axis specification(GO:0007314) pole plasm assembly(GO:0007315) maternal determination of anterior/posterior axis, embryo(GO:0008358) P granule organization(GO:0030719) |
| 0.1 | 0.2 | GO:1990167 | protein K27-linked deubiquitination(GO:1990167) protein K33-linked deubiquitination(GO:1990168) |
| 0.0 | 0.3 | GO:0006868 | glutamine transport(GO:0006868) |
| 0.0 | 0.1 | GO:1901979 | regulation of inward rectifier potassium channel activity(GO:1901979) |
| 0.0 | 0.1 | GO:0019626 | short-chain fatty acid catabolic process(GO:0019626) |
| 0.0 | 0.1 | GO:0019483 | beta-alanine biosynthetic process(GO:0019483) |
| 0.0 | 0.1 | GO:0060825 | fibroblast growth factor receptor signaling pathway involved in neural plate anterior/posterior pattern formation(GO:0060825) regulation of fibroblast growth factor receptor signaling pathway involved in neural plate anterior/posterior pattern formation(GO:2000313) |
| 0.0 | 0.1 | GO:0002380 | immunoglobulin secretion involved in immune response(GO:0002380) |
| 0.0 | 0.1 | GO:1903943 | regulation of hepatocyte apoptotic process(GO:1903943) negative regulation of hepatocyte apoptotic process(GO:1903944) |
| 0.0 | 0.1 | GO:0036353 | histone H2A-K119 monoubiquitination(GO:0036353) |
| 0.0 | 0.1 | GO:0030091 | protein repair(GO:0030091) |
| 0.0 | 0.1 | GO:0001582 | detection of chemical stimulus involved in sensory perception of sweet taste(GO:0001582) |
| 0.0 | 0.2 | GO:0097676 | histone H3-K36 dimethylation(GO:0097676) |
| 0.0 | 0.1 | GO:0061732 | mitochondrial acetyl-CoA biosynthetic process from pyruvate(GO:0061732) |
| 0.0 | 0.2 | GO:0048387 | negative regulation of retinoic acid receptor signaling pathway(GO:0048387) |
| 0.0 | 0.2 | GO:0048386 | positive regulation of retinoic acid receptor signaling pathway(GO:0048386) |
| 0.0 | 0.1 | GO:0000973 | posttranscriptional tethering of RNA polymerase II gene DNA at nuclear periphery(GO:0000973) |
| 0.0 | 0.1 | GO:0000962 | mitochondrial mRNA catabolic process(GO:0000958) positive regulation of mitochondrial RNA catabolic process(GO:0000962) rRNA import into mitochondrion(GO:0035928) |
| 0.0 | 0.1 | GO:1900368 | regulation of RNA interference(GO:1900368) |
| 0.0 | 0.1 | GO:0072137 | condensed mesenchymal cell proliferation(GO:0072137) |
| 0.0 | 0.1 | GO:0070602 | regulation of centromeric sister chromatid cohesion(GO:0070602) |
| 0.0 | 0.1 | GO:0019516 | lactate oxidation(GO:0019516) |
| 0.0 | 0.0 | GO:0035523 | protein K29-linked deubiquitination(GO:0035523) |
| 0.0 | 0.2 | GO:0060023 | hard palate development(GO:0060022) soft palate development(GO:0060023) |
| 0.0 | 0.1 | GO:0090074 | negative regulation of protein homodimerization activity(GO:0090074) |
| 0.0 | 0.1 | GO:0032916 | positive regulation of transforming growth factor beta3 production(GO:0032916) |
| 0.0 | 0.1 | GO:0021776 | smoothened signaling pathway involved in ventral spinal cord interneuron specification(GO:0021775) smoothened signaling pathway involved in spinal cord motor neuron cell fate specification(GO:0021776) |
| 0.0 | 0.2 | GO:0000395 | mRNA 5'-splice site recognition(GO:0000395) |
| 0.0 | 0.1 | GO:1904954 | Spemann organizer formation(GO:0060061) positive regulation of dermatome development(GO:0061184) canonical Wnt signaling pathway involved in midbrain dopaminergic neuron differentiation(GO:1904954) |
| 0.0 | 0.1 | GO:1901896 | positive regulation of calcium-transporting ATPase activity(GO:1901896) |
| 0.0 | 0.1 | GO:0002143 | tRNA wobble position uridine thiolation(GO:0002143) |
| 0.0 | 0.1 | GO:0006565 | L-serine catabolic process(GO:0006565) |
| 0.0 | 0.1 | GO:0033385 | geranylgeranyl diphosphate metabolic process(GO:0033385) geranylgeranyl diphosphate biosynthetic process(GO:0033386) |
| 0.0 | 0.2 | GO:0016926 | protein desumoylation(GO:0016926) |
| 0.0 | 0.2 | GO:0051096 | positive regulation of helicase activity(GO:0051096) |
| 0.0 | 0.1 | GO:0010510 | regulation of acetyl-CoA biosynthetic process from pyruvate(GO:0010510) |
| 0.0 | 0.1 | GO:0042938 | antibiotic transport(GO:0042891) dipeptide transport(GO:0042938) |
| 0.0 | 0.2 | GO:0071409 | cellular response to cycloheximide(GO:0071409) |
| 0.0 | 0.1 | GO:2000661 | positive regulation of interleukin-1-mediated signaling pathway(GO:2000661) |
| 0.0 | 0.2 | GO:0014827 | intestine smooth muscle contraction(GO:0014827) |
| 0.0 | 0.0 | GO:0044330 | canonical Wnt signaling pathway involved in positive regulation of wound healing(GO:0044330) |
| 0.0 | 0.1 | GO:0018103 | protein C-linked glycosylation(GO:0018103) peptidyl-tryptophan modification(GO:0018211) protein C-linked glycosylation via tryptophan(GO:0018317) protein C-linked glycosylation via 2'-alpha-mannosyl-L-tryptophan(GO:0018406) |
| 0.0 | 0.1 | GO:0060060 | photoreceptor cell morphogenesis(GO:0008594) post-embryonic retina morphogenesis in camera-type eye(GO:0060060) |
| 0.0 | 0.1 | GO:0060830 | ciliary receptor clustering involved in smoothened signaling pathway(GO:0060830) |
| 0.0 | 0.1 | GO:0071477 | hypotonic salinity response(GO:0042539) cellular hypotonic salinity response(GO:0071477) |
| 0.0 | 0.1 | GO:1905231 | carbohydrate export(GO:0033231) daunorubicin transport(GO:0043215) response to borneol(GO:1905230) cellular response to borneol(GO:1905231) response to codeine(GO:1905233) response to quercetin(GO:1905235) drug transport across blood-brain barrier(GO:1990962) establishment of blood-retinal barrier(GO:1990963) |
| 0.0 | 0.1 | GO:2001023 | regulation of response to drug(GO:2001023) |
| 0.0 | 0.1 | GO:2000721 | positive regulation of transcription from RNA polymerase II promoter involved in smooth muscle cell differentiation(GO:2000721) |
| 0.0 | 0.1 | GO:0006556 | S-adenosylmethionine biosynthetic process(GO:0006556) |
| 0.0 | 0.3 | GO:0006003 | fructose 2,6-bisphosphate metabolic process(GO:0006003) |
| 0.0 | 0.1 | GO:0010994 | regulation of ubiquitin homeostasis(GO:0010993) free ubiquitin chain polymerization(GO:0010994) |
| 0.0 | 0.1 | GO:0015781 | pyrimidine nucleotide-sugar transport(GO:0015781) |
| 0.0 | 0.1 | GO:0023041 | neuronal signal transduction(GO:0023041) |
| 0.0 | 0.2 | GO:0043374 | CD8-positive, alpha-beta T cell differentiation(GO:0043374) |
| 0.0 | 0.1 | GO:0038169 | somatostatin receptor signaling pathway(GO:0038169) somatostatin signaling pathway(GO:0038170) |
| 0.0 | 0.0 | GO:0000960 | mitochondrial RNA catabolic process(GO:0000957) regulation of mitochondrial RNA catabolic process(GO:0000960) |
| 0.0 | 0.1 | GO:1990737 | regulation of endoplasmic reticulum stress-induced eIF2 alpha phosphorylation(GO:0060734) response to manganese-induced endoplasmic reticulum stress(GO:1990737) |
| 0.0 | 0.1 | GO:0007341 | penetration of zona pellucida(GO:0007341) |
| 0.0 | 0.1 | GO:0038203 | TORC2 signaling(GO:0038203) |
| 0.0 | 0.1 | GO:0090625 | mRNA cleavage involved in gene silencing by siRNA(GO:0090625) |
| 0.0 | 0.3 | GO:0005513 | detection of calcium ion(GO:0005513) |
| 0.0 | 0.1 | GO:0007228 | signal transduction downstream of smoothened(GO:0007227) positive regulation of hh target transcription factor activity(GO:0007228) smoothened signaling pathway involved in regulation of cerebellar granule cell precursor cell proliferation(GO:0021938) |
| 0.0 | 0.1 | GO:0000105 | histidine biosynthetic process(GO:0000105) |
| 0.0 | 0.1 | GO:0050917 | sensory perception of umami taste(GO:0050917) |
| 0.0 | 0.1 | GO:0051964 | negative regulation of synapse assembly(GO:0051964) |
| 0.0 | 0.2 | GO:1902570 | protein localization to nucleolus(GO:1902570) |
| 0.0 | 0.1 | GO:0035063 | nuclear speck organization(GO:0035063) |
| 0.0 | 0.0 | GO:1903165 | response to polycyclic arene(GO:1903165) |
| 0.0 | 0.0 | GO:0006059 | hexitol metabolic process(GO:0006059) |
| 0.0 | 0.1 | GO:0030205 | dermatan sulfate metabolic process(GO:0030205) |
| 0.0 | 0.0 | GO:0035106 | operant conditioning(GO:0035106) |
| 0.0 | 0.0 | GO:0046351 | disaccharide biosynthetic process(GO:0046351) |
| 0.0 | 0.0 | GO:1904884 | telomerase catalytic core complex assembly(GO:1904868) regulation of telomerase catalytic core complex assembly(GO:1904882) positive regulation of telomerase catalytic core complex assembly(GO:1904884) |
| 0.0 | 0.1 | GO:0071630 | nucleus-associated proteasomal ubiquitin-dependent protein catabolic process(GO:0071630) |
| 0.0 | 0.0 | GO:0034146 | toll-like receptor 5 signaling pathway(GO:0034146) |
| 0.0 | 0.1 | GO:1901620 | regulation of smoothened signaling pathway involved in dorsal/ventral neural tube patterning(GO:1901620) |
| 0.0 | 0.2 | GO:0034587 | piRNA metabolic process(GO:0034587) |
| 0.0 | 0.1 | GO:2000124 | regulation of endocannabinoid signaling pathway(GO:2000124) |
| 0.0 | 0.1 | GO:2000327 | positive regulation of ligand-dependent nuclear receptor transcription coactivator activity(GO:2000327) |
| 0.0 | 0.1 | GO:0009405 | pathogenesis(GO:0009405) |
| 0.0 | 0.0 | GO:0032915 | positive regulation of transforming growth factor beta2 production(GO:0032915) |
| 0.0 | 0.0 | GO:0042196 | chlorinated hydrocarbon metabolic process(GO:0042196) halogenated hydrocarbon metabolic process(GO:0042197) |
| 0.0 | 0.0 | GO:0071469 | cellular response to alkaline pH(GO:0071469) |
| 0.0 | 0.0 | GO:0001545 | primary ovarian follicle growth(GO:0001545) |
| 0.0 | 0.0 | GO:0046604 | positive regulation of mitotic centrosome separation(GO:0046604) |
| 0.0 | 0.1 | GO:0072139 | glomerular parietal epithelial cell differentiation(GO:0072139) |
| 0.0 | 0.1 | GO:0042796 | snRNA transcription from RNA polymerase III promoter(GO:0042796) |
| 0.0 | 0.1 | GO:0031394 | positive regulation of prostaglandin biosynthetic process(GO:0031394) positive regulation of unsaturated fatty acid biosynthetic process(GO:2001280) |
| 0.0 | 0.1 | GO:0033326 | cerebrospinal fluid secretion(GO:0033326) |
| 0.0 | 0.0 | GO:0035521 | monoubiquitinated histone deubiquitination(GO:0035521) monoubiquitinated histone H2A deubiquitination(GO:0035522) |
| 0.0 | 0.0 | GO:0044208 | 'de novo' AMP biosynthetic process(GO:0044208) |
| 0.0 | 0.2 | GO:0007171 | activation of transmembrane receptor protein tyrosine kinase activity(GO:0007171) |
| 0.0 | 0.1 | GO:0033539 | fatty acid beta-oxidation using acyl-CoA dehydrogenase(GO:0033539) |
| 0.0 | 0.0 | GO:0070973 | protein localization to endoplasmic reticulum exit site(GO:0070973) |
| 0.0 | 0.0 | GO:0051725 | protein de-ADP-ribosylation(GO:0051725) |
| 0.0 | 0.0 | GO:1904479 | negative regulation of intestinal absorption(GO:1904479) |
| 0.0 | 0.0 | GO:0018125 | peptidyl-cysteine methylation(GO:0018125) |
| 0.0 | 0.0 | GO:0035625 | receptor transactivation(GO:0035624) epidermal growth factor-activated receptor transactivation by G-protein coupled receptor signaling pathway(GO:0035625) |
| 0.0 | 0.1 | GO:0045542 | positive regulation of cholesterol biosynthetic process(GO:0045542) positive regulation of cholesterol metabolic process(GO:0090205) |
| 0.0 | 0.1 | GO:0071787 | endoplasmic reticulum tubular network assembly(GO:0071787) |
| 0.0 | 0.1 | GO:0002943 | tRNA dihydrouridine synthesis(GO:0002943) |
| 0.0 | 0.1 | GO:0060050 | positive regulation of protein glycosylation(GO:0060050) |
| 0.0 | 0.1 | GO:0046959 | habituation(GO:0046959) |
| 0.0 | 0.0 | GO:2000660 | negative regulation of chemokine biosynthetic process(GO:0045079) negative regulation of interleukin-1-mediated signaling pathway(GO:2000660) |
| 0.0 | 0.1 | GO:0042989 | sequestering of actin monomers(GO:0042989) |
| 0.0 | 0.0 | GO:0034757 | negative regulation of iron ion transport(GO:0034757) negative regulation of iron ion transmembrane transport(GO:0034760) |
| 0.0 | 0.1 | GO:0019388 | galactose catabolic process(GO:0019388) |
| 0.0 | 0.1 | GO:0032020 | ISG15-protein conjugation(GO:0032020) |
| 0.0 | 0.2 | GO:0032331 | negative regulation of chondrocyte differentiation(GO:0032331) |
| 0.0 | 0.3 | GO:0044458 | motile cilium assembly(GO:0044458) |
| 0.0 | 0.0 | GO:0072076 | nephrogenic mesenchyme development(GO:0072076) pattern specification involved in metanephros development(GO:0072268) |
| 0.0 | 0.1 | GO:0071104 | response to interleukin-9(GO:0071104) |
| 0.0 | 0.1 | GO:0015886 | heme transport(GO:0015886) |
| 0.0 | 0.0 | GO:0000350 | generation of catalytic spliceosome for second transesterification step(GO:0000350) |
| 0.0 | 0.1 | GO:0048280 | vesicle fusion with Golgi apparatus(GO:0048280) |
| 0.0 | 0.1 | GO:0031053 | primary miRNA processing(GO:0031053) |
| 0.0 | 0.0 | GO:1900195 | spindle assembly involved in female meiosis(GO:0007056) positive regulation of oocyte maturation(GO:1900195) |
| 0.0 | 0.1 | GO:0090206 | negative regulation of cholesterol biosynthetic process(GO:0045541) negative regulation of cholesterol metabolic process(GO:0090206) |
| 0.0 | 0.0 | GO:1904380 | positive regulation of retrograde protein transport, ER to cytosol(GO:1904154) endoplasmic reticulum mannose trimming(GO:1904380) |
| 0.0 | 0.0 | GO:0034240 | negative regulation of macrophage fusion(GO:0034240) |
| 0.0 | 0.1 | GO:2000741 | positive regulation of mesenchymal stem cell differentiation(GO:2000741) |
| 0.0 | 0.1 | GO:0010890 | positive regulation of sequestering of triglyceride(GO:0010890) |
| 0.0 | 0.1 | GO:0061086 | negative regulation of histone H3-K27 methylation(GO:0061086) |
| 0.0 | 0.0 | GO:0072318 | clathrin coat disassembly(GO:0072318) |
| 0.0 | 0.0 | GO:0007199 | G-protein coupled receptor signaling pathway coupled to cGMP nucleotide second messenger(GO:0007199) |
| 0.0 | 0.0 | GO:0038183 | bile acid signaling pathway(GO:0038183) |
| 0.0 | 0.0 | GO:0021502 | neural fold elevation formation(GO:0021502) |
| 0.0 | 0.0 | GO:0001866 | NK T cell proliferation(GO:0001866) |
| 0.0 | 0.1 | GO:1904152 | negative regulation of protein exit from endoplasmic reticulum(GO:0070862) regulation of retrograde protein transport, ER to cytosol(GO:1904152) negative regulation of retrograde protein transport, ER to cytosol(GO:1904153) |
| 0.0 | 0.0 | GO:0051987 | positive regulation of attachment of spindle microtubules to kinetochore(GO:0051987) |
| 0.0 | 0.0 | GO:1905204 | response to methylglyoxal(GO:0051595) response to selenite ion(GO:0072714) negative regulation of connective tissue replacement(GO:1905204) |
| 0.0 | 0.1 | GO:0051045 | negative regulation of membrane protein ectodomain proteolysis(GO:0051045) |
| 0.0 | 0.1 | GO:0061002 | negative regulation of dendritic spine morphogenesis(GO:0061002) |
Gene overrepresentation in cellular component category:
| Log-likelihood per target | Total log-likelihood | Term | Description |
|---|---|---|---|
| 0.0 | 0.2 | GO:0036128 | CatSper complex(GO:0036128) |
| 0.0 | 0.1 | GO:0048269 | methionine adenosyltransferase complex(GO:0048269) |
| 0.0 | 0.2 | GO:0030015 | CCR4-NOT core complex(GO:0030015) |
| 0.0 | 0.1 | GO:1903767 | sweet taste receptor complex(GO:1903767) taste receptor complex(GO:1903768) |
| 0.0 | 0.1 | GO:0045025 | mitochondrial degradosome(GO:0045025) |
| 0.0 | 0.1 | GO:1990589 | ATF4-CREB1 transcription factor complex(GO:1990589) |
| 0.0 | 0.2 | GO:0000243 | commitment complex(GO:0000243) |
| 0.0 | 0.1 | GO:1902560 | GMP reductase complex(GO:1902560) |
| 0.0 | 0.1 | GO:0031265 | CD95 death-inducing signaling complex(GO:0031265) |
| 0.0 | 0.2 | GO:0042105 | alpha-beta T cell receptor complex(GO:0042105) |
| 0.0 | 0.1 | GO:0044614 | nuclear pore cytoplasmic filaments(GO:0044614) |
| 0.0 | 0.1 | GO:0071547 | piP-body(GO:0071547) |
| 0.0 | 0.1 | GO:0043159 | acrosomal matrix(GO:0043159) |
| 0.0 | 0.1 | GO:0033503 | HULC complex(GO:0033503) |
| 0.0 | 0.1 | GO:0000815 | ESCRT III complex(GO:0000815) |
| 0.0 | 0.1 | GO:0097413 | Lewy body(GO:0097413) |
| 0.0 | 0.1 | GO:0031465 | Cul4B-RING E3 ubiquitin ligase complex(GO:0031465) |
| 0.0 | 0.2 | GO:0008091 | spectrin(GO:0008091) |
| 0.0 | 0.1 | GO:0072487 | MSL complex(GO:0072487) |
| 0.0 | 0.7 | GO:0005747 | mitochondrial respiratory chain complex I(GO:0005747) NADH dehydrogenase complex(GO:0030964) respiratory chain complex I(GO:0045271) |
| 0.0 | 0.0 | GO:0005712 | chiasma(GO:0005712) |
| 0.0 | 0.1 | GO:0097504 | Gemini of coiled bodies(GO:0097504) |
| 0.0 | 0.1 | GO:0071914 | prominosome(GO:0071914) |
| 0.0 | 0.1 | GO:0061700 | GATOR2 complex(GO:0061700) |
| 0.0 | 0.0 | GO:1990745 | EARP complex(GO:1990745) |
| 0.0 | 0.1 | GO:0043203 | axon hillock(GO:0043203) |
| 0.0 | 0.0 | GO:0032301 | MutSalpha complex(GO:0032301) |
| 0.0 | 0.0 | GO:0043190 | ATP-binding cassette (ABC) transporter complex(GO:0043190) |
| 0.0 | 0.2 | GO:0005685 | U1 snRNP(GO:0005685) |
| 0.0 | 0.0 | GO:0005896 | interleukin-6 receptor complex(GO:0005896) |
| 0.0 | 0.1 | GO:0005664 | origin recognition complex(GO:0000808) nuclear origin of replication recognition complex(GO:0005664) |
| 0.0 | 0.0 | GO:0032798 | Swi5-Sfr1 complex(GO:0032798) |
| 0.0 | 0.0 | GO:0005760 | gamma DNA polymerase complex(GO:0005760) |
Gene overrepresentation in molecular function category:
| Log-likelihood per target | Total log-likelihood | Term | Description |
|---|---|---|---|
| 0.1 | 0.3 | GO:0004825 | methionine-tRNA ligase activity(GO:0004825) |
| 0.1 | 0.3 | GO:0015186 | L-glutamine transmembrane transporter activity(GO:0015186) |
| 0.1 | 0.2 | GO:0015563 | uptake transmembrane transporter activity(GO:0015563) |
| 0.1 | 0.2 | GO:0004925 | prolactin receptor activity(GO:0004925) |
| 0.0 | 0.2 | GO:0036137 | kynurenine-oxoglutarate transaminase activity(GO:0016212) kynurenine aminotransferase activity(GO:0036137) |
| 0.0 | 0.1 | GO:0003842 | 1-pyrroline-5-carboxylate dehydrogenase activity(GO:0003842) |
| 0.0 | 0.2 | GO:0032027 | myosin light chain binding(GO:0032027) |
| 0.0 | 0.1 | GO:0033149 | FFAT motif binding(GO:0033149) |
| 0.0 | 0.4 | GO:0070324 | thyroid hormone binding(GO:0070324) |
| 0.0 | 0.2 | GO:0051373 | FATZ binding(GO:0051373) |
| 0.0 | 0.1 | GO:0004478 | methionine adenosyltransferase activity(GO:0004478) |
| 0.0 | 0.1 | GO:2001070 | starch binding(GO:2001070) |
| 0.0 | 0.2 | GO:0002151 | G-quadruplex RNA binding(GO:0002151) |
| 0.0 | 0.1 | GO:0003941 | L-serine ammonia-lyase activity(GO:0003941) |
| 0.0 | 0.1 | GO:0031127 | galactoside 2-alpha-L-fucosyltransferase activity(GO:0008107) alpha-(1,2)-fucosyltransferase activity(GO:0031127) |
| 0.0 | 0.1 | GO:0042895 | antibiotic transporter activity(GO:0042895) |
| 0.0 | 0.1 | GO:0004771 | sterol esterase activity(GO:0004771) |
| 0.0 | 0.1 | GO:1990763 | arrestin family protein binding(GO:1990763) |
| 0.0 | 0.2 | GO:0008559 | xenobiotic-transporting ATPase activity(GO:0008559) |
| 0.0 | 0.1 | GO:0004948 | calcitonin receptor activity(GO:0004948) |
| 0.0 | 0.1 | GO:0070012 | oligopeptidase activity(GO:0070012) |
| 0.0 | 0.1 | GO:0003920 | GMP reductase activity(GO:0003920) oxidoreductase activity, acting on NAD(P)H, nitrogenous group as acceptor(GO:0016657) |
| 0.0 | 0.6 | GO:0050136 | NADH dehydrogenase (ubiquinone) activity(GO:0008137) NADH dehydrogenase (quinone) activity(GO:0050136) |
| 0.0 | 0.1 | GO:0016433 | rRNA (adenine) methyltransferase activity(GO:0016433) |
| 0.0 | 0.1 | GO:0033743 | peptide-methionine (R)-S-oxide reductase activity(GO:0033743) |
| 0.0 | 0.3 | GO:0004331 | 6-phosphofructo-2-kinase activity(GO:0003873) fructose-2,6-bisphosphate 2-phosphatase activity(GO:0004331) |
| 0.0 | 0.1 | GO:0051990 | (R)-2-hydroxyglutarate dehydrogenase activity(GO:0051990) |
| 0.0 | 0.2 | GO:0016929 | SUMO-specific protease activity(GO:0016929) |
| 0.0 | 0.1 | GO:0004740 | pyruvate dehydrogenase (acetyl-transferring) kinase activity(GO:0004740) |
| 0.0 | 0.1 | GO:0004909 | interleukin-1, Type I, activating receptor activity(GO:0004909) |
| 0.0 | 0.1 | GO:0015349 | thyroid hormone transmembrane transporter activity(GO:0015349) |
| 0.0 | 0.2 | GO:0048273 | mitogen-activated protein kinase p38 binding(GO:0048273) |
| 0.0 | 0.2 | GO:0046975 | histone methyltransferase activity (H3-K36 specific)(GO:0046975) |
| 0.0 | 0.1 | GO:0004040 | amidase activity(GO:0004040) |
| 0.0 | 0.1 | GO:0019237 | centromeric DNA binding(GO:0019237) |
| 0.0 | 0.1 | GO:0042296 | ISG15 transferase activity(GO:0042296) |
| 0.0 | 0.1 | GO:0034584 | piRNA binding(GO:0034584) |
| 0.0 | 0.1 | GO:0005219 | ryanodine-sensitive calcium-release channel activity(GO:0005219) |
| 0.0 | 0.1 | GO:0050833 | pyruvate transmembrane transporter activity(GO:0050833) |
| 0.0 | 0.1 | GO:0004994 | somatostatin receptor activity(GO:0004994) |
| 0.0 | 0.2 | GO:0051378 | serotonin binding(GO:0051378) |
| 0.0 | 0.0 | GO:0004938 | alpha2-adrenergic receptor activity(GO:0004938) |
| 0.0 | 0.1 | GO:0019960 | C-X3-C chemokine binding(GO:0019960) |
| 0.0 | 0.1 | GO:0030292 | protein tyrosine kinase inhibitor activity(GO:0030292) |
| 0.0 | 0.1 | GO:0004971 | AMPA glutamate receptor activity(GO:0004971) |
| 0.0 | 0.1 | GO:0005004 | GPI-linked ephrin receptor activity(GO:0005004) |
| 0.0 | 0.1 | GO:0016936 | galactoside binding(GO:0016936) |
| 0.0 | 0.0 | GO:0032551 | UTP binding(GO:0002134) pyrimidine ribonucleoside binding(GO:0032551) |
| 0.0 | 0.1 | GO:0035827 | rubidium ion transmembrane transporter activity(GO:0035827) |
| 0.0 | 0.1 | GO:0034046 | poly(G) binding(GO:0034046) |
| 0.0 | 0.0 | GO:0035663 | Toll-like receptor 2 binding(GO:0035663) |
| 0.0 | 0.1 | GO:0003726 | double-stranded RNA adenosine deaminase activity(GO:0003726) |
| 0.0 | 0.1 | GO:0003796 | lysozyme activity(GO:0003796) |
| 0.0 | 0.1 | GO:0048039 | ubiquinone binding(GO:0048039) |
| 0.0 | 0.1 | GO:0070016 | armadillo repeat domain binding(GO:0070016) |
| 0.0 | 0.1 | GO:0032296 | ribonuclease III activity(GO:0004525) double-stranded RNA-specific ribonuclease activity(GO:0032296) |
| 0.0 | 0.1 | GO:0004652 | polynucleotide adenylyltransferase activity(GO:0004652) |
| 0.0 | 0.1 | GO:0004337 | dimethylallyltranstransferase activity(GO:0004161) geranyltranstransferase activity(GO:0004337) |
| 0.0 | 0.1 | GO:0045505 | dynein intermediate chain binding(GO:0045505) |
| 0.0 | 0.0 | GO:0070883 | pre-miRNA binding(GO:0070883) |
| 0.0 | 0.0 | GO:0047708 | biotinidase activity(GO:0047708) |
| 0.0 | 0.1 | GO:0005143 | interleukin-12 receptor binding(GO:0005143) |
| 0.0 | 0.1 | GO:0008527 | taste receptor activity(GO:0008527) |
| 0.0 | 0.2 | GO:0004012 | phospholipid-translocating ATPase activity(GO:0004012) |
| 0.0 | 0.1 | GO:0004064 | arylesterase activity(GO:0004064) |
| 0.0 | 0.4 | GO:0015269 | calcium-activated potassium channel activity(GO:0015269) |
| 0.0 | 0.0 | GO:0001069 | regulatory region RNA binding(GO:0001069) |
| 0.0 | 0.1 | GO:0061676 | importin-alpha family protein binding(GO:0061676) |
| 0.0 | 0.1 | GO:0015220 | choline transmembrane transporter activity(GO:0015220) |
| 0.0 | 0.2 | GO:0005351 | sugar:proton symporter activity(GO:0005351) |
| 0.0 | 0.1 | GO:0017150 | tRNA dihydrouridine synthase activity(GO:0017150) |
| 0.0 | 0.1 | GO:0004568 | chitinase activity(GO:0004568) |
| 0.0 | 0.1 | GO:0015232 | heme transporter activity(GO:0015232) |
| 0.0 | 0.0 | GO:0000386 | second spliceosomal transesterification activity(GO:0000386) |
| 0.0 | 0.2 | GO:0016805 | dipeptidase activity(GO:0016805) |
| 0.0 | 0.1 | GO:0032184 | SUMO polymer binding(GO:0032184) |
| 0.0 | 0.1 | GO:0015379 | potassium:chloride symporter activity(GO:0015379) potassium ion symporter activity(GO:0022820) |
| 0.0 | 0.1 | GO:0030229 | very-low-density lipoprotein particle receptor activity(GO:0030229) |
| 0.0 | 0.1 | GO:0005113 | patched binding(GO:0005113) |
| 0.0 | 0.2 | GO:0009982 | pseudouridine synthase activity(GO:0009982) |
| 0.0 | 0.0 | GO:0038181 | bile acid receptor activity(GO:0038181) |
| 0.0 | 0.0 | GO:0004887 | thyroid hormone receptor activity(GO:0004887) |
| 0.0 | 0.0 | GO:0034437 | glycoprotein transporter activity(GO:0034437) |
| 0.0 | 0.1 | GO:0005049 | nuclear export signal receptor activity(GO:0005049) |
Gene overrepresentation in curated gene sets: canonical pathways category:
| Log-likelihood per target | Total log-likelihood | Term | Description |
|---|---|---|---|
| 0.0 | 0.1 | PID IL3 PATHWAY | IL3-mediated signaling events |
| 0.0 | 0.1 | SA FAS SIGNALING | The TNF-type receptor Fas induces apoptosis on ligand binding. |
Gene overrepresentation in curated gene sets: REACTOME pathways category:
| Log-likelihood per target | Total log-likelihood | Term | Description |
|---|---|---|---|
| 0.1 | 0.1 | REACTOME NOREPINEPHRINE NEUROTRANSMITTER RELEASE CYCLE | Genes involved in Norepinephrine Neurotransmitter Release Cycle |
| 0.0 | 0.2 | REACTOME TRYPTOPHAN CATABOLISM | Genes involved in Tryptophan catabolism |
| 0.0 | 0.2 | REACTOME ABACAVIR TRANSPORT AND METABOLISM | Genes involved in Abacavir transport and metabolism |
| 0.0 | 0.1 | REACTOME OLFACTORY SIGNALING PATHWAY | Genes involved in Olfactory Signaling Pathway |
| 0.0 | 0.1 | REACTOME RECYCLING OF BILE ACIDS AND SALTS | Genes involved in Recycling of bile acids and salts |
| 0.0 | 0.3 | REACTOME CGMP EFFECTS | Genes involved in cGMP effects |
| 0.0 | 0.2 | REACTOME G2 M DNA DAMAGE CHECKPOINT | Genes involved in G2/M DNA damage checkpoint |
| 0.0 | 0.2 | REACTOME SEROTONIN RECEPTORS | Genes involved in Serotonin receptors |
| 0.0 | 0.4 | REACTOME AMYLOIDS | Genes involved in Amyloids |
| 0.0 | 0.1 | REACTOME E2F ENABLED INHIBITION OF PRE REPLICATION COMPLEX FORMATION | Genes involved in E2F-enabled inhibition of pre-replication complex formation |
| 0.0 | 0.2 | REACTOME MRNA DECAY BY 5 TO 3 EXORIBONUCLEASE | Genes involved in mRNA Decay by 5' to 3' Exoribonuclease |
| 0.0 | 0.2 | REACTOME MITOCHONDRIAL TRNA AMINOACYLATION | Genes involved in Mitochondrial tRNA aminoacylation |
| 0.0 | 0.1 | REACTOME PYRIMIDINE CATABOLISM | Genes involved in Pyrimidine catabolism |
| 0.0 | 0.4 | REACTOME AMINO ACID TRANSPORT ACROSS THE PLASMA MEMBRANE | Genes involved in Amino acid transport across the plasma membrane |
| 0.0 | 0.2 | REACTOME CLASS C 3 METABOTROPIC GLUTAMATE PHEROMONE RECEPTORS | Genes involved in Class C/3 (Metabotropic glutamate/pheromone receptors) |