Project
GSE49485: Hypoxia transcriptome sequencing of rat brain.
Navigation
Downloads
Results for Irx6_Irx2_Irx3
Z-value: 1.20
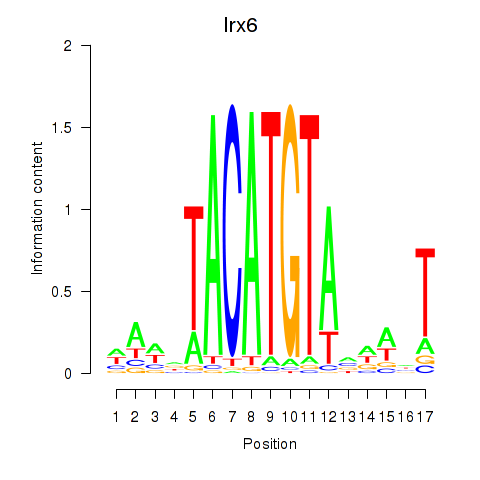
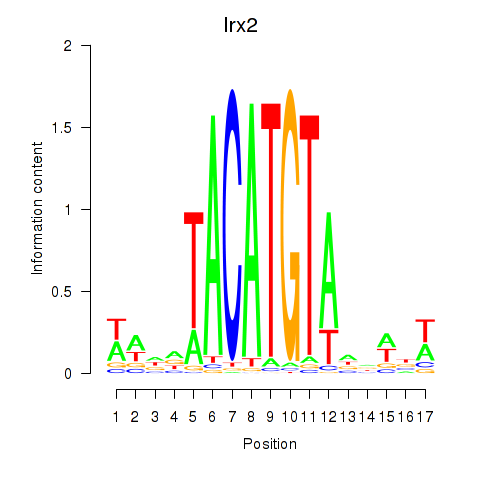
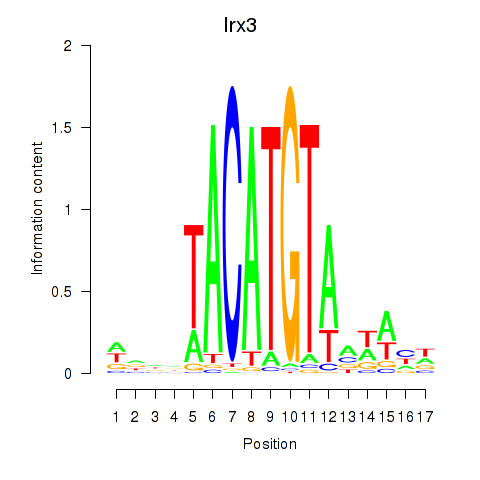
Motif logo
Transcription factors associated with Irx6_Irx2_Irx3
| Gene Symbol | Gene ID | Gene Info |
|---|---|---|
|
Irx6
|
ENSRNOG00000011037 | iroquois homeobox 6 |
|
Irx2
|
ENSRNOG00000012742 | iroquois homeobox 2 |
|
Irx3
|
ENSRNOG00000011533 | iroquois homeobox 3 |
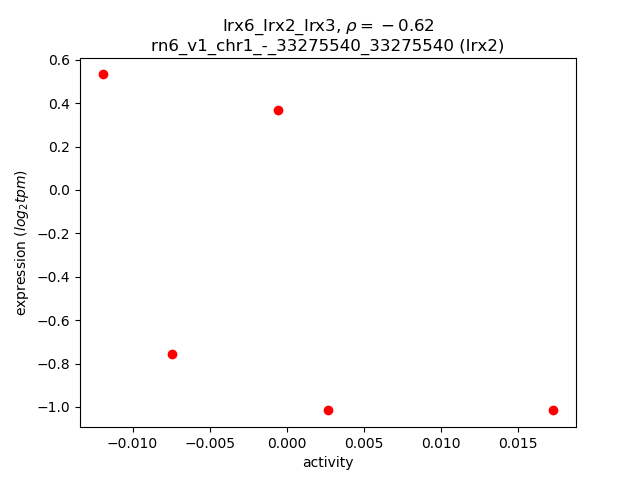
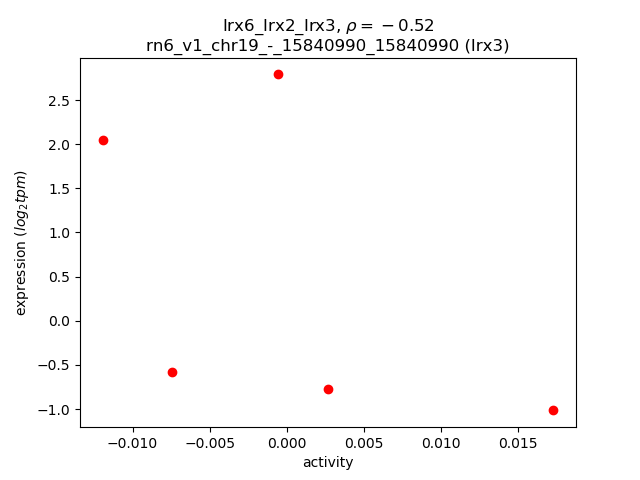
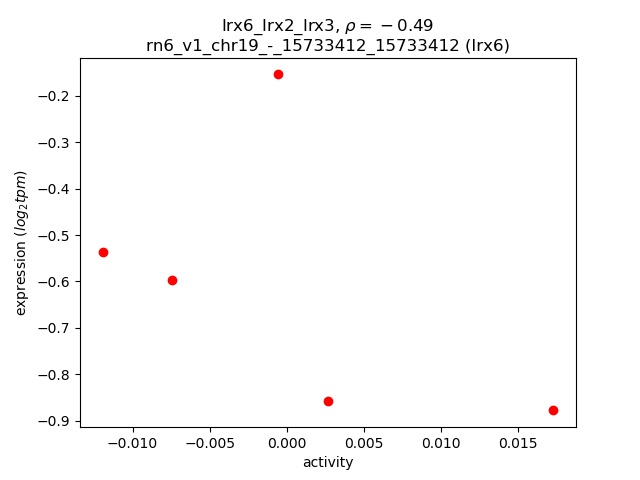
Activity-expression correlation:
| Gene | Promoter | Pearson corr. coef. | P-value | Plot |
|---|---|---|---|---|
| Irx2 | rn6_v1_chr1_-_33275540_33275540 | -0.62 | 2.7e-01 | Click! |
| Irx3 | rn6_v1_chr19_-_15840990_15840990 | -0.52 | 3.7e-01 | Click! |
| Irx6 | rn6_v1_chr19_-_15733412_15733412 | -0.49 | 4.0e-01 | Click! |
Activity profile of Irx6_Irx2_Irx3 motif
Sorted Z-values of Irx6_Irx2_Irx3 motif
| Promoter | Log-likelihood | Transcript | Gene | Gene Info |
|---|---|---|---|---|
| chr2_+_71753816 | 1.04 |
ENSRNOT00000025809
|
AABR07008724.1
|
|
| chr13_-_82129989 | 0.80 |
ENSRNOT00000078963
|
AC124874.1
|
|
| chr4_-_155923079 | 0.59 |
ENSRNOT00000013308
|
Clec4a3
|
C-type lectin domain family 4, member A3 |
| chr5_-_16782647 | 0.47 |
ENSRNOT00000072844
|
LOC100364265
|
ribosomal protein L19-like |
| chr19_+_26416818 | 0.43 |
ENSRNOT00000040473
|
AABR07043200.1
|
|
| chr13_-_103080920 | 0.39 |
ENSRNOT00000034990
|
AABR07022022.1
|
|
| chr16_-_6405117 | 0.38 |
ENSRNOT00000047737
|
Cacna1d
|
calcium voltage-gated channel subunit alpha1 D |
| chr16_-_6404578 | 0.37 |
ENSRNOT00000051371
|
Cacna1d
|
calcium voltage-gated channel subunit alpha1 D |
| chr20_+_14578605 | 0.37 |
ENSRNOT00000041165
|
Rtdr1
|
rhabdoid tumor deletion region gene 1 |
| chr15_+_32386816 | 0.36 |
ENSRNOT00000060322
|
AABR07017901.1
|
|
| chr17_-_51912496 | 0.35 |
ENSRNOT00000019272
|
Inhba
|
inhibin beta A subunit |
| chrX_+_19854836 | 0.35 |
ENSRNOT00000075010
|
AABR07037395.2
|
|
| chr20_+_8484311 | 0.35 |
ENSRNOT00000050041
|
LOC100364116
|
ribosomal protein S20-like |
| chr14_+_69800156 | 0.35 |
ENSRNOT00000072746
|
Lcorl
|
ligand dependent nuclear receptor corepressor-like |
| chrX_+_18163358 | 0.32 |
ENSRNOT00000045517
|
LOC367746
|
similar to Spindlin-like protein 2 (SPIN-2) |
| chr4_-_176026133 | 0.32 |
ENSRNOT00000043374
ENSRNOT00000046598 |
Slco1a4
|
solute carrier organic anion transporter family, member 1a4 |
| chr7_+_27174882 | 0.32 |
ENSRNOT00000051181
|
Glt8d2
|
glycosyltransferase 8 domain containing 2 |
| chrX_-_158288109 | 0.32 |
ENSRNOT00000072527
|
LOC103690175
|
PHD finger protein 6 |
| chrX_+_14019961 | 0.32 |
ENSRNOT00000004785
|
Sytl5
|
synaptotagmin-like 5 |
| chrX_+_20351486 | 0.31 |
ENSRNOT00000093675
ENSRNOT00000047444 |
Wnk3
|
WNK lysine deficient protein kinase 3 |
| chr3_-_153246433 | 0.30 |
ENSRNOT00000067748
|
Samhd1
|
SAM and HD domain containing deoxynucleoside triphosphate triphosphohydrolase 1 |
| chr12_-_13462038 | 0.30 |
ENSRNOT00000043110
|
LOC100360439
|
ribosomal protein L36-like |
| chrX_-_157628237 | 0.30 |
ENSRNOT00000083549
|
Etd
|
embryonic testis differentiation |
| chr7_+_142912316 | 0.29 |
ENSRNOT00000010171
|
Nr4a1
|
nuclear receptor subfamily 4, group A, member 1 |
| chr6_-_51498337 | 0.28 |
ENSRNOT00000012487
|
Pik3cg
|
phosphatidylinositol-4,5-bisphosphate 3-kinase, catalytic subunit gamma |
| chr2_-_208623314 | 0.27 |
ENSRNOT00000022731
|
Pifo
|
primary cilia formation |
| chr19_-_28751584 | 0.26 |
ENSRNOT00000079270
|
AABR07043456.1
|
|
| chr5_+_10125070 | 0.26 |
ENSRNOT00000085321
|
AABR07046866.1
|
|
| chr7_-_116063078 | 0.25 |
ENSRNOT00000076932
ENSRNOT00000035496 |
Gml
|
glycosylphosphatidylinositol anchored molecule like |
| chr1_-_253185533 | 0.25 |
ENSRNOT00000067822
|
Pank1
|
pantothenate kinase 1 |
| chr6_+_73358112 | 0.25 |
ENSRNOT00000041373
|
Arhgap5
|
Rho GTPase activating protein 5 |
| chr3_-_161131812 | 0.24 |
ENSRNOT00000067008
|
Wfdc11
|
WAP four-disulfide core domain 11 |
| chr2_-_149444548 | 0.24 |
ENSRNOT00000018600
|
P2ry12
|
purinergic receptor P2Y12 |
| chr13_-_91776397 | 0.24 |
ENSRNOT00000073147
|
Mptx1
|
mucosal pentraxin 1 |
| chr17_-_69711689 | 0.24 |
ENSRNOT00000041925
|
Akr1c12
|
aldo-keto reductase family 1, member C12 |
| chrX_-_45284341 | 0.24 |
ENSRNOT00000045436
|
Obp1f
|
odorant binding protein I f |
| chr8_+_99713783 | 0.23 |
ENSRNOT00000089624
|
Plscr1
|
phospholipid scramblase 1 |
| chrX_+_20520034 | 0.23 |
ENSRNOT00000093170
|
FAM120C
|
family with sequence similarity 120C |
| chr5_-_164348713 | 0.23 |
ENSRNOT00000087044
|
LOC500584
|
similar to casein kinase 1, gamma 3 isoform 2 |
| chr2_+_187447501 | 0.23 |
ENSRNOT00000038589
|
Iqgap3
|
IQ motif containing GTPase activating protein 3 |
| chr8_+_2604962 | 0.23 |
ENSRNOT00000009993
|
Casp1
|
caspase 1 |
| chr17_-_44815995 | 0.23 |
ENSRNOT00000091201
|
RGD1562378
|
histone H4 variant H4-v.1 |
| chr17_-_21705773 | 0.23 |
ENSRNOT00000078010
|
Gcnt2
|
glucosaminyl (N-acetyl) transferase 2, I-branching enzyme |
| chr18_+_35121967 | 0.22 |
ENSRNOT00000017522
|
Spink5
|
serine peptidase inhibitor, Kazal type 5 |
| chr17_+_53962444 | 0.21 |
ENSRNOT00000080101
|
Ggps1
|
geranylgeranyl diphosphate synthase 1 |
| chr14_-_23604834 | 0.21 |
ENSRNOT00000002760
|
Stap1
|
signal transducing adaptor family member 1 |
| chrX_+_122808605 | 0.21 |
ENSRNOT00000017567
|
Zcchc12
|
zinc finger CCHC-type containing 12 |
| chr19_-_21970103 | 0.21 |
ENSRNOT00000074210
|
AABR07043115.1
|
|
| chr18_-_7081356 | 0.21 |
ENSRNOT00000021253
|
Chst9
|
carbohydrate sulfotransferase 9 |
| chr7_-_145338152 | 0.20 |
ENSRNOT00000055268
|
Spt1
|
salivary protein 1 |
| chr11_-_1983513 | 0.20 |
ENSRNOT00000000907
|
Htr1f
|
5-hydroxytryptamine receptor 1F |
| chr6_-_88917070 | 0.20 |
ENSRNOT00000000767
|
Mdga2
|
MAM domain containing glycosylphosphatidylinositol anchor 2 |
| chr18_+_29490981 | 0.19 |
ENSRNOT00000032316
|
Eif4ebp3
|
eukaryotic translation initiation factor 4E binding protein 3 |
| chr2_+_209661244 | 0.19 |
ENSRNOT00000091973
|
AABR07012826.1
|
|
| chr3_-_71798531 | 0.19 |
ENSRNOT00000088170
|
Calcrl
|
calcitonin receptor like receptor |
| chr1_-_116919269 | 0.19 |
ENSRNOT00000035149
|
AABR07003616.1
|
|
| chr1_+_77967755 | 0.18 |
ENSRNOT00000058241
|
Zfp541
|
zinc finger protein 541 |
| chrM_+_8599 | 0.18 |
ENSRNOT00000049683
|
Mt-cox3
|
mitochondrially encoded cytochrome C oxidase III |
| chr13_-_67819835 | 0.18 |
ENSRNOT00000093666
|
Hmcn1
|
hemicentin 1 |
| chr19_-_26946044 | 0.18 |
ENSRNOT00000090756
|
AABR07043271.1
|
|
| chr8_-_17696989 | 0.18 |
ENSRNOT00000083752
|
AABR07069336.1
|
|
| chr1_+_214183724 | 0.17 |
ENSRNOT00000091150
|
Lrrc56
|
leucine rich repeat containing 56 |
| chr8_-_14157141 | 0.17 |
ENSRNOT00000079034
|
Deup1
|
deuterosome assembly protein 1 |
| chr19_+_15081590 | 0.17 |
ENSRNOT00000024187
|
Ces1f
|
carboxylesterase 1F |
| chr7_-_24667301 | 0.17 |
ENSRNOT00000009154
|
Tmem263
|
transmembrane protein 263 |
| chr3_+_86621205 | 0.16 |
ENSRNOT00000044595
|
Lrrc4c
|
leucine rich repeat containing 4C |
| chr7_+_117773948 | 0.16 |
ENSRNOT00000021673
|
Lrrc14
|
leucine rich repeat containing 14 |
| chr3_+_85544827 | 0.16 |
ENSRNOT00000051901
|
AABR07052953.1
|
|
| chr14_+_39368530 | 0.16 |
ENSRNOT00000084367
|
Cox7b2
|
cytochrome c oxidase subunit 7B2 |
| chr2_-_157035483 | 0.16 |
ENSRNOT00000076491
|
LOC304239
|
similar to RalA binding protein 1 |
| chr12_+_22965025 | 0.16 |
ENSRNOT00000080068
|
Col26a1
|
collagen type XXVI alpha 1 chain |
| chr19_+_26022849 | 0.16 |
ENSRNOT00000014887
|
Dnase2
|
deoxyribonuclease 2, lysosomal |
| chr14_-_21709084 | 0.16 |
ENSRNOT00000087477
|
Smr3b
|
submaxillary gland androgen regulated protein 3B |
| chr20_-_5166252 | 0.16 |
ENSRNOT00000001138
|
Aif1
|
allograft inflammatory factor 1 |
| chr17_+_44794130 | 0.16 |
ENSRNOT00000077571
|
Hist1h2ac
|
histone cluster 1, H2ac |
| chr6_-_87427153 | 0.16 |
ENSRNOT00000071999
|
AABR07064622.1
|
|
| chrX_-_83864150 | 0.16 |
ENSRNOT00000073734
|
Obp1f
|
odorant binding protein I f |
| chr14_-_33031282 | 0.16 |
ENSRNOT00000043244
|
LOC103693375
|
60S ribosomal protein L39 |
| chr4_+_152449270 | 0.15 |
ENSRNOT00000076733
|
Rad52
|
RAD52 homolog, DNA repair protein |
| chr15_+_34328851 | 0.15 |
ENSRNOT00000026819
|
Tssk4
|
testis-specific serine kinase 4 |
| chr1_-_155955173 | 0.15 |
ENSRNOT00000079345
|
AABR07004776.1
|
|
| chr6_+_127941526 | 0.15 |
ENSRNOT00000033897
|
LOC500712
|
Ab1-233 |
| chr18_+_25613831 | 0.15 |
ENSRNOT00000091040
|
Tslp
|
thymic stromal lymphopoietin |
| chr1_+_229267916 | 0.15 |
ENSRNOT00000073717
ENSRNOT00000082670 ENSRNOT00000076941 |
LOC100910851
|
serine protease inhibitor Kazal-type 5-like |
| chr1_-_59732409 | 0.14 |
ENSRNOT00000014824
|
Has1
|
hyaluronan synthase 1 |
| chr9_+_16924520 | 0.14 |
ENSRNOT00000025094
|
Slc22a7
|
solute carrier family 22 member 7 |
| chr2_-_173563273 | 0.14 |
ENSRNOT00000081423
|
Zbbx
|
zinc finger, B-box domain containing |
| chr7_-_139731876 | 0.14 |
ENSRNOT00000013704
|
Asb8
|
ankyrin repeat and SOCS box-containing 8 |
| chr20_-_5166448 | 0.14 |
ENSRNOT00000076331
|
Aif1
|
allograft inflammatory factor 1 |
| chr2_-_235052464 | 0.14 |
ENSRNOT00000093512
|
LOC103691699
|
uncharacterized LOC103691699 |
| chr2_+_195582781 | 0.14 |
ENSRNOT00000066020
|
Them5
|
thioesterase superfamily member 5 |
| chr10_+_34975708 | 0.14 |
ENSRNOT00000064984
|
Nhp2
|
NHP2 ribonucleoprotein |
| chr7_+_114724610 | 0.14 |
ENSRNOT00000014541
|
Dennd3
|
DENN domain containing 3 |
| chr16_+_37177443 | 0.14 |
ENSRNOT00000014083
|
Cep44
|
centrosomal protein 44 |
| chr18_+_57727187 | 0.14 |
ENSRNOT00000065483
ENSRNOT00000025871 |
Htr4
|
5-hydroxytryptamine receptor 4 |
| chr9_+_61738471 | 0.14 |
ENSRNOT00000090305
|
AABR07067762.1
|
|
| chr1_-_67284864 | 0.14 |
ENSRNOT00000082908
|
LOC691661
|
similar to zinc finger and SCAN domain containing 4 |
| chr10_-_17415251 | 0.13 |
ENSRNOT00000005509
|
Efcab9
|
EF-hand calcium binding domain 9 |
| chr4_+_33890349 | 0.13 |
ENSRNOT00000078680
|
C1galt1
|
core 1 synthase, glycoprotein-N-acetylgalactosamine 3-beta-galactosyltransferase, 1 |
| chr19_+_25946979 | 0.13 |
ENSRNOT00000004027
|
Gadd45gip1
|
GADD45G interacting protein 1 |
| chr10_-_109840047 | 0.13 |
ENSRNOT00000054947
|
Notum
|
NOTUM, palmitoleoyl-protein carboxylesterase |
| chr17_-_44793927 | 0.13 |
ENSRNOT00000086309
|
Hist1h2bo
|
histone cluster 1 H2B family member o |
| chr1_-_183763664 | 0.13 |
ENSRNOT00000044231
|
LOC691427
|
similar to 6.8 kDa mitochondrial proteolipid |
| chr2_+_192538899 | 0.13 |
ENSRNOT00000045691
ENSRNOT00000085931 |
LOC102550416
|
small proline-rich protein 2I-like |
| chr10_+_49259194 | 0.13 |
ENSRNOT00000091100
ENSRNOT00000004390 |
Fbxw10
|
F-box and WD repeat domain containing 10 |
| chr16_-_6404957 | 0.13 |
ENSRNOT00000048459
|
Cacna1d
|
calcium voltage-gated channel subunit alpha1 D |
| chr7_-_107223047 | 0.13 |
ENSRNOT00000007250
ENSRNOT00000084875 |
Lrrc6
|
leucine rich repeat containing 6 |
| chr3_-_46601409 | 0.12 |
ENSRNOT00000079261
|
Pla2r1
|
phospholipase A2 receptor 1 |
| chr10_-_70744315 | 0.12 |
ENSRNOT00000014865
|
Ccl5
|
C-C motif chemokine ligand 5 |
| chr10_-_107114271 | 0.12 |
ENSRNOT00000004035
|
Dnah17
|
dynein, axonemal, heavy chain 17 |
| chr16_-_47208110 | 0.12 |
ENSRNOT00000017670
|
Dctd
|
dCMP deaminase |
| chr1_-_227506822 | 0.12 |
ENSRNOT00000091506
|
Ms4a7
|
membrane spanning 4-domains A7 |
| chr7_-_80457816 | 0.12 |
ENSRNOT00000039430
|
AABR07057617.1
|
|
| chr3_-_173944396 | 0.12 |
ENSRNOT00000079019
|
Sycp2
|
synaptonemal complex protein 2 |
| chr3_+_152226070 | 0.12 |
ENSRNOT00000073201
|
AABR07054397.1
|
|
| chr2_+_222792999 | 0.12 |
ENSRNOT00000036228
|
AABR07013086.1
|
|
| chr4_+_14039977 | 0.12 |
ENSRNOT00000091249
ENSRNOT00000075878 |
Cd36
|
CD36 molecule |
| chr14_+_17534412 | 0.12 |
ENSRNOT00000079304
ENSRNOT00000046771 |
Cdkl2
|
cyclin dependent kinase like 2 |
| chr10_-_74360937 | 0.12 |
ENSRNOT00000088182
|
Gdpd1
|
glycerophosphodiester phosphodiesterase domain containing 1 |
| chr12_-_30491102 | 0.12 |
ENSRNOT00000001224
|
Sumf2
|
sulfatase modifying factor 2 |
| chr4_-_164123974 | 0.11 |
ENSRNOT00000082447
|
LOC502907
|
similar to immunoreceptor Ly49si1 |
| chr7_-_68512397 | 0.11 |
ENSRNOT00000058036
|
Slc16a7
|
solute carrier family 16 member 7 |
| chr10_+_68588789 | 0.11 |
ENSRNOT00000049614
|
AABR07030122.1
|
|
| chr19_+_50045020 | 0.11 |
ENSRNOT00000090165
|
Plcg2
|
phospholipase C, gamma 2 |
| chr16_+_22979444 | 0.11 |
ENSRNOT00000017822
|
Csgalnact1
|
chondroitin sulfate N-acetylgalactosaminyltransferase 1 |
| chr6_+_64649194 | 0.11 |
ENSRNOT00000039776
|
AABR07064102.1
|
|
| chr14_-_113968268 | 0.11 |
ENSRNOT00000005872
|
Rps27a
|
ribosomal protein S27a |
| chr9_+_8349033 | 0.11 |
ENSRNOT00000073775
|
LOC100360856
|
hypothetical protein LOC100360856 |
| chrX_+_16050780 | 0.11 |
ENSRNOT00000079054
|
Clcn5
|
chloride voltage-gated channel 5 |
| chr17_+_42302540 | 0.11 |
ENSRNOT00000025389
|
Gmnn
|
geminin, DNA replication inhibitor |
| chrX_-_82986051 | 0.11 |
ENSRNOT00000077587
|
Hdx
|
highly divergent homeobox |
| chr10_+_81592114 | 0.11 |
ENSRNOT00000072783
|
Mbtd1
|
mbt domain containing 1 |
| chr1_-_62681471 | 0.11 |
ENSRNOT00000042466
|
Vom2r15
|
vomeronasal 2 receptor, 15 |
| chr16_-_7412150 | 0.11 |
ENSRNOT00000047252
|
RGD1564325
|
similar to ribosomal protein S24 |
| chr10_+_62981297 | 0.11 |
ENSRNOT00000031618
|
Efcab5
|
EF-hand calcium binding domain 5 |
| chr4_-_120559078 | 0.11 |
ENSRNOT00000085730
ENSRNOT00000079575 |
Kbtbd12
|
kelch repeat and BTB domain containing 12 |
| chr14_-_6284145 | 0.11 |
ENSRNOT00000044065
|
Zfp951
|
zinc finger protein 951 |
| chr14_-_6358720 | 0.11 |
ENSRNOT00000048419
|
Zfp951
|
zinc finger protein 951 |
| chr2_+_242634399 | 0.10 |
ENSRNOT00000035700
|
Emcn
|
endomucin |
| chr15_+_87704340 | 0.10 |
ENSRNOT00000034987
|
Scel
|
sciellin |
| chr8_+_29714285 | 0.10 |
ENSRNOT00000042890
|
Opcml
|
opioid binding protein/cell adhesion molecule-like |
| chr1_+_82089922 | 0.10 |
ENSRNOT00000071251
|
Zfp526
|
zinc finger protein 526 |
| chr13_+_85818427 | 0.10 |
ENSRNOT00000077227
ENSRNOT00000006117 |
Rxrg
|
retinoid X receptor gamma |
| chr1_-_227441442 | 0.10 |
ENSRNOT00000028433
|
Ms4a1
|
membrane spanning 4-domains A1 |
| chrM_+_14136 | 0.10 |
ENSRNOT00000042098
|
Mt-cyb
|
mitochondrially encoded cytochrome b |
| chr1_+_42170583 | 0.10 |
ENSRNOT00000093104
|
Vip
|
vasoactive intestinal peptide |
| chr15_+_38069320 | 0.10 |
ENSRNOT00000014397
|
Sap18
|
Sin3-associated polypeptide 18 |
| chr10_+_29067102 | 0.10 |
ENSRNOT00000005161
|
C1qtnf2
|
C1q and tumor necrosis factor related protein 2 |
| chr9_+_24066303 | 0.10 |
ENSRNOT00000018163
|
Crisp3
|
cysteine-rich secretory protein 3 |
| chr4_+_163358009 | 0.10 |
ENSRNOT00000082064
|
Klrd1
|
killer cell lectin like receptor D1 |
| chr1_+_147713892 | 0.10 |
ENSRNOT00000092985
ENSRNOT00000054742 ENSRNOT00000074103 |
Cyp2c6v1
|
cytochrome P450, family 2, subfamily C, polypeptide 6, variant 1 |
| chrM_-_14061 | 0.10 |
ENSRNOT00000051268
|
Mt-nd6
|
mitochondrially encoded NADH dehydrogenase 6 |
| chr9_+_77320726 | 0.10 |
ENSRNOT00000068450
|
Spag16
|
sperm associated antigen 16 |
| chr16_+_20657099 | 0.10 |
ENSRNOT00000027053
|
Kxd1
|
KxDL motif containing 1 |
| chr5_-_29682005 | 0.10 |
ENSRNOT00000012394
|
Osgin2
|
oxidative stress induced growth inhibitor family member 2 |
| chr1_-_167911961 | 0.10 |
ENSRNOT00000025097
|
Olr59
|
olfactory receptor 59 |
| chr3_-_10153554 | 0.10 |
ENSRNOT00000093246
|
Exosc2
|
exosome component 2 |
| chr9_-_24383679 | 0.10 |
ENSRNOT00000040542
|
Crisp1
|
cysteine-rich secretory protein 1 |
| chr10_-_93679974 | 0.10 |
ENSRNOT00000009316
|
March10
|
membrane associated ring-CH-type finger 10 |
| chr5_-_79899054 | 0.09 |
ENSRNOT00000074379
|
AC229945.1
|
|
| chr10_-_68926264 | 0.09 |
ENSRNOT00000008661
|
Phb-ps1
|
prohibitin, pseudogene 1 |
| chr13_+_89597138 | 0.09 |
ENSRNOT00000004662
|
Apoa2
|
apolipoprotein A2 |
| chr3_+_100373439 | 0.09 |
ENSRNOT00000085176
|
Kif18a
|
kinesin family member 18A |
| chr1_+_42170281 | 0.09 |
ENSRNOT00000092879
|
Vip
|
vasoactive intestinal peptide |
| chr10_-_95431312 | 0.09 |
ENSRNOT00000085552
|
AABR07030603.2
|
|
| chr3_-_104502471 | 0.09 |
ENSRNOT00000040306
|
Ryr3
|
ryanodine receptor 3 |
| chr16_+_69003868 | 0.09 |
ENSRNOT00000016907
|
Adrb3
|
adrenoceptor beta 3 |
| chr4_+_98337367 | 0.09 |
ENSRNOT00000042165
|
AABR07060872.1
|
|
| chrX_+_31984612 | 0.09 |
ENSRNOT00000005181
|
Bmx
|
BMX non-receptor tyrosine kinase |
| chr16_+_22250470 | 0.09 |
ENSRNOT00000015799
|
Lzts1
|
leucine zipper tumor suppressor 1 |
| chrX_+_83926513 | 0.09 |
ENSRNOT00000035274
|
RGD1561958
|
similar to RIKEN cDNA 2010106E10 |
| chr4_+_156051915 | 0.09 |
ENSRNOT00000087933
ENSRNOT00000077840 |
Clec4a
|
C-type lectin domain family 4, member A |
| chr2_-_209537087 | 0.09 |
ENSRNOT00000024344
|
Cd53
|
Cd53 molecule |
| chr17_-_2278613 | 0.09 |
ENSRNOT00000046525
|
Cntnap3b
|
contactin associated protein-like 3B |
| chr18_-_60835739 | 0.09 |
ENSRNOT00000039569
|
LOC291543
|
similar to glyceraldehyde-3-phosphate dehydrogenase |
| chr10_-_88152064 | 0.09 |
ENSRNOT00000019477
|
Krt16
|
keratin 16 |
| chr12_-_13133219 | 0.09 |
ENSRNOT00000092292
|
Daglb
|
diacylglycerol lipase, beta |
| chr4_-_164453171 | 0.09 |
ENSRNOT00000077539
ENSRNOT00000083610 ENSRNOT00000079975 |
Ly49s6
|
Ly49 stimulatory receptor 6 |
| chr18_+_29999290 | 0.09 |
ENSRNOT00000027372
|
Pcdha4
|
protocadherin alpha 4 |
| chr18_+_35574002 | 0.09 |
ENSRNOT00000093442
ENSRNOT00000070817 ENSRNOT00000093356 |
Myot
|
myotilin |
| chr4_+_69386698 | 0.09 |
ENSRNOT00000091655
|
Trbv13-2
|
T cell receptor beta, variable 13-2 |
| chr5_-_9094616 | 0.09 |
ENSRNOT00000072210
|
Sgk3
|
serum/glucocorticoid regulated kinase family, member 3 |
| chr18_+_29993361 | 0.09 |
ENSRNOT00000075810
|
Pcdha4
|
protocadherin alpha 4 |
| chr1_-_176983045 | 0.09 |
ENSRNOT00000022301
|
Dkk3
|
dickkopf WNT signaling pathway inhibitor 3 |
| chr9_+_15313523 | 0.09 |
ENSRNOT00000070805
|
Tomm6
|
translocase of outer mitochondrial membrane 6 |
| chr14_-_100184192 | 0.09 |
ENSRNOT00000007044
|
Plek
|
pleckstrin |
| chr10_-_64550145 | 0.08 |
ENSRNOT00000050232
|
Nxn
|
nucleoredoxin |
| chr1_+_1545134 | 0.08 |
ENSRNOT00000044523
|
AABR07000156.1
|
|
| chr16_+_2278701 | 0.08 |
ENSRNOT00000016233
|
Dennd6a
|
DENN domain containing 6A |
| chr4_-_165541314 | 0.08 |
ENSRNOT00000013833
|
Styk1
|
serine/threonine/tyrosine kinase 1 |
| chr17_-_77261731 | 0.08 |
ENSRNOT00000066850
|
Ucma
|
upper zone of growth plate and cartilage matrix associated |
| chr17_+_10065947 | 0.08 |
ENSRNOT00000022703
|
Uimc1
|
ubiquitin interaction motif containing 1 |
| chr15_+_104026601 | 0.08 |
ENSRNOT00000013520
ENSRNOT00000083269 ENSRNOT00000093403 |
Cldn10
|
claudin 10 |
| chr10_-_18506337 | 0.08 |
ENSRNOT00000043036
|
Gabrp
|
gamma-aminobutyric acid type A receptor pi subunit |
| chr10_+_84669914 | 0.08 |
ENSRNOT00000011665
|
Cbx1
|
chromobox 1 |
| chr20_-_821332 | 0.08 |
ENSRNOT00000040957
|
Olr1692
|
olfactory receptor 1692 |
| chr20_+_47596575 | 0.08 |
ENSRNOT00000087230
ENSRNOT00000064905 |
Scml4
|
sex comb on midleg-like 4 (Drosophila) |
| chr4_-_28437676 | 0.08 |
ENSRNOT00000012995
|
Hepacam2
|
HEPACAM family member 2 |
| chr9_+_37727942 | 0.08 |
ENSRNOT00000016511
ENSRNOT00000074276 |
LOC100912306
|
myotilin-like |
| chr16_+_39909270 | 0.08 |
ENSRNOT00000081994
|
Wdr17
|
WD repeat domain 17 |
Network of associatons between targets according to the STRING database.

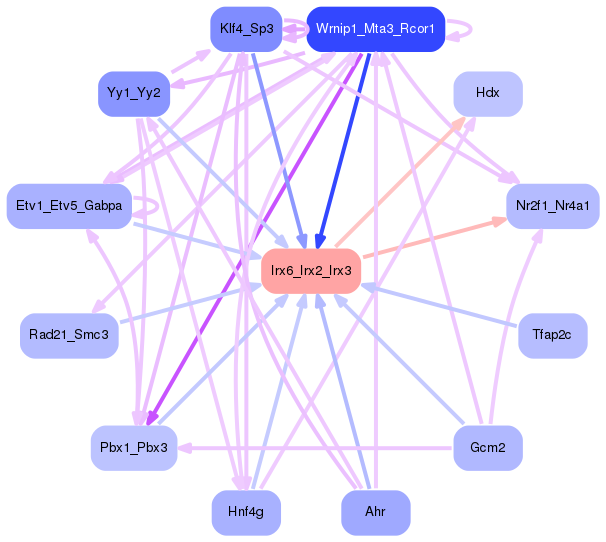
First level regulatory network of Irx6_Irx2_Irx3
Gene Ontology Analysis
Gene overrepresentation in biological process category:
| Log-likelihood per target | Total log-likelihood | Term | Description |
|---|---|---|---|
| 0.2 | 0.5 | GO:0032197 | transposition, RNA-mediated(GO:0032197) |
| 0.2 | 0.5 | GO:1904124 | microglial cell migration(GO:1904124) regulation of microglial cell migration(GO:1904139) |
| 0.1 | 0.3 | GO:2000682 | positive regulation of rubidium ion transport(GO:2000682) positive regulation of rubidium ion transmembrane transporter activity(GO:2000688) |
| 0.1 | 0.3 | GO:0014739 | positive regulation of muscle hyperplasia(GO:0014739) |
| 0.1 | 0.9 | GO:0086046 | membrane depolarization during SA node cell action potential(GO:0086046) |
| 0.1 | 0.4 | GO:0060279 | positive regulation of ovulation(GO:0060279) |
| 0.1 | 0.3 | GO:0046061 | dATP catabolic process(GO:0046061) |
| 0.1 | 0.2 | GO:0033386 | geranylgeranyl diphosphate metabolic process(GO:0033385) geranylgeranyl diphosphate biosynthetic process(GO:0033386) |
| 0.1 | 0.2 | GO:0010897 | negative regulation of triglyceride catabolic process(GO:0010897) |
| 0.1 | 0.2 | GO:0050717 | positive regulation of interleukin-1 alpha secretion(GO:0050717) |
| 0.0 | 0.3 | GO:0071376 | response to corticotropin-releasing hormone(GO:0043435) cellular response to corticotropin-releasing hormone stimulus(GO:0071376) |
| 0.0 | 0.1 | GO:1900135 | positive regulation of renin secretion into blood stream(GO:1900135) |
| 0.0 | 0.1 | GO:0010903 | negative regulation of very-low-density lipoprotein particle remodeling(GO:0010903) |
| 0.0 | 0.1 | GO:0016267 | O-glycan processing, core 1(GO:0016267) |
| 0.0 | 0.3 | GO:2000371 | regulation of DNA topoisomerase (ATP-hydrolyzing) activity(GO:2000371) positive regulation of DNA topoisomerase (ATP-hydrolyzing) activity(GO:2000373) |
| 0.0 | 0.2 | GO:1903251 | multi-ciliated epithelial cell differentiation(GO:1903251) |
| 0.0 | 0.2 | GO:2000327 | positive regulation of ligand-dependent nuclear receptor transcription coactivator activity(GO:2000327) |
| 0.0 | 0.1 | GO:0042531 | CD8-positive, alpha-beta T cell extravasation(GO:0035697) regulation of tyrosine phosphorylation of STAT protein(GO:0042509) positive regulation of tyrosine phosphorylation of STAT protein(GO:0042531) |
| 0.0 | 0.1 | GO:0010070 | zygote asymmetric cell division(GO:0010070) |
| 0.0 | 0.1 | GO:0019276 | UDP-N-acetylgalactosamine metabolic process(GO:0019276) |
| 0.0 | 0.2 | GO:0036438 | maintenance of lens transparency(GO:0036438) |
| 0.0 | 0.1 | GO:0071163 | DNA replication preinitiation complex assembly(GO:0071163) |
| 0.0 | 0.1 | GO:0045226 | extracellular polysaccharide biosynthetic process(GO:0045226) extracellular polysaccharide metabolic process(GO:0046379) |
| 0.0 | 0.2 | GO:0002784 | antimicrobial peptide production(GO:0002775) antibacterial peptide production(GO:0002778) regulation of antimicrobial peptide production(GO:0002784) regulation of antibacterial peptide production(GO:0002786) negative regulation of defense response to bacterium(GO:1900425) |
| 0.0 | 0.1 | GO:0002554 | serotonin secretion by platelet(GO:0002554) |
| 0.0 | 0.1 | GO:0002025 | vasodilation by norepinephrine-epinephrine involved in regulation of systemic arterial blood pressure(GO:0002025) |
| 0.0 | 0.1 | GO:0035965 | cardiolipin acyl-chain remodeling(GO:0035965) |
| 0.0 | 0.5 | GO:0043252 | sodium-independent organic anion transport(GO:0043252) |
| 0.0 | 0.1 | GO:0051012 | microtubule sliding(GO:0051012) |
| 0.0 | 0.1 | GO:0071049 | nuclear mRNA surveillance of mRNA 3'-end processing(GO:0071031) nuclear polyadenylation-dependent tRNA catabolic process(GO:0071038) nuclear retention of pre-mRNA with aberrant 3'-ends at the site of transcription(GO:0071049) |
| 0.0 | 0.1 | GO:0090238 | positive regulation of arachidonic acid secretion(GO:0090238) |
| 0.0 | 0.2 | GO:1901475 | pyruvate transmembrane transport(GO:1901475) |
| 0.0 | 0.1 | GO:0032632 | interleukin-3 production(GO:0032632) |
| 0.0 | 0.1 | GO:2000049 | positive regulation of cell-cell adhesion mediated by cadherin(GO:2000049) |
| 0.0 | 0.1 | GO:0000454 | snoRNA guided rRNA pseudouridine synthesis(GO:0000454) |
| 0.0 | 0.1 | GO:0000738 | DNA catabolic process, exonucleolytic(GO:0000738) |
| 0.0 | 0.1 | GO:0065001 | specification of axis polarity(GO:0065001) |
| 0.0 | 0.1 | GO:0032218 | riboflavin transport(GO:0032218) |
| 0.0 | 0.1 | GO:2000978 | gastrin-induced gastric acid secretion(GO:0001698) positive regulation of actin filament-based movement(GO:1903116) negative regulation of forebrain neuron differentiation(GO:2000978) |
| 0.0 | 0.1 | GO:0006574 | valine catabolic process(GO:0006574) |
| 0.0 | 0.1 | GO:1903566 | positive regulation of protein localization to cilium(GO:1903566) |
| 0.0 | 0.1 | GO:0045041 | protein import into mitochondrial intermembrane space(GO:0045041) |
| 0.0 | 0.1 | GO:1990918 | double-strand break repair involved in meiotic recombination(GO:1990918) |
| 0.0 | 0.2 | GO:2000819 | regulation of nucleotide-excision repair(GO:2000819) |
| 0.0 | 0.2 | GO:0070459 | prolactin secretion(GO:0070459) |
| 0.0 | 0.1 | GO:0070560 | protein secretion by platelet(GO:0070560) |
| 0.0 | 0.1 | GO:0070537 | histone H2A K63-linked deubiquitination(GO:0070537) |
| 0.0 | 0.3 | GO:0033601 | positive regulation of mammary gland epithelial cell proliferation(GO:0033601) |
| 0.0 | 0.1 | GO:0080154 | regulation of fertilization(GO:0080154) |
| 0.0 | 0.1 | GO:0048808 | male genitalia morphogenesis(GO:0048808) male anatomical structure morphogenesis(GO:0090598) |
| 0.0 | 0.0 | GO:0061732 | mitochondrial acetyl-CoA biosynthetic process from pyruvate(GO:0061732) |
| 0.0 | 0.1 | GO:0016098 | monoterpenoid metabolic process(GO:0016098) |
| 0.0 | 0.1 | GO:0072564 | blood microparticle formation(GO:0072564) regulation of blood microparticle formation(GO:2000332) positive regulation of blood microparticle formation(GO:2000334) |
| 0.0 | 0.1 | GO:0001905 | activation of membrane attack complex(GO:0001905) regulation of activation of membrane attack complex(GO:0001969) |
| 0.0 | 0.1 | GO:0090172 | microtubule cytoskeleton organization involved in homologous chromosome segregation(GO:0090172) |
| 0.0 | 0.1 | GO:0036515 | serotonergic neuron axon guidance(GO:0036515) |
| 0.0 | 0.1 | GO:0007403 | glial cell fate determination(GO:0007403) |
| 0.0 | 0.0 | GO:1902299 | pre-replicative complex assembly involved in nuclear cell cycle DNA replication(GO:0006267) pre-replicative complex assembly(GO:0036388) pre-replicative complex assembly involved in cell cycle DNA replication(GO:1902299) |
| 0.0 | 0.2 | GO:0060287 | epithelial cilium movement involved in determination of left/right asymmetry(GO:0060287) |
| 0.0 | 0.1 | GO:0032345 | negative regulation of aldosterone metabolic process(GO:0032345) negative regulation of aldosterone biosynthetic process(GO:0032348) negative regulation of cortisol biosynthetic process(GO:2000065) |
| 0.0 | 0.1 | GO:2000230 | negative regulation of pancreatic stellate cell proliferation(GO:2000230) |
| 0.0 | 0.0 | GO:0002589 | regulation of antigen processing and presentation of peptide antigen via MHC class I(GO:0002589) |
| 0.0 | 0.0 | GO:0002331 | pre-B cell allelic exclusion(GO:0002331) |
| 0.0 | 0.0 | GO:0009794 | regulation of mitotic cell cycle, embryonic(GO:0009794) mitotic cell cycle, embryonic(GO:0045448) |
| 0.0 | 0.0 | GO:1903378 | positive regulation of oxidative stress-induced neuron intrinsic apoptotic signaling pathway(GO:1903378) |
| 0.0 | 0.0 | GO:0048003 | antigen processing and presentation of lipid antigen via MHC class Ib(GO:0048003) antigen processing and presentation, exogenous lipid antigen via MHC class Ib(GO:0048007) |
| 0.0 | 0.2 | GO:0045653 | negative regulation of megakaryocyte differentiation(GO:0045653) |
| 0.0 | 0.1 | GO:1903862 | positive regulation of oxidative phosphorylation(GO:1903862) |
| 0.0 | 0.1 | GO:0033590 | response to cobalamin(GO:0033590) |
| 0.0 | 0.2 | GO:0006309 | apoptotic DNA fragmentation(GO:0006309) |
| 0.0 | 0.1 | GO:0015747 | urate transport(GO:0015747) |
| 0.0 | 0.0 | GO:2000158 | positive regulation of ubiquitin-specific protease activity(GO:2000158) |
| 0.0 | 0.2 | GO:0009744 | response to sucrose(GO:0009744) response to disaccharide(GO:0034285) |
| 0.0 | 0.1 | GO:0015811 | L-cystine transport(GO:0015811) |
| 0.0 | 0.1 | GO:0042138 | meiotic DNA double-strand break formation(GO:0042138) |
| 0.0 | 0.1 | GO:0001865 | NK T cell differentiation(GO:0001865) |
| 0.0 | 0.0 | GO:1901750 | leukotriene D4 metabolic process(GO:1901748) leukotriene D4 biosynthetic process(GO:1901750) |
| 0.0 | 0.1 | GO:0042159 | lipoprotein catabolic process(GO:0042159) |
| 0.0 | 0.1 | GO:0045650 | negative regulation of macrophage differentiation(GO:0045650) |
| 0.0 | 0.1 | GO:0045084 | positive regulation of interleukin-12 biosynthetic process(GO:0045084) |
| 0.0 | 0.1 | GO:0032959 | inositol trisphosphate biosynthetic process(GO:0032959) |
| 0.0 | 0.0 | GO:0034421 | post-translational protein acetylation(GO:0034421) |
| 0.0 | 0.1 | GO:0052697 | xenobiotic glucuronidation(GO:0052697) |
| 0.0 | 0.2 | GO:0015937 | coenzyme A biosynthetic process(GO:0015937) |
| 0.0 | 0.0 | GO:0060369 | positive regulation of Fc receptor mediated stimulatory signaling pathway(GO:0060369) |
| 0.0 | 0.2 | GO:0032793 | positive regulation of CREB transcription factor activity(GO:0032793) |
Gene overrepresentation in cellular component category:
| Log-likelihood per target | Total log-likelihood | Term | Description |
|---|---|---|---|
| 0.1 | 0.4 | GO:0043511 | inhibin complex(GO:0043511) |
| 0.1 | 0.3 | GO:0005944 | phosphatidylinositol 3-kinase complex, class IB(GO:0005944) |
| 0.1 | 0.9 | GO:1990454 | L-type voltage-gated calcium channel complex(GO:1990454) |
| 0.1 | 0.2 | GO:0097209 | epidermal lamellar body(GO:0097209) |
| 0.0 | 0.2 | GO:0072557 | IPAF inflammasome complex(GO:0072557) NLRP1 inflammasome complex(GO:0072558) AIM2 inflammasome complex(GO:0097169) |
| 0.0 | 0.2 | GO:0098536 | deuterosome(GO:0098536) |
| 0.0 | 0.1 | GO:0061574 | ASAP complex(GO:0061574) |
| 0.0 | 0.1 | GO:0019815 | B cell receptor complex(GO:0019815) |
| 0.0 | 0.1 | GO:0090661 | box H/ACA telomerase RNP complex(GO:0090661) |
| 0.0 | 0.1 | GO:0070821 | tertiary granule membrane(GO:0070821) |
| 0.0 | 0.1 | GO:1990716 | axonemal central apparatus(GO:1990716) |
| 0.0 | 0.1 | GO:0009279 | cell outer membrane(GO:0009279) external encapsulating structure(GO:0030312) cell envelope(GO:0030313) external encapsulating structure part(GO:0044462) |
| 0.0 | 0.0 | GO:0016935 | glycine-gated chloride channel complex(GO:0016935) GABA-ergic synapse(GO:0098982) |
| 0.0 | 0.1 | GO:1990769 | proximal neuron projection(GO:1990769) |
| 0.0 | 0.1 | GO:0035061 | interchromatin granule(GO:0035061) |
| 0.0 | 0.0 | GO:0036387 | nuclear pre-replicative complex(GO:0005656) pre-replicative complex(GO:0036387) |
| 0.0 | 0.3 | GO:0001891 | phagocytic cup(GO:0001891) |
| 0.0 | 0.1 | GO:0002081 | outer acrosomal membrane(GO:0002081) |
| 0.0 | 0.1 | GO:0034366 | spherical high-density lipoprotein particle(GO:0034366) |
| 0.0 | 0.1 | GO:0005828 | kinetochore microtubule(GO:0005828) |
| 0.0 | 0.1 | GO:0030314 | junctional membrane complex(GO:0030314) |
| 0.0 | 0.2 | GO:0031083 | BLOC-1 complex(GO:0031083) |
Gene overrepresentation in molecular function category:
| Log-likelihood per target | Total log-likelihood | Term | Description |
|---|---|---|---|
| 0.1 | 0.9 | GO:0086059 | voltage-gated calcium channel activity involved SA node cell action potential(GO:0086059) |
| 0.1 | 0.4 | GO:0070699 | type II activin receptor binding(GO:0070699) |
| 0.1 | 0.2 | GO:0005157 | macrophage colony-stimulating factor receptor binding(GO:0005157) |
| 0.1 | 0.2 | GO:0001605 | adrenomedullin receptor activity(GO:0001605) |
| 0.1 | 0.2 | GO:0004594 | pantothenate kinase activity(GO:0004594) |
| 0.1 | 0.2 | GO:0008109 | N-acetyllactosaminide beta-1,6-N-acetylglucosaminyltransferase activity(GO:0008109) |
| 0.1 | 0.3 | GO:0032027 | myosin light chain binding(GO:0032027) |
| 0.0 | 0.1 | GO:0016263 | glycoprotein-N-acetylgalactosamine 3-beta-galactosyltransferase activity(GO:0016263) |
| 0.0 | 0.2 | GO:0004161 | dimethylallyltranstransferase activity(GO:0004161) geranyltranstransferase activity(GO:0004337) |
| 0.0 | 0.3 | GO:0032554 | purine deoxyribonucleotide binding(GO:0032554) |
| 0.0 | 0.1 | GO:0047237 | glucuronylgalactosylproteoglycan 4-beta-N-acetylgalactosaminyltransferase activity(GO:0047237) |
| 0.0 | 0.1 | GO:0004939 | beta-adrenergic receptor activity(GO:0004939) |
| 0.0 | 0.2 | GO:0001609 | G-protein coupled adenosine receptor activity(GO:0001609) |
| 0.0 | 0.2 | GO:0001537 | N-acetylgalactosamine 4-O-sulfotransferase activity(GO:0001537) |
| 0.0 | 0.1 | GO:0023025 | MHC class Ib protein complex binding(GO:0023025) MHC class Ib protein binding, via antigen binding groove(GO:0023030) |
| 0.0 | 0.1 | GO:0070653 | high-density lipoprotein particle receptor binding(GO:0070653) |
| 0.0 | 0.2 | GO:0050833 | pyruvate transmembrane transporter activity(GO:0050833) |
| 0.0 | 0.1 | GO:0050501 | hyaluronan synthase activity(GO:0050501) |
| 0.0 | 0.1 | GO:0001594 | trace-amine receptor activity(GO:0001594) |
| 0.0 | 0.3 | GO:0019869 | chloride channel inhibitor activity(GO:0019869) |
| 0.0 | 0.1 | GO:0032217 | riboflavin transporter activity(GO:0032217) |
| 0.0 | 0.1 | GO:0102390 | mycophenolic acid acyl-glucuronide esterase activity(GO:0102390) |
| 0.0 | 0.1 | GO:0070892 | lipoteichoic acid receptor activity(GO:0070892) |
| 0.0 | 0.5 | GO:0005549 | odorant binding(GO:0005549) |
| 0.0 | 0.3 | GO:0015125 | bile acid transmembrane transporter activity(GO:0015125) |
| 0.0 | 0.1 | GO:0048019 | CCR1 chemokine receptor binding(GO:0031726) receptor antagonist activity(GO:0048019) |
| 0.0 | 0.3 | GO:0016303 | 1-phosphatidylinositol-3-kinase activity(GO:0016303) |
| 0.0 | 0.1 | GO:0016716 | oxidoreductase activity, acting on paired donors, with incorporation or reduction of molecular oxygen, another compound as one donor, and incorporation of one atom of oxygen(GO:0016716) |
| 0.0 | 0.2 | GO:0097200 | cysteine-type endopeptidase activity involved in execution phase of apoptosis(GO:0097200) |
| 0.0 | 0.1 | GO:0004886 | 9-cis retinoic acid receptor activity(GO:0004886) |
| 0.0 | 0.2 | GO:0042609 | CD4 receptor binding(GO:0042609) |
| 0.0 | 0.2 | GO:0008190 | eukaryotic initiation factor 4E binding(GO:0008190) |
| 0.0 | 0.1 | GO:0034513 | box H/ACA snoRNA binding(GO:0034513) |
| 0.0 | 0.2 | GO:0016889 | endodeoxyribonuclease activity, producing 3'-phosphomonoesters(GO:0016889) |
| 0.0 | 0.0 | GO:0022852 | glycine-gated chloride ion channel activity(GO:0022852) |
| 0.0 | 0.1 | GO:0017081 | chloride channel regulator activity(GO:0017081) |
| 0.0 | 0.1 | GO:0019237 | centromeric DNA binding(GO:0019237) |
| 0.0 | 0.1 | GO:1990226 | histone methyltransferase binding(GO:1990226) |
| 0.0 | 0.4 | GO:0035259 | glucocorticoid receptor binding(GO:0035259) |
| 0.0 | 0.1 | GO:1901702 | urate transmembrane transporter activity(GO:0015143) salt transmembrane transporter activity(GO:1901702) |
| 0.0 | 0.0 | GO:0050309 | glucose-6-phosphatase activity(GO:0004346) sugar-terminal-phosphatase activity(GO:0050309) |
| 0.0 | 0.1 | GO:0030881 | beta-2-microglobulin binding(GO:0030881) |
| 0.0 | 0.0 | GO:0035800 | deubiquitinase activator activity(GO:0035800) |
| 0.0 | 0.0 | GO:0016422 | mRNA (2'-O-methyladenosine-N6-)-methyltransferase activity(GO:0016422) |
| 0.0 | 0.1 | GO:0015184 | L-cystine transmembrane transporter activity(GO:0015184) |
| 0.0 | 0.0 | GO:0005219 | ryanodine-sensitive calcium-release channel activity(GO:0005219) |
| 0.0 | 0.0 | GO:0004185 | serine-type carboxypeptidase activity(GO:0004185) |
| 0.0 | 0.1 | GO:0009008 | DNA-methyltransferase activity(GO:0009008) |
| 0.0 | 0.1 | GO:0015347 | sodium-independent organic anion transmembrane transporter activity(GO:0015347) |
| 0.0 | 0.1 | GO:0016290 | palmitoyl-CoA hydrolase activity(GO:0016290) |
| 0.0 | 0.1 | GO:0004616 | phosphogluconate dehydrogenase (decarboxylating) activity(GO:0004616) |
| 0.0 | 0.3 | GO:0032183 | SUMO binding(GO:0032183) |
| 0.0 | 0.2 | GO:0051378 | serotonin binding(GO:0051378) |
| 0.0 | 0.0 | GO:0003839 | gamma-glutamylcyclotransferase activity(GO:0003839) |
| 0.0 | 0.1 | GO:0004957 | prostaglandin E receptor activity(GO:0004957) |
| 0.0 | 0.1 | GO:0050692 | DBD domain binding(GO:0050692) |
Gene overrepresentation in curated gene sets: canonical pathways category:
| Log-likelihood per target | Total log-likelihood | Term | Description |
|---|---|---|---|
| 0.0 | 0.2 | PID ANTHRAX PATHWAY | Cellular roles of Anthrax toxin |
| 0.0 | 0.3 | PID ALK1 PATHWAY | ALK1 signaling events |
| 0.0 | 0.3 | PID IL8 CXCR1 PATHWAY | IL8- and CXCR1-mediated signaling events |
| 0.0 | 0.4 | PID RXR VDR PATHWAY | RXR and RAR heterodimerization with other nuclear receptor |
Gene overrepresentation in curated gene sets: REACTOME pathways category:
| Log-likelihood per target | Total log-likelihood | Term | Description |
|---|---|---|---|
| 0.0 | 0.3 | REACTOME GLYCOPROTEIN HORMONES | Genes involved in Glycoprotein hormones |
| 0.0 | 0.3 | REACTOME P2Y RECEPTORS | Genes involved in P2Y receptors |
| 0.0 | 0.3 | REACTOME SEROTONIN RECEPTORS | Genes involved in Serotonin receptors |
| 0.0 | 0.2 | REACTOME VITAMIN B5 PANTOTHENATE METABOLISM | Genes involved in Vitamin B5 (pantothenate) metabolism |
| 0.0 | 0.2 | REACTOME THE NLRP3 INFLAMMASOME | Genes involved in The NLRP3 inflammasome |
| 0.0 | 0.3 | REACTOME RNA POL I PROMOTER OPENING | Genes involved in RNA Polymerase I Promoter Opening |
| 0.0 | 0.3 | REACTOME CHONDROITIN SULFATE BIOSYNTHESIS | Genes involved in Chondroitin sulfate biosynthesis |
| 0.0 | 0.1 | REACTOME ORGANIC CATION ANION ZWITTERION TRANSPORT | Genes involved in Organic cation/anion/zwitterion transport |
| 0.0 | 0.3 | REACTOME ASSOCIATION OF LICENSING FACTORS WITH THE PRE REPLICATIVE COMPLEX | Genes involved in Association of licensing factors with the pre-replicative complex |
| 0.0 | 0.2 | REACTOME BILE SALT AND ORGANIC ANION SLC TRANSPORTERS | Genes involved in Bile salt and organic anion SLC transporters |
| 0.0 | 0.1 | REACTOME THE ACTIVATION OF ARYLSULFATASES | Genes involved in The activation of arylsulfatases |