Project
GSE49485: Hypoxia transcriptome sequencing of rat brain.
Navigation
Downloads
Results for Irx5
Z-value: 0.45
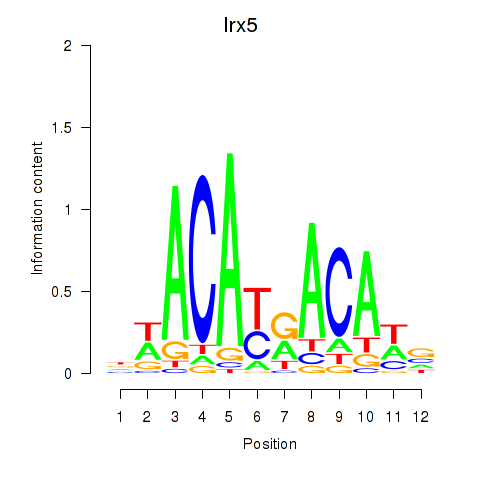
Motif logo
Transcription factors associated with Irx5
| Gene Symbol | Gene ID | Gene Info |
|---|---|---|
|
Irx5
|
ENSRNOG00000011180 | iroquois homeobox 5 |
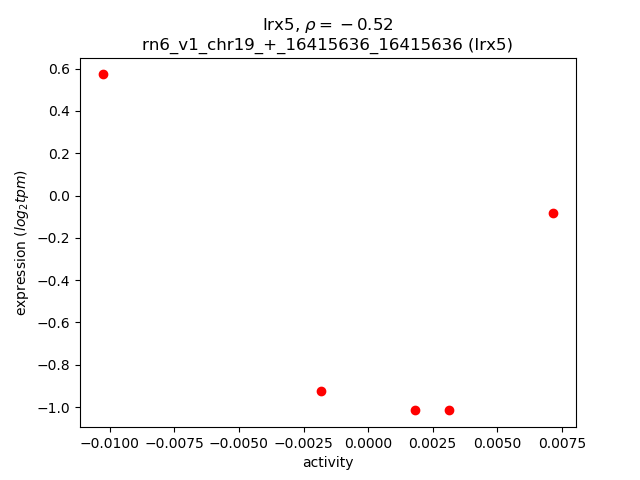
Activity-expression correlation:
| Gene | Promoter | Pearson corr. coef. | P-value | Plot |
|---|---|---|---|---|
| Irx5 | rn6_v1_chr19_+_16415636_16415636 | -0.52 | 3.7e-01 | Click! |
Activity profile of Irx5 motif
Sorted Z-values of Irx5 motif
| Promoter | Log-likelihood | Transcript | Gene | Gene Info |
|---|---|---|---|---|
| chr7_-_123638702 | 0.32 |
ENSRNOT00000082473
ENSRNOT00000044470 ENSRNOT00000092017 |
Cyp2d1
|
cytochrome P450, family 2, subfamily d, polypeptide 1 |
| chr7_-_123630045 | 0.22 |
ENSRNOT00000050002
|
Cyp2d1
|
cytochrome P450, family 2, subfamily d, polypeptide 1 |
| chr2_-_220838905 | 0.19 |
ENSRNOT00000078914
|
AABR07013065.1
|
|
| chr5_-_166116516 | 0.17 |
ENSRNOT00000079919
ENSRNOT00000080888 |
Kif1b
|
kinesin family member 1B |
| chr10_-_55997299 | 0.16 |
ENSRNOT00000074505
|
Cyb5d1
|
cytochrome b5 domain containing 1 |
| chr2_+_251200686 | 0.15 |
ENSRNOT00000019210
|
Col24a1
|
collagen type XXIV alpha 1 chain |
| chr20_-_19479325 | 0.14 |
ENSRNOT00000051491
|
Fam13c
|
family with sequence similarity 13, member C |
| chr9_-_45206427 | 0.11 |
ENSRNOT00000042227
|
Aff3
|
AF4/FMR2 family, member 3 |
| chr12_-_29743705 | 0.11 |
ENSRNOT00000001185
|
Caln1
|
calneuron 1 |
| chr17_-_86657473 | 0.11 |
ENSRNOT00000078827
|
AABR07028795.1
|
|
| chr19_+_755460 | 0.11 |
ENSRNOT00000076560
|
Dync1li2
|
dynein, cytoplasmic 1 light intermediate chain 2 |
| chr1_-_128287151 | 0.10 |
ENSRNOT00000084946
ENSRNOT00000089723 |
Mef2a
|
myocyte enhancer factor 2a |
| chr5_-_137125737 | 0.10 |
ENSRNOT00000088532
|
AABR07049768.1
|
|
| chr8_+_19888667 | 0.09 |
ENSRNOT00000078593
|
Zfp317
|
zinc finger protein 317 |
| chr3_+_40038336 | 0.09 |
ENSRNOT00000048804
|
Galnt13
|
polypeptide N-acetylgalactosaminyltransferase 13 |
| chr9_-_43454078 | 0.09 |
ENSRNOT00000023550
|
Tmem131
|
transmembrane protein 131 |
| chr7_-_59587382 | 0.08 |
ENSRNOT00000091427
ENSRNOT00000066396 |
Cnot2
|
CCR4-NOT transcription complex, subunit 2 |
| chr1_+_213737788 | 0.08 |
ENSRNOT00000020004
|
Pgghg
|
protein-glucosylgalactosylhydroxylysine glucosidase |
| chr11_-_1836897 | 0.08 |
ENSRNOT00000050533
|
Zfp654
|
zinc finger protein 654 |
| chr1_-_235813030 | 0.08 |
ENSRNOT00000014800
|
Vps13a
|
vacuolar protein sorting 13A |
| chr14_-_46153212 | 0.08 |
ENSRNOT00000079269
|
Nwd2
|
NACHT and WD repeat domain containing 2 |
| chr5_+_116420690 | 0.08 |
ENSRNOT00000087089
|
Nfia
|
nuclear factor I/A |
| chr6_+_26474071 | 0.07 |
ENSRNOT00000090342
|
Ift172
|
intraflagellar transport 172 |
| chr8_+_57936650 | 0.07 |
ENSRNOT00000089686
|
Exph5
|
exophilin 5 |
| chr17_-_22311392 | 0.07 |
ENSRNOT00000019389
|
Hivep1
|
human immunodeficiency virus type I enhancer binding protein 1 |
| chr10_-_36336628 | 0.06 |
ENSRNOT00000030035
|
Zfp879
|
zinc finger protein 879 |
| chr7_+_70987861 | 0.06 |
ENSRNOT00000072906
|
Nemp1
|
nuclear envelope integral membrane protein 1 |
| chr3_-_57270036 | 0.05 |
ENSRNOT00000075860
|
Mettl8
|
methyltransferase like 8 |
| chr10_-_52290657 | 0.05 |
ENSRNOT00000005293
|
Map2k4
|
mitogen activated protein kinase kinase 4 |
| chr7_-_123621102 | 0.05 |
ENSRNOT00000046024
|
Cyp2d5
|
cytochrome P450, family 2, subfamily d, polypeptide 5 |
| chr5_-_110832175 | 0.05 |
ENSRNOT00000052379
|
Cks1l
|
CDC28 protein kinase regulatory subunit 1-like |
| chr5_+_122390522 | 0.05 |
ENSRNOT00000064567
|
Sgip1
|
SH3-domain GRB2-like (endophilin) interacting protein 1 |
| chr18_-_28017925 | 0.05 |
ENSRNOT00000075420
|
Lrrtm2
|
leucine rich repeat transmembrane neuronal 2 |
| chr4_-_78342863 | 0.05 |
ENSRNOT00000049038
|
Gimap6
|
GTPase, IMAP family member 6 |
| chr7_-_15856676 | 0.05 |
ENSRNOT00000086553
|
AABR07055919.1
|
|
| chr2_+_104744461 | 0.05 |
ENSRNOT00000016083
ENSRNOT00000082627 |
Cp
|
ceruloplasmin |
| chr1_-_100969560 | 0.05 |
ENSRNOT00000035908
|
Cpt1c
|
carnitine palmitoyltransferase 1c |
| chr1_+_80141630 | 0.05 |
ENSRNOT00000029552
|
Opa3
|
optic atrophy 3 |
| chr2_+_149315189 | 0.04 |
ENSRNOT00000082464
|
Med12l
|
mediator complex subunit 12-like |
| chr17_+_76359022 | 0.04 |
ENSRNOT00000039621
ENSRNOT00000092481 |
Sec61a2
|
Sec61 translocon alpha 2 subunit |
| chr2_+_123617794 | 0.04 |
ENSRNOT00000080632
|
RGD1307100
|
similar to RIKEN cDNA D630029K19 |
| chr15_-_100348760 | 0.04 |
ENSRNOT00000085607
|
AABR07019341.1
|
|
| chr8_-_114013623 | 0.04 |
ENSRNOT00000018175
|
Atp2c1
|
ATPase secretory pathway Ca2+ transporting 1 |
| chr3_+_112916217 | 0.04 |
ENSRNOT00000030065
|
Tmem62
|
transmembrane protein 62 |
| chr7_+_26522314 | 0.04 |
ENSRNOT00000011572
|
Slc41a2
|
solute carrier family 41 member 2 |
| chr7_-_47928674 | 0.04 |
ENSRNOT00000038144
|
Mettl25
|
methyltransferase like 25 |
| chr4_+_31229913 | 0.04 |
ENSRNOT00000077134
ENSRNOT00000087897 |
Samd9l
|
sterile alpha motif domain containing 9-like |
| chr16_-_19637609 | 0.04 |
ENSRNOT00000021742
|
Zfp709
|
zinc finger protein 709 |
| chr8_-_50246656 | 0.04 |
ENSRNOT00000024240
|
Sidt2
|
SID1 transmembrane family, member 2 |
| chrX_-_119162518 | 0.03 |
ENSRNOT00000073176
|
LOC103694506
|
ubiquitin-conjugating enzyme E2 W |
| chr1_+_211543751 | 0.03 |
ENSRNOT00000049631
|
Lrrc27
|
leucine rich repeat containing 27 |
| chr9_+_52693831 | 0.03 |
ENSRNOT00000050275
|
Wdr75
|
WD repeat domain 75 |
| chr18_+_36596585 | 0.03 |
ENSRNOT00000036613
|
Rbm27
|
RNA binding motif protein 27 |
| chr3_+_134440195 | 0.03 |
ENSRNOT00000072928
|
AABR07054000.1
|
|
| chr14_+_108143869 | 0.02 |
ENSRNOT00000090003
|
Usp34
|
ubiquitin specific peptidase 34 |
| chr1_+_268189277 | 0.02 |
ENSRNOT00000065001
|
Sorcs3
|
sortilin-related VPS10 domain containing receptor 3 |
| chr7_+_122979021 | 0.02 |
ENSRNOT00000085707
|
Zc3h7b
|
zinc finger CCCH-type containing 7B |
| chr15_+_57241968 | 0.02 |
ENSRNOT00000082191
|
Lcp1
|
lymphocyte cytosolic protein 1 |
| chr9_+_65013862 | 0.02 |
ENSRNOT00000092906
ENSRNOT00000081146 |
Aox3
|
aldehyde oxidase 3 |
| chr13_+_57243877 | 0.02 |
ENSRNOT00000083693
|
Kcnt2
|
potassium sodium-activated channel subfamily T member 2 |
| chr4_+_21462779 | 0.02 |
ENSRNOT00000089747
|
Grm3
|
glutamate metabotropic receptor 3 |
| chr3_+_113102090 | 0.01 |
ENSRNOT00000016529
|
Adal
|
adenosine deaminase-like |
| chr13_+_49250301 | 0.01 |
ENSRNOT00000036110
|
Rbbp5
|
RB binding protein 5, histone lysine methyltransferase complex subunit |
| chr7_+_47928060 | 0.01 |
ENSRNOT00000005740
|
Ccdc59
|
coiled-coil domain containing 59 |
| chr17_+_45467015 | 0.01 |
ENSRNOT00000081408
|
Gpx5
|
glutathione peroxidase 5 |
| chr1_+_84652632 | 0.01 |
ENSRNOT00000041861
|
AABR07002774.2
|
|
| chr19_-_23944820 | 0.01 |
ENSRNOT00000080337
|
Zfp330
|
zinc finger protein 330 |
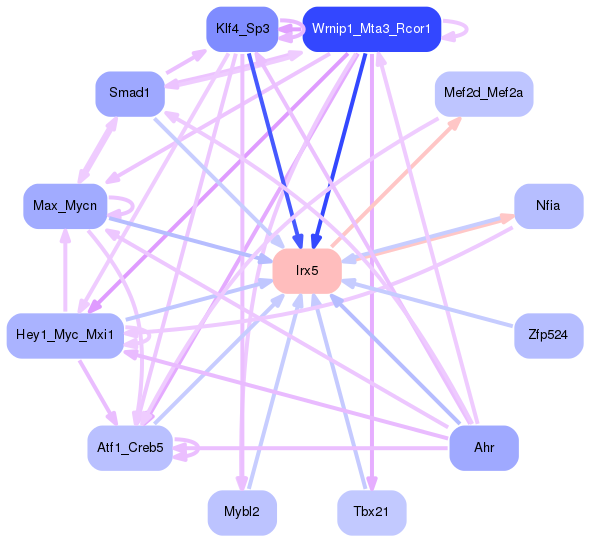
Network of associatons between targets according to the STRING database.

First level regulatory network of Irx5
Gene Ontology Analysis
Gene overrepresentation in biological process category:
| Log-likelihood per target | Total log-likelihood | Term | Description |
|---|---|---|---|
| 0.0 | 0.5 | GO:0042738 | exogenous drug catabolic process(GO:0042738) |
| 0.0 | 0.1 | GO:0055005 | ventricular cardiac myofibril assembly(GO:0055005) |
| 0.0 | 0.2 | GO:0019520 | aldonic acid metabolic process(GO:0019520) D-gluconate metabolic process(GO:0019521) |
| 0.0 | 0.0 | GO:0032472 | Golgi calcium ion transport(GO:0032472) |
| 0.0 | 0.1 | GO:0072709 | cellular response to sorbitol(GO:0072709) |
| 0.0 | 0.1 | GO:0010606 | positive regulation of cytoplasmic mRNA processing body assembly(GO:0010606) |
Gene overrepresentation in cellular component category:
| Log-likelihood per target | Total log-likelihood | Term | Description |
|---|---|---|---|
| 0.0 | 0.2 | GO:0071821 | FANCM-MHF complex(GO:0071821) |
| 0.0 | 0.1 | GO:0030015 | CCR4-NOT core complex(GO:0030015) |
| 0.0 | 0.1 | GO:0097598 | sperm cytoplasmic droplet(GO:0097598) |
Gene overrepresentation in molecular function category:
| Log-likelihood per target | Total log-likelihood | Term | Description |
|---|---|---|---|
| 0.0 | 0.2 | GO:0004616 | phosphogluconate dehydrogenase (decarboxylating) activity(GO:0004616) |
| 0.0 | 0.1 | GO:0001226 | RNA polymerase II transcription corepressor binding(GO:0001226) |
| 0.0 | 0.5 | GO:0070330 | aromatase activity(GO:0070330) |
| 0.0 | 0.1 | GO:0045504 | dynein heavy chain binding(GO:0045504) |
| 0.0 | 0.0 | GO:0004095 | carnitine O-palmitoyltransferase activity(GO:0004095) O-palmitoyltransferase activity(GO:0016416) |