Project
GSE49485: Hypoxia transcriptome sequencing of rat brain.
Navigation
Downloads
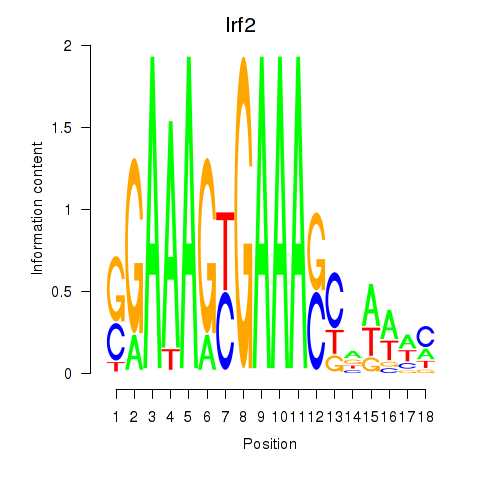
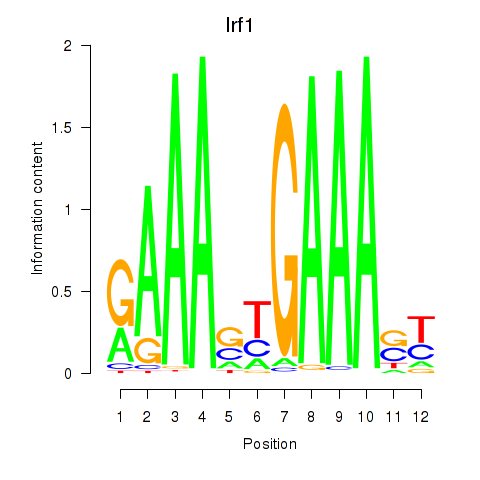
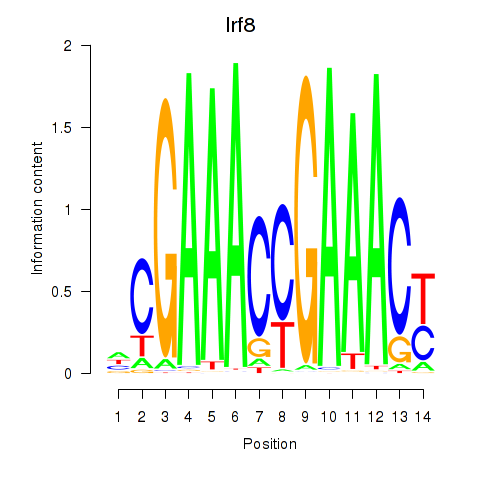
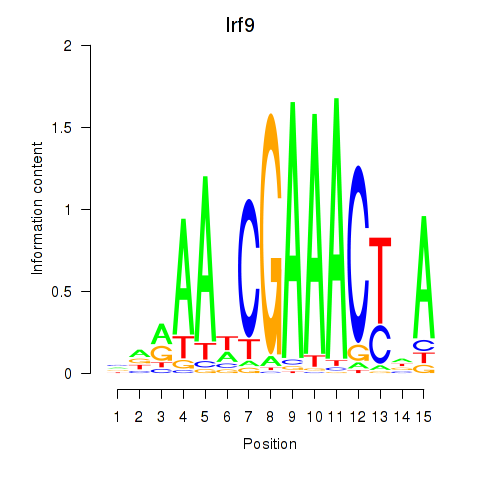
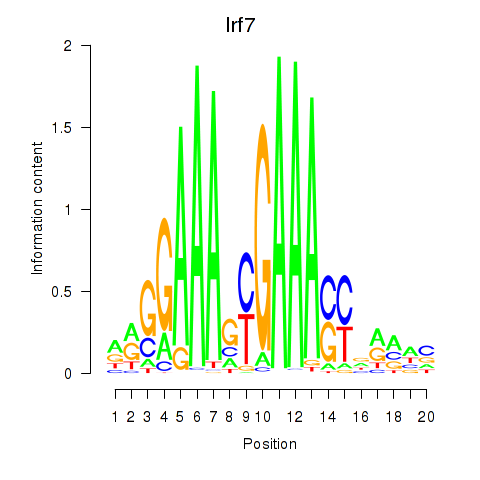
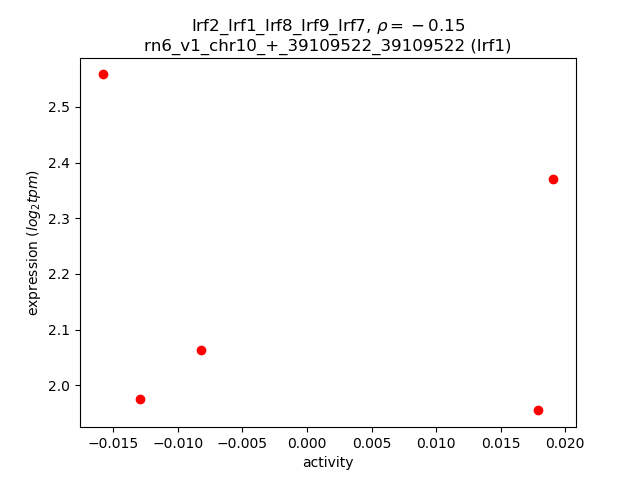
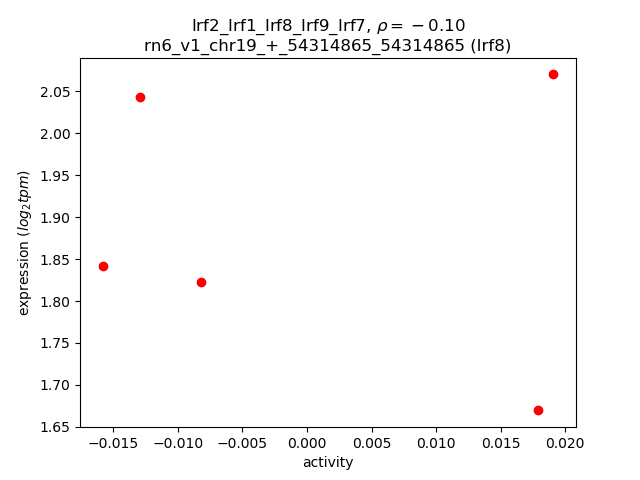
Results for Irf2_Irf1_Irf8_Irf9_Irf7
Z-value: 1.75
Motif logo
Transcription factors associated with Irf2_Irf1_Irf8_Irf9_Irf7
| Gene Symbol | Gene ID | Gene Info |
|---|---|---|
|
Irf2
|
ENSRNOG00000009824 | interferon regulatory factor 2 |
|
Irf1
|
ENSRNOG00000008144 | interferon regulatory factor 1 |
|
Irf8
|
ENSRNOG00000017869 | interferon regulatory factor 8 |
|
Irf9
|
ENSRNOG00000019478 | interferon regulatory factor 9 |
|
Irf7
|
ENSRNOG00000017414 | interferon regulatory factor 7 |
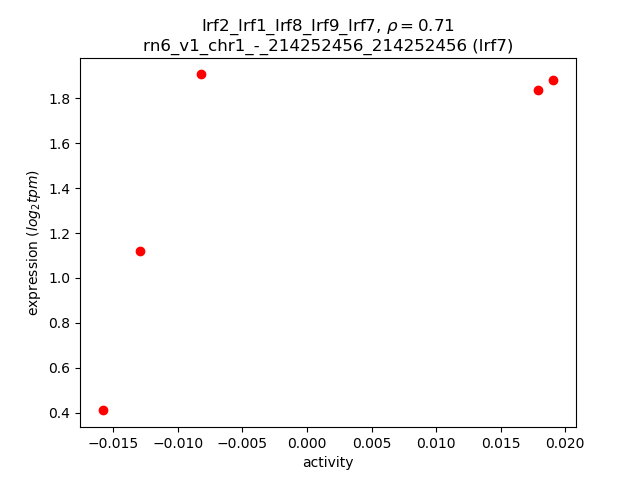
Activity-expression correlation:
| Gene | Promoter | Pearson corr. coef. | P-value | Plot |
|---|---|---|---|---|
| Irf7 | rn6_v1_chr1_-_214252456_214252456 | 0.71 | 1.8e-01 | Click! |
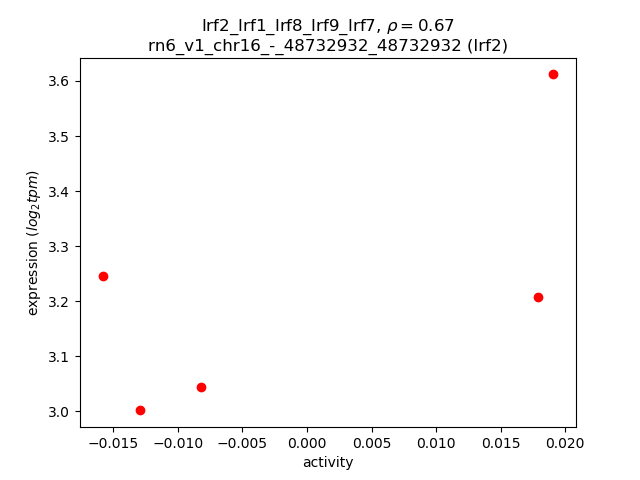
| Irf2 | rn6_v1_chr16_-_48732932_48732932 | 0.67 | 2.1e-01 | Click! |
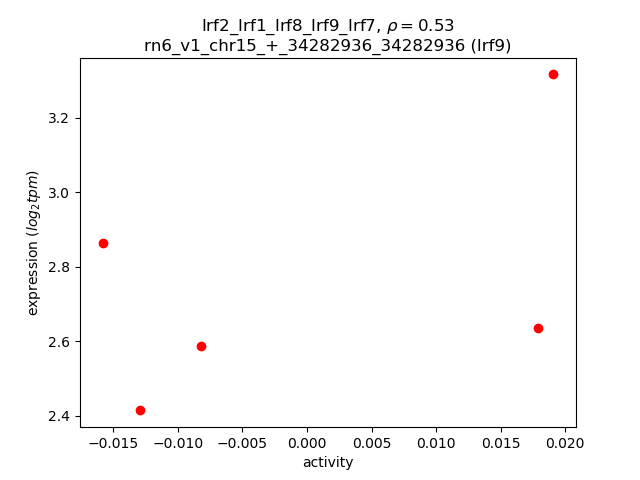
| Irf9 | rn6_v1_chr15_+_34282936_34282936 | 0.53 | 3.6e-01 | Click! |
| Irf1 | rn6_v1_chr10_+_39109522_39109522 | -0.15 | 8.1e-01 | Click! |
| Irf8 | rn6_v1_chr19_+_54314865_54314865 | -0.10 | 8.7e-01 | Click! |
Activity profile of Irf2_Irf1_Irf8_Irf9_Irf7 motif
Sorted Z-values of Irf2_Irf1_Irf8_Irf9_Irf7 motif
| Promoter | Log-likelihood | Transcript | Gene | Gene Info |
|---|---|---|---|---|
| chr12_-_47482961 | 1.81 |
ENSRNOT00000001600
|
Oasl2
|
2'-5' oligoadenylate synthetase-like 2 |
| chr1_-_214252456 | 1.26 |
ENSRNOT00000023504
|
Irf7
|
interferon regulatory factor 7 |
| chr2_+_248276709 | 1.01 |
ENSRNOT00000068683
|
Gbp2
|
guanylate binding protein 2 |
| chr2_-_256915563 | 0.97 |
ENSRNOT00000084873
ENSRNOT00000029990 |
Ifi44
|
interferon-induced protein 44 |
| chr15_+_60084918 | 0.88 |
ENSRNOT00000012632
|
Epsti1
|
epithelial stromal interaction 1 |
| chr20_+_3979035 | 0.82 |
ENSRNOT00000000529
|
Tap1
|
transporter 1, ATP binding cassette subfamily B member |
| chr2_+_248178389 | 0.74 |
ENSRNOT00000037339
|
Gbp5
|
guanylate binding protein 5 |
| chr10_+_34277993 | 0.73 |
ENSRNOT00000055872
ENSRNOT00000003343 |
Ifi47
|
interferon gamma inducible protein 47 |
| chr4_+_153805993 | 0.70 |
ENSRNOT00000056174
|
Usp18
|
ubiquitin specific peptidase 18 |
| chr11_+_38035450 | 0.68 |
ENSRNOT00000083067
|
Mx2
|
MX dynamin like GTPase 2 |
| chr1_+_1545134 | 0.68 |
ENSRNOT00000044523
|
AABR07000156.1
|
|
| chr20_-_3978845 | 0.64 |
ENSRNOT00000000532
|
Psmb9
|
proteasome subunit beta 9 |
| chr4_-_66899914 | 0.62 |
ENSRNOT00000011481
|
Parp12
|
poly (ADP-ribose) polymerase family, member 12 |
| chr9_-_44483655 | 0.62 |
ENSRNOT00000024959
|
Mitd1
|
microtubule interacting and trafficking domain containing 1 |
| chr11_+_68105369 | 0.62 |
ENSRNOT00000046888
|
Parp14
|
poly (ADP-ribose) polymerase family, member 14 |
| chr5_-_173626248 | 0.61 |
ENSRNOT00000039263
|
Isg15
|
ISG15 ubiquitin-like modifier |
| chr8_+_2604962 | 0.60 |
ENSRNOT00000009993
|
Casp1
|
caspase 1 |
| chr10_+_64737022 | 0.59 |
ENSRNOT00000017071
ENSRNOT00000093232 ENSRNOT00000017042 ENSRNOT00000093244 |
Lgals9
|
galectin 9 |
| chr3_-_37445907 | 0.59 |
ENSRNOT00000006172
|
Rbm43
|
RNA binding motif protein 43 |
| chr10_-_34221928 | 0.59 |
ENSRNOT00000045545
|
Irgm
|
immunity-related GTPase M |
| chr10_+_58860940 | 0.56 |
ENSRNOT00000056551
ENSRNOT00000074523 |
XAF1
|
XIAP associated factor-1 |
| chr1_-_198008893 | 0.55 |
ENSRNOT00000025950
|
Il27
|
interleukin 27 |
| chr4_+_179398621 | 0.54 |
ENSRNOT00000049474
ENSRNOT00000067506 |
Lrmp
|
lymphoid-restricted membrane protein |
| chr14_+_17210733 | 0.54 |
ENSRNOT00000003075
|
Cxcl10
|
C-X-C motif chemokine ligand 10 |
| chr9_-_44560837 | 0.52 |
ENSRNOT00000090870
|
Mitd1
|
microtubule interacting and trafficking domain containing 1 |
| chr2_+_216863428 | 0.48 |
ENSRNOT00000068413
|
Col11a1
|
collagen type XI alpha 1 chain |
| chr12_+_25497104 | 0.46 |
ENSRNOT00000002028
|
Ncf1
|
neutrophil cytosolic factor 1 |
| chr17_+_9236249 | 0.45 |
ENSRNOT00000015878
|
Tifab
|
TIFA inhibitor |
| chr15_-_61772516 | 0.43 |
ENSRNOT00000015605
ENSRNOT00000093399 |
Wbp4
|
WW domain binding protein 4 |
| chr5_-_79570073 | 0.42 |
ENSRNOT00000011845
|
Tnfsf15
|
tumor necrosis factor superfamily member 15 |
| chr20_-_3166569 | 0.42 |
ENSRNOT00000091390
|
AABR07044362.1
|
|
| chr4_-_88649216 | 0.41 |
ENSRNOT00000058626
|
Herc6
|
HECT and RLD domain containing E3 ubiquitin protein ligase family member 6 |
| chr8_+_96551245 | 0.41 |
ENSRNOT00000039850
|
Bcl2a1
|
BCL2-related protein A1 |
| chr17_-_69827112 | 0.41 |
ENSRNOT00000023835
|
Akr1c14
|
aldo-keto reductase family 1, member C14 |
| chr1_+_142679345 | 0.41 |
ENSRNOT00000034267
|
Zscan2
|
zinc finger and SCAN domain containing 2 |
| chr11_+_67757928 | 0.41 |
ENSRNOT00000039215
|
Dtx3l
|
deltex E3 ubiquitin ligase 3L |
| chr4_-_22424862 | 0.41 |
ENSRNOT00000082359
|
Abcb1a
|
ATP binding cassette subfamily B member 1A |
| chr1_+_252894663 | 0.41 |
ENSRNOT00000054757
|
Ifit2
|
interferon-induced protein with tetratricopeptide repeats 2 |
| chr1_+_101517714 | 0.38 |
ENSRNOT00000028423
|
Plekha4
|
pleckstrin homology domain containing A4 |
| chr3_-_171286413 | 0.38 |
ENSRNOT00000008365
ENSRNOT00000081036 |
Zbp1
|
Z-DNA binding protein 1 |
| chr13_+_44475970 | 0.37 |
ENSRNOT00000024602
ENSRNOT00000091645 |
Ccnt2
|
cyclin T2 |
| chr16_-_19942343 | 0.37 |
ENSRNOT00000087162
ENSRNOT00000091906 |
Bst2
|
bone marrow stromal cell antigen 2 |
| chr7_-_36000906 | 0.37 |
ENSRNOT00000011178
|
Plxnc1
|
plexin C1 |
| chr1_-_169463760 | 0.36 |
ENSRNOT00000023100
|
Trim30c
|
tripartite motif-containing 30C |
| chr19_-_37912027 | 0.35 |
ENSRNOT00000026462
|
Psmb10
|
proteasome subunit beta 10 |
| chr18_+_55685613 | 0.35 |
ENSRNOT00000040116
|
MGC105567
|
similar to cDNA sequence BC023105 |
| chr7_-_117300662 | 0.35 |
ENSRNOT00000006376
|
Parp10
|
poly (ADP-ribose) polymerase family, member 10 |
| chr9_-_92616165 | 0.34 |
ENSRNOT00000056995
|
Sp110
|
SP110 nuclear body protein |
| chr16_+_50111306 | 0.33 |
ENSRNOT00000019302
|
Cyp4v3
|
cytochrome P450, family 4, subfamily v, polypeptide 3 |
| chr3_+_120726906 | 0.33 |
ENSRNOT00000051069
|
Bcl2l11
|
BCL2 like 11 |
| chr17_-_32661865 | 0.33 |
ENSRNOT00000022194
|
Serpinb9
|
serpin family B member 9 |
| chr2_-_207300854 | 0.33 |
ENSRNOT00000018061
|
Mov10
|
Mov10 RISC complex RNA helicase |
| chr13_+_48790767 | 0.33 |
ENSRNOT00000087504
|
Elk4
|
ELK4, ETS transcription factor |
| chr17_-_47653989 | 0.33 |
ENSRNOT00000072833
|
LOC498759
|
LRRGT00094 |
| chr3_-_29984201 | 0.31 |
ENSRNOT00000006350
|
Zeb2
|
zinc finger E-box binding homeobox 2 |
| chr5_-_56536772 | 0.31 |
ENSRNOT00000060765
|
Ddx58
|
DEXD/H-box helicase 58 |
| chr11_+_38035611 | 0.30 |
ENSRNOT00000087603
ENSRNOT00000002695 |
Mx2
|
MX dynamin like GTPase 2 |
| chr2_+_248249468 | 0.30 |
ENSRNOT00000022648
|
Gbp4
|
guanylate binding protein 4 |
| chr10_-_57064600 | 0.29 |
ENSRNOT00000032926
|
Cxcl16
|
C-X-C motif chemokine ligand 16 |
| chr9_-_63641400 | 0.29 |
ENSRNOT00000087684
|
Satb2
|
SATB homeobox 2 |
| chr16_-_20383337 | 0.29 |
ENSRNOT00000025977
|
Il12rb1
|
interleukin 12 receptor subunit beta 1 |
| chr3_+_177397892 | 0.29 |
ENSRNOT00000078261
|
AABR07054983.1
|
|
| chr10_-_38969501 | 0.28 |
ENSRNOT00000090691
ENSRNOT00000081309 ENSRNOT00000010029 |
Il4
|
interleukin 4 |
| chr8_+_48805684 | 0.28 |
ENSRNOT00000064041
|
Bcl9l
|
B-cell CLL/lymphoma 9-like |
| chr1_-_261446570 | 0.28 |
ENSRNOT00000020182
|
Sfrp5
|
secreted frizzled-related protein 5 |
| chr17_+_36334147 | 0.28 |
ENSRNOT00000050261
|
E2f3
|
E2F transcription factor 3 |
| chr18_+_55576239 | 0.27 |
ENSRNOT00000050063
|
LOC100910979
|
interferon-inducible GTPase 1-like |
| chr4_+_67165883 | 0.27 |
ENSRNOT00000012280
|
Rab19
|
RAB19, member RAS oncogene family |
| chr1_+_226897625 | 0.27 |
ENSRNOT00000029443
|
Slc15a3
|
solute carrier family 15 member 3 |
| chr1_-_218100272 | 0.27 |
ENSRNOT00000028411
ENSRNOT00000088588 |
Ccnd1
|
cyclin D1 |
| chr9_-_54327958 | 0.26 |
ENSRNOT00000019465
|
Stat1
|
signal transducer and activator of transcription 1 |
| chr2_+_166475070 | 0.25 |
ENSRNOT00000071111
|
AABR07011700.1
|
|
| chr11_+_45888221 | 0.24 |
ENSRNOT00000071932
ENSRNOT00000066008 ENSRNOT00000060802 |
Lnp1
|
leukemia NUP98 fusion partner 1 |
| chr1_+_140601791 | 0.24 |
ENSRNOT00000091588
|
Isg20
|
interferon stimulated exonuclease gene 20 |
| chr20_+_22060224 | 0.24 |
ENSRNOT00000057992
|
Zfp365
|
zinc finger protein 365 |
| chr13_+_48790951 | 0.24 |
ENSRNOT00000090233
|
Elk4
|
ELK4, ETS transcription factor |
| chr12_+_41200718 | 0.23 |
ENSRNOT00000038426
ENSRNOT00000048450 ENSRNOT00000067176 |
Oas1a
|
2'-5' oligoadenylate synthetase 1A |
| chr3_+_58164931 | 0.23 |
ENSRNOT00000002078
|
Dlx1
|
distal-less homeobox 1 |
| chrX_+_11648989 | 0.23 |
ENSRNOT00000041003
|
Bcor
|
BCL6 co-repressor |
| chr7_+_132857628 | 0.22 |
ENSRNOT00000005438
|
Lrrk2
|
leucine-rich repeat kinase 2 |
| chr20_-_4542073 | 0.22 |
ENSRNOT00000000477
|
Cfb
|
complement factor B |
| chr8_-_119889661 | 0.22 |
ENSRNOT00000011780
|
Stac
|
SH3 and cysteine rich domain |
| chr9_+_60039297 | 0.22 |
ENSRNOT00000016262
|
Slc39a10
|
solute carrier family 39 member 10 |
| chr13_+_93684437 | 0.20 |
ENSRNOT00000005005
|
Kmo
|
kynurenine 3-monooxygenase |
| chr2_+_209097927 | 0.20 |
ENSRNOT00000023807
|
Dennd2d
|
DENN domain containing 2D |
| chr2_-_98610368 | 0.20 |
ENSRNOT00000011641
|
Zfhx4
|
zinc finger homeobox 4 |
| chr12_-_19254527 | 0.19 |
ENSRNOT00000089349
|
AABR07035541.3
|
|
| chr20_-_5179217 | 0.19 |
ENSRNOT00000065940
ENSRNOT00000092443 |
Lst1
|
leukocyte specific transcript 1 |
| chr2_+_52358097 | 0.19 |
ENSRNOT00000037659
|
Tmem267
|
transmembrane protein 267 |
| chr8_-_47529689 | 0.19 |
ENSRNOT00000012826
|
Oaf
|
out at first homolog |
| chr6_-_50923510 | 0.19 |
ENSRNOT00000010631
|
Bcap29
|
B-cell receptor-associated protein 29 |
| chr16_-_19791832 | 0.19 |
ENSRNOT00000040393
|
Ushbp1
|
USH1 protein network component harmonin binding protein 1 |
| chr1_-_205750786 | 0.19 |
ENSRNOT00000023946
|
Mmp21
|
matrix metallopeptidase 21 |
| chr2_-_34452895 | 0.19 |
ENSRNOT00000079385
|
AABR07007905.2
|
|
| chr20_-_35450513 | 0.18 |
ENSRNOT00000087342
|
Man1a1
|
mannosidase, alpha, class 1A, member 1 |
| chr7_-_52404774 | 0.18 |
ENSRNOT00000082100
|
Nav3
|
neuron navigator 3 |
| chr5_-_126096068 | 0.18 |
ENSRNOT00000036793
|
AABR07073134.1
|
|
| chr12_-_44962656 | 0.18 |
ENSRNOT00000001499
|
Wsb2
|
WD repeat and SOCS box-containing 2 |
| chr3_-_163814799 | 0.18 |
ENSRNOT00000055127
|
Znfx1
|
zinc finger, NFX1-type containing 1 |
| chrX_-_10031167 | 0.18 |
ENSRNOT00000060988
|
Gpr34
|
G protein-coupled receptor 34 |
| chr1_-_101236065 | 0.18 |
ENSRNOT00000066834
|
Cd37
|
CD37 molecule |
| chr1_+_265298868 | 0.17 |
ENSRNOT00000023278
|
Dpcd
|
deleted in primary ciliary dyskinesia |
| chr14_+_12218553 | 0.17 |
ENSRNOT00000003237
|
Prkg2
|
protein kinase, cGMP-dependent, type II |
| chr7_+_116889572 | 0.17 |
ENSRNOT00000075917
|
Gsdmd
|
gasdermin D |
| chr8_-_63034226 | 0.17 |
ENSRNOT00000043434
|
Pml
|
promyelocytic leukemia |
| chrX_+_135187468 | 0.17 |
ENSRNOT00000006805
|
Bcorl1
|
BCL6 co-repressor-like 1 |
| chr3_+_114087287 | 0.16 |
ENSRNOT00000023017
|
B2m
|
beta-2 microglobulin |
| chr13_-_82129989 | 0.16 |
ENSRNOT00000078963
|
AC124874.1
|
|
| chr5_-_158439078 | 0.16 |
ENSRNOT00000025517
|
Klhdc7a
|
kelch domain containing 7A |
| chr17_-_44840131 | 0.16 |
ENSRNOT00000083417
|
Hist1h3b
|
histone cluster 1, H3b |
| chr5_+_27326762 | 0.16 |
ENSRNOT00000066191
|
Runx1t1
|
RUNX1 translocation partner 1 |
| chr20_-_50564987 | 0.16 |
ENSRNOT00000034485
ENSRNOT00000064466 |
Lin28b
|
lin-28 homolog B |
| chr10_+_57064482 | 0.16 |
ENSRNOT00000046807
|
Zmynd15
|
zinc finger, MYND-type containing 15 |
| chr5_-_58198782 | 0.15 |
ENSRNOT00000023951
|
Ccl21
|
C-C motif chemokine ligand 21 |
| chr3_-_48604097 | 0.15 |
ENSRNOT00000009620
|
Ifih1
|
interferon induced with helicase C domain 1 |
| chr8_-_124399494 | 0.15 |
ENSRNOT00000037883
|
Tgfbr2
|
transforming growth factor, beta receptor 2 |
| chr18_+_30581530 | 0.15 |
ENSRNOT00000048166
|
Pcdhb20
|
protocadherin beta 20 |
| chr4_+_162934195 | 0.15 |
ENSRNOT00000090939
|
Clec2g
|
C-type lectin domain family 2, member G |
| chr3_-_119405300 | 0.15 |
ENSRNOT00000015568
|
Sppl2a
|
signal peptide peptidase-like 2A |
| chr5_-_133067245 | 0.15 |
ENSRNOT00000033163
|
Skint10
|
selection and upkeep of intraepithelial T cells 10 |
| chr10_-_70744315 | 0.15 |
ENSRNOT00000014865
|
Ccl5
|
C-C motif chemokine ligand 5 |
| chr10_+_28243 | 0.14 |
ENSRNOT00000003193
ENSRNOT00000087156 |
LOC103689943
|
meiosis arrest female protein 1-like |
| chr15_-_90175802 | 0.14 |
ENSRNOT00000013342
|
Spry2
|
sprouty RTK signaling antagonist 2 |
| chr13_+_48644604 | 0.14 |
ENSRNOT00000084259
ENSRNOT00000073669 |
Rab29
|
RAB29, member RAS oncogene family |
| chr1_-_1889236 | 0.14 |
ENSRNOT00000087944
|
AABR07000159.2
|
|
| chrX_+_14578264 | 0.14 |
ENSRNOT00000038994
|
Cybb
|
cytochrome b-245 beta chain |
| chr6_+_135866739 | 0.14 |
ENSRNOT00000013460
|
Exoc3l4
|
exocyst complex component 3-like 4 |
| chr2_+_22950018 | 0.14 |
ENSRNOT00000071804
|
Homer1
|
homer scaffolding protein 1 |
| chr14_+_113530470 | 0.14 |
ENSRNOT00000004919
|
Pnpt1
|
polyribonucleotide nucleotidyltransferase 1 |
| chr2_-_149444548 | 0.14 |
ENSRNOT00000018600
|
P2ry12
|
purinergic receptor P2Y12 |
| chr4_+_22859622 | 0.14 |
ENSRNOT00000073501
ENSRNOT00000068410 |
Adam22
|
ADAM metallopeptidase domain 22 |
| chr14_-_6587141 | 0.14 |
ENSRNOT00000061664
|
LOC679894
|
similar to THO complex subunit 2 (Tho2) |
| chr1_+_169433539 | 0.14 |
ENSRNOT00000055210
|
Trim34
|
tripartite motif-containing 34 |
| chr7_-_122644054 | 0.14 |
ENSRNOT00000025941
|
Dnajb7
|
DnaJ heat shock protein family (Hsp40) member B7 |
| chr8_+_116754178 | 0.14 |
ENSRNOT00000068295
ENSRNOT00000084429 |
Uba7
|
ubiquitin-like modifier activating enzyme 7 |
| chr1_+_84009268 | 0.14 |
ENSRNOT00000057230
ENSRNOT00000081121 |
RGD1560854
|
similar to FLJ41131 protein |
| chr13_+_37400476 | 0.14 |
ENSRNOT00000003435
|
Ccdc93
|
coiled-coil domain containing 93 |
| chr16_+_50016857 | 0.13 |
ENSRNOT00000035781
|
Tlr3
|
toll-like receptor 3 |
| chr13_-_82607379 | 0.13 |
ENSRNOT00000051763
|
Blzf1
|
basic leucine zipper nuclear factor 1 |
| chr3_-_95418679 | 0.13 |
ENSRNOT00000018074
|
Rcn1
|
reticulocalbin 1 |
| chr10_+_89358376 | 0.13 |
ENSRNOT00000028067
|
Ifi35
|
interferon-induced protein 35 |
| chr18_-_1389929 | 0.13 |
ENSRNOT00000051362
|
Rock1
|
Rho-associated coiled-coil containing protein kinase 1 |
| chr16_-_19349080 | 0.13 |
ENSRNOT00000038494
|
Hsh2d
|
hematopoietic SH2 domain containing |
| chr3_-_163935617 | 0.13 |
ENSRNOT00000074023
|
Kcnb1
|
potassium voltage-gated channel subfamily B member 1 |
| chr1_-_239057732 | 0.13 |
ENSRNOT00000024775
|
Gda
|
guanine deaminase |
| chr3_+_161519743 | 0.13 |
ENSRNOT00000055148
|
Cd40
|
CD40 molecule |
| chr7_+_118685181 | 0.13 |
ENSRNOT00000068221
|
Apol3
|
apolipoprotein L, 3 |
| chr8_+_130366775 | 0.13 |
ENSRNOT00000071152
|
Nktr
|
natural killer cell triggering receptor |
| chr3_+_64190973 | 0.13 |
ENSRNOT00000011342
|
AABR07052587.1
|
|
| chr1_+_30681681 | 0.13 |
ENSRNOT00000015395
|
Rspo3
|
R-spondin 3 |
| chr3_+_100788806 | 0.13 |
ENSRNOT00000083289
ENSRNOT00000090445 |
Bdnf
|
brain-derived neurotrophic factor |
| chr8_+_103774358 | 0.13 |
ENSRNOT00000014481
|
Xrn1
|
5'-3' exoribonuclease 1 |
| chr2_-_210550490 | 0.13 |
ENSRNOT00000081835
ENSRNOT00000025222 ENSRNOT00000086403 |
Csf1
|
colony stimulating factor 1 |
| chr10_+_89578212 | 0.13 |
ENSRNOT00000028178
|
Arl4d
|
ADP-ribosylation factor like GTPase 4D |
| chr5_+_25253010 | 0.12 |
ENSRNOT00000061333
|
Rbm12b
|
RNA binding motif protein 12B |
| chr10_-_88611105 | 0.12 |
ENSRNOT00000024718
|
Dhx58
|
DEXH-box helicase 58 |
| chr18_+_56071478 | 0.12 |
ENSRNOT00000025344
ENSRNOT00000025354 |
Cd74
|
CD74 molecule |
| chr5_+_64053946 | 0.12 |
ENSRNOT00000011622
|
Invs
|
inversin |
| chr13_+_99663150 | 0.12 |
ENSRNOT00000036705
|
Cnih3
|
cornichon family AMPA receptor auxiliary protein 3 |
| chr15_+_34256071 | 0.12 |
ENSRNOT00000025887
|
Psme1
|
proteasome activator subunit 1 |
| chr8_-_76940094 | 0.12 |
ENSRNOT00000082709
ENSRNOT00000084313 |
Rnf111
|
ring finger protein 111 |
| chr1_-_213818222 | 0.12 |
ENSRNOT00000054875
|
Ifitm6
|
interferon induced transmembrane protein 6 |
| chr8_-_83280888 | 0.12 |
ENSRNOT00000052341
|
Gfral
|
GDNF family receptor alpha like |
| chr2_+_189062443 | 0.12 |
ENSRNOT00000028181
|
Adar
|
adenosine deaminase, RNA-specific |
| chr8_+_127702534 | 0.12 |
ENSRNOT00000075793
|
Ctdspl
|
CTD small phosphatase like |
| chr3_-_147809658 | 0.11 |
ENSRNOT00000085995
ENSRNOT00000045314 |
Rbck1
|
RANBP2-type and C3HC4-type zinc finger containing 1 |
| chr12_+_23514981 | 0.11 |
ENSRNOT00000001937
|
Prkrip1
|
Prkr interacting protein 1 (IL11 inducible) |
| chr10_-_107424710 | 0.11 |
ENSRNOT00000004320
|
Lgals3bp
|
galectin 3 binding protein |
| chr5_-_142681173 | 0.11 |
ENSRNOT00000009882
|
Utp11
|
UTP11, small subunit processome component homolog (S. cerevisiae) |
| chr11_+_15436269 | 0.11 |
ENSRNOT00000002150
ENSRNOT00000084928 |
Usp25
|
ubiquitin specific peptidase 25 |
| chr5_+_25725683 | 0.11 |
ENSRNOT00000087602
|
LOC679087
|
similar to swan |
| chrX_-_74968405 | 0.11 |
ENSRNOT00000035653
|
RGD1561931
|
similar to KIAA2022 protein |
| chr3_-_107760550 | 0.11 |
ENSRNOT00000077091
ENSRNOT00000051638 |
Meis2
|
Meis homeobox 2 |
| chr15_+_27933211 | 0.11 |
ENSRNOT00000013619
|
Rnase10
|
ribonuclease A family member 10 |
| chr10_-_15928169 | 0.11 |
ENSRNOT00000028069
|
Nsg2
|
neuron specific gene family member 2 |
| chr14_+_8080275 | 0.11 |
ENSRNOT00000065965
ENSRNOT00000092542 |
Mapk10
|
mitogen activated protein kinase 10 |
| chr2_+_2456735 | 0.11 |
ENSRNOT00000032974
|
Ell2
|
elongation factor for RNA polymerase II 2 |
| chr19_-_31942180 | 0.11 |
ENSRNOT00000024924
|
Otud4
|
OTU deubiquitinase 4 |
| chr16_-_32439421 | 0.11 |
ENSRNOT00000043100
|
Nek1
|
NIMA-related kinase 1 |
| chr15_+_36809361 | 0.11 |
ENSRNOT00000076667
|
Parp4
|
poly (ADP-ribose) polymerase family, member 4 |
| chr10_+_76343847 | 0.11 |
ENSRNOT00000055674
|
Trim25
|
tripartite motif-containing 25 |
| chr2_-_149432106 | 0.11 |
ENSRNOT00000051027
|
P2ry13
|
purinergic receptor P2Y13 |
| chr20_-_19479325 | 0.11 |
ENSRNOT00000051491
|
Fam13c
|
family with sequence similarity 13, member C |
| chr4_-_163214678 | 0.11 |
ENSRNOT00000091602
|
Clec1a
|
C-type lectin domain family 1, member A |
| chr1_-_197886759 | 0.11 |
ENSRNOT00000074274
|
Sh2b1
|
SH2B adaptor protein 1 |
| chr3_-_2474913 | 0.11 |
ENSRNOT00000014445
|
Ndor1
|
NADPH dependent diflavin oxidoreductase 1 |
| chr10_-_104155717 | 0.10 |
ENSRNOT00000089894
|
Gga3
|
golgi associated, gamma adaptin ear containing, ARF binding protein 3 |
| chr9_+_65534704 | 0.10 |
ENSRNOT00000016730
|
Cflar
|
CASP8 and FADD-like apoptosis regulator |
| chr10_+_108527740 | 0.10 |
ENSRNOT00000044983
|
Rnf213
|
ring finger protein 213 |
| chr1_-_101131413 | 0.10 |
ENSRNOT00000093729
|
Flt3lg
|
fms-related tyrosine kinase 3 ligand |
| chr13_-_82005741 | 0.10 |
ENSRNOT00000076404
|
Mettl11b
|
methyltransferase like 11B |
| chr7_+_23403891 | 0.10 |
ENSRNOT00000037918
|
Syn3
|
synapsin III |
| chr7_-_118933812 | 0.10 |
ENSRNOT00000031951
|
Apol9a
|
apolipoprotein L 9a |
| chr1_-_141579871 | 0.10 |
ENSRNOT00000020002
|
Anpep
|
alanyl aminopeptidase, membrane |
| chr5_+_79382096 | 0.10 |
ENSRNOT00000085461
|
Tmem268
|
transmembrane protein 268 |
| chr8_+_21663325 | 0.10 |
ENSRNOT00000027749
|
Ubl5
|
ubiquitin-like 5 |
| chr1_+_64046377 | 0.10 |
ENSRNOT00000085010
|
Tmc4
|
transmembrane channel-like 4 |
| chr5_+_68717519 | 0.10 |
ENSRNOT00000066226
|
Smc2
|
structural maintenance of chromosomes 2 |
| chr19_-_49510901 | 0.10 |
ENSRNOT00000082929
ENSRNOT00000079969 |
LOC687399
|
hypothetical protein LOC687399 |
| chr3_+_80555196 | 0.10 |
ENSRNOT00000067318
|
Arhgap1
|
Rho GTPase activating protein 1 |
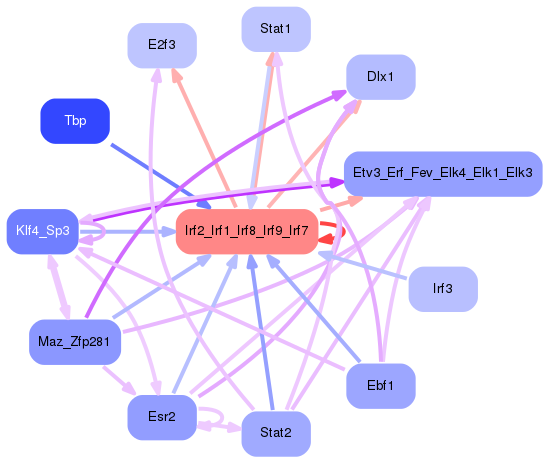
Network of associatons between targets according to the STRING database.

First level regulatory network of Irf2_Irf1_Irf8_Irf9_Irf7
Gene Ontology Analysis
Gene overrepresentation in biological process category:
| Log-likelihood per target | Total log-likelihood | Term | Description |
|---|---|---|---|
| 0.2 | 0.7 | GO:0046967 | cytosol to ER transport(GO:0046967) peptide antigen transport(GO:0046968) |
| 0.2 | 1.3 | GO:0034124 | regulation of MyD88-dependent toll-like receptor signaling pathway(GO:0034124) |
| 0.2 | 0.6 | GO:1901423 | response to benzene(GO:1901423) |
| 0.2 | 0.5 | GO:0070946 | neutrophil mediated killing of gram-positive bacterium(GO:0070946) |
| 0.2 | 0.8 | GO:0032020 | ISG15-protein conjugation(GO:0032020) |
| 0.1 | 0.6 | GO:0050717 | positive regulation of interleukin-1 alpha secretion(GO:0050717) |
| 0.1 | 0.4 | GO:0007356 | thorax and anterior abdomen determination(GO:0007356) |
| 0.1 | 0.7 | GO:2000563 | positive regulation of CD4-positive, alpha-beta T cell proliferation(GO:2000563) |
| 0.1 | 0.4 | GO:1901252 | regulation of intracellular transport of viral material(GO:1901252) |
| 0.1 | 0.4 | GO:1902748 | positive regulation of lens fiber cell differentiation(GO:1902748) |
| 0.1 | 0.4 | GO:0019086 | late viral transcription(GO:0019086) |
| 0.1 | 0.3 | GO:0010847 | regulation of chromatin assembly(GO:0010847) protein poly-ADP-ribosylation(GO:0070212) |
| 0.1 | 1.1 | GO:0071985 | multivesicular body sorting pathway(GO:0071985) |
| 0.1 | 0.5 | GO:1901509 | regulation of endothelial tube morphogenesis(GO:1901509) |
| 0.1 | 3.7 | GO:0035458 | cellular response to interferon-beta(GO:0035458) |
| 0.1 | 0.9 | GO:0003374 | dynamin polymerization involved in membrane fission(GO:0003373) dynamin polymerization involved in mitochondrial fission(GO:0003374) |
| 0.1 | 0.3 | GO:0000738 | DNA catabolic process, exonucleolytic(GO:0000738) |
| 0.1 | 0.4 | GO:1990963 | carbohydrate export(GO:0033231) daunorubicin transport(GO:0043215) response to borneol(GO:1905230) cellular response to borneol(GO:1905231) response to codeine(GO:1905233) response to quercetin(GO:1905235) drug transport across blood-brain barrier(GO:1990962) establishment of blood-retinal barrier(GO:1990963) |
| 0.1 | 0.3 | GO:0071349 | interleukin-12-mediated signaling pathway(GO:0035722) cellular response to interleukin-12(GO:0071349) |
| 0.1 | 0.3 | GO:2000422 | T-helper 1 cell lineage commitment(GO:0002296) negative regulation of complement-dependent cytotoxicity(GO:1903660) regulation of eosinophil chemotaxis(GO:2000422) positive regulation of eosinophil chemotaxis(GO:2000424) |
| 0.1 | 0.3 | GO:2000041 | Wnt signaling pathway involved in digestive tract morphogenesis(GO:0044333) regulation of planar cell polarity pathway involved in axis elongation(GO:2000040) negative regulation of planar cell polarity pathway involved in axis elongation(GO:2000041) |
| 0.1 | 0.3 | GO:1904139 | microglial cell migration(GO:1904124) regulation of microglial cell migration(GO:1904139) |
| 0.1 | 0.3 | GO:1902263 | apoptotic process involved in embryonic digit morphogenesis(GO:1902263) |
| 0.1 | 0.7 | GO:0032621 | interleukin-18 production(GO:0032621) |
| 0.1 | 0.2 | GO:0033566 | gamma-tubulin complex localization(GO:0033566) |
| 0.1 | 0.3 | GO:0009597 | detection of virus(GO:0009597) |
| 0.1 | 0.2 | GO:0021882 | regulation of transcription from RNA polymerase II promoter involved in forebrain neuron fate commitment(GO:0021882) commitment of multipotent stem cells to neuronal lineage in forebrain(GO:0021898) |
| 0.1 | 0.2 | GO:0065001 | specification of axis polarity(GO:0065001) |
| 0.1 | 0.2 | GO:1902499 | positive regulation of protein autoubiquitination(GO:1902499) regulation of peroxidase activity(GO:2000468) |
| 0.1 | 0.4 | GO:0042270 | protection from natural killer cell mediated cytotoxicity(GO:0042270) |
| 0.1 | 0.3 | GO:0098795 | mRNA cleavage involved in gene silencing by miRNA(GO:0035279) mRNA cleavage involved in gene silencing(GO:0098795) |
| 0.1 | 0.6 | GO:0035989 | tendon development(GO:0035989) |
| 0.1 | 0.6 | GO:0045078 | positive regulation of interferon-gamma biosynthetic process(GO:0045078) |
| 0.1 | 0.3 | GO:0019805 | quinolinate biosynthetic process(GO:0019805) |
| 0.1 | 0.2 | GO:0030886 | negative regulation of myeloid dendritic cell activation(GO:0030886) |
| 0.1 | 0.2 | GO:0021678 | third ventricle development(GO:0021678) |
| 0.1 | 0.2 | GO:2001226 | negative regulation of chloride transport(GO:2001226) |
| 0.1 | 0.2 | GO:0097026 | dendritic cell dendrite assembly(GO:0097026) |
| 0.1 | 0.2 | GO:0050713 | negative regulation of interleukin-1 beta secretion(GO:0050713) |
| 0.1 | 0.2 | GO:0071283 | cellular response to iron(III) ion(GO:0071283) |
| 0.1 | 0.4 | GO:0060340 | positive regulation of type I interferon-mediated signaling pathway(GO:0060340) |
| 0.1 | 0.3 | GO:0035672 | oligopeptide transmembrane transport(GO:0035672) |
| 0.0 | 0.1 | GO:0042531 | CD8-positive, alpha-beta T cell extravasation(GO:0035697) regulation of tyrosine phosphorylation of STAT protein(GO:0042509) positive regulation of tyrosine phosphorylation of STAT protein(GO:0042531) |
| 0.0 | 0.1 | GO:1904845 | response to L-glutamine(GO:1904844) cellular response to L-glutamine(GO:1904845) |
| 0.0 | 0.1 | GO:1990478 | response to ultrasound(GO:1990478) |
| 0.0 | 0.3 | GO:0000320 | re-entry into mitotic cell cycle(GO:0000320) |
| 0.0 | 0.1 | GO:0006480 | N-terminal protein amino acid methylation(GO:0006480) |
| 0.0 | 0.1 | GO:1900245 | positive regulation of MDA-5 signaling pathway(GO:1900245) |
| 0.0 | 0.4 | GO:0035457 | cellular response to interferon-alpha(GO:0035457) |
| 0.0 | 0.0 | GO:0090648 | response to environmental enrichment(GO:0090648) |
| 0.0 | 0.1 | GO:0019626 | short-chain fatty acid catabolic process(GO:0019626) |
| 0.0 | 0.1 | GO:1900368 | miRNA loading onto RISC involved in gene silencing by miRNA(GO:0035280) regulation of RNA interference(GO:1900368) |
| 0.0 | 0.1 | GO:0002462 | tolerance induction to nonself antigen(GO:0002462) |
| 0.0 | 0.2 | GO:0070973 | protein localization to endoplasmic reticulum exit site(GO:0070973) |
| 0.0 | 0.5 | GO:0002903 | negative regulation of B cell apoptotic process(GO:0002903) |
| 0.0 | 0.4 | GO:0010818 | T cell chemotaxis(GO:0010818) |
| 0.0 | 0.1 | GO:1903943 | regulation of hepatocyte apoptotic process(GO:1903943) negative regulation of hepatocyte apoptotic process(GO:1903944) |
| 0.0 | 0.2 | GO:0070269 | pyroptosis(GO:0070269) |
| 0.0 | 0.2 | GO:0010587 | miRNA catabolic process(GO:0010587) |
| 0.0 | 0.3 | GO:0070345 | negative regulation of fat cell proliferation(GO:0070345) |
| 0.0 | 0.1 | GO:0045341 | MHC class I biosynthetic process(GO:0045341) regulation of MHC class I biosynthetic process(GO:0045343) positive regulation of MHC class I biosynthetic process(GO:0045345) |
| 0.0 | 0.1 | GO:0002232 | leukocyte chemotaxis involved in inflammatory response(GO:0002232) |
| 0.0 | 0.1 | GO:0060971 | embryonic heart tube left/right pattern formation(GO:0060971) |
| 0.0 | 0.1 | GO:0042501 | serine phosphorylation of STAT protein(GO:0042501) |
| 0.0 | 0.3 | GO:0021902 | commitment of neuronal cell to specific neuron type in forebrain(GO:0021902) |
| 0.0 | 0.1 | GO:0051387 | negative regulation of neurotrophin TRK receptor signaling pathway(GO:0051387) |
| 0.0 | 0.1 | GO:0045080 | positive regulation of chemokine biosynthetic process(GO:0045080) |
| 0.0 | 0.1 | GO:0044778 | meiotic DNA integrity checkpoint(GO:0044778) |
| 0.0 | 0.3 | GO:0006957 | complement activation, alternative pathway(GO:0006957) |
| 0.0 | 0.1 | GO:0080154 | regulation of fertilization(GO:0080154) positive regulation of sperm motility(GO:1902093) |
| 0.0 | 0.2 | GO:0061193 | taste bud development(GO:0061193) |
| 0.0 | 0.1 | GO:0014908 | myotube differentiation involved in skeletal muscle regeneration(GO:0014908) |
| 0.0 | 0.4 | GO:0007250 | activation of NF-kappaB-inducing kinase activity(GO:0007250) |
| 0.0 | 0.1 | GO:0000189 | MAPK import into nucleus(GO:0000189) |
| 0.0 | 0.1 | GO:0046098 | guanine metabolic process(GO:0046098) |
| 0.0 | 0.1 | GO:1903336 | negative regulation of vacuolar transport(GO:1903336) |
| 0.0 | 0.1 | GO:0060830 | ciliary receptor clustering involved in smoothened signaling pathway(GO:0060830) |
| 0.0 | 0.0 | GO:1901492 | positive regulation of lymphangiogenesis(GO:1901492) |
| 0.0 | 0.1 | GO:0071529 | cementum mineralization(GO:0071529) |
| 0.0 | 0.0 | GO:0097029 | mature conventional dendritic cell differentiation(GO:0097029) |
| 0.0 | 0.1 | GO:0002148 | hypochlorous acid metabolic process(GO:0002148) hypochlorous acid biosynthetic process(GO:0002149) |
| 0.0 | 0.0 | GO:0003104 | positive regulation of glomerular filtration(GO:0003104) |
| 0.0 | 0.2 | GO:0071787 | endoplasmic reticulum tubular network assembly(GO:0071787) |
| 0.0 | 0.1 | GO:0006059 | hexitol metabolic process(GO:0006059) |
| 0.0 | 0.1 | GO:0042276 | error-prone translesion synthesis(GO:0042276) |
| 0.0 | 0.1 | GO:1903347 | negative regulation of bicellular tight junction assembly(GO:1903347) |
| 0.0 | 0.1 | GO:0010701 | positive regulation of norepinephrine secretion(GO:0010701) |
| 0.0 | 0.1 | GO:0071409 | cellular response to cycloheximide(GO:0071409) |
| 0.0 | 0.1 | GO:0032916 | positive regulation of transforming growth factor beta3 production(GO:0032916) |
| 0.0 | 0.1 | GO:2000298 | regulation of Rho-dependent protein serine/threonine kinase activity(GO:2000298) |
| 0.0 | 0.1 | GO:0002397 | MHC class I protein complex assembly(GO:0002397) |
| 0.0 | 0.4 | GO:0045292 | mRNA cis splicing, via spliceosome(GO:0045292) |
| 0.0 | 0.1 | GO:1901098 | positive regulation of autophagosome maturation(GO:1901098) |
| 0.0 | 0.0 | GO:2000830 | vacuolar phosphate transport(GO:0007037) positive regulation of parathyroid hormone secretion(GO:2000830) |
| 0.0 | 0.1 | GO:0010032 | meiotic chromosome condensation(GO:0010032) |
| 0.0 | 0.1 | GO:0072262 | metanephric glomerular mesangial cell proliferation involved in metanephros development(GO:0072262) |
| 0.0 | 0.1 | GO:1903463 | regulation of mitotic cell cycle DNA replication(GO:1903463) |
| 0.0 | 0.1 | GO:1904158 | axonemal central apparatus assembly(GO:1904158) |
| 0.0 | 0.1 | GO:0035627 | ceramide transport(GO:0035627) |
| 0.0 | 0.1 | GO:0050925 | negative regulation of negative chemotaxis(GO:0050925) |
| 0.0 | 0.5 | GO:0070932 | histone H3 deacetylation(GO:0070932) |
| 0.0 | 0.1 | GO:0090037 | positive regulation of protein kinase C signaling(GO:0090037) |
| 0.0 | 0.1 | GO:0002343 | positive regulation of type I hypersensitivity(GO:0001812) peripheral B cell selection(GO:0002343) B cell affinity maturation(GO:0002344) cellular response to molecule of fungal origin(GO:0071226) |
| 0.0 | 0.1 | GO:0032727 | positive regulation of interferon-alpha production(GO:0032727) |
| 0.0 | 0.2 | GO:0015760 | hexose phosphate transport(GO:0015712) glucose-6-phosphate transport(GO:0015760) |
| 0.0 | 0.1 | GO:2000051 | negative regulation of non-canonical Wnt signaling pathway(GO:2000051) |
| 0.0 | 0.1 | GO:0019343 | cysteine biosynthetic process via cystathionine(GO:0019343) |
| 0.0 | 0.1 | GO:0030579 | ubiquitin-dependent SMAD protein catabolic process(GO:0030579) |
| 0.0 | 0.4 | GO:0010390 | histone monoubiquitination(GO:0010390) |
| 0.0 | 0.0 | GO:0044565 | dendritic cell proliferation(GO:0044565) |
| 0.0 | 0.1 | GO:1903300 | negative regulation of glucokinase activity(GO:0033132) negative regulation of hexokinase activity(GO:1903300) |
| 0.0 | 0.1 | GO:0050862 | positive regulation of T cell receptor signaling pathway(GO:0050862) protein localization to ciliary membrane(GO:1903441) |
| 0.0 | 0.0 | GO:0070640 | calcitriol biosynthetic process from calciol(GO:0036378) vitamin D3 metabolic process(GO:0070640) |
| 0.0 | 0.2 | GO:0007258 | JUN phosphorylation(GO:0007258) |
| 0.0 | 0.0 | GO:0097298 | regulation of nucleus size(GO:0097298) |
| 0.0 | 0.0 | GO:1902310 | positive regulation of peptidyl-serine dephosphorylation(GO:1902310) |
| 0.0 | 0.0 | GO:0010637 | negative regulation of mitochondrial fusion(GO:0010637) |
| 0.0 | 0.1 | GO:1902683 | regulation of receptor localization to synapse(GO:1902683) |
| 0.0 | 0.2 | GO:0046548 | retinal rod cell development(GO:0046548) |
| 0.0 | 0.2 | GO:0060546 | negative regulation of necroptotic process(GO:0060546) |
| 0.0 | 0.1 | GO:0042795 | snRNA transcription from RNA polymerase II promoter(GO:0042795) |
| 0.0 | 0.1 | GO:0010990 | regulation of SMAD protein complex assembly(GO:0010990) negative regulation of SMAD protein complex assembly(GO:0010991) |
| 0.0 | 0.1 | GO:0071360 | cellular response to exogenous dsRNA(GO:0071360) |
| 0.0 | 0.1 | GO:0042339 | keratan sulfate metabolic process(GO:0042339) |
| 0.0 | 0.0 | GO:0007066 | female meiosis sister chromatid cohesion(GO:0007066) |
| 0.0 | 0.0 | GO:1901317 | regulation of sperm motility(GO:1901317) |
| 0.0 | 0.1 | GO:0044336 | canonical Wnt signaling pathway involved in negative regulation of apoptotic process(GO:0044336) |
| 0.0 | 0.0 | GO:0045357 | interferon-alpha biosynthetic process(GO:0045349) interferon-beta biosynthetic process(GO:0045350) regulation of interferon-alpha biosynthetic process(GO:0045354) regulation of interferon-beta biosynthetic process(GO:0045357) |
| 0.0 | 0.0 | GO:0071332 | cellular response to fructose stimulus(GO:0071332) |
| 0.0 | 0.0 | GO:1902202 | regulation of hepatocyte growth factor receptor signaling pathway(GO:1902202) |
| 0.0 | 0.1 | GO:1900165 | negative regulation of interleukin-6 secretion(GO:1900165) |
| 0.0 | 0.1 | GO:1903599 | positive regulation of mitophagy(GO:1903599) |
| 0.0 | 0.0 | GO:2000503 | positive regulation of natural killer cell chemotaxis(GO:2000503) |
| 0.0 | 0.0 | GO:0002581 | negative regulation of antigen processing and presentation of peptide or polysaccharide antigen via MHC class II(GO:0002581) |
| 0.0 | 0.1 | GO:0010808 | positive regulation of synaptic vesicle priming(GO:0010808) |
| 0.0 | 0.0 | GO:0010533 | regulation of activation of Janus kinase activity(GO:0010533) |
| 0.0 | 0.1 | GO:0035634 | response to stilbenoid(GO:0035634) |
| 0.0 | 0.1 | GO:2001256 | regulation of store-operated calcium entry(GO:2001256) |
| 0.0 | 0.0 | GO:0006045 | N-acetylglucosamine biosynthetic process(GO:0006045) N-acetylneuraminate biosynthetic process(GO:0046380) |
| 0.0 | 0.0 | GO:0031296 | B cell costimulation(GO:0031296) |
| 0.0 | 0.0 | GO:0070560 | protein secretion by platelet(GO:0070560) |
| 0.0 | 0.0 | GO:2001245 | regulation of phosphatidylcholine biosynthetic process(GO:2001245) |
| 0.0 | 0.0 | GO:1902998 | regulation of neuronal signal transduction(GO:1902847) positive regulation of tau-protein kinase activity(GO:1902949) neurofibrillary tangle assembly(GO:1902988) regulation of neurofibrillary tangle assembly(GO:1902996) positive regulation of neurofibrillary tangle assembly(GO:1902998) |
| 0.0 | 0.1 | GO:0070092 | regulation of glucagon secretion(GO:0070092) |
| 0.0 | 0.1 | GO:0042148 | strand invasion(GO:0042148) |
| 0.0 | 0.1 | GO:2000327 | positive regulation of ligand-dependent nuclear receptor transcription coactivator activity(GO:2000327) |
Gene overrepresentation in cellular component category:
| Log-likelihood per target | Total log-likelihood | Term | Description |
|---|---|---|---|
| 0.3 | 1.3 | GO:0020005 | symbiont-containing vacuole membrane(GO:0020005) |
| 0.2 | 0.5 | GO:0005592 | collagen type XI trimer(GO:0005592) |
| 0.2 | 1.0 | GO:1990111 | spermatoproteasome complex(GO:1990111) |
| 0.1 | 0.1 | GO:0020003 | symbiont-containing vacuole(GO:0020003) |
| 0.1 | 0.8 | GO:0072559 | NLRP3 inflammasome complex(GO:0072559) |
| 0.1 | 0.7 | GO:0042825 | TAP complex(GO:0042825) |
| 0.1 | 0.2 | GO:0008537 | proteasome activator complex(GO:0008537) |
| 0.1 | 0.2 | GO:0097487 | multivesicular body, internal vesicle(GO:0097487) |
| 0.1 | 0.2 | GO:0070022 | transforming growth factor beta receptor homodimeric complex(GO:0070022) |
| 0.0 | 0.3 | GO:0097136 | Bcl-2 family protein complex(GO:0097136) |
| 0.0 | 0.1 | GO:0045025 | mitochondrial degradosome(GO:0045025) |
| 0.0 | 0.1 | GO:1990682 | CSF1-CSF1R complex(GO:1990682) |
| 0.0 | 0.4 | GO:0008024 | cyclin/CDK positive transcription elongation factor complex(GO:0008024) |
| 0.0 | 0.1 | GO:0035692 | macrophage migration inhibitory factor receptor complex(GO:0035692) |
| 0.0 | 0.1 | GO:0097543 | ciliary inversin compartment(GO:0097543) |
| 0.0 | 0.4 | GO:0046581 | intercellular canaliculus(GO:0046581) |
| 0.0 | 0.2 | GO:0031265 | CD95 death-inducing signaling complex(GO:0031265) |
| 0.0 | 0.1 | GO:1990589 | ATF4-CREB1 transcription factor complex(GO:1990589) |
| 0.0 | 0.1 | GO:0005668 | RNA polymerase transcription factor SL1 complex(GO:0005668) |
| 0.0 | 0.3 | GO:0043020 | NADPH oxidase complex(GO:0043020) |
| 0.0 | 0.1 | GO:0097444 | spine apparatus(GO:0097444) |
| 0.0 | 0.1 | GO:1990037 | Lewy body core(GO:1990037) |
| 0.0 | 0.1 | GO:0042406 | extrinsic component of endoplasmic reticulum membrane(GO:0042406) |
| 0.0 | 0.1 | GO:1990712 | HFE-transferrin receptor complex(GO:1990712) |
| 0.0 | 0.1 | GO:0065010 | extracellular membrane-bounded organelle(GO:0065010) |
| 0.0 | 0.1 | GO:0044530 | supraspliceosomal complex(GO:0044530) |
| 0.0 | 0.1 | GO:0016035 | zeta DNA polymerase complex(GO:0016035) |
| 0.0 | 0.6 | GO:0001891 | phagocytic cup(GO:0001891) |
| 0.0 | 0.1 | GO:0033185 | dolichol-phosphate-mannose synthase complex(GO:0033185) |
| 0.0 | 0.1 | GO:0097209 | epidermal lamellar body(GO:0097209) |
| 0.0 | 0.1 | GO:0071797 | LUBAC complex(GO:0071797) |
| 0.0 | 0.1 | GO:0097443 | sorting endosome(GO:0097443) |
| 0.0 | 0.1 | GO:0097454 | Schwann cell microvillus(GO:0097454) |
| 0.0 | 1.1 | GO:0031902 | late endosome membrane(GO:0031902) |
| 0.0 | 0.1 | GO:0032059 | bleb(GO:0032059) |
| 0.0 | 0.1 | GO:0009330 | DNA topoisomerase complex (ATP-hydrolyzing)(GO:0009330) |
| 0.0 | 0.2 | GO:0035631 | CD40 receptor complex(GO:0035631) |
| 0.0 | 0.1 | GO:0000445 | THO complex(GO:0000347) THO complex part of transcription export complex(GO:0000445) |
| 0.0 | 0.2 | GO:0030061 | mitochondrial crista(GO:0030061) |
| 0.0 | 0.0 | GO:0000814 | ESCRT II complex(GO:0000814) |
| 0.0 | 0.1 | GO:0031262 | Ndc80 complex(GO:0031262) |
| 0.0 | 0.3 | GO:0005771 | multivesicular body(GO:0005771) |
| 0.0 | 0.1 | GO:0000796 | condensin complex(GO:0000796) |
| 0.0 | 0.2 | GO:0000930 | gamma-tubulin complex(GO:0000930) |
| 0.0 | 0.1 | GO:0030896 | checkpoint clamp complex(GO:0030896) |
| 0.0 | 0.1 | GO:0070847 | core mediator complex(GO:0070847) |
| 0.0 | 0.1 | GO:0005832 | chaperonin-containing T-complex(GO:0005832) |
| 0.0 | 0.1 | GO:0030991 | intraciliary transport particle A(GO:0030991) |
| 0.0 | 0.1 | GO:0031983 | vesicle lumen(GO:0031983) |
Gene overrepresentation in molecular function category:
| Log-likelihood per target | Total log-likelihood | Term | Description |
|---|---|---|---|
| 0.2 | 2.2 | GO:0001730 | 2'-5'-oligoadenylate synthetase activity(GO:0001730) |
| 0.2 | 0.7 | GO:0015433 | peptide antigen-transporting ATPase activity(GO:0015433) tapasin binding(GO:0046980) |
| 0.1 | 0.4 | GO:0047023 | androsterone dehydrogenase activity(GO:0047023) |
| 0.1 | 0.6 | GO:0048248 | CXCR3 chemokine receptor binding(GO:0048248) |
| 0.1 | 0.5 | GO:0003726 | double-stranded RNA adenosine deaminase activity(GO:0003726) |
| 0.1 | 0.3 | GO:0035673 | oligopeptide transmembrane transporter activity(GO:0035673) |
| 0.1 | 0.7 | GO:0031386 | protein tag(GO:0031386) |
| 0.1 | 0.4 | GO:0090555 | phosphatidylethanolamine-translocating ATPase activity(GO:0090555) |
| 0.1 | 0.5 | GO:0016936 | galactoside binding(GO:0016936) |
| 0.1 | 0.2 | GO:0034211 | GTP-dependent protein kinase activity(GO:0034211) |
| 0.1 | 1.6 | GO:0003950 | NAD+ ADP-ribosyltransferase activity(GO:0003950) |
| 0.1 | 0.3 | GO:0005136 | interleukin-4 receptor binding(GO:0005136) |
| 0.1 | 0.8 | GO:0097200 | cysteine-type endopeptidase activity involved in execution phase of apoptosis(GO:0097200) |
| 0.1 | 0.3 | GO:0008310 | single-stranded DNA 3'-5' exodeoxyribonuclease activity(GO:0008310) |
| 0.1 | 0.4 | GO:0097322 | 7SK snRNA binding(GO:0097322) |
| 0.0 | 0.5 | GO:0016176 | superoxide-generating NADPH oxidase activator activity(GO:0016176) |
| 0.0 | 0.1 | GO:0005157 | macrophage colony-stimulating factor receptor binding(GO:0005157) |
| 0.0 | 0.1 | GO:0071885 | N-terminal protein N-methyltransferase activity(GO:0071885) |
| 0.0 | 0.5 | GO:0031730 | CCR5 chemokine receptor binding(GO:0031730) |
| 0.0 | 0.2 | GO:0005143 | interleukin-12 receptor binding(GO:0005143) |
| 0.0 | 0.3 | GO:0016174 | NAD(P)H oxidase activity(GO:0016174) |
| 0.0 | 0.1 | GO:0031735 | CCR10 chemokine receptor binding(GO:0031735) |
| 0.0 | 0.2 | GO:0004690 | cyclic nucleotide-dependent protein kinase activity(GO:0004690) |
| 0.0 | 0.4 | GO:0008191 | metalloendopeptidase inhibitor activity(GO:0008191) |
| 0.0 | 0.2 | GO:0034714 | type III transforming growth factor beta receptor binding(GO:0034714) |
| 0.0 | 0.8 | GO:0004298 | threonine-type endopeptidase activity(GO:0004298) threonine-type peptidase activity(GO:0070003) |
| 0.0 | 0.1 | GO:0004771 | sterol esterase activity(GO:0004771) |
| 0.0 | 0.2 | GO:0034046 | poly(G) binding(GO:0034046) |
| 0.0 | 0.1 | GO:0070976 | TIR domain binding(GO:0070976) |
| 0.0 | 0.1 | GO:0031802 | type 5 metabotropic glutamate receptor binding(GO:0031802) |
| 0.0 | 0.1 | GO:0008502 | melatonin receptor activity(GO:0008502) |
| 0.0 | 0.4 | GO:0005123 | death receptor binding(GO:0005123) |
| 0.0 | 0.2 | GO:0005169 | neurotrophin TRKB receptor binding(GO:0005169) |
| 0.0 | 0.2 | GO:0061133 | endopeptidase activator activity(GO:0061133) |
| 0.0 | 0.4 | GO:0017154 | semaphorin receptor activity(GO:0017154) |
| 0.0 | 0.4 | GO:0051400 | BH domain binding(GO:0051400) |
| 0.0 | 0.1 | GO:0034191 | apolipoprotein A-I receptor binding(GO:0034191) |
| 0.0 | 0.2 | GO:0061513 | hexose phosphate transmembrane transporter activity(GO:0015119) organophosphate:inorganic phosphate antiporter activity(GO:0015315) hexose-phosphate:inorganic phosphate antiporter activity(GO:0015526) glucose 6-phosphate:inorganic phosphate antiporter activity(GO:0061513) |
| 0.0 | 0.2 | GO:1901611 | phosphatidylglycerol binding(GO:1901611) cardiolipin binding(GO:1901612) |
| 0.0 | 0.1 | GO:0001609 | G-protein coupled adenosine receptor activity(GO:0001609) |
| 0.0 | 0.7 | GO:0070064 | proline-rich region binding(GO:0070064) |
| 0.0 | 0.5 | GO:0008009 | chemokine activity(GO:0008009) |
| 0.0 | 0.1 | GO:0002151 | G-quadruplex RNA binding(GO:0002151) |
| 0.0 | 0.1 | GO:1990763 | arrestin family protein binding(GO:1990763) |
| 0.0 | 0.1 | GO:0004582 | dolichyl-phosphate beta-D-mannosyltransferase activity(GO:0004582) |
| 0.0 | 0.1 | GO:0042289 | MHC class II protein binding(GO:0042289) |
| 0.0 | 0.1 | GO:0004473 | malic enzyme activity(GO:0004470) malate dehydrogenase (decarboxylating) (NAD+) activity(GO:0004471) malate dehydrogenase (decarboxylating) (NADP+) activity(GO:0004473) |
| 0.0 | 0.1 | GO:0004977 | melanocortin receptor activity(GO:0004977) |
| 0.0 | 0.1 | GO:0005017 | platelet-derived growth factor-activated receptor activity(GO:0005017) |
| 0.0 | 0.1 | GO:0030881 | beta-2-microglobulin binding(GO:0030881) |
| 0.0 | 0.1 | GO:0048403 | brain-derived neurotrophic factor binding(GO:0048403) |
| 0.0 | 0.1 | GO:0002046 | opsin binding(GO:0002046) |
| 0.0 | 0.2 | GO:0004571 | mannosyl-oligosaccharide 1,2-alpha-mannosidase activity(GO:0004571) |
| 0.0 | 0.1 | GO:0048019 | receptor antagonist activity(GO:0048019) |
| 0.0 | 0.5 | GO:0070840 | dynein complex binding(GO:0070840) |
| 0.0 | 0.2 | GO:0016909 | JUN kinase activity(GO:0004705) SAP kinase activity(GO:0016909) |
| 0.0 | 5.0 | GO:0003924 | GTPase activity(GO:0003924) |
| 0.0 | 0.1 | GO:0046976 | histone methyltransferase activity (H3-K27 specific)(GO:0046976) |
| 0.0 | 1.3 | GO:0000979 | RNA polymerase II core promoter sequence-specific DNA binding(GO:0000979) |
| 0.0 | 0.4 | GO:0032183 | SUMO binding(GO:0032183) |
| 0.0 | 0.2 | GO:0030306 | ADP-ribosylation factor binding(GO:0030306) |
| 0.0 | 0.0 | GO:0004647 | phosphoserine phosphatase activity(GO:0004647) |
| 0.0 | 0.4 | GO:0070412 | R-SMAD binding(GO:0070412) |
| 0.0 | 0.9 | GO:0003725 | double-stranded RNA binding(GO:0003725) |
| 0.0 | 0.1 | GO:0003958 | NADPH-hemoprotein reductase activity(GO:0003958) |
| 0.0 | 0.0 | GO:0004995 | tachykinin receptor activity(GO:0004995) |
| 0.0 | 0.0 | GO:0042610 | CD8 receptor binding(GO:0042610) |
| 0.0 | 0.1 | GO:0000150 | recombinase activity(GO:0000150) |
| 0.0 | 0.0 | GO:0008265 | Mo-molybdopterin cofactor sulfurase activity(GO:0008265) |
| 0.0 | 0.1 | GO:0004875 | complement receptor activity(GO:0004875) |
| 0.0 | 0.0 | GO:0070699 | type II activin receptor binding(GO:0070699) |
| 0.0 | 0.1 | GO:0032558 | adenyl deoxyribonucleotide binding(GO:0032558) |
| 0.0 | 0.1 | GO:0005078 | MAP-kinase scaffold activity(GO:0005078) |
| 0.0 | 0.0 | GO:0000179 | rRNA (adenine-N6,N6-)-dimethyltransferase activity(GO:0000179) |
| 0.0 | 0.1 | GO:1904264 | ubiquitin protein ligase activity involved in ERAD pathway(GO:1904264) |
| 0.0 | 0.0 | GO:0009384 | N-acylmannosamine kinase activity(GO:0009384) |
Gene overrepresentation in curated gene sets: canonical pathways category:
| Log-likelihood per target | Total log-likelihood | Term | Description |
|---|---|---|---|
| 0.0 | 0.8 | PID IL27 PATHWAY | IL27-mediated signaling events |
| 0.0 | 0.7 | PID ANTHRAX PATHWAY | Cellular roles of Anthrax toxin |
| 0.0 | 0.3 | SA PROGRAMMED CELL DEATH | Programmed cell death, or apoptosis, eliminates damaged or unneeded cells. |
| 0.0 | 0.2 | PID P38 GAMMA DELTA PATHWAY | Signaling mediated by p38-gamma and p38-delta |
| 0.0 | 0.2 | SA FAS SIGNALING | The TNF-type receptor Fas induces apoptosis on ligand binding. |
| 0.0 | 0.6 | PID CD40 PATHWAY | CD40/CD40L signaling |
| 0.0 | 0.4 | ST GA12 PATHWAY | G alpha 12 Pathway |
| 0.0 | 0.6 | PID CXCR3 PATHWAY | CXCR3-mediated signaling events |
| 0.0 | 0.7 | PID SYNDECAN 1 PATHWAY | Syndecan-1-mediated signaling events |
| 0.0 | 0.1 | PID THROMBIN PAR4 PATHWAY | PAR4-mediated thrombin signaling events |
| 0.0 | 1.3 | PID SMAD2 3NUCLEAR PATHWAY | Regulation of nuclear SMAD2/3 signaling |
| 0.0 | 0.5 | PID P38 ALPHA BETA DOWNSTREAM PATHWAY | Signaling mediated by p38-alpha and p38-beta |
| 0.0 | 0.1 | SA G2 AND M PHASES | Cdc25 activates the cdc2/cyclin B complex to induce the G2/M transition. |
| 0.0 | 0.2 | SA MMP CYTOKINE CONNECTION | Cytokines can induce activation of matrix metalloproteinases, which degrade extracellular matrix. |
| 0.0 | 1.7 | PID P53 DOWNSTREAM PATHWAY | Direct p53 effectors |
| 0.0 | 0.6 | PID IL4 2PATHWAY | IL4-mediated signaling events |
| 0.0 | 0.2 | PID TOLL ENDOGENOUS PATHWAY | Endogenous TLR signaling |
Gene overrepresentation in curated gene sets: REACTOME pathways category:
| Log-likelihood per target | Total log-likelihood | Term | Description |
|---|---|---|---|
| 0.1 | 1.3 | REACTOME TRAF6 MEDIATED IRF7 ACTIVATION IN TLR7 8 OR 9 SIGNALING | Genes involved in TRAF6 mediated IRF7 activation in TLR7/8 or 9 signaling |
| 0.1 | 5.0 | REACTOME INTERFERON ALPHA BETA SIGNALING | Genes involved in Interferon alpha/beta signaling |
| 0.1 | 0.7 | REACTOME NFKB ACTIVATION THROUGH FADD RIP1 PATHWAY MEDIATED BY CASPASE 8 AND10 | Genes involved in NF-kB activation through FADD/RIP-1 pathway mediated by caspase-8 and -10 |
| 0.1 | 0.2 | REACTOME ENDOSOMAL VACUOLAR PATHWAY | Genes involved in Endosomal/Vacuolar pathway |
| 0.0 | 0.6 | REACTOME THE NLRP3 INFLAMMASOME | Genes involved in The NLRP3 inflammasome |
| 0.0 | 0.5 | REACTOME RIP MEDIATED NFKB ACTIVATION VIA DAI | Genes involved in RIP-mediated NFkB activation via DAI |
| 0.0 | 1.3 | REACTOME INTERFERON GAMMA SIGNALING | Genes involved in Interferon gamma signaling |
| 0.0 | 0.6 | REACTOME ANTIGEN PRESENTATION FOLDING ASSEMBLY AND PEPTIDE LOADING OF CLASS I MHC | Genes involved in Antigen Presentation: Folding, assembly and peptide loading of class I MHC |
| 0.0 | 0.9 | REACTOME PRE NOTCH TRANSCRIPTION AND TRANSLATION | Genes involved in Pre-NOTCH Transcription and Translation |
| 0.0 | 1.4 | REACTOME CHEMOKINE RECEPTORS BIND CHEMOKINES | Genes involved in Chemokine receptors bind chemokines |
| 0.0 | 0.0 | REACTOME TRAF6 MEDIATED NFKB ACTIVATION | Genes involved in TRAF6 mediated NF-kB activation |
| 0.0 | 1.1 | REACTOME CROSS PRESENTATION OF SOLUBLE EXOGENOUS ANTIGENS ENDOSOMES | Genes involved in Cross-presentation of soluble exogenous antigens (endosomes) |
| 0.0 | 0.3 | REACTOME ACTIVATION OF BH3 ONLY PROTEINS | Genes involved in Activation of BH3-only proteins |
| 0.0 | 0.3 | REACTOME REGULATION OF COMPLEMENT CASCADE | Genes involved in Regulation of Complement cascade |
| 0.0 | 0.4 | REACTOME OTHER SEMAPHORIN INTERACTIONS | Genes involved in Other semaphorin interactions |
| 0.0 | 0.2 | REACTOME ACTIVATION OF THE AP1 FAMILY OF TRANSCRIPTION FACTORS | Genes involved in Activation of the AP-1 family of transcription factors |
| 0.0 | 0.2 | REACTOME TETRAHYDROBIOPTERIN BH4 SYNTHESIS RECYCLING SALVAGE AND REGULATION | Genes involved in Tetrahydrobiopterin (BH4) synthesis, recycling, salvage and regulation |
| 0.0 | 0.1 | REACTOME P53 INDEPENDENT G1 S DNA DAMAGE CHECKPOINT | Genes involved in p53-Independent G1/S DNA damage checkpoint |
| 0.0 | 0.4 | REACTOME ELONGATION ARREST AND RECOVERY | Genes involved in Elongation arrest and recovery |
| 0.0 | 0.1 | REACTOME PURINE CATABOLISM | Genes involved in Purine catabolism |
| 0.0 | 0.2 | REACTOME SPRY REGULATION OF FGF SIGNALING | Genes involved in Spry regulation of FGF signaling |
| 0.0 | 0.1 | REACTOME G2 M CHECKPOINTS | Genes involved in G2/M Checkpoints |
| 0.0 | 0.3 | REACTOME ADP SIGNALLING THROUGH P2RY12 | Genes involved in ADP signalling through P2Y purinoceptor 12 |
| 0.0 | 0.2 | REACTOME ZINC TRANSPORTERS | Genes involved in Zinc transporters |