Project
GSE49485: Hypoxia transcriptome sequencing of rat brain.
Navigation
Downloads
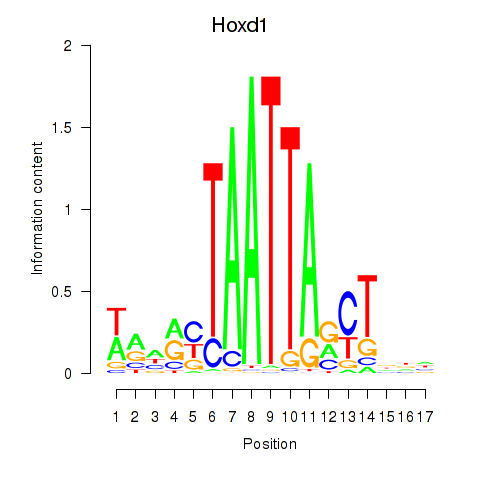
Results for Hoxd1
Z-value: 0.52
Motif logo
Transcription factors associated with Hoxd1
| Gene Symbol | Gene ID | Gene Info |
|---|---|---|
|
Hoxd1
|
ENSRNOG00000001572 | homeo box D1 |
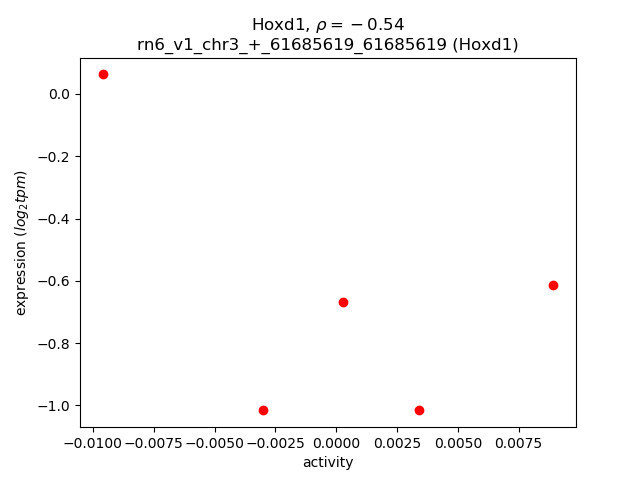
Activity-expression correlation:
| Gene | Promoter | Pearson corr. coef. | P-value | Plot |
|---|---|---|---|---|
| Hoxd1 | rn6_v1_chr3_+_61685619_61685619 | -0.54 | 3.4e-01 | Click! |
Activity profile of Hoxd1 motif
Sorted Z-values of Hoxd1 motif
| Promoter | Log-likelihood | Transcript | Gene | Gene Info |
|---|---|---|---|---|
| chr16_+_84465656 | 0.30 |
ENSRNOT00000043188
|
LOC689713
|
LRRGT00175 |
| chr6_-_3355339 | 0.27 |
ENSRNOT00000084602
|
Map4k3
|
mitogen-activated protein kinase kinase kinase kinase 3 |
| chr5_-_168734296 | 0.23 |
ENSRNOT00000066120
|
Camta1
|
calmodulin binding transcription activator 1 |
| chr12_-_35979193 | 0.23 |
ENSRNOT00000071104
|
Tmem132b
|
transmembrane protein 132B |
| chr1_+_141767940 | 0.22 |
ENSRNOT00000064034
|
Zfp710
|
zinc finger protein 710 |
| chr9_+_73378057 | 0.20 |
ENSRNOT00000043627
ENSRNOT00000045766 ENSRNOT00000092445 ENSRNOT00000037974 |
Map2
|
microtubule-associated protein 2 |
| chr3_+_56125924 | 0.19 |
ENSRNOT00000011380
|
Ubr3
|
ubiquitin protein ligase E3 component n-recognin 3 |
| chr14_+_42015347 | 0.19 |
ENSRNOT00000044017
|
Atp8a1
|
ATPase phospholipid transporting 8A1 |
| chr16_-_10802512 | 0.18 |
ENSRNOT00000079554
|
Bmpr1a
|
bone morphogenetic protein receptor type 1A |
| chr12_-_45801842 | 0.18 |
ENSRNOT00000078837
|
AABR07036513.1
|
|
| chr13_+_91054974 | 0.18 |
ENSRNOT00000091089
|
Crp
|
C-reactive protein |
| chr18_-_55891710 | 0.17 |
ENSRNOT00000064686
|
Synpo
|
synaptopodin |
| chr14_-_84751886 | 0.16 |
ENSRNOT00000078838
|
Mtmr3
|
myotubularin related protein 3 |
| chr10_-_10881844 | 0.16 |
ENSRNOT00000087118
ENSRNOT00000004416 |
Mgrn1
|
mahogunin ring finger 1 |
| chr2_-_33025271 | 0.16 |
ENSRNOT00000074941
|
NEWGENE_1310139
|
microtubule associated serine/threonine kinase family member 4 |
| chr20_+_6211420 | 0.16 |
ENSRNOT00000000624
|
Kctd20
|
potassium channel tetramerization domain containing 20 |
| chr16_+_7035068 | 0.16 |
ENSRNOT00000024296
|
Nek4
|
NIMA-related kinase 4 |
| chr7_-_120770435 | 0.16 |
ENSRNOT00000077000
|
Ddx17
|
DEAD-box helicase 17 |
| chr5_+_155934490 | 0.16 |
ENSRNOT00000077933
|
LOC100911993
|
ubiquitin carboxyl-terminal hydrolase 48-like |
| chr9_+_10013854 | 0.15 |
ENSRNOT00000077653
ENSRNOT00000072033 |
Khsrp
|
KH-type splicing regulatory protein |
| chr15_-_55209342 | 0.15 |
ENSRNOT00000021752
|
Rb1
|
RB transcriptional corepressor 1 |
| chr8_-_21492801 | 0.15 |
ENSRNOT00000077465
|
Zfp426
|
zinc finger protein 426 |
| chr3_-_120076788 | 0.15 |
ENSRNOT00000047158
|
Kcnip3
|
potassium voltage-gated channel interacting protein 3 |
| chr8_+_40009691 | 0.15 |
ENSRNOT00000042679
|
Vsig2
|
V-set and immunoglobulin domain containing 2 |
| chr1_+_99505677 | 0.15 |
ENSRNOT00000024645
|
Zfp719
|
zinc finger protein 719 |
| chr6_+_104291071 | 0.13 |
ENSRNOT00000006798
|
Slc39a9
|
solute carrier family 39, member 9 |
| chr17_-_87826421 | 0.13 |
ENSRNOT00000068156
|
Arhgap21
|
Rho GTPase activating protein 21 |
| chr4_-_22424862 | 0.13 |
ENSRNOT00000082359
|
Abcb1a
|
ATP binding cassette subfamily B member 1A |
| chr4_+_88694583 | 0.13 |
ENSRNOT00000009202
|
Ppm1k
|
protein phosphatase, Mg2+/Mn2+ dependent, 1K |
| chr9_+_67234303 | 0.13 |
ENSRNOT00000050179
|
Abi2
|
abl-interactor 2 |
| chr15_-_54528480 | 0.13 |
ENSRNOT00000066888
|
Fndc3a
|
fibronectin type III domain containing 3a |
| chr1_+_140998240 | 0.12 |
ENSRNOT00000023506
ENSRNOT00000090897 |
Abhd2
|
abhydrolase domain containing 2 |
| chr17_-_78812111 | 0.12 |
ENSRNOT00000021506
|
Dclre1c
|
DNA cross-link repair 1C |
| chr5_+_135574172 | 0.12 |
ENSRNOT00000023416
|
Tesk2
|
testis-specific kinase 2 |
| chr13_-_83457888 | 0.12 |
ENSRNOT00000076289
ENSRNOT00000004065 |
Sft2d2
|
SFT2 domain containing 2 |
| chr1_+_217345545 | 0.12 |
ENSRNOT00000071741
|
Shank2
|
SH3 and multiple ankyrin repeat domains 2 |
| chr2_+_195996521 | 0.12 |
ENSRNOT00000082849
|
Pogz
|
pogo transposable element with ZNF domain |
| chr18_-_43945273 | 0.12 |
ENSRNOT00000088900
|
Dtwd2
|
DTW domain containing 2 |
| chr17_-_89923423 | 0.12 |
ENSRNOT00000076964
|
Acbd5
|
acyl-CoA binding domain containing 5 |
| chr7_-_59547174 | 0.12 |
ENSRNOT00000085836
|
Cnot2
|
CCR4-NOT transcription complex, subunit 2 |
| chr15_-_93765498 | 0.11 |
ENSRNOT00000093297
|
Mycbp2
|
MYC binding protein 2, E3 ubiquitin protein ligase |
| chr10_+_61685645 | 0.11 |
ENSRNOT00000003933
|
Mnt
|
MAX network transcriptional repressor |
| chrX_-_69218526 | 0.11 |
ENSRNOT00000092321
ENSRNOT00000074071 ENSRNOT00000092571 |
Pja1
|
praja ring finger ubiquitin ligase 1 |
| chr1_-_215033460 | 0.11 |
ENSRNOT00000044565
|
Dusp8
|
dual specificity phosphatase 8 |
| chr9_+_16003058 | 0.11 |
ENSRNOT00000081621
ENSRNOT00000021158 |
Ubr2
|
ubiquitin protein ligase E3 component n-recognin 2 |
| chr14_-_86387606 | 0.11 |
ENSRNOT00000089384
ENSRNOT00000006642 |
Ddx56
|
DEAD-box helicase 56 |
| chr4_-_126644895 | 0.10 |
ENSRNOT00000017384
ENSRNOT00000072624 |
Lrig1
|
leucine-rich repeats and immunoglobulin-like domains 1 |
| chr5_-_133959447 | 0.10 |
ENSRNOT00000011985
|
Cyp4x1
|
cytochrome P450, family 4, subfamily x, polypeptide 1 |
| chr12_+_6403940 | 0.10 |
ENSRNOT00000083484
|
B3glct
|
beta 3-glucosyltransferase |
| chr9_+_66888393 | 0.10 |
ENSRNOT00000023536
|
Carf
|
calcium responsive transcription factor |
| chr5_-_147412705 | 0.10 |
ENSRNOT00000010688
|
RGD1561149
|
similar to mKIAA1522 protein |
| chr8_-_82533689 | 0.10 |
ENSRNOT00000014124
|
Tmod2
|
tropomodulin 2 |
| chr1_-_64147251 | 0.10 |
ENSRNOT00000088502
|
Cnot3
|
CCR4-NOT transcription complex, subunit 3 |
| chr16_+_59564419 | 0.09 |
ENSRNOT00000083434
|
Lonrf1
|
LON peptidase N-terminal domain and ring finger 1 |
| chr5_-_12526962 | 0.09 |
ENSRNOT00000092104
|
St18
|
suppression of tumorigenicity 18 |
| chr20_-_13994794 | 0.09 |
ENSRNOT00000093466
|
Ggt5
|
gamma-glutamyltransferase 5 |
| chr19_+_45938915 | 0.09 |
ENSRNOT00000065508
|
Mon1b
|
MON1 homolog B, secretory trafficking associated |
| chr2_-_149432106 | 0.09 |
ENSRNOT00000051027
|
P2ry13
|
purinergic receptor P2Y13 |
| chr1_-_241046249 | 0.08 |
ENSRNOT00000067796
ENSRNOT00000081866 |
Smc5
|
structural maintenance of chromosomes 5 |
| chr3_+_148654668 | 0.08 |
ENSRNOT00000081370
|
Tm9sf4
|
transmembrane 9 superfamily member 4 |
| chr1_+_80293566 | 0.08 |
ENSRNOT00000024246
|
Ercc2
|
ERCC excision repair 2, TFIIH core complex helicase subunit |
| chr5_-_164648328 | 0.08 |
ENSRNOT00000090811
|
Zfp933
|
zinc finger protein 933 |
| chr9_+_13446896 | 0.08 |
ENSRNOT00000088651
|
Daam2
|
dishevelled associated activator of morphogenesis 2 |
| chr4_+_157524423 | 0.08 |
ENSRNOT00000036654
|
Zfp384
|
zinc finger protein 384 |
| chr11_-_51202703 | 0.08 |
ENSRNOT00000002719
ENSRNOT00000077220 |
Cblb
|
Cbl proto-oncogene B |
| chr10_+_103206014 | 0.07 |
ENSRNOT00000004081
|
Ttyh2
|
tweety family member 2 |
| chr10_-_52290657 | 0.07 |
ENSRNOT00000005293
|
Map2k4
|
mitogen activated protein kinase kinase 4 |
| chr16_+_7035241 | 0.07 |
ENSRNOT00000084977
|
Nek4
|
NIMA-related kinase 4 |
| chr7_+_2752680 | 0.07 |
ENSRNOT00000033726
|
Cs
|
citrate synthase |
| chr1_-_100926335 | 0.07 |
ENSRNOT00000020304
|
Ap2a1
|
adaptor-related protein complex 2, alpha 1 subunit |
| chr18_+_63203063 | 0.07 |
ENSRNOT00000024144
|
Prelid3a
|
PRELI domain containing 3A |
| chr7_-_114590119 | 0.07 |
ENSRNOT00000079599
|
Ptk2
|
protein tyrosine kinase 2 |
| chr4_+_146455332 | 0.07 |
ENSRNOT00000009775
|
Hrh1
|
histamine receptor H 1 |
| chr12_-_52658275 | 0.07 |
ENSRNOT00000041981
|
Zfp605
|
zinc finger protein 605 |
| chr2_-_35870578 | 0.07 |
ENSRNOT00000066069
|
Rnf180
|
ring finger protein 180 |
| chr6_+_18880737 | 0.07 |
ENSRNOT00000003432
|
Alkbh8
|
alkB homolog 8, tRNA methyltransferase |
| chr6_-_108660063 | 0.07 |
ENSRNOT00000006240
|
Arel1
|
apoptosis resistant E3 ubiquitin protein ligase 1 |
| chr2_+_257626383 | 0.07 |
ENSRNOT00000080993
|
Zzz3
|
zinc finger, ZZ-type containing 3 |
| chr1_+_62133816 | 0.07 |
ENSRNOT00000034746
|
LOC102555377
|
zinc finger protein 182-like |
| chr3_+_56056925 | 0.07 |
ENSRNOT00000088351
ENSRNOT00000010508 |
Klhl23
|
kelch-like family member 23 |
| chr1_+_15834779 | 0.07 |
ENSRNOT00000079069
ENSRNOT00000083012 |
Bclaf1
|
BCL2-associated transcription factor 1 |
| chr3_-_66335869 | 0.07 |
ENSRNOT00000079781
ENSRNOT00000043238 ENSRNOT00000073412 ENSRNOT00000057878 ENSRNOT00000079212 |
Cerkl
|
ceramide kinase-like |
| chr8_-_8524643 | 0.06 |
ENSRNOT00000009418
|
Cntn5
|
contactin 5 |
| chr5_-_7941822 | 0.06 |
ENSRNOT00000079917
|
Prex2
|
phosphatidylinositol-3,4,5-trisphosphate-dependent Rac exchange factor 2 |
| chr1_+_1545134 | 0.06 |
ENSRNOT00000044523
|
AABR07000156.1
|
|
| chr17_+_77601877 | 0.06 |
ENSRNOT00000091554
ENSRNOT00000024872 |
Prpf18
|
pre-mRNA processing factor 18 |
| chr15_-_88670349 | 0.06 |
ENSRNOT00000012881
|
Rnf219
|
ring finger protein 219 |
| chr10_+_35870232 | 0.06 |
ENSRNOT00000078505
|
Hnrnph1
|
heterogeneous nuclear ribonucleoprotein H1 |
| chrX_-_65102344 | 0.06 |
ENSRNOT00000016042
ENSRNOT00000075875 |
Las1l
|
LAS1-like, ribosome biogenesis factor |
| chr1_-_38538987 | 0.06 |
ENSRNOT00000090406
ENSRNOT00000071275 |
LOC102551340
|
zinc finger protein 728-like |
| chr1_+_253221812 | 0.06 |
ENSRNOT00000085880
ENSRNOT00000054753 |
Kif20b
|
kinesin family member 20B |
| chr14_+_45982244 | 0.06 |
ENSRNOT00000076881
ENSRNOT00000002984 |
Rell1
|
RELT-like 1 |
| chr4_-_176606382 | 0.06 |
ENSRNOT00000065576
|
Recql
|
RecQ like helicase |
| chr12_-_24775891 | 0.06 |
ENSRNOT00000074851
|
Wbscr27
|
Williams Beuren syndrome chromosome region 27 |
| chrX_-_159841072 | 0.06 |
ENSRNOT00000001158
|
Arhgef6
|
Rac/Cdc42 guanine nucleotide exchange factor 6 |
| chr4_-_62860446 | 0.05 |
ENSRNOT00000015752
|
Fam180a
|
family with sequence similarity 180, member A |
| chr15_+_42808897 | 0.05 |
ENSRNOT00000023475
|
Chrna2
|
cholinergic receptor nicotinic alpha 2 subunit |
| chr3_-_90751055 | 0.05 |
ENSRNOT00000040741
|
LOC499843
|
LRRGT00091 |
| chr1_-_78180216 | 0.05 |
ENSRNOT00000071576
|
C5ar2
|
complement component 5a receptor 2 |
| chr2_+_122877286 | 0.05 |
ENSRNOT00000033080
|
Arse
|
arylsulfatase E |
| chr18_+_30840868 | 0.05 |
ENSRNOT00000027026
|
Pcdhga5
|
protocadherin gamma subfamily A, 5 |
| chr4_-_55011415 | 0.05 |
ENSRNOT00000056996
|
Grm8
|
glutamate metabotropic receptor 8 |
| chr2_+_86996497 | 0.05 |
ENSRNOT00000042058
|
Zfp455
|
zinc finger protein 455 |
| chr6_+_80108655 | 0.05 |
ENSRNOT00000006137
|
Gemin2
|
gem (nuclear organelle) associated protein 2 |
| chr3_-_15278645 | 0.05 |
ENSRNOT00000032204
|
Ttll11
|
tubulin tyrosine ligase like11 |
| chr11_+_47146308 | 0.05 |
ENSRNOT00000002191
|
Cep97
|
centrosomal protein 97 |
| chr2_-_210088949 | 0.05 |
ENSRNOT00000070994
|
Rbm15
|
RNA binding motif protein 15 |
| chr10_-_87286387 | 0.05 |
ENSRNOT00000044206
|
Krt28
|
keratin 28 |
| chr10_-_65502936 | 0.05 |
ENSRNOT00000089615
|
Supt6h
|
SPT6 homolog, histone chaperone |
| chr1_+_101603222 | 0.05 |
ENSRNOT00000033278
|
Izumo1
|
izumo sperm-egg fusion 1 |
| chr2_+_220432037 | 0.05 |
ENSRNOT00000021988
|
Frrs1
|
ferric-chelate reductase 1 |
| chr7_-_83670356 | 0.05 |
ENSRNOT00000005584
|
Sybu
|
syntabulin |
| chr13_-_89545182 | 0.05 |
ENSRNOT00000078402
|
Pcp4l1
|
Purkinje cell protein 4-like 1 |
| chr2_+_66940057 | 0.05 |
ENSRNOT00000043050
|
Cdh9
|
cadherin 9 |
| chr3_-_133122691 | 0.05 |
ENSRNOT00000083637
|
Tasp1
|
taspase 1 |
| chr12_-_46493203 | 0.04 |
ENSRNOT00000057036
|
Cit
|
citron rho-interacting serine/threonine kinase |
| chrX_+_6273733 | 0.04 |
ENSRNOT00000074275
|
Ndp
|
NDP, norrin cystine knot growth factor |
| chr1_-_261179790 | 0.04 |
ENSRNOT00000074420
ENSRNOT00000072073 |
Exosc1
|
exosome component 1 |
| chr1_-_252808380 | 0.04 |
ENSRNOT00000025856
|
Ch25h
|
cholesterol 25-hydroxylase |
| chr1_+_260093641 | 0.04 |
ENSRNOT00000019521
|
Ccnj
|
cyclin J |
| chr7_+_15422479 | 0.04 |
ENSRNOT00000066520
|
Zfp563
|
zinc finger protein 563 |
| chr6_+_104291340 | 0.04 |
ENSRNOT00000089313
|
Slc39a9
|
solute carrier family 39, member 9 |
| chr1_-_255976425 | 0.04 |
ENSRNOT00000085303
|
Ide
|
insulin degrading enzyme |
| chr8_+_32188617 | 0.04 |
ENSRNOT00000081145
|
Zbtb44
|
zinc finger and BTB domain containing 44 |
| chr4_+_2053712 | 0.04 |
ENSRNOT00000045086
|
Rnf32
|
ring finger protein 32 |
| chr2_+_248398917 | 0.04 |
ENSRNOT00000045855
|
Gbp1
|
guanylate binding protein 1 |
| chr11_+_68633160 | 0.04 |
ENSRNOT00000063795
|
Sec22a
|
SEC22 homolog A, vesicle trafficking protein |
| chr6_-_108076186 | 0.04 |
ENSRNOT00000014814
|
Fam161b
|
family with sequence similarity 161, member B |
| chr1_+_224998172 | 0.04 |
ENSRNOT00000026321
|
Zbtb3
|
zinc finger and BTB domain containing 3 |
| chr5_+_6373583 | 0.04 |
ENSRNOT00000084749
|
AABR07046778.1
|
|
| chr6_+_8284878 | 0.04 |
ENSRNOT00000009581
|
Slc3a1
|
solute carrier family 3 member 1 |
| chr13_-_76049363 | 0.04 |
ENSRNOT00000075865
ENSRNOT00000007455 |
Brinp2
|
BMP/retinoic acid inducible neural specific 2 |
| chr4_+_31229913 | 0.04 |
ENSRNOT00000077134
ENSRNOT00000087897 |
Samd9l
|
sterile alpha motif domain containing 9-like |
| chrM_+_9870 | 0.04 |
ENSRNOT00000044582
|
Mt-nd4l
|
mitochondrially encoded NADH 4L dehydrogenase |
| chr5_-_50068706 | 0.04 |
ENSRNOT00000084643
|
Orc3
|
origin recognition complex, subunit 3 |
| chr3_+_128155069 | 0.04 |
ENSRNOT00000051184
ENSRNOT00000006389 |
Plcb1
|
phospholipase C beta 1 |
| chr5_-_171262119 | 0.03 |
ENSRNOT00000032825
|
Dffb
|
DNA fragmentation factor subunit beta |
| chr10_-_78219793 | 0.03 |
ENSRNOT00000003369
|
Tom1l1
|
target of myb1 like 1 membrane trafficking protein |
| chr1_+_261180007 | 0.03 |
ENSRNOT00000072181
|
Zdhhc16
|
zinc finger, DHHC-type containing 16 |
| chr14_+_34446616 | 0.03 |
ENSRNOT00000002976
|
Clock
|
clock circadian regulator |
| chr15_+_87722221 | 0.03 |
ENSRNOT00000082688
|
Scel
|
sciellin |
| chr10_-_110274768 | 0.03 |
ENSRNOT00000054931
|
Sectm1a
|
secreted and transmembrane 1A |
| chrX_+_88298266 | 0.03 |
ENSRNOT00000041508
|
AABR07039936.1
|
|
| chr1_+_101554642 | 0.03 |
ENSRNOT00000028474
|
Bcat2
|
branched chain amino acid transaminase 2 |
| chr16_-_32439421 | 0.03 |
ENSRNOT00000043100
|
Nek1
|
NIMA-related kinase 1 |
| chr11_-_82893845 | 0.03 |
ENSRNOT00000075306
|
LOC100912571
|
eukaryotic translation initiation factor 4 gamma 1-like |
| chr1_-_67390141 | 0.03 |
ENSRNOT00000025808
|
Sbk1
|
SH3 domain binding kinase 1 |
| chr17_-_27279260 | 0.03 |
ENSRNOT00000018508
|
Snrnp48
|
small nuclear ribonucleoprotein U11/U12 subunit 48 |
| chr18_-_26656879 | 0.03 |
ENSRNOT00000086729
|
Epb41l4a
|
erythrocyte membrane protein band 4.1 like 4A |
| chr3_+_21764377 | 0.03 |
ENSRNOT00000063938
|
Gpr21
|
G protein-coupled receptor 21 |
| chr8_+_103938520 | 0.03 |
ENSRNOT00000067835
|
Gk5
|
glycerol kinase 5 (putative) |
| chr16_+_6048004 | 0.03 |
ENSRNOT00000020750
|
Actr8
|
ARP8 actin-related protein 8 homolog |
| chr3_+_129885826 | 0.03 |
ENSRNOT00000009743
|
Slx4ip
|
SLX4 interacting protein |
| chrX_+_84064427 | 0.03 |
ENSRNOT00000046364
|
Zfp711
|
zinc finger protein 711 |
| chr11_-_43022565 | 0.03 |
ENSRNOT00000002285
|
Riox2
|
ribosomal oxygenase 2 |
| chr1_-_197801634 | 0.03 |
ENSRNOT00000090200
|
Nfatc2ip
|
nuclear factor of activated T-cells 2 interacting protein |
| chr4_+_147832136 | 0.03 |
ENSRNOT00000064603
|
Rho
|
rhodopsin |
| chr7_+_2635743 | 0.03 |
ENSRNOT00000004223
|
Mip
|
major intrinsic protein of lens fiber |
| chr7_+_83564563 | 0.02 |
ENSRNOT00000005705
|
Ebag9
|
estrogen receptor binding site associated, antigen, 9 |
| chr1_+_255579474 | 0.02 |
ENSRNOT00000024465
|
Btaf1
|
B-TFIID TATA-box binding protein associated factor 1 |
| chr17_-_84247038 | 0.02 |
ENSRNOT00000068553
|
Nebl
|
nebulette |
| chr4_-_88684415 | 0.02 |
ENSRNOT00000009001
|
LOC500148
|
similar to 40S ribosomal protein S7 (S8) |
| chr1_-_198450047 | 0.02 |
ENSRNOT00000027360
|
Mvp
|
major vault protein |
| chr2_+_86996798 | 0.02 |
ENSRNOT00000070821
|
Zfp455
|
zinc finger protein 455 |
| chr1_-_67065797 | 0.02 |
ENSRNOT00000048152
|
Vom1r46
|
vomeronasal 1 receptor 46 |
| chr20_+_3155652 | 0.02 |
ENSRNOT00000042882
|
RT1-S2
|
RT1 class Ib, locus S2 |
| chr12_+_19328957 | 0.02 |
ENSRNOT00000033288
|
Cnpy4
|
canopy FGF signaling regulator 4 |
| chr2_+_93669765 | 0.02 |
ENSRNOT00000045438
|
Slc10a5
|
solute carrier family 10, member 5 |
| chr11_-_69316848 | 0.02 |
ENSRNOT00000033420
|
Ccdc14
|
coiled-coil domain containing 14 |
| chr3_-_57607683 | 0.02 |
ENSRNOT00000093222
ENSRNOT00000058524 |
Mettl8
|
methyltransferase like 8 |
| chr15_+_33885106 | 0.02 |
ENSRNOT00000024483
|
Dhrs2
|
dehydrogenase/reductase 2 |
| chr1_+_68436917 | 0.02 |
ENSRNOT00000088586
|
LOC108348118
|
leucyl-cystinyl aminopeptidase |
| chr10_-_34242985 | 0.02 |
ENSRNOT00000046438
|
RGD1559575
|
similar to novel protein |
| chr5_+_187312 | 0.02 |
ENSRNOT00000030857
|
LOC102557117
|
zinc finger protein 120-like |
| chr5_-_144996431 | 0.02 |
ENSRNOT00000016992
|
Zmym4
|
zinc finger MYM-type containing 4 |
| chr8_+_117297670 | 0.02 |
ENSRNOT00000082628
|
Qars
|
glutaminyl-tRNA synthetase |
| chr16_+_23553647 | 0.02 |
ENSRNOT00000041994
|
Psd3
|
pleckstrin and Sec7 domain containing 3 |
| chr2_-_57935334 | 0.02 |
ENSRNOT00000022319
ENSRNOT00000085599 ENSRNOT00000077790 ENSRNOT00000035821 |
Slc1a3
|
solute carrier family 1 member 3 |
| chr12_-_45116665 | 0.02 |
ENSRNOT00000089043
|
Taok3
|
TAO kinase 3 |
| chr2_+_119112513 | 0.02 |
ENSRNOT00000015460
|
Actl6a
|
actin-like 6A |
| chr1_+_68436593 | 0.02 |
ENSRNOT00000080325
|
LOC108348118
|
leucyl-cystinyl aminopeptidase |
| chr7_+_91384187 | 0.02 |
ENSRNOT00000005828
|
Utp23
|
UTP23, small subunit processome component |
| chr16_+_71738718 | 0.02 |
ENSRNOT00000022097
|
Plekha2
|
pleckstrin homology domain containing A2 |
| chr5_+_58995249 | 0.02 |
ENSRNOT00000023411
|
Ccdc107
|
coiled-coil domain containing 107 |
| chr16_-_19308842 | 0.02 |
ENSRNOT00000019556
|
Fam32a
|
family with sequence similarity 32, member A |
| chr6_-_111417813 | 0.01 |
ENSRNOT00000016324
ENSRNOT00000085458 |
Sptlc2
|
serine palmitoyltransferase, long chain base subunit 2 |
| chr19_+_39229754 | 0.01 |
ENSRNOT00000050612
|
Vps4a
|
vacuolar protein sorting 4 homolog A |
| chr8_+_107495366 | 0.01 |
ENSRNOT00000056590
|
Cep70
|
centrosomal protein 70 |
| chr10_+_1834518 | 0.01 |
ENSRNOT00000061709
|
Gm1758
|
predicted gene 1758 |
| chr1_-_233145924 | 0.01 |
ENSRNOT00000018763
ENSRNOT00000082442 |
Psat1
|
phosphoserine aminotransferase 1 |
| chr10_+_35870682 | 0.01 |
ENSRNOT00000067188
|
Hnrnph1
|
heterogeneous nuclear ribonucleoprotein H1 |
| chr2_-_60657712 | 0.01 |
ENSRNOT00000040348
|
Rai14
|
retinoic acid induced 14 |
| chr10_-_65437143 | 0.01 |
ENSRNOT00000017264
|
Nek8
|
NIMA-related kinase 8 |
| chr8_-_96547568 | 0.01 |
ENSRNOT00000078343
|
RGD1560775
|
similar to RIKEN cDNA 4930579C12 gene |
| chr2_+_195684210 | 0.01 |
ENSRNOT00000028316
|
mrpl9
|
mitochondrial ribosomal protein L9 |
| chr9_-_30844199 | 0.01 |
ENSRNOT00000017169
|
Col19a1
|
collagen type XIX alpha 1 chain |
| chr13_-_90405591 | 0.01 |
ENSRNOT00000006849
|
Vangl2
|
VANGL planar cell polarity protein 2 |
| chr2_+_195651930 | 0.01 |
ENSRNOT00000028299
|
Tdrkh
|
tudor and KH domain containing |
| chr8_-_83421612 | 0.01 |
ENSRNOT00000015824
|
Hcrtr2
|
hypocretin receptor 2 |
| chr16_+_74785281 | 0.01 |
ENSRNOT00000064316
ENSRNOT00000017106 ENSRNOT00000090646 |
Nek3
|
NIMA-related kinase 3 |
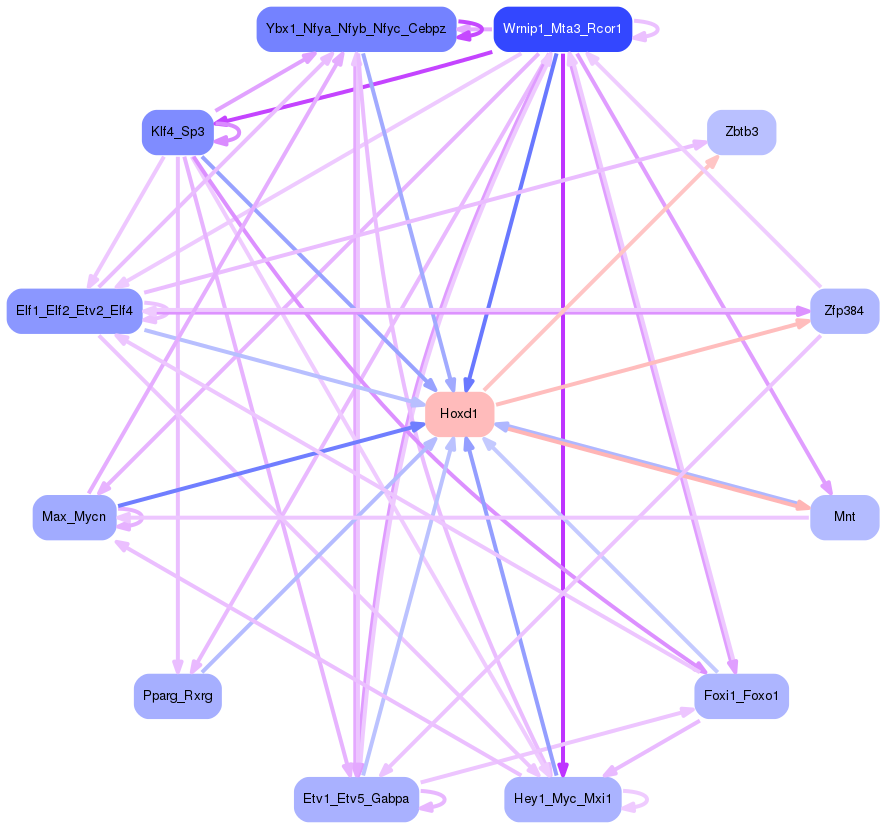
Network of associatons between targets according to the STRING database.

First level regulatory network of Hoxd1
Gene Ontology Analysis
Gene overrepresentation in biological process category:
| Log-likelihood per target | Total log-likelihood | Term | Description |
|---|---|---|---|
| 0.1 | 0.2 | GO:0061092 | regulation of phospholipid translocation(GO:0061091) positive regulation of phospholipid translocation(GO:0061092) |
| 0.1 | 0.2 | GO:0048378 | lateral mesodermal cell fate commitment(GO:0048372) lateral mesodermal cell fate specification(GO:0048377) regulation of lateral mesodermal cell fate specification(GO:0048378) mesendoderm development(GO:0048382) regulation of cardiac ventricle development(GO:1904412) |
| 0.1 | 0.2 | GO:0034085 | establishment of sister chromatid cohesion(GO:0034085) cohesin loading(GO:0071921) regulation of cohesin loading(GO:0071922) regulation of hepatocyte apoptotic process(GO:1903943) negative regulation of hepatocyte apoptotic process(GO:1903944) |
| 0.0 | 0.2 | GO:0098886 | modification of dendritic spine(GO:0098886) |
| 0.0 | 0.2 | GO:0032929 | negative regulation of superoxide anion generation(GO:0032929) |
| 0.0 | 0.1 | GO:0032474 | otolith morphogenesis(GO:0032474) |
| 0.0 | 0.1 | GO:0051684 | maintenance of Golgi location(GO:0051684) |
| 0.0 | 0.1 | GO:1905231 | carbohydrate export(GO:0033231) daunorubicin transport(GO:0043215) response to borneol(GO:1905230) cellular response to borneol(GO:1905231) response to codeine(GO:1905233) response to quercetin(GO:1905235) drug transport across blood-brain barrier(GO:1990962) establishment of blood-retinal barrier(GO:1990963) |
| 0.0 | 0.1 | GO:1901750 | leukotriene D4 metabolic process(GO:1901748) leukotriene D4 biosynthetic process(GO:1901750) |
| 0.0 | 0.1 | GO:0019086 | late viral transcription(GO:0019086) |
| 0.0 | 0.1 | GO:0030242 | pexophagy(GO:0030242) |
| 0.0 | 0.1 | GO:0032289 | central nervous system myelin formation(GO:0032289) |
| 0.0 | 0.1 | GO:1900126 | negative regulation of hyaluronan biosynthetic process(GO:1900126) |
| 0.0 | 0.1 | GO:0007199 | G-protein coupled receptor signaling pathway coupled to cGMP nucleotide second messenger(GO:0007199) |
| 0.0 | 0.1 | GO:0000350 | generation of catalytic spliceosome for second transesterification step(GO:0000350) |
| 0.0 | 0.2 | GO:0043951 | negative regulation of cAMP-mediated signaling(GO:0043951) |
| 0.0 | 0.1 | GO:1902412 | regulation of mitotic cytokinesis(GO:1902412) |
| 0.0 | 0.2 | GO:0001302 | replicative cell aging(GO:0001302) |
| 0.0 | 0.1 | GO:0072709 | cellular response to sorbitol(GO:0072709) |
| 0.0 | 0.1 | GO:2000601 | positive regulation of Arp2/3 complex-mediated actin nucleation(GO:2000601) |
| 0.0 | 0.1 | GO:0090024 | negative regulation of granulocyte chemotaxis(GO:0071623) negative regulation of neutrophil chemotaxis(GO:0090024) |
| 0.0 | 0.1 | GO:0007172 | signal complex assembly(GO:0007172) |
| 0.0 | 0.2 | GO:2000628 | regulation of miRNA metabolic process(GO:2000628) |
| 0.0 | 0.3 | GO:0000185 | activation of MAPKKK activity(GO:0000185) |
| 0.0 | 0.1 | GO:0031848 | protection from non-homologous end joining at telomere(GO:0031848) |
| 0.0 | 0.2 | GO:0042048 | olfactory behavior(GO:0042048) |
| 0.0 | 0.1 | GO:0010606 | positive regulation of cytoplasmic mRNA processing body assembly(GO:0010606) |
| 0.0 | 0.1 | GO:0034184 | positive regulation of maintenance of mitotic sister chromatid cohesion(GO:0034184) |
| 0.0 | 0.0 | GO:1901143 | insulin catabolic process(GO:1901143) |
| 0.0 | 0.1 | GO:0071233 | cellular response to leucine(GO:0071233) |
| 0.0 | 0.1 | GO:0051694 | pointed-end actin filament capping(GO:0051694) |
| 0.0 | 0.1 | GO:0002669 | positive regulation of T cell anergy(GO:0002669) positive regulation of lymphocyte anergy(GO:0002913) |
| 0.0 | 0.2 | GO:0010586 | miRNA metabolic process(GO:0010586) |
| 0.0 | 0.0 | GO:0006267 | pre-replicative complex assembly involved in nuclear cell cycle DNA replication(GO:0006267) pre-replicative complex assembly(GO:0036388) pre-replicative complex assembly involved in cell cycle DNA replication(GO:1902299) |
| 0.0 | 0.0 | GO:0071350 | monocyte extravasation(GO:0035696) interleukin-12-mediated signaling pathway(GO:0035722) interleukin-15-mediated signaling pathway(GO:0035723) cellular response to interleukin-12(GO:0071349) cellular response to interleukin-15(GO:0071350) |
| 0.0 | 0.0 | GO:0009099 | branched-chain amino acid biosynthetic process(GO:0009082) leucine biosynthetic process(GO:0009098) valine biosynthetic process(GO:0009099) |
Gene overrepresentation in cellular component category:
| Log-likelihood per target | Total log-likelihood | Term | Description |
|---|---|---|---|
| 0.1 | 0.2 | GO:0097444 | spine apparatus(GO:0097444) |
| 0.0 | 0.2 | GO:0030015 | CCR4-NOT core complex(GO:0030015) |
| 0.0 | 0.2 | GO:0035189 | Rb-E2F complex(GO:0035189) |
| 0.0 | 0.2 | GO:0097442 | CA3 pyramidal cell dendrite(GO:0097442) |
| 0.0 | 0.1 | GO:0097524 | sperm plasma membrane(GO:0097524) |
| 0.0 | 0.1 | GO:0035061 | interchromatin granule(GO:0035061) |
| 0.0 | 0.1 | GO:0031209 | SCAR complex(GO:0031209) |
| 0.0 | 0.1 | GO:0070419 | nonhomologous end joining complex(GO:0070419) |
| 0.0 | 0.1 | GO:0071817 | MMXD complex(GO:0071817) |
| 0.0 | 0.0 | GO:0005656 | nuclear pre-replicative complex(GO:0005656) pre-replicative complex(GO:0036387) |
Gene overrepresentation in molecular function category:
| Log-likelihood per target | Total log-likelihood | Term | Description |
|---|---|---|---|
| 0.0 | 0.3 | GO:0008349 | MAP kinase kinase kinase kinase activity(GO:0008349) |
| 0.0 | 0.2 | GO:0052629 | phosphatidylinositol-3,5-bisphosphate 3-phosphatase activity(GO:0052629) |
| 0.0 | 0.2 | GO:0098821 | BMP receptor activity(GO:0098821) |
| 0.0 | 0.2 | GO:0061676 | importin-alpha family protein binding(GO:0061676) |
| 0.0 | 0.1 | GO:0001226 | RNA polymerase II transcription corepressor binding(GO:0001226) |
| 0.0 | 0.1 | GO:0090555 | phosphatidylethanolamine-translocating ATPase activity(GO:0090555) |
| 0.0 | 0.1 | GO:1990050 | phosphatidic acid transporter activity(GO:1990050) |
| 0.0 | 0.1 | GO:0001849 | complement component C1q binding(GO:0001849) |
| 0.0 | 0.1 | GO:0000386 | second spliceosomal transesterification activity(GO:0000386) |
| 0.0 | 0.1 | GO:0070728 | leucine binding(GO:0070728) |
| 0.0 | 0.1 | GO:0001847 | opsonin receptor activity(GO:0001847) |
| 0.0 | 0.1 | GO:0035312 | 5'-3' exodeoxyribonuclease activity(GO:0035312) |
| 0.0 | 0.1 | GO:0004969 | histamine receptor activity(GO:0004969) |
| 0.0 | 0.1 | GO:0016300 | tRNA (uracil) methyltransferase activity(GO:0016300) |
| 0.0 | 0.0 | GO:0000991 | transcription factor activity, core RNA polymerase II binding(GO:0000991) |
| 0.0 | 0.1 | GO:0046912 | transferase activity, transferring acyl groups, acyl groups converted into alkyl on transfer(GO:0046912) |
| 0.0 | 0.1 | GO:0001729 | ceramide kinase activity(GO:0001729) |
| 0.0 | 0.1 | GO:0001642 | group III metabotropic glutamate receptor activity(GO:0001642) |
| 0.0 | 0.1 | GO:0003840 | gamma-glutamyltransferase activity(GO:0003840) glutathione hydrolase activity(GO:0036374) |
| 0.0 | 0.2 | GO:0035925 | mRNA 3'-UTR AU-rich region binding(GO:0035925) |
| 0.0 | 0.0 | GO:0000293 | ferric-chelate reductase activity(GO:0000293) |
| 0.0 | 0.2 | GO:0004012 | phospholipid-translocating ATPase activity(GO:0004012) |
| 0.0 | 0.0 | GO:0052654 | branched-chain-amino-acid transaminase activity(GO:0004084) L-leucine transaminase activity(GO:0052654) L-valine transaminase activity(GO:0052655) L-isoleucine transaminase activity(GO:0052656) |
Gene overrepresentation in curated gene sets: REACTOME pathways category:
| Log-likelihood per target | Total log-likelihood | Term | Description |
|---|---|---|---|
| 0.0 | 0.2 | REACTOME CREATION OF C4 AND C2 ACTIVATORS | Genes involved in Creation of C4 and C2 activators |