Project
GSE49485: Hypoxia transcriptome sequencing of rat brain.
Navigation
Downloads
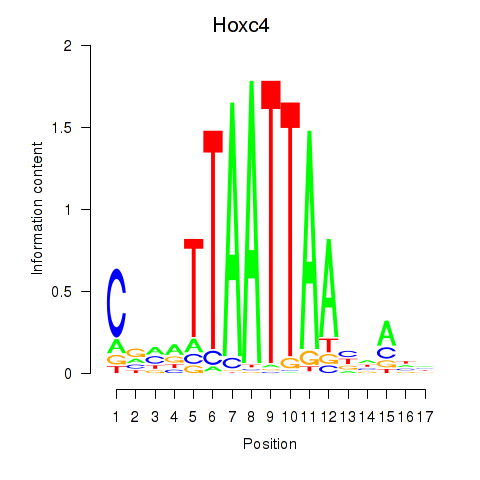
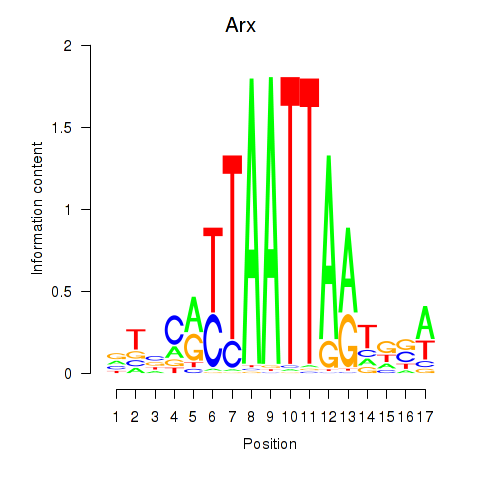
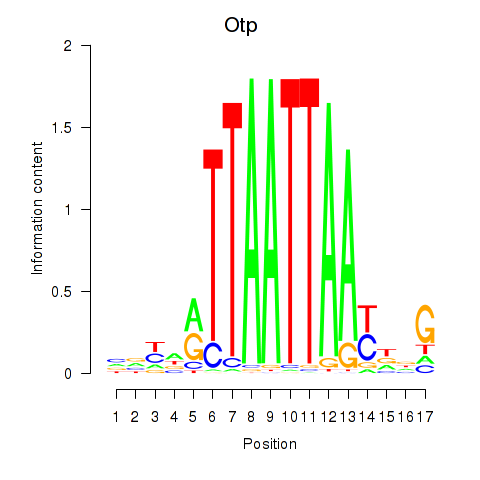
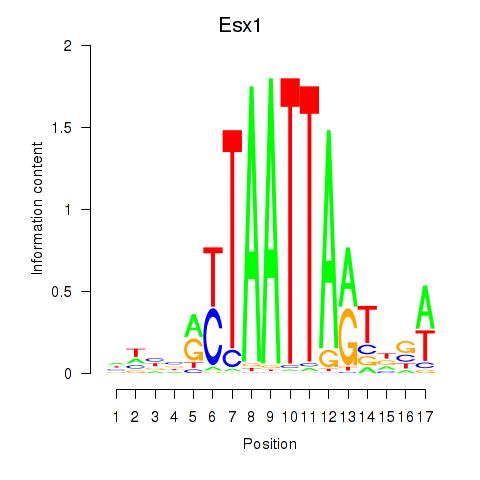
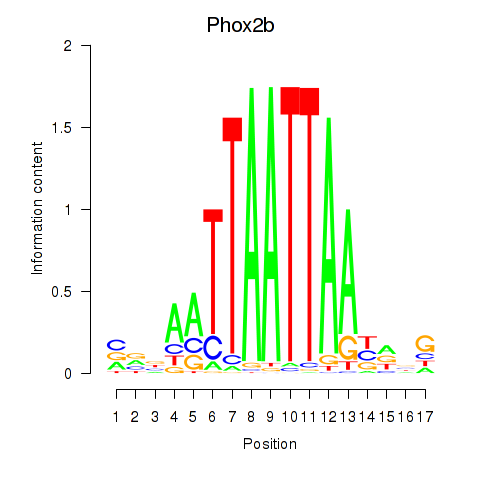
Results for Hoxc4_Arx_Otp_Esx1_Phox2b
Z-value: 0.92
Motif logo
Transcription factors associated with Hoxc4_Arx_Otp_Esx1_Phox2b
| Gene Symbol | Gene ID | Gene Info |
|---|---|---|
|
Hoxc4
|
ENSRNOG00000016613 | homeo box C4 |
|
Arx
|
ENSRNOG00000053562 | aristaless related homeobox |
|
Otp
|
ENSRNOG00000010560 | orthopedia homeobox |
|
Esx1
|
ENSRNOG00000048011 | ESX homeobox 1 |
|
Phox2b
|
ENSRNOG00000051929 | paired-like homeobox 2b |
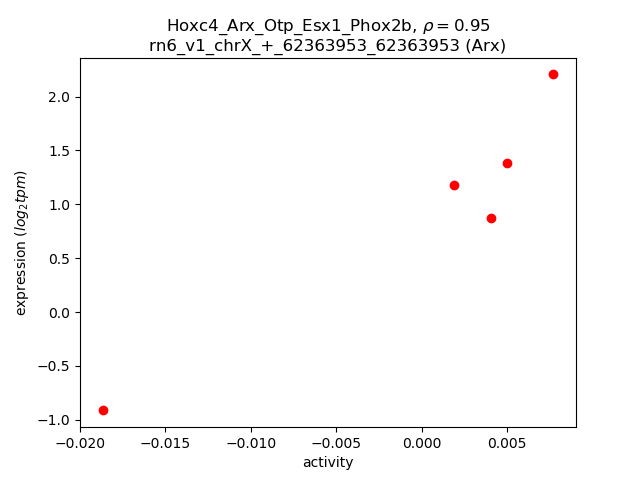
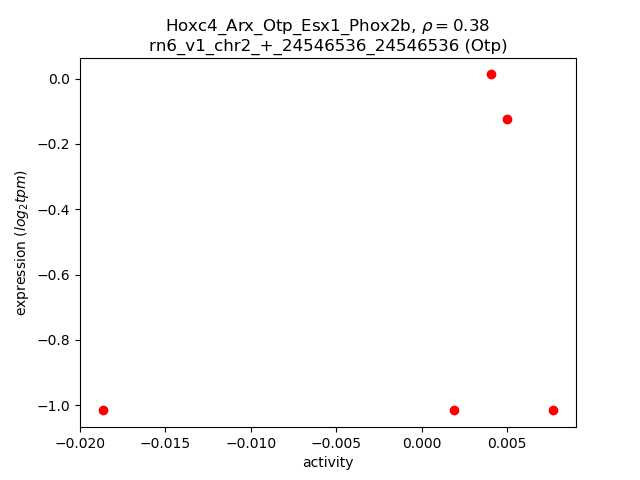
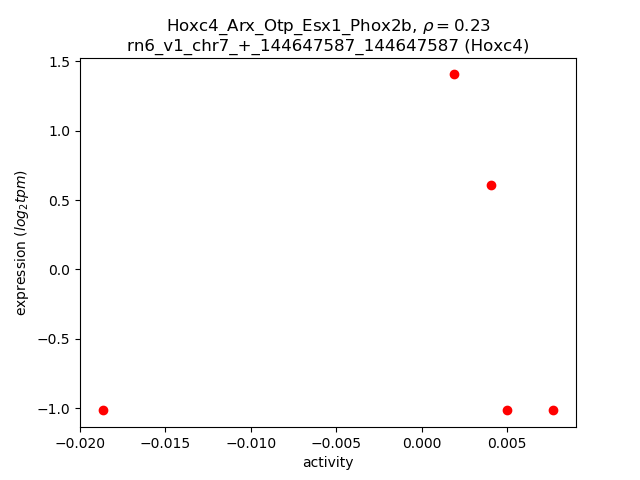
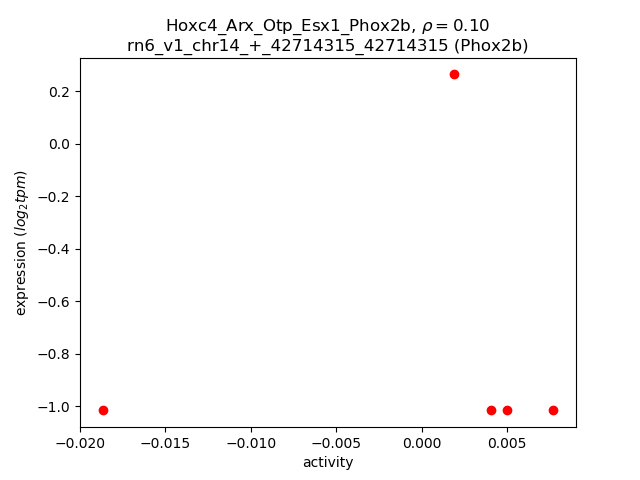
Activity-expression correlation:
| Gene | Promoter | Pearson corr. coef. | P-value | Plot |
|---|---|---|---|---|
| Arx | rn6_v1_chrX_+_62363953_62363953 | 0.95 | 1.2e-02 | Click! |
| Otp | rn6_v1_chr2_+_24546536_24546536 | 0.38 | 5.2e-01 | Click! |
| Hoxc4 | rn6_v1_chr7_+_144647587_144647587 | 0.23 | 7.1e-01 | Click! |
| Phox2b | rn6_v1_chr14_+_42714315_42714315 | 0.10 | 8.7e-01 | Click! |
Activity profile of Hoxc4_Arx_Otp_Esx1_Phox2b motif
Sorted Z-values of Hoxc4_Arx_Otp_Esx1_Phox2b motif
| Promoter | Log-likelihood | Transcript | Gene | Gene Info |
|---|---|---|---|---|
| chr12_-_2174131 | 2.26 |
ENSRNOT00000001313
|
Pcp2
|
Purkinje cell protein 2 |
| chr1_-_190370499 | 1.35 |
ENSRNOT00000084389
|
AABR07005618.1
|
|
| chr10_-_88670430 | 1.12 |
ENSRNOT00000025547
|
Hcrt
|
hypocretin neuropeptide precursor |
| chrX_+_144994139 | 0.83 |
ENSRNOT00000071783
|
LOC102546596
|
pre-mRNA-splicing factor CWC22 homolog |
| chr2_+_127525285 | 0.83 |
ENSRNOT00000093247
|
Intu
|
inturned planar cell polarity protein |
| chr15_+_37790141 | 0.72 |
ENSRNOT00000076392
ENSRNOT00000091953 |
Il17d
|
interleukin 17D |
| chr4_+_169161585 | 0.61 |
ENSRNOT00000079785
|
Emp1
|
epithelial membrane protein 1 |
| chrX_-_40086870 | 0.59 |
ENSRNOT00000010027
|
Smpx
|
small muscle protein, X-linked |
| chr2_+_158097843 | 0.56 |
ENSRNOT00000016541
|
Ptx3
|
pentraxin 3 |
| chr10_+_61685645 | 0.48 |
ENSRNOT00000003933
|
Mnt
|
MAX network transcriptional repressor |
| chr2_+_122877286 | 0.44 |
ENSRNOT00000033080
|
Arse
|
arylsulfatase E |
| chr2_+_145174876 | 0.40 |
ENSRNOT00000040631
|
Mab21l1
|
mab-21 like 1 |
| chr3_+_159368273 | 0.39 |
ENSRNOT00000041688
|
Sgk2
|
serum/glucocorticoid regulated kinase 2 |
| chr4_+_169147243 | 0.35 |
ENSRNOT00000011580
|
Emp1
|
epithelial membrane protein 1 |
| chr18_-_55891710 | 0.29 |
ENSRNOT00000064686
|
Synpo
|
synaptopodin |
| chr10_+_43601689 | 0.29 |
ENSRNOT00000029238
|
Mrpl22
|
mitochondrial ribosomal protein L22 |
| chrX_-_138118696 | 0.27 |
ENSRNOT00000084130
|
Frmd7
|
FERM domain containing 7 |
| chr15_-_34198921 | 0.27 |
ENSRNOT00000024991
|
Nrl
|
neural retina leucine zipper |
| chr14_+_34446616 | 0.26 |
ENSRNOT00000002976
|
Clock
|
clock circadian regulator |
| chr19_-_43192208 | 0.24 |
ENSRNOT00000025179
|
Exosc6
|
exosome component 6 |
| chr4_+_29535852 | 0.23 |
ENSRNOT00000087619
|
NEWGENE_621351
|
collagen, type I, alpha 2 |
| chr16_+_7035241 | 0.22 |
ENSRNOT00000084977
|
Nek4
|
NIMA-related kinase 4 |
| chr6_+_28382962 | 0.22 |
ENSRNOT00000016976
|
Pomc
|
proopiomelanocortin |
| chr6_-_104290579 | 0.21 |
ENSRNOT00000066014
|
Erh
|
enhancer of rudimentary homolog (Drosophila) |
| chr5_-_2982603 | 0.21 |
ENSRNOT00000045460
|
Kcnb2
|
potassium voltage-gated channel subfamily B member 2 |
| chr6_+_104291071 | 0.20 |
ENSRNOT00000006798
|
Slc39a9
|
solute carrier family 39, member 9 |
| chr4_-_18396035 | 0.20 |
ENSRNOT00000034692
|
Sema3a
|
semaphorin 3A |
| chr14_-_115052450 | 0.20 |
ENSRNOT00000067998
|
Acyp2
|
acylphosphatase 2 |
| chr10_+_103206014 | 0.20 |
ENSRNOT00000004081
|
Ttyh2
|
tweety family member 2 |
| chr17_-_79085076 | 0.19 |
ENSRNOT00000057851
|
Fam171a1
|
family with sequence similarity 171, member A1 |
| chr2_-_198706428 | 0.19 |
ENSRNOT00000085006
|
Polr3gl
|
RNA polymerase III subunit G like |
| chr4_+_168752133 | 0.19 |
ENSRNOT00000010289
|
Apold1
|
apolipoprotein L domain containing 1 |
| chr1_-_278042312 | 0.17 |
ENSRNOT00000018693
|
Ablim1
|
actin-binding LIM protein 1 |
| chr3_+_163552166 | 0.17 |
ENSRNOT00000049082
|
Tp53rk
|
TP53 regulating kinase |
| chr5_+_187312 | 0.17 |
ENSRNOT00000030857
|
LOC102557117
|
zinc finger protein 120-like |
| chr7_+_28654733 | 0.16 |
ENSRNOT00000006174
|
Pmch
|
pro-melanin-concentrating hormone |
| chr3_+_3389612 | 0.15 |
ENSRNOT00000041984
|
Rpl8
|
ribosomal protein L8 |
| chr14_-_16903242 | 0.15 |
ENSRNOT00000003001
|
Shroom3
|
shroom family member 3 |
| chr16_+_70081035 | 0.14 |
ENSRNOT00000016098
|
LOC100912059
|
ubiquitin carboxyl-terminal hydrolase 12-like |
| chr9_+_71915421 | 0.13 |
ENSRNOT00000020447
|
Pikfyve
|
phosphoinositide kinase, FYVE-type zinc finger containing |
| chr8_+_71914867 | 0.13 |
ENSRNOT00000023372
|
Dapk2
|
death-associated protein kinase 2 |
| chr12_+_49665282 | 0.13 |
ENSRNOT00000086397
|
Grk3
|
G protein-coupled receptor kinase 3 |
| chr1_+_80279706 | 0.13 |
ENSRNOT00000047105
|
Ppp1r13l
|
protein phosphatase 1, regulatory subunit 13 like |
| chr13_-_102857551 | 0.13 |
ENSRNOT00000080309
|
Mark1
|
microtubule affinity regulating kinase 1 |
| chr20_+_3176107 | 0.12 |
ENSRNOT00000001036
|
RT1-S3
|
RT1 class Ib, locus S3 |
| chr4_-_180505916 | 0.12 |
ENSRNOT00000086465
|
AABR07062512.1
|
|
| chr6_+_101532518 | 0.12 |
ENSRNOT00000075054
|
Gphn
|
gephyrin |
| chr10_-_67401836 | 0.12 |
ENSRNOT00000073071
|
Crlf3
|
cytokine receptor-like factor 3 |
| chr17_-_14627937 | 0.12 |
ENSRNOT00000020532
|
NEWGENE_1308171
|
osteoglycin |
| chr20_+_3155652 | 0.12 |
ENSRNOT00000042882
|
RT1-S2
|
RT1 class Ib, locus S2 |
| chr20_+_42966140 | 0.12 |
ENSRNOT00000000707
|
Marcks
|
myristoylated alanine rich protein kinase C substrate |
| chr2_+_30685840 | 0.12 |
ENSRNOT00000031385
|
Ccdc125
|
coiled-coil domain containing 125 |
| chr8_-_83280888 | 0.11 |
ENSRNOT00000052341
|
Gfral
|
GDNF family receptor alpha like |
| chrX_+_111735820 | 0.11 |
ENSRNOT00000086948
|
Frmpd3
|
FERM and PDZ domain containing 3 |
| chr12_-_10967326 | 0.11 |
ENSRNOT00000042095
|
LOC100912059
|
ubiquitin carboxyl-terminal hydrolase 12-like |
| chr16_-_20562399 | 0.11 |
ENSRNOT00000031692
|
Lrrc25
|
leucine rich repeat containing 25 |
| chr5_-_161981441 | 0.10 |
ENSRNOT00000020316
|
Pdpn
|
podoplanin |
| chr7_-_143967484 | 0.10 |
ENSRNOT00000081758
|
Sp7
|
Sp7 transcription factor |
| chr13_-_50514151 | 0.10 |
ENSRNOT00000003951
|
Ren
|
renin |
| chr2_+_240642847 | 0.10 |
ENSRNOT00000079694
|
Ube2d3
|
ubiquitin-conjugating enzyme E2D 3 |
| chr3_-_57607683 | 0.10 |
ENSRNOT00000093222
ENSRNOT00000058524 |
Mettl8
|
methyltransferase like 8 |
| chr14_+_45982244 | 0.10 |
ENSRNOT00000076881
ENSRNOT00000002984 |
Rell1
|
RELT-like 1 |
| chr15_-_80713153 | 0.10 |
ENSRNOT00000063800
|
Klhl1
|
kelch-like family member 1 |
| chr18_-_43945273 | 0.10 |
ENSRNOT00000088900
|
Dtwd2
|
DTW domain containing 2 |
| chr4_+_88328061 | 0.10 |
ENSRNOT00000084775
|
Vom1r87
|
vomeronasal 1 receptor 87 |
| chr20_+_3246739 | 0.09 |
ENSRNOT00000061299
|
RT1-T24-2
|
RT1 class I, locus T24, gene 2 |
| chr17_-_87826421 | 0.09 |
ENSRNOT00000068156
|
Arhgap21
|
Rho GTPase activating protein 21 |
| chr4_-_168656673 | 0.09 |
ENSRNOT00000009341
|
Gpr19
|
G protein-coupled receptor 19 |
| chr12_+_25435567 | 0.09 |
ENSRNOT00000092982
|
Gtf2i
|
general transcription factor II I |
| chr5_+_28485619 | 0.08 |
ENSRNOT00000093341
ENSRNOT00000093129 |
LOC100912373
|
uncharacterized LOC100912373 |
| chr20_+_44680449 | 0.08 |
ENSRNOT00000000728
|
Traf3ip2
|
Traf3 interacting protein 2 |
| chr11_-_62067655 | 0.08 |
ENSRNOT00000093382
|
Zbtb20
|
zinc finger and BTB domain containing 20 |
| chr8_-_126390801 | 0.08 |
ENSRNOT00000089732
|
AABR07071661.1
|
|
| chr1_-_215284548 | 0.08 |
ENSRNOT00000090375
|
Cttn
|
cortactin |
| chr5_+_50381244 | 0.08 |
ENSRNOT00000012385
|
Cga
|
glycoprotein hormones, alpha polypeptide |
| chr6_+_104291340 | 0.08 |
ENSRNOT00000089313
|
Slc39a9
|
solute carrier family 39, member 9 |
| chr13_-_111581018 | 0.08 |
ENSRNOT00000083072
ENSRNOT00000077981 |
Sertad4
|
SERTA domain containing 4 |
| chr6_-_7058314 | 0.08 |
ENSRNOT00000045996
|
Haao
|
3-hydroxyanthranilate 3,4-dioxygenase |
| chr4_+_180291389 | 0.08 |
ENSRNOT00000002465
|
Sspn
|
sarcospan |
| chr17_-_22678253 | 0.08 |
ENSRNOT00000083122
|
LOC100362172
|
LRRGT00112-like |
| chr4_+_24612205 | 0.08 |
ENSRNOT00000057382
|
Ewsr1
|
EWS RNA-binding protein 1 |
| chr10_-_29026002 | 0.08 |
ENSRNOT00000005070
|
Pttg1
|
pituitary tumor-transforming 1 |
| chrX_+_74200972 | 0.07 |
ENSRNOT00000076956
|
Chic1
|
cysteine-rich hydrophobic domain 1 |
| chrX_-_77559348 | 0.07 |
ENSRNOT00000047823
|
Fndc3c1
|
fibronectin type III domain containing 3C1 |
| chr20_+_4966817 | 0.07 |
ENSRNOT00000081527
ENSRNOT00000081265 |
Lsm2
|
LSM2 homolog, U6 small nuclear RNA and mRNA degradation associated |
| chr16_-_83084975 | 0.07 |
ENSRNOT00000017947
|
Arhgef7
|
Rho guanine nucleotide exchange factor 7 |
| chr3_-_111087347 | 0.07 |
ENSRNOT00000018277
|
Rhov
|
ras homolog family member V |
| chr12_-_35979193 | 0.07 |
ENSRNOT00000071104
|
Tmem132b
|
transmembrane protein 132B |
| chr6_+_47940183 | 0.07 |
ENSRNOT00000011951
|
Adi1
|
acireductone dioxygenase 1 |
| chr19_+_39229754 | 0.07 |
ENSRNOT00000050612
|
Vps4a
|
vacuolar protein sorting 4 homolog A |
| chr10_-_4257868 | 0.07 |
ENSRNOT00000035886
|
Tnfrsf17
|
TNF receptor superfamily member 17 |
| chr13_-_32427177 | 0.07 |
ENSRNOT00000044628
|
Cdh19
|
cadherin 19 |
| chr17_-_90071408 | 0.06 |
ENSRNOT00000071978
|
Pdss1
|
decaprenyl diphosphate synthase subunit 1 |
| chr1_+_88113445 | 0.06 |
ENSRNOT00000056955
|
Ggn
|
gametogenetin |
| chr3_-_120076788 | 0.06 |
ENSRNOT00000047158
|
Kcnip3
|
potassium voltage-gated channel interacting protein 3 |
| chr7_-_28711761 | 0.06 |
ENSRNOT00000006249
|
Parpbp
|
PARP1 binding protein |
| chr6_-_26241337 | 0.06 |
ENSRNOT00000006525
|
Slc4a1ap
|
solute carrier family 4 member 1 adaptor protein |
| chr9_+_10941613 | 0.06 |
ENSRNOT00000070794
|
Sema6b
|
semaphorin 6B |
| chr12_-_46493203 | 0.06 |
ENSRNOT00000057036
|
Cit
|
citron rho-interacting serine/threonine kinase |
| chr13_+_57243877 | 0.06 |
ENSRNOT00000083693
|
Kcnt2
|
potassium sodium-activated channel subfamily T member 2 |
| chr7_+_2458833 | 0.06 |
ENSRNOT00000085092
|
Naca
|
nascent polypeptide-associated complex alpha subunit |
| chr2_+_80269661 | 0.06 |
ENSRNOT00000015975
|
AABR07008940.1
|
|
| chr9_+_61692154 | 0.06 |
ENSRNOT00000082300
|
Hspe1
|
heat shock protein family E member 1 |
| chr10_+_29033989 | 0.06 |
ENSRNOT00000088322
|
Slu7
|
SLU7 homolog, splicing factor |
| chr19_+_40855433 | 0.06 |
ENSRNOT00000023823
|
Il34
|
interleukin 34 |
| chr2_-_185852759 | 0.06 |
ENSRNOT00000049461
|
Mab21l2
|
mab-21 like 2 |
| chr1_-_215033460 | 0.06 |
ENSRNOT00000044565
|
Dusp8
|
dual specificity phosphatase 8 |
| chr17_+_22984844 | 0.06 |
ENSRNOT00000078310
|
Nedd9
|
neural precursor cell expressed, developmentally down-regulated 9 |
| chr9_+_27546528 | 0.06 |
ENSRNOT00000051403
|
Khdc1
|
KH homology domain containing 1 |
| chrX_+_15113878 | 0.06 |
ENSRNOT00000007464
|
Wdr13
|
WD repeat domain 13 |
| chr17_-_43776460 | 0.05 |
ENSRNOT00000089055
|
Hist2h3c2
|
histone cluster 2, H3c2 |
| chr9_-_105693357 | 0.05 |
ENSRNOT00000066968
|
Nudt12
|
nudix hydrolase 12 |
| chr4_-_72143748 | 0.05 |
ENSRNOT00000024428
|
Tcaf1
|
TRPM8 channel-associated factor 1 |
| chr8_+_40009691 | 0.05 |
ENSRNOT00000042679
|
Vsig2
|
V-set and immunoglobulin domain containing 2 |
| chr5_-_119564846 | 0.05 |
ENSRNOT00000012977
|
Cyp2j4
|
cytochrome P450, family 2, subfamily j, polypeptide 4 |
| chr11_+_36851038 | 0.05 |
ENSRNOT00000002221
ENSRNOT00000061047 |
Pcp4
|
Purkinje cell protein 4 |
| chr4_+_155321553 | 0.05 |
ENSRNOT00000089614
|
Mfap5
|
microfibrillar associated protein 5 |
| chr20_+_3230052 | 0.05 |
ENSRNOT00000078454
|
RT1-T24-3
|
RT1 class I, locus T24, gene 3 |
| chr3_+_14889510 | 0.05 |
ENSRNOT00000080760
|
Dab2ip
|
DAB2 interacting protein |
| chr9_+_20241062 | 0.05 |
ENSRNOT00000071593
|
LOC100911585
|
leucine-rich repeat-containing protein 23-like |
| chr8_+_106449321 | 0.05 |
ENSRNOT00000018622
|
Rbp1
|
retinol binding protein 1 |
| chr1_-_107373807 | 0.05 |
ENSRNOT00000056024
|
Svip
|
small VCP interacting protein |
| chr4_-_157304653 | 0.05 |
ENSRNOT00000051613
|
Lrrc23
|
leucine rich repeat containing 23 |
| chr11_+_46184871 | 0.05 |
ENSRNOT00000048417
|
Tfg
|
Trk-fused gene |
| chr4_-_115208026 | 0.05 |
ENSRNOT00000084388
ENSRNOT00000066678 |
Dguok
|
deoxyguanosine kinase |
| chr14_+_82769642 | 0.05 |
ENSRNOT00000065393
|
Ctbp1
|
C-terminal binding protein 1 |
| chr3_-_154627257 | 0.05 |
ENSRNOT00000018328
|
Tgm2
|
transglutaminase 2 |
| chr16_+_2537248 | 0.05 |
ENSRNOT00000017995
|
Asb14
|
ankyrin repeat and SOCS box-containing 14 |
| chr17_-_89923423 | 0.05 |
ENSRNOT00000076964
|
Acbd5
|
acyl-CoA binding domain containing 5 |
| chr3_-_37854561 | 0.05 |
ENSRNOT00000076095
|
Neb
|
nebulin |
| chr1_+_229416489 | 0.05 |
ENSRNOT00000028617
|
Olr336
|
olfactory receptor 336 |
| chr8_-_39460844 | 0.04 |
ENSRNOT00000048875
|
Pknox2
|
PBX/knotted 1 homeobox 2 |
| chr18_-_37819097 | 0.04 |
ENSRNOT00000025880
|
Dpysl3
|
dihydropyrimidinase-like 3 |
| chr2_+_219598162 | 0.04 |
ENSRNOT00000020297
|
Lrrc39
|
leucine rich repeat containing 39 |
| chr9_+_117538009 | 0.04 |
ENSRNOT00000022878
|
Epb41l3
|
erythrocyte membrane protein band 4.1-like 3 |
| chr2_+_239415046 | 0.04 |
ENSRNOT00000072196
|
Cxxc4
|
CXXC finger protein 4 |
| chr18_-_60002529 | 0.04 |
ENSRNOT00000081014
ENSRNOT00000024264 ENSRNOT00000059162 |
Nars
|
asparaginyl-tRNA synthetase |
| chr15_+_108318664 | 0.04 |
ENSRNOT00000057469
|
Ubac2
|
UBA domain containing 2 |
| chr12_-_37538403 | 0.04 |
ENSRNOT00000001402
|
Snrnp35
|
small nuclear ribonucleoprotein U11/U12 subunit 35 |
| chr7_-_58365313 | 0.04 |
ENSRNOT00000005443
|
Thap2
|
THAP domain containing 2 |
| chr4_-_180234804 | 0.04 |
ENSRNOT00000070957
|
Bhlhe41
|
basic helix-loop-helix family, member e41 |
| chr4_-_170932618 | 0.04 |
ENSRNOT00000007779
|
Arhgdib
|
Rho GDP dissociation inhibitor beta |
| chr1_-_15374850 | 0.04 |
ENSRNOT00000016728
|
Pex7
|
peroxisomal biogenesis factor 7 |
| chr7_+_120923274 | 0.04 |
ENSRNOT00000049247
|
Gtpbp1
|
GTP binding protein 1 |
| chr1_-_217631862 | 0.04 |
ENSRNOT00000078514
ENSRNOT00000079805 |
Cttn
|
cortactin |
| chr2_-_33025271 | 0.04 |
ENSRNOT00000074941
|
NEWGENE_1310139
|
microtubule associated serine/threonine kinase family member 4 |
| chr12_-_23727535 | 0.04 |
ENSRNOT00000085911
ENSRNOT00000001950 |
Dtx2
|
deltex E3 ubiquitin ligase 2 |
| chr4_-_66955732 | 0.04 |
ENSRNOT00000084282
|
Kdm7a
|
lysine (K)-specific demethylase 7A |
| chr1_-_228014924 | 0.04 |
ENSRNOT00000042091
|
Oosp2
|
oocyte secreted protein 2 |
| chr12_-_45801842 | 0.04 |
ENSRNOT00000078837
|
AABR07036513.1
|
|
| chr2_-_186245342 | 0.04 |
ENSRNOT00000057062
ENSRNOT00000022292 |
Dclk2
|
doublecortin-like kinase 2 |
| chr9_+_79630604 | 0.04 |
ENSRNOT00000021539
ENSRNOT00000083979 |
Tmem169
|
transmembrane protein 169 |
| chr4_-_80395502 | 0.04 |
ENSRNOT00000014437
|
Npvf
|
neuropeptide VF precursor |
| chr18_+_29951094 | 0.04 |
ENSRNOT00000027402
|
LOC102553180
|
protocadherin alpha-1-like |
| chr8_+_22559098 | 0.04 |
ENSRNOT00000041091
|
LOC691141
|
hypothetical protein LOC691141 |
| chr1_+_251633199 | 0.04 |
ENSRNOT00000084785
|
AC094647.2
|
|
| chr2_-_147392062 | 0.04 |
ENSRNOT00000021535
|
Tm4sf1
|
transmembrane 4 L six family member 1 |
| chr7_-_120770435 | 0.03 |
ENSRNOT00000077000
|
Ddx17
|
DEAD-box helicase 17 |
| chr17_-_78499881 | 0.03 |
ENSRNOT00000079260
|
Fam107b
|
family with sequence similarity 107, member B |
| chr20_+_19325121 | 0.03 |
ENSRNOT00000058151
|
Phyhipl
|
phytanoyl-CoA 2-hydroxylase interacting protein-like |
| chrX_+_37329779 | 0.03 |
ENSRNOT00000038352
ENSRNOT00000088802 |
Pdha1
|
pyruvate dehydrogenase (lipoamide) alpha 1 |
| chr19_+_46465647 | 0.03 |
ENSRNOT00000093714
|
Nudt7
|
nudix hydrolase 7 |
| chr10_+_83476107 | 0.03 |
ENSRNOT00000075733
|
Phb
|
prohibitin |
| chr5_+_114516889 | 0.03 |
ENSRNOT00000011767
|
Fggy
|
FGGY carbohydrate kinase domain containing |
| chr2_-_96509424 | 0.03 |
ENSRNOT00000090866
|
Zc2hc1a
|
zinc finger, C2HC-type containing 1A |
| chr10_-_62184874 | 0.03 |
ENSRNOT00000004229
|
Rpa1
|
replication protein A1 |
| chr16_-_29936307 | 0.03 |
ENSRNOT00000088707
|
Ddx60
|
DEAD (Asp-Glu-Ala-Asp) box polypeptide 60 |
| chr5_+_153269526 | 0.03 |
ENSRNOT00000091494
|
Syf2
|
SYF2 pre-mRNA-splicing factor |
| chr5_+_135354700 | 0.03 |
ENSRNOT00000021850
|
Ipp
|
intracisternal A particle-promoted polypeptide |
| chr7_-_29171783 | 0.03 |
ENSRNOT00000079235
|
Mybpc1
|
myosin binding protein C, slow type |
| chr13_+_84474319 | 0.03 |
ENSRNOT00000031367
ENSRNOT00000072244 ENSRNOT00000072897 ENSRNOT00000064168 ENSRNOT00000074954 ENSRNOT00000073696 |
Ildr2
|
immunoglobulin-like domain containing receptor 2 |
| chr7_+_2752680 | 0.03 |
ENSRNOT00000033726
|
Cs
|
citrate synthase |
| chr2_-_123972356 | 0.03 |
ENSRNOT00000023348
|
Il21
|
interleukin 21 |
| chr2_+_248398917 | 0.03 |
ENSRNOT00000045855
|
Gbp1
|
guanylate binding protein 1 |
| chr18_+_70739492 | 0.03 |
ENSRNOT00000085601
|
Acaa2
|
acetyl-CoA acyltransferase 2 |
| chrX_-_104932508 | 0.03 |
ENSRNOT00000075325
|
Nox1
|
NADPH oxidase 1 |
| chr16_+_46731403 | 0.03 |
ENSRNOT00000017624
|
Tenm3
|
teneurin transmembrane protein 3 |
| chr5_+_139790395 | 0.03 |
ENSRNOT00000015033
|
Rims3
|
regulating synaptic membrane exocytosis 3 |
| chrX_+_78042859 | 0.03 |
ENSRNOT00000003286
|
Lpar4
|
lysophosphatidic acid receptor 4 |
| chr16_+_39145230 | 0.03 |
ENSRNOT00000092942
|
Adam21
|
ADAM metallopeptidase domain 21 |
| chr4_-_100252755 | 0.03 |
ENSRNOT00000017301
|
Vamp8
|
vesicle-associated membrane protein 8 |
| chr3_+_7884822 | 0.03 |
ENSRNOT00000019157
|
Med27
|
mediator complex subunit 27 |
| chr16_+_7758996 | 0.03 |
ENSRNOT00000061063
|
Btd
|
biotinidase |
| chr8_-_121973125 | 0.03 |
ENSRNOT00000012114
|
Pdcd6ip
|
programmed cell death 6 interacting protein |
| chr13_+_90260783 | 0.03 |
ENSRNOT00000050547
|
Cd84
|
CD84 molecule |
| chr1_+_213636093 | 0.02 |
ENSRNOT00000019642
|
Psmd13
|
proteasome 26S subunit, non-ATPase 13 |
| chr5_-_17061361 | 0.02 |
ENSRNOT00000089318
|
Penk
|
proenkephalin |
| chr10_-_65502936 | 0.02 |
ENSRNOT00000089615
|
Supt6h
|
SPT6 homolog, histone chaperone |
| chr1_-_185569190 | 0.02 |
ENSRNOT00000090773
|
RGD1311703
|
similar to sid2057p |
| chr10_+_83201311 | 0.02 |
ENSRNOT00000006179
|
Slc35b1
|
solute carrier family 35, member B1 |
| chr10_+_69412017 | 0.02 |
ENSRNOT00000009448
|
Ccl2
|
C-C motif chemokine ligand 2 |
| chr11_+_47061354 | 0.02 |
ENSRNOT00000039997
|
Pcnp
|
PEST proteolytic signal containing nuclear protein |
| chr5_-_166116516 | 0.02 |
ENSRNOT00000079919
ENSRNOT00000080888 |
Kif1b
|
kinesin family member 1B |
| chr14_+_22375955 | 0.02 |
ENSRNOT00000063915
ENSRNOT00000034784 |
Ugt2b37
|
UDP-glucuronosyltransferase 2 family, member 37 |
| chr6_+_26241672 | 0.02 |
ENSRNOT00000006543
|
Supt7l
|
SPT7-like STAGA complex gamma subunit |
| chr16_+_25773602 | 0.02 |
ENSRNOT00000047750
|
Gapdh-ps2
|
glyceraldehyde-3-phosphate dehydrogenase, pseudogene 2 |
| chr13_+_49005405 | 0.02 |
ENSRNOT00000092560
ENSRNOT00000076457 |
Lemd1
|
LEM domain containing 1 |
| chr4_-_146954159 | 0.02 |
ENSRNOT00000010397
|
Tamm41
|
TAM41 mitochondrial translocator assembly and maintenance homolog |
| chr8_-_78096302 | 0.02 |
ENSRNOT00000086185
ENSRNOT00000077999 |
Myzap
|
myocardial zonula adherens protein |
| chr10_-_82117109 | 0.02 |
ENSRNOT00000079711
|
Abcc3
|
ATP binding cassette subfamily C member 3 |
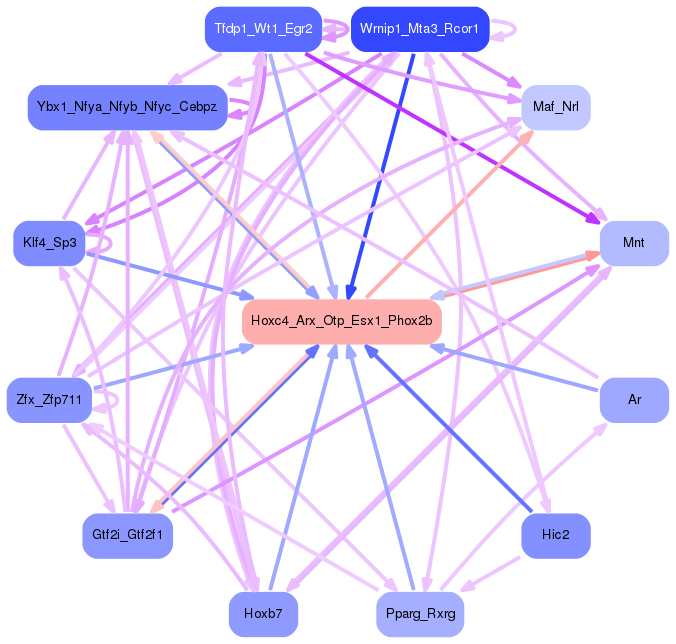
Network of associatons between targets according to the STRING database.

First level regulatory network of Hoxc4_Arx_Otp_Esx1_Phox2b
Gene Ontology Analysis
Gene overrepresentation in biological process category:
| Log-likelihood per target | Total log-likelihood | Term | Description |
|---|---|---|---|
| 0.3 | 2.0 | GO:0016056 | rhodopsin mediated signaling pathway(GO:0016056) |
| 0.2 | 0.6 | GO:0052422 | modulation of catalytic activity in other organism involved in symbiotic interaction(GO:0052203) modulation by host of symbiont catalytic activity(GO:0052422) regulation of exo-alpha-sialidase activity(GO:1903015) |
| 0.2 | 1.1 | GO:0051970 | negative regulation of transmission of nerve impulse(GO:0051970) |
| 0.1 | 0.3 | GO:0007468 | regulation of rhodopsin gene expression(GO:0007468) |
| 0.1 | 0.3 | GO:0098886 | modification of dendritic spine(GO:0098886) |
| 0.1 | 0.9 | GO:0032060 | bleb assembly(GO:0032060) |
| 0.1 | 0.2 | GO:0021886 | cerebral cortex tangential migration using cell-axon interactions(GO:0021824) gonadotrophin-releasing hormone neuronal migration to the hypothalamus(GO:0021828) hypothalamic tangential migration using cell-axon interactions(GO:0021856) hypothalamus gonadotrophin-releasing hormone neuron differentiation(GO:0021886) hypothalamus gonadotrophin-releasing hormone neuron development(GO:0021888) facioacoustic ganglion development(GO:1903375) |
| 0.0 | 0.1 | GO:2000424 | regulation of eosinophil chemotaxis(GO:2000422) positive regulation of eosinophil chemotaxis(GO:2000424) |
| 0.0 | 0.1 | GO:0046154 | eye pigment metabolic process(GO:0042441) pigment metabolic process involved in developmental pigmentation(GO:0043324) pigment metabolic process involved in pigmentation(GO:0043474) rhodopsin metabolic process(GO:0046154) |
| 0.0 | 0.3 | GO:2000323 | negative regulation of glucocorticoid receptor signaling pathway(GO:2000323) |
| 0.0 | 0.1 | GO:0032679 | antigen processing and presentation of endogenous peptide antigen via MHC class Ib via ER pathway(GO:0002488) antigen processing and presentation of endogenous peptide antigen via MHC class Ib via ER pathway, TAP-dependent(GO:0002489) TRAIL production(GO:0032639) regulation of TRAIL production(GO:0032679) positive regulation of TRAIL production(GO:0032759) |
| 0.0 | 0.2 | GO:0034475 | U4 snRNA 3'-end processing(GO:0034475) DNA deamination(GO:0045006) polyadenylation-dependent snoRNA 3'-end processing(GO:0071051) |
| 0.0 | 0.5 | GO:0010839 | negative regulation of keratinocyte proliferation(GO:0010839) |
| 0.0 | 0.2 | GO:0032227 | negative regulation of synaptic transmission, dopaminergic(GO:0032227) |
| 0.0 | 0.2 | GO:2000852 | regulation of corticosterone secretion(GO:2000852) |
| 0.0 | 0.1 | GO:1901227 | negative regulation of transcription from RNA polymerase II promoter involved in heart development(GO:1901227) |
| 0.0 | 0.1 | GO:0099628 | establishment of synaptic specificity at neuromuscular junction(GO:0007529) gamma-aminobutyric acid receptor clustering(GO:0097112) receptor diffusion trapping(GO:0098953) postsynaptic neurotransmitter receptor diffusion trapping(GO:0098970) neurotransmitter receptor diffusion trapping(GO:0099628) |
| 0.0 | 0.1 | GO:0090611 | ubiquitin-independent protein catabolic process via the multivesicular body sorting pathway(GO:0090611) |
| 0.0 | 0.1 | GO:0051684 | maintenance of Golgi location(GO:0051684) |
| 0.0 | 0.1 | GO:0002003 | angiotensin maturation(GO:0002003) renin-angiotensin regulation of aldosterone production(GO:0002018) |
| 0.0 | 0.1 | GO:1900020 | regulation of protein kinase C activity(GO:1900019) positive regulation of protein kinase C activity(GO:1900020) |
| 0.0 | 0.1 | GO:0019805 | quinolinate biosynthetic process(GO:0019805) |
| 0.0 | 0.2 | GO:0070525 | tRNA threonylcarbamoyladenosine metabolic process(GO:0070525) |
| 0.0 | 0.2 | GO:0001302 | replicative cell aging(GO:0001302) |
| 0.0 | 0.1 | GO:0006742 | NADP catabolic process(GO:0006742) NAD catabolic process(GO:0019677) |
| 0.0 | 0.1 | GO:1903070 | negative regulation of ER-associated ubiquitin-dependent protein catabolic process(GO:1903070) |
| 0.0 | 0.0 | GO:0018199 | peptidyl-glutamine modification(GO:0018199) |
| 0.0 | 0.1 | GO:0000389 | mRNA 3'-splice site recognition(GO:0000389) |
| 0.0 | 0.1 | GO:0098885 | modification of postsynaptic actin cytoskeleton(GO:0098885) |
| 0.0 | 0.1 | GO:1904009 | cellular response to monosodium glutamate(GO:1904009) |
| 0.0 | 0.1 | GO:0036324 | vascular endothelial growth factor receptor-2 signaling pathway(GO:0036324) |
| 0.0 | 0.0 | GO:0071461 | cellular response to redox state(GO:0071461) |
| 0.0 | 0.0 | GO:1903758 | regulation of transcription from RNA polymerase II promoter by histone modification(GO:1903756) negative regulation of transcription from RNA polymerase II promoter by histone modification(GO:1903758) |
| 0.0 | 0.1 | GO:0014886 | transition between slow and fast fiber(GO:0014886) |
| 0.0 | 0.0 | GO:0030242 | pexophagy(GO:0030242) |
| 0.0 | 0.1 | GO:0019509 | L-methionine biosynthetic process from methylthioadenosine(GO:0019509) |
| 0.0 | 0.0 | GO:0034031 | coenzyme A catabolic process(GO:0015938) nucleoside bisphosphate catabolic process(GO:0033869) ribonucleoside bisphosphate catabolic process(GO:0034031) purine nucleoside bisphosphate catabolic process(GO:0034034) acetyl-CoA catabolic process(GO:0046356) |
| 0.0 | 0.1 | GO:0042118 | endothelial cell activation(GO:0042118) |
| 0.0 | 0.1 | GO:0010572 | positive regulation of platelet activation(GO:0010572) |
Gene overrepresentation in cellular component category:
| Log-likelihood per target | Total log-likelihood | Term | Description |
|---|---|---|---|
| 0.1 | 0.6 | GO:0005927 | muscle tendon junction(GO:0005927) |
| 0.1 | 0.3 | GO:0097444 | spine apparatus(GO:0097444) |
| 0.0 | 0.3 | GO:0005726 | perichromatin fibrils(GO:0005726) |
| 0.0 | 0.2 | GO:0000408 | EKC/KEOPS complex(GO:0000408) |
| 0.0 | 0.1 | GO:0032398 | MHC class Ib protein complex(GO:0032398) |
| 0.0 | 0.1 | GO:0042585 | germinal vesicle(GO:0042585) dendritic branch(GO:0044307) |
| 0.0 | 0.3 | GO:0000177 | cytoplasmic exosome (RNase complex)(GO:0000177) |
| 0.0 | 0.1 | GO:0099571 | postsynaptic actin cytoskeleton(GO:0098871) postsynaptic cytoskeleton(GO:0099571) |
| 0.0 | 0.1 | GO:1990032 | parallel fiber(GO:1990032) |
| 0.0 | 0.2 | GO:0034709 | methylosome(GO:0034709) |
| 0.0 | 0.1 | GO:1990726 | Lsm1-7-Pat1 complex(GO:1990726) |
| 0.0 | 0.1 | GO:0032593 | insulin-responsive compartment(GO:0032593) |
| 0.0 | 0.0 | GO:0005967 | mitochondrial pyruvate dehydrogenase complex(GO:0005967) |
| 0.0 | 0.2 | GO:0005666 | DNA-directed RNA polymerase III complex(GO:0005666) |
| 0.0 | 0.1 | GO:0030868 | smooth endoplasmic reticulum membrane(GO:0030868) smooth endoplasmic reticulum part(GO:0097425) |
Gene overrepresentation in molecular function category:
| Log-likelihood per target | Total log-likelihood | Term | Description |
|---|---|---|---|
| 0.1 | 0.4 | GO:0004065 | arylsulfatase activity(GO:0004065) |
| 0.1 | 0.3 | GO:0001849 | complement component C1q binding(GO:0001849) |
| 0.1 | 0.2 | GO:0070996 | type 1 melanocortin receptor binding(GO:0070996) |
| 0.0 | 1.1 | GO:0005184 | neuropeptide hormone activity(GO:0005184) |
| 0.0 | 0.1 | GO:0008940 | nitrate reductase activity(GO:0008940) |
| 0.0 | 0.1 | GO:1990932 | 5.8S rRNA binding(GO:1990932) |
| 0.0 | 0.4 | GO:0017081 | chloride channel regulator activity(GO:0017081) |
| 0.0 | 0.1 | GO:0047696 | beta-adrenergic receptor kinase activity(GO:0047696) |
| 0.0 | 0.3 | GO:0030215 | semaphorin receptor binding(GO:0030215) |
| 0.0 | 0.1 | GO:0031871 | proteinase activated receptor binding(GO:0031871) |
| 0.0 | 0.1 | GO:0000386 | second spliceosomal transesterification activity(GO:0000386) |
| 0.0 | 0.1 | GO:0005157 | macrophage colony-stimulating factor receptor binding(GO:0005157) |
| 0.0 | 0.3 | GO:0043522 | leucine zipper domain binding(GO:0043522) |
| 0.0 | 0.1 | GO:0016308 | 1-phosphatidylinositol-4-phosphate 5-kinase activity(GO:0016308) |
| 0.0 | 0.1 | GO:0035529 | NADH pyrophosphatase activity(GO:0035529) |
| 0.0 | 0.1 | GO:0019136 | deoxynucleoside kinase activity(GO:0019136) |
| 0.0 | 0.0 | GO:0004739 | pyruvate dehydrogenase (acetyl-transferring) activity(GO:0004739) |
| 0.0 | 0.1 | GO:0042608 | T cell receptor binding(GO:0042608) |
| 0.0 | 0.2 | GO:0008327 | methyl-CpG binding(GO:0008327) |
Gene overrepresentation in curated gene sets: canonical pathways category:
| Log-likelihood per target | Total log-likelihood | Term | Description |
|---|---|---|---|
| 0.0 | 0.3 | PID SYNDECAN 3 PATHWAY | Syndecan-3-mediated signaling events |
| 0.0 | 0.3 | PID CIRCADIAN PATHWAY | Circadian rhythm pathway |
| 0.0 | 0.5 | ST ADRENERGIC | Adrenergic Pathway |
Gene overrepresentation in curated gene sets: REACTOME pathways category:
| Log-likelihood per target | Total log-likelihood | Term | Description |
|---|---|---|---|
| 0.0 | 0.4 | REACTOME THE ACTIVATION OF ARYLSULFATASES | Genes involved in The activation of arylsulfatases |
| 0.0 | 0.3 | REACTOME PEPTIDE HORMONE BIOSYNTHESIS | Genes involved in Peptide hormone biosynthesis |
| 0.0 | 0.2 | REACTOME CRMPS IN SEMA3A SIGNALING | Genes involved in CRMPs in Sema3A signaling |
| 0.0 | 0.2 | REACTOME MRNA DECAY BY 3 TO 5 EXORIBONUCLEASE | Genes involved in mRNA Decay by 3' to 5' Exoribonuclease |
| 0.0 | 0.1 | REACTOME SYNTHESIS OF PIPS AT THE LATE ENDOSOME MEMBRANE | Genes involved in Synthesis of PIPs at the late endosome membrane |
| 0.0 | 0.1 | REACTOME REGULATION OF INSULIN SECRETION BY ACETYLCHOLINE | Genes involved in Regulation of Insulin Secretion by Acetylcholine |
| 0.0 | 0.1 | REACTOME ROLE OF DCC IN REGULATING APOPTOSIS | Genes involved in Role of DCC in regulating apoptosis |