Project
GSE49485: Hypoxia transcriptome sequencing of rat brain.
Navigation
Downloads
Results for Hoxb4
Z-value: 0.29
Motif logo
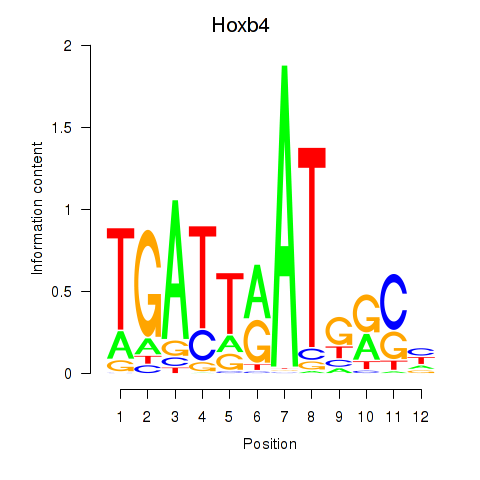
Transcription factors associated with Hoxb4
| Gene Symbol | Gene ID | Gene Info |
|---|---|---|
|
Hoxb4
|
ENSRNOG00000008191 | homeo box B4 |
Activity-expression correlation:
| Gene | Promoter | Pearson corr. coef. | P-value | Plot |
|---|---|---|---|---|
| Hoxb4 | rn6_v1_chr10_+_84167331_84167331 | 0.71 | 1.8e-01 | Click! |
Activity profile of Hoxb4 motif
Sorted Z-values of Hoxb4 motif
| Promoter | Log-likelihood | Transcript | Gene | Gene Info |
|---|---|---|---|---|
| chr4_+_148782479 | 0.32 |
ENSRNOT00000018133
|
LOC500300
|
similar to hypothetical protein MGC6835 |
| chrX_+_136460215 | 0.18 |
ENSRNOT00000093538
|
Arhgap36
|
Rho GTPase activating protein 36 |
| chr19_-_37427989 | 0.16 |
ENSRNOT00000022863
|
Tppp3
|
tubulin polymerization-promoting protein family member 3 |
| chr1_+_40816107 | 0.11 |
ENSRNOT00000060767
|
Akap12
|
A-kinase anchoring protein 12 |
| chr11_+_17538063 | 0.08 |
ENSRNOT00000031889
ENSRNOT00000090878 |
Chodl
|
chondrolectin |
| chr7_+_79138925 | 0.06 |
ENSRNOT00000047511
|
AABR07057586.1
|
|
| chr7_+_37812831 | 0.06 |
ENSRNOT00000005910
|
Btg1
|
BTG anti-proliferation factor 1 |
| chr10_-_44147035 | 0.05 |
ENSRNOT00000041113
|
Olr1424
|
olfactory receptor 1424 |
| chr7_-_29171783 | 0.04 |
ENSRNOT00000079235
|
Mybpc1
|
myosin binding protein C, slow type |
| chr10_+_34402482 | 0.04 |
ENSRNOT00000072317
|
Tpcr12
|
putative olfactory receptor |
| chr1_+_264507985 | 0.04 |
ENSRNOT00000085811
|
Pax2
|
paired box 2 |
| chrX_-_136807885 | 0.04 |
ENSRNOT00000010325
|
Igsf1
|
immunoglobulin superfamily, member 1 |
| chr2_+_212247451 | 0.04 |
ENSRNOT00000027813
|
Vav3
|
vav guanine nucleotide exchange factor 3 |
| chr20_+_26999795 | 0.03 |
ENSRNOT00000057872
|
Mypn
|
myopalladin |
| chr3_-_104018861 | 0.02 |
ENSRNOT00000008387
|
Chrm5
|
cholinergic receptor, muscarinic 5 |
| chr1_-_215838209 | 0.02 |
ENSRNOT00000050760
|
Igf2
|
insulin-like growth factor 2 |
| chr17_+_90696019 | 0.01 |
ENSRNOT00000003438
|
Gpr137b
|
G protein-coupled receptor 137B |
| chr15_-_6587367 | 0.01 |
ENSRNOT00000038449
|
Zfp385d
|
zinc finger protein 385D |
| chr1_+_167870452 | 0.01 |
ENSRNOT00000025027
|
Olr63
|
olfactory receptor 63 |
| chr16_+_9486832 | 0.01 |
ENSRNOT00000082208
|
Arhgap22
|
Rho GTPase activating protein 22 |
| chr3_-_72171078 | 0.01 |
ENSRNOT00000009817
|
Serping1
|
serpin family G member 1 |
| chr10_-_25910298 | 0.00 |
ENSRNOT00000065633
ENSRNOT00000079646 |
Ccng1
|
cyclin G1 |
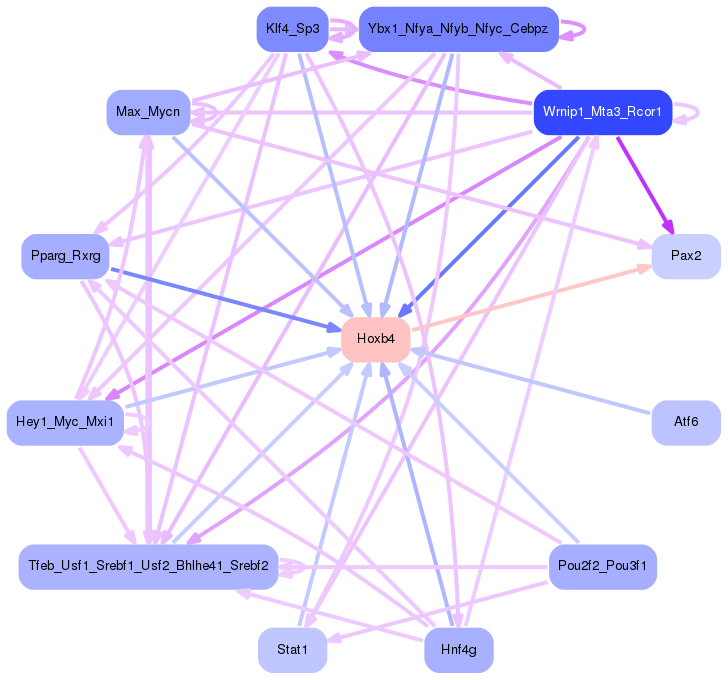
Network of associatons between targets according to the STRING database.

First level regulatory network of Hoxb4
Gene Ontology Analysis
Gene overrepresentation in biological process category:
| Log-likelihood per target | Total log-likelihood | Term | Description |
|---|---|---|---|
| 0.0 | 0.0 | GO:0035566 | regulation of metanephros size(GO:0035566) |
| 0.0 | 0.1 | GO:0010739 | positive regulation of protein kinase A signaling(GO:0010739) |