Project
GSE49485: Hypoxia transcriptome sequencing of rat brain.
Navigation
Downloads
Results for Hoxa9_Hoxb9
Z-value: 0.60
Motif logo
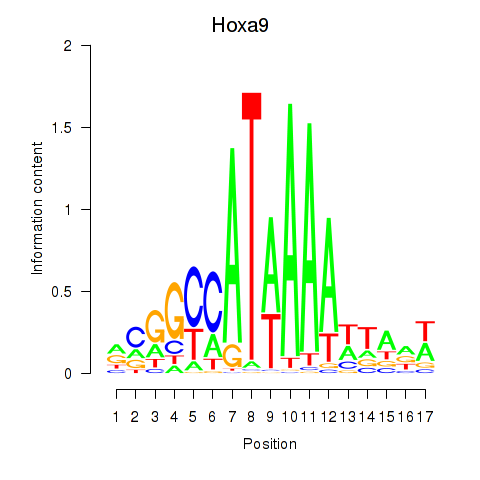
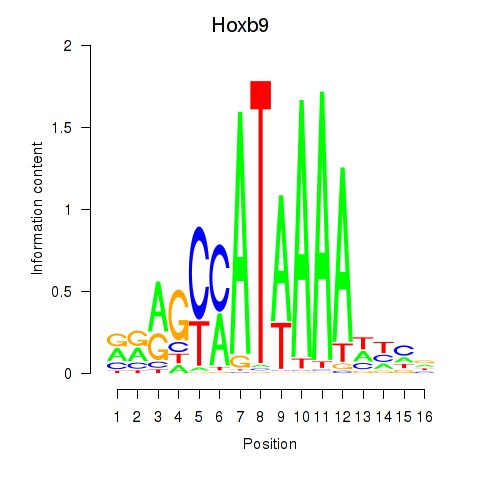
Transcription factors associated with Hoxa9_Hoxb9
| Gene Symbol | Gene ID | Gene Info |
|---|---|---|
|
Hoxa9
|
ENSRNOG00000048146 | homeobox A9 |
|
Hoxb9
|
ENSRNOG00000007573 | homeo box B9 |
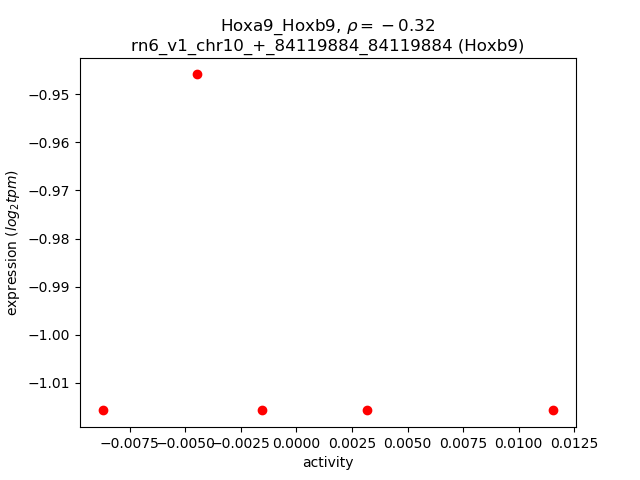
Activity-expression correlation:
| Gene | Promoter | Pearson corr. coef. | P-value | Plot |
|---|---|---|---|---|
| Hoxb9 | rn6_v1_chr10_+_84119884_84119884 | -0.32 | 6.0e-01 | Click! |
Activity profile of Hoxa9_Hoxb9 motif
Sorted Z-values of Hoxa9_Hoxb9 motif
| Promoter | Log-likelihood | Transcript | Gene | Gene Info |
|---|---|---|---|---|
| chr16_-_14360555 | 0.44 |
ENSRNOT00000065460
|
LOC290595
|
hypothetical gene supported by AF152002 |
| chr14_+_39368530 | 0.24 |
ENSRNOT00000084367
|
Cox7b2
|
cytochrome c oxidase subunit 7B2 |
| chr9_-_7891514 | 0.17 |
ENSRNOT00000072684
|
Pot1b
|
protection of telomeres 1B |
| chr6_+_93563446 | 0.15 |
ENSRNOT00000050558
ENSRNOT00000011056 |
LOC690035
|
similar to Protein KIAA0586 |
| chr20_-_3401273 | 0.14 |
ENSRNOT00000089257
ENSRNOT00000078451 ENSRNOT00000001085 |
Nrm
|
nurim (nuclear envelope membrane protein) |
| chr9_+_66888393 | 0.13 |
ENSRNOT00000023536
|
Carf
|
calcium responsive transcription factor |
| chr4_-_129515435 | 0.13 |
ENSRNOT00000039353
|
Eogt
|
EGF domain specific O-linked N-acetylglucosamine transferase |
| chr2_-_231409496 | 0.13 |
ENSRNOT00000055615
ENSRNOT00000015386 ENSRNOT00000068415 |
Ank2
|
ankyrin 2 |
| chr4_-_22424862 | 0.12 |
ENSRNOT00000082359
|
Abcb1a
|
ATP binding cassette subfamily B member 1A |
| chr2_-_231409988 | 0.11 |
ENSRNOT00000080637
ENSRNOT00000037255 ENSRNOT00000074002 |
Ank2
|
ankyrin 2 |
| chr9_-_95108739 | 0.10 |
ENSRNOT00000070819
|
Usp40
|
ubiquitin specific peptidase 40 |
| chr8_-_69466618 | 0.10 |
ENSRNOT00000042925
|
Ids
|
iduronate 2-sulfatase |
| chr3_-_61488696 | 0.10 |
ENSRNOT00000083045
|
Lnpk
|
lunapark, ER junction formation factor |
| chr2_+_23289374 | 0.10 |
ENSRNOT00000090666
ENSRNOT00000032783 |
Dmgdh
|
dimethylglycine dehydrogenase |
| chr10_+_106712127 | 0.10 |
ENSRNOT00000040629
|
Tnrc6c
|
trinucleotide repeat containing 6C |
| chr1_+_234252757 | 0.10 |
ENSRNOT00000091814
|
Rorb
|
RAR-related orphan receptor B |
| chr3_-_60166013 | 0.10 |
ENSRNOT00000024922
|
Wipf1
|
WAS/WASL interacting protein family, member 1 |
| chr9_+_66889028 | 0.09 |
ENSRNOT00000087194
|
Carf
|
calcium responsive transcription factor |
| chr16_+_22361998 | 0.08 |
ENSRNOT00000016193
|
Slc18a1
|
solute carrier family 18 member A1 |
| chr17_+_45078556 | 0.08 |
ENSRNOT00000088280
|
Zfp192
|
zinc finger protein 192 |
| chr18_+_30864216 | 0.08 |
ENSRNOT00000027015
|
Pcdhga7
|
protocadherin gamma subfamily A, 7 |
| chr9_+_65534704 | 0.08 |
ENSRNOT00000016730
|
Cflar
|
CASP8 and FADD-like apoptosis regulator |
| chr1_-_198900375 | 0.08 |
ENSRNOT00000024969
|
Zfp689
|
zinc finger protein 689 |
| chr12_+_6403940 | 0.08 |
ENSRNOT00000083484
|
B3glct
|
beta 3-glucosyltransferase |
| chr10_+_65552897 | 0.08 |
ENSRNOT00000056217
|
Spag5
|
sperm associated antigen 5 |
| chr18_-_75207306 | 0.08 |
ENSRNOT00000021717
|
Setbp1
|
SET binding protein 1 |
| chr17_-_53713408 | 0.08 |
ENSRNOT00000022445
|
LOC100912163
|
AT-rich interactive domain-containing protein 4B-like |
| chr16_+_31734944 | 0.08 |
ENSRNOT00000059673
|
Palld
|
palladin, cytoskeletal associated protein |
| chr5_-_154965027 | 0.08 |
ENSRNOT00000080881
ENSRNOT00000055992 |
Kdm1a
|
lysine demethylase 1A |
| chr14_+_69800156 | 0.07 |
ENSRNOT00000072746
|
Lcorl
|
ligand dependent nuclear receptor corepressor-like |
| chr2_+_197715761 | 0.07 |
ENSRNOT00000083069
|
Golph3l
|
golgi phosphoprotein 3-like |
| chr9_+_66058047 | 0.07 |
ENSRNOT00000071819
|
Cdk15
|
cyclin-dependent kinase 15 |
| chr12_+_19231092 | 0.07 |
ENSRNOT00000045379
|
Zkscan1
|
zinc finger with KRAB and SCAN domains 1 |
| chrX_-_70978714 | 0.07 |
ENSRNOT00000076336
|
Slc7a3
|
solute carrier family 7 member 3 |
| chr20_+_41266566 | 0.07 |
ENSRNOT00000000653
|
Frk
|
fyn-related Src family tyrosine kinase |
| chr10_-_58771908 | 0.07 |
ENSRNOT00000018808
|
RGD1304728
|
similar to 4933427D14Rik protein |
| chr2_-_31753528 | 0.07 |
ENSRNOT00000075057
|
Pik3r1
|
phosphoinositide-3-kinase regulatory subunit 1 |
| chr3_+_108795235 | 0.07 |
ENSRNOT00000007028
|
Spred1
|
sprouty-related, EVH1 domain containing 1 |
| chr14_-_20920286 | 0.06 |
ENSRNOT00000004391
|
Slc4a4
|
solute carrier family 4 member 4 |
| chr2_+_231941794 | 0.06 |
ENSRNOT00000091475
|
AABR07013288.4
|
|
| chr16_-_3762877 | 0.06 |
ENSRNOT00000052224
|
Duxbl1
|
double homeobox B-like 1 |
| chr1_+_61786900 | 0.06 |
ENSRNOT00000090287
|
AABR07001905.1
|
|
| chr3_+_9366053 | 0.06 |
ENSRNOT00000073999
|
Fibcd1l1
|
fibrinogen C domain containing 1-like 1 |
| chr15_-_93748742 | 0.06 |
ENSRNOT00000093370
|
Mycbp2
|
MYC binding protein 2, E3 ubiquitin protein ligase |
| chr9_-_52238564 | 0.06 |
ENSRNOT00000005073
|
Col5a2
|
collagen type V alpha 2 chain |
| chr6_-_91250138 | 0.06 |
ENSRNOT00000052408
|
LOC100911256
|
ninein-like |
| chr7_-_101138860 | 0.06 |
ENSRNOT00000077137
|
AABR07058124.4
|
|
| chr2_+_55835151 | 0.06 |
ENSRNOT00000018634
|
Fyb
|
FYN binding protein |
| chr15_-_61648267 | 0.06 |
ENSRNOT00000071805
|
Naa16
|
N(alpha)-acetyltransferase 16, NatA auxiliary subunit |
| chr7_+_44146237 | 0.06 |
ENSRNOT00000058842
|
Rassf9
|
Ras association domain family member 9 |
| chr1_-_87825333 | 0.06 |
ENSRNOT00000072689
|
Zfp74
|
zinc finger protein 74 |
| chr10_-_16731898 | 0.05 |
ENSRNOT00000028186
|
Crebrf
|
CREB3 regulatory factor |
| chr10_-_70337532 | 0.05 |
ENSRNOT00000055963
|
Slfn13
|
schlafen family member 13 |
| chr12_+_51960262 | 0.05 |
ENSRNOT00000084214
|
Ep400
|
E1A binding protein p400 |
| chr1_+_99616447 | 0.05 |
ENSRNOT00000029197
|
Klk14
|
kallikrein related-peptidase 14 |
| chr2_+_22910236 | 0.05 |
ENSRNOT00000078266
|
Homer1
|
homer scaffolding protein 1 |
| chr20_-_6257604 | 0.05 |
ENSRNOT00000092489
|
Stk38
|
serine/threonine kinase 38 |
| chr8_+_82037977 | 0.05 |
ENSRNOT00000082288
|
Myo5a
|
myosin VA |
| chr14_+_8080275 | 0.04 |
ENSRNOT00000065965
ENSRNOT00000092542 |
Mapk10
|
mitogen activated protein kinase 10 |
| chr14_+_8080565 | 0.04 |
ENSRNOT00000092395
|
Mapk10
|
mitogen activated protein kinase 10 |
| chr2_-_54963448 | 0.04 |
ENSRNOT00000017886
|
Ptger4
|
prostaglandin E receptor 4 |
| chr6_+_30074303 | 0.04 |
ENSRNOT00000070908
|
Fam228a
|
family with sequence similarity 228, member A |
| chr10_-_87954055 | 0.04 |
ENSRNOT00000018048
|
Krt34
|
keratin 34 |
| chr8_-_109560747 | 0.04 |
ENSRNOT00000087334
|
Ppp2r3a
|
protein phosphatase 2, regulatory subunit B'', alpha |
| chr12_-_15996958 | 0.04 |
ENSRNOT00000039726
|
Amz1
|
archaelysin family metallopeptidase 1 |
| chr9_-_11027506 | 0.04 |
ENSRNOT00000071107
|
Chaf1a
|
chromatin assembly factor 1 subunit A |
| chr10_-_91661558 | 0.04 |
ENSRNOT00000043156
|
AABR07030521.1
|
|
| chr3_+_67538289 | 0.04 |
ENSRNOT00000009839
|
Dnajc10
|
DnaJ heat shock protein family (Hsp40) member C10 |
| chr18_+_30880020 | 0.04 |
ENSRNOT00000060468
|
Pcdhgb5
|
protocadherin gamma subfamily B, 5 |
| chr8_+_82878941 | 0.04 |
ENSRNOT00000014846
|
Bmp5
|
bone morphogenetic protein 5 |
| chr2_-_173087648 | 0.04 |
ENSRNOT00000091079
|
Iqcj
|
IQ motif containing J |
| chr17_+_42168263 | 0.04 |
ENSRNOT00000047422
|
LOC100360654
|
ribosomal protein L37-like |
| chr2_-_197814808 | 0.04 |
ENSRNOT00000074156
|
Adamtsl4
|
ADAMTS-like 4 |
| chr2_+_257633425 | 0.04 |
ENSRNOT00000071770
|
Zzz3
|
zinc finger, ZZ-type containing 3 |
| chr13_+_44424689 | 0.04 |
ENSRNOT00000005206
|
Acmsd
|
aminocarboxymuconate semialdehyde decarboxylase |
| chr3_+_9998458 | 0.04 |
ENSRNOT00000012927
|
Fibcd1
|
fibrinogen C domain containing 1 |
| chr3_-_40477754 | 0.04 |
ENSRNOT00000091168
|
AABR07052166.1
|
|
| chr7_-_59547174 | 0.04 |
ENSRNOT00000085836
|
Cnot2
|
CCR4-NOT transcription complex, subunit 2 |
| chrM_+_3904 | 0.04 |
ENSRNOT00000040993
|
Mt-nd2
|
mitochondrially encoded NADH dehydrogenase 2 |
| chr5_+_117586103 | 0.04 |
ENSRNOT00000084640
|
Usp1
|
ubiquitin specific peptidase 1 |
| chr13_+_113373578 | 0.04 |
ENSRNOT00000009900
|
Plxna2
|
plexin A2 |
| chr13_+_56513286 | 0.04 |
ENSRNOT00000015596
|
Zbtb41
|
zinc finger and BTB domain containing 41 |
| chr5_+_74766636 | 0.03 |
ENSRNOT00000030913
|
Rn50_5_0791.1
|
|
| chr8_+_64610952 | 0.03 |
ENSRNOT00000015963
|
Myo9a
|
myosin IXA |
| chr4_-_168517177 | 0.03 |
ENSRNOT00000009151
|
Dusp16
|
dual specificity phosphatase 16 |
| chr17_+_5311274 | 0.03 |
ENSRNOT00000067020
|
LOC102547665
|
spermatogenesis-associated protein 31D1-like |
| chr4_-_148437961 | 0.03 |
ENSRNOT00000082907
|
Alox5
|
arachidonate 5-lipoxygenase |
| chr2_+_257626383 | 0.03 |
ENSRNOT00000080993
|
Zzz3
|
zinc finger, ZZ-type containing 3 |
| chr16_-_74700815 | 0.03 |
ENSRNOT00000081297
|
Thsd1
|
thrombospondin type 1 domain containing 1 |
| chr13_-_71276497 | 0.03 |
ENSRNOT00000029773
|
Rgsl1
|
regulator of G-protein signaling like 1 |
| chr4_+_182483194 | 0.03 |
ENSRNOT00000002528
|
Far2
|
fatty acyl CoA reductase 2 |
| chr16_+_32457521 | 0.03 |
ENSRNOT00000083579
|
Clcn3
|
chloride voltage-gated channel 3 |
| chr2_-_196270826 | 0.03 |
ENSRNOT00000028609
|
Pip5k1a
|
phosphatidylinositol-4-phosphate 5-kinase, type 1, alpha |
| chr2_-_22096949 | 0.03 |
ENSRNOT00000089325
|
Zfyve16
|
zinc finger FYVE-type containing 16 |
| chr5_-_64818813 | 0.03 |
ENSRNOT00000009111
ENSRNOT00000086505 |
Aldob
|
aldolase, fructose-bisphosphate B |
| chr18_+_59748444 | 0.03 |
ENSRNOT00000024752
|
St8sia3
|
ST8 alpha-N-acetyl-neuraminide alpha-2,8-sialyltransferase 3 |
| chr7_-_143228060 | 0.03 |
ENSRNOT00000088923
ENSRNOT00000012640 |
Krt75
|
keratin 75 |
| chr9_+_111233147 | 0.03 |
ENSRNOT00000056439
|
Ppip5k2
|
diphosphoinositol pentakisphosphate kinase 2 |
| chr3_-_177095597 | 0.03 |
ENSRNOT00000029386
|
Samd10
|
sterile alpha motif domain containing 10 |
| chr1_+_154131926 | 0.03 |
ENSRNOT00000035257
|
LOC102549852
|
ferritin light chain 1-like |
| chr8_-_63750531 | 0.03 |
ENSRNOT00000009496
|
Neo1
|
neogenin 1 |
| chr8_-_102149912 | 0.03 |
ENSRNOT00000011263
|
RGD1309079
|
similar to Ab2-095 |
| chr19_-_22194740 | 0.03 |
ENSRNOT00000086187
|
Phkb
|
phosphorylase kinase regulatory subunit beta |
| chr3_-_7796385 | 0.03 |
ENSRNOT00000082489
|
Ntng2
|
netrin G2 |
| chr9_-_91100482 | 0.02 |
ENSRNOT00000064642
|
LOC100911860
|
ubiquitin carboxyl-terminal hydrolase 40-like |
| chr2_+_243840134 | 0.02 |
ENSRNOT00000093355
|
Eif4e
|
eukaryotic translation initiation factor 4E |
| chr4_-_150829913 | 0.02 |
ENSRNOT00000041571
|
Cacna1c
|
calcium voltage-gated channel subunit alpha1 C |
| chr6_+_76745981 | 0.02 |
ENSRNOT00000076784
|
Brms1l
|
breast cancer metastasis-suppressor 1-like |
| chr4_-_150829741 | 0.02 |
ENSRNOT00000051846
ENSRNOT00000052017 |
Cacna1c
|
calcium voltage-gated channel subunit alpha1 C |
| chr5_-_164502469 | 0.02 |
ENSRNOT00000051887
|
RGD1565622
|
RGD1565622 |
| chr19_+_39063998 | 0.02 |
ENSRNOT00000081116
|
Has3
|
hyaluronan synthase 3 |
| chr2_+_30360100 | 0.02 |
ENSRNOT00000024456
|
Smn1
|
survival of motor neuron 1, telomeric |
| chr4_+_25635765 | 0.02 |
ENSRNOT00000009340
|
Gtpbp10
|
GTP binding protein 10 |
| chr4_+_57925323 | 0.02 |
ENSRNOT00000085798
|
Cpa5
|
carboxypeptidase A5 |
| chr19_+_9895121 | 0.02 |
ENSRNOT00000033953
|
Prss54
|
protease, serine, 54 |
| chr2_-_185005572 | 0.02 |
ENSRNOT00000093291
|
Fam160a1
|
family with sequence similarity 160, member A1 |
| chr1_+_242959488 | 0.02 |
ENSRNOT00000015668
|
Dock8
|
dedicator of cytokinesis 8 |
| chr8_+_102304095 | 0.02 |
ENSRNOT00000011358
|
Slc9a9
|
solute carrier family 9 member A9 |
| chr9_+_20048121 | 0.02 |
ENSRNOT00000014791
|
Mep1a
|
meprin 1 subunit alpha |
| chr1_-_193700673 | 0.02 |
ENSRNOT00000071314
|
Paip2l1
|
polyadenylate-binding protein-interacting protein 2-like 1 |
| chr7_+_123364312 | 0.02 |
ENSRNOT00000056048
|
Ccdc134
|
coiled-coil domain containing 134 |
| chr2_-_21437193 | 0.02 |
ENSRNOT00000084002
|
Ckmt2
|
creatine kinase, mitochondrial 2 |
| chr1_-_163117235 | 0.02 |
ENSRNOT00000019370
|
Capn5
|
calpain 5 |
| chr3_+_138174054 | 0.02 |
ENSRNOT00000007946
|
Banf2
|
barrier to autointegration factor 2 |
| chr1_+_204959174 | 0.02 |
ENSRNOT00000023257
|
Zranb1
|
zinc finger RANBP2-type containing 1 |
| chr1_+_93242050 | 0.02 |
ENSRNOT00000013741
|
RGD1562402
|
similar to 60S ribosomal protein L27a |
| chr20_-_4542073 | 0.02 |
ENSRNOT00000000477
|
Cfb
|
complement factor B |
| chr1_+_277355619 | 0.02 |
ENSRNOT00000022788
|
Nhlrc2
|
NHL repeat containing 2 |
| chr4_+_56981283 | 0.01 |
ENSRNOT00000010989
|
Tspan33
|
tetraspanin 33 |
| chr4_+_68849033 | 0.01 |
ENSRNOT00000016912
|
Mgam
|
maltase-glucoamylase |
| chr8_+_44136496 | 0.01 |
ENSRNOT00000087022
|
Scn3b
|
sodium voltage-gated channel beta subunit 3 |
| chr16_-_48692476 | 0.01 |
ENSRNOT00000013118
|
Irf2
|
interferon regulatory factor 2 |
| chr6_-_26314844 | 0.01 |
ENSRNOT00000006658
|
Zfp512
|
zinc finger protein 512 |
| chr5_-_24489468 | 0.01 |
ENSRNOT00000081395
|
Ints8
|
integrator complex subunit 8 |
| chr18_-_57866741 | 0.01 |
ENSRNOT00000025790
|
Fbxo38
|
F-box protein 38 |
| chr17_-_18590536 | 0.01 |
ENSRNOT00000078992
|
Cap2
|
CAP, adenylate cyclase-associated protein, 2 (yeast) |
| chr8_+_107508351 | 0.01 |
ENSRNOT00000081594
|
Cep70
|
centrosomal protein 70 |
| chr4_+_178617401 | 0.01 |
ENSRNOT00000042619
|
AABR07062466.1
|
|
| chr14_-_115391652 | 0.01 |
ENSRNOT00000002094
|
Chac2
|
ChaC cation transport regulator 2 |
| chr10_-_87529599 | 0.01 |
ENSRNOT00000074099
|
Krtap2-1
|
keratin associated protein 2-1 |
| chr10_+_53621375 | 0.01 |
ENSRNOT00000004147
|
Myh3
|
myosin heavy chain 3 |
| chr15_-_48284548 | 0.01 |
ENSRNOT00000038336
|
Hmbox1
|
homeobox containing 1 |
| chr8_-_60570058 | 0.01 |
ENSRNOT00000009169
|
Scaper
|
S-phase cyclin A-associated protein in the ER |
| chr5_+_57657909 | 0.01 |
ENSRNOT00000073017
|
LOC683961
|
similar to ribosomal protein S13 |
| chr10_+_39655455 | 0.01 |
ENSRNOT00000058817
|
Acsl6
|
acyl-CoA synthetase long-chain family member 6 |
| chr3_+_93648343 | 0.01 |
ENSRNOT00000091164
|
AABR07053136.1
|
|
| chr1_+_114679537 | 0.01 |
ENSRNOT00000019498
|
Oca2
|
OCA2 melanosomal transmembrane protein |
| chr4_-_178441547 | 0.01 |
ENSRNOT00000087434
ENSRNOT00000055542 |
Sox5
|
SRY box 5 |
| chr16_-_69176036 | 0.01 |
ENSRNOT00000018369
|
Prosc
|
proline synthetase co-transcribed homolog (bacterial) |
| chr18_-_35780519 | 0.01 |
ENSRNOT00000079667
|
Mcc
|
mutated in colorectal cancers |
| chr2_-_250862419 | 0.01 |
ENSRNOT00000017943
|
Clca4
|
chloride channel accessory 4 |
| chr1_+_229642412 | 0.01 |
ENSRNOT00000017109
|
Lpxn
|
leupaxin |
| chr6_-_38007162 | 0.01 |
ENSRNOT00000044583
|
AABR07063632.1
|
|
| chr10_-_88019967 | 0.01 |
ENSRNOT00000047580
|
Krt36
|
keratin 36 |
| chr8_+_130009573 | 0.01 |
ENSRNOT00000026106
|
Trak1
|
trafficking kinesin protein 1 |
| chr7_-_101138373 | 0.01 |
ENSRNOT00000043257
|
LOC500877
|
Ab1-152 |
| chr2_+_248398917 | 0.01 |
ENSRNOT00000045855
|
Gbp1
|
guanylate binding protein 1 |
| chr3_+_111298713 | 0.00 |
ENSRNOT00000043677
|
Dppa3
|
developmental pluripotency-associated 3 |
| chr16_-_81693000 | 0.00 |
ENSRNOT00000092353
|
Lamp1
|
lysosomal-associated membrane protein 1 |
| chr19_+_6046665 | 0.00 |
ENSRNOT00000084126
|
Cdh8
|
cadherin 8 |
| chr14_-_28967980 | 0.00 |
ENSRNOT00000048175
|
Adgrl3
|
adhesion G protein-coupled receptor L3 |
| chr13_+_90260783 | 0.00 |
ENSRNOT00000050547
|
Cd84
|
CD84 molecule |
| chr3_-_154490851 | 0.00 |
ENSRNOT00000017213
|
Tti1
|
TELO2 interacting protein 1 |
| chr10_-_66848388 | 0.00 |
ENSRNOT00000018891
|
Omg
|
oligodendrocyte-myelin glycoprotein |
| chr5_-_113880911 | 0.00 |
ENSRNOT00000029441
|
Eqtn
|
equatorin |
| chr1_-_220136470 | 0.00 |
ENSRNOT00000026812
|
Actn3
|
actinin alpha 3 |
| chr3_-_21904133 | 0.00 |
ENSRNOT00000090576
ENSRNOT00000087611 ENSRNOT00000066377 |
Strbp
|
spermatid perinuclear RNA binding protein |
| chr3_+_140024043 | 0.00 |
ENSRNOT00000086409
|
Rin2
|
Ras and Rab interactor 2 |
| chr18_-_11789697 | 0.00 |
ENSRNOT00000077304
ENSRNOT00000064554 |
Dsc3
|
desmocollin 3 |
| chr14_-_84662143 | 0.00 |
ENSRNOT00000057529
ENSRNOT00000080078 |
Hormad2
|
HORMA domain containing 2 |
| chr11_+_85508300 | 0.00 |
ENSRNOT00000038646
|
AABR07034730.3
|
|
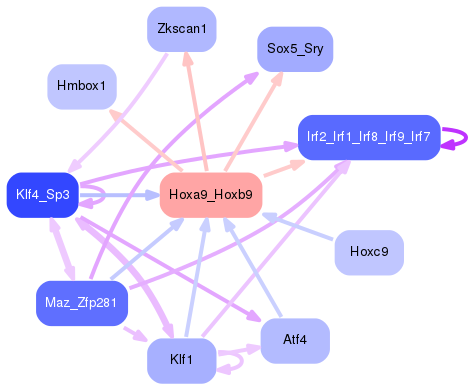
Network of associatons between targets according to the STRING database.

First level regulatory network of Hoxa9_Hoxb9
Gene Ontology Analysis
Gene overrepresentation in biological process category:
| Log-likelihood per target | Total log-likelihood | Term | Description |
|---|---|---|---|
| 0.1 | 0.2 | GO:0036309 | protein localization to M-band(GO:0036309) protein localization to T-tubule(GO:0036371) |
| 0.1 | 0.2 | GO:0072695 | negative regulation of DNA recombination at telomere(GO:0048239) regulation of DNA recombination at telomere(GO:0072695) |
| 0.0 | 0.1 | GO:0006579 | amino-acid betaine catabolic process(GO:0006579) |
| 0.0 | 0.1 | GO:1905231 | carbohydrate export(GO:0033231) daunorubicin transport(GO:0043215) response to borneol(GO:1905230) cellular response to borneol(GO:1905231) response to codeine(GO:1905233) response to quercetin(GO:1905235) drug transport across blood-brain barrier(GO:1990962) establishment of blood-retinal barrier(GO:1990963) |
| 0.0 | 0.1 | GO:1903943 | regulation of hepatocyte apoptotic process(GO:1903943) negative regulation of hepatocyte apoptotic process(GO:1903944) |
| 0.0 | 0.1 | GO:0010725 | regulation of primitive erythrocyte differentiation(GO:0010725) |
| 0.0 | 0.4 | GO:0050832 | defense response to fungus(GO:0050832) |
| 0.0 | 0.1 | GO:0051611 | negative regulation of neurotransmitter uptake(GO:0051581) regulation of serotonin uptake(GO:0051611) negative regulation of serotonin uptake(GO:0051612) |
| 0.0 | 0.1 | GO:1902211 | regulation of prolactin signaling pathway(GO:1902211) |
| 0.0 | 0.2 | GO:0035865 | cellular response to potassium ion(GO:0035865) |
| 0.0 | 0.1 | GO:0071787 | endoplasmic reticulum tubular network assembly(GO:0071787) |
| 0.0 | 0.1 | GO:1903225 | negative regulation of endodermal cell differentiation(GO:1903225) |
| 0.0 | 0.0 | GO:2000417 | negative regulation of eosinophil migration(GO:2000417) |
| 0.0 | 0.0 | GO:0090249 | cell motility involved in somitogenic axis elongation(GO:0090247) regulation of cell motility involved in somitogenic axis elongation(GO:0090249) |
| 0.0 | 0.1 | GO:1903401 | L-lysine transmembrane transport(GO:1903401) |
| 0.0 | 0.0 | GO:0051643 | endoplasmic reticulum localization(GO:0051643) |
| 0.0 | 0.0 | GO:0002540 | leukotriene production involved in inflammatory response(GO:0002540) |
| 0.0 | 0.0 | GO:0021502 | neural fold elevation formation(GO:0021502) |
Gene overrepresentation in cellular component category:
| Log-likelihood per target | Total log-likelihood | Term | Description |
|---|---|---|---|
| 0.0 | 0.1 | GO:0005943 | phosphatidylinositol 3-kinase complex, class IA(GO:0005943) |
| 0.0 | 0.1 | GO:0031265 | CD95 death-inducing signaling complex(GO:0031265) |
| 0.0 | 0.0 | GO:0042642 | actomyosin, myosin complex part(GO:0042642) |
| 0.0 | 0.1 | GO:0005588 | collagen type V trimer(GO:0005588) |
| 0.0 | 0.0 | GO:0033186 | CAF-1 complex(GO:0033186) |
| 0.0 | 0.2 | GO:0045277 | respiratory chain complex IV(GO:0045277) |
| 0.0 | 0.2 | GO:0000782 | telomere cap complex(GO:0000782) nuclear telomere cap complex(GO:0000783) |
Gene overrepresentation in molecular function category:
| Log-likelihood per target | Total log-likelihood | Term | Description |
|---|---|---|---|
| 0.0 | 0.1 | GO:0008502 | melatonin receptor activity(GO:0008502) |
| 0.0 | 0.1 | GO:0015222 | serotonin transmembrane transporter activity(GO:0015222) |
| 0.0 | 0.1 | GO:0016262 | protein N-acetylglucosaminyltransferase activity(GO:0016262) |
| 0.0 | 0.1 | GO:0090555 | phosphatidylethanolamine-translocating ATPase activity(GO:0090555) |
| 0.0 | 0.2 | GO:0043047 | single-stranded telomeric DNA binding(GO:0043047) |
| 0.0 | 0.1 | GO:0043426 | MRF binding(GO:0043426) |
| 0.0 | 0.1 | GO:0015189 | L-lysine transmembrane transporter activity(GO:0015189) |
| 0.0 | 0.1 | GO:0046935 | 1-phosphatidylinositol-3-kinase regulator activity(GO:0046935) |
| 0.0 | 0.0 | GO:0004051 | arachidonate 5-lipoxygenase activity(GO:0004051) |
| 0.0 | 0.0 | GO:0072320 | volume-sensitive chloride channel activity(GO:0072320) |