Project
GSE49485: Hypoxia transcriptome sequencing of rat brain.
Navigation
Downloads
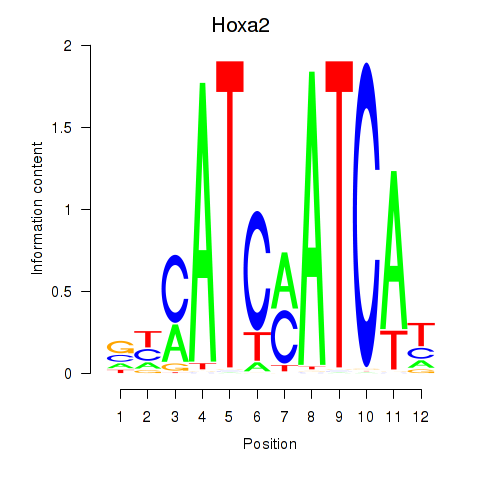
Results for Hoxa2
Z-value: 0.49
Motif logo
Transcription factors associated with Hoxa2
| Gene Symbol | Gene ID | Gene Info |
|---|
Activity profile of Hoxa2 motif
Sorted Z-values of Hoxa2 motif
| Promoter | Log-likelihood | Transcript | Gene | Gene Info |
|---|---|---|---|---|
| chr1_+_229003961 | 0.31 |
ENSRNOT00000016152
|
Fam111a
|
family with sequence similarity 111, member A |
| chr2_-_34452895 | 0.27 |
ENSRNOT00000079385
|
AABR07007905.2
|
|
| chr16_+_3293599 | 0.27 |
ENSRNOT00000081999
ENSRNOT00000047118 ENSRNOT00000020427 |
Erc2
|
ELKS/RAB6-interacting/CAST family member 2 |
| chr7_+_125288081 | 0.25 |
ENSRNOT00000085216
|
Parvg
|
parvin, gamma |
| chr4_+_22859622 | 0.25 |
ENSRNOT00000073501
ENSRNOT00000068410 |
Adam22
|
ADAM metallopeptidase domain 22 |
| chr8_-_104155775 | 0.23 |
ENSRNOT00000042885
|
LOC102550734
|
60S ribosomal protein L31-like |
| chr7_+_20262680 | 0.22 |
ENSRNOT00000046378
|
LOC300308
|
similar to hypothetical protein 4930509O22 |
| chr1_+_169145445 | 0.21 |
ENSRNOT00000034019
|
LOC499219
|
hypothetical protein LOC499219 |
| chr18_-_75207306 | 0.20 |
ENSRNOT00000021717
|
Setbp1
|
SET binding protein 1 |
| chr19_-_39267928 | 0.19 |
ENSRNOT00000027686
|
Tmed6
|
transmembrane p24 trafficking protein 6 |
| chr8_-_55696601 | 0.17 |
ENSRNOT00000016127
|
RGD1562914
|
RGD1562914 |
| chr1_-_65681440 | 0.16 |
ENSRNOT00000026305
|
Zfp128
|
zinc finger protein 128 |
| chr2_+_52152536 | 0.15 |
ENSRNOT00000072691
|
AABR07008293.2
|
|
| chr6_-_87427153 | 0.14 |
ENSRNOT00000071999
|
AABR07064622.1
|
|
| chr9_+_50892605 | 0.14 |
ENSRNOT00000033133
|
Bivm
|
basic, immunoglobulin-like variable motif containing |
| chr15_+_36809361 | 0.14 |
ENSRNOT00000076667
|
Parp4
|
poly (ADP-ribose) polymerase family, member 4 |
| chr3_-_158328881 | 0.13 |
ENSRNOT00000044466
|
Ptprt
|
protein tyrosine phosphatase, receptor type, T |
| chr11_+_60102121 | 0.13 |
ENSRNOT00000045521
|
Tmprss7
|
transmembrane protease, serine 7 |
| chr8_+_52729003 | 0.13 |
ENSRNOT00000081738
|
Nxpe4
|
neurexophilin and PC-esterase domain family, member 4 |
| chr17_+_23661429 | 0.12 |
ENSRNOT00000046523
|
Phactr1
|
phosphatase and actin regulator 1 |
| chr17_+_69634890 | 0.12 |
ENSRNOT00000029049
|
Akr1c13
|
aldo-keto reductase family 1, member C13 |
| chr6_+_112203679 | 0.12 |
ENSRNOT00000031205
|
Nrxn3
|
neurexin 3 |
| chr2_+_251002213 | 0.12 |
ENSRNOT00000080600
|
Odf2l
|
outer dense fiber of sperm tails 2-like |
| chr9_+_73378057 | 0.12 |
ENSRNOT00000043627
ENSRNOT00000045766 ENSRNOT00000092445 ENSRNOT00000037974 |
Map2
|
microtubule-associated protein 2 |
| chr1_-_155955173 | 0.11 |
ENSRNOT00000079345
|
AABR07004776.1
|
|
| chr3_-_109044420 | 0.11 |
ENSRNOT00000007687
|
Rasgrp1
|
RAS guanyl releasing protein 1 |
| chr8_+_53678994 | 0.11 |
ENSRNOT00000083419
|
Drd2
|
dopamine receptor D2 |
| chrM_+_9870 | 0.11 |
ENSRNOT00000044582
|
Mt-nd4l
|
mitochondrially encoded NADH 4L dehydrogenase |
| chr17_+_88215834 | 0.11 |
ENSRNOT00000034098
|
Gpr158
|
G protein-coupled receptor 158 |
| chr2_+_235596907 | 0.11 |
ENSRNOT00000071463
ENSRNOT00000075728 |
Col25a1
|
collagen type XXV alpha 1 chain |
| chr13_-_61591139 | 0.11 |
ENSRNOT00000005324
|
Rgs18
|
regulator of G-protein signaling 18 |
| chr1_-_67094567 | 0.11 |
ENSRNOT00000073583
|
AABR07071871.1
|
|
| chr4_-_117589464 | 0.10 |
ENSRNOT00000021167
|
Nat8f1
|
N-acetyltransferase 8 (GCN5-related) family member 1 |
| chr3_+_14299479 | 0.10 |
ENSRNOT00000092745
|
Cntrl
|
centriolin |
| chr8_-_94920441 | 0.10 |
ENSRNOT00000014165
|
Cep162
|
centrosomal protein 162 |
| chr3_+_122816924 | 0.10 |
ENSRNOT00000045604
|
RGD1561317
|
similar to ribosomal protein L31 |
| chr12_-_37682964 | 0.10 |
ENSRNOT00000001421
|
RGD1563482
|
similar to hypothetical protein FLJ38663 |
| chr3_+_63379031 | 0.10 |
ENSRNOT00000068199
|
Osbpl6
|
oxysterol binding protein-like 6 |
| chr1_-_62316450 | 0.10 |
ENSRNOT00000079171
|
AABR07001926.3
|
|
| chr5_+_106952082 | 0.10 |
ENSRNOT00000046931
|
RGD1561246
|
similar to put. precursor MuIFN-alpha 5 |
| chr1_+_228684136 | 0.10 |
ENSRNOT00000028608
|
Olr337
|
olfactory receptor 337 |
| chr7_+_144503534 | 0.10 |
ENSRNOT00000021543
|
Tbca
|
tubulin folding cofactor A |
| chr8_-_69466618 | 0.10 |
ENSRNOT00000042925
|
Ids
|
iduronate 2-sulfatase |
| chr2_+_243425007 | 0.09 |
ENSRNOT00000082894
|
Trmt10a
|
tRNA methyltransferase 10A |
| chr1_-_219388009 | 0.09 |
ENSRNOT00000001550
|
Cabp4
|
calcium binding protein 4 |
| chrX_+_70256737 | 0.09 |
ENSRNOT00000029298
|
Otud6a
|
OTU deubiquitinase 6A |
| chr15_-_58171049 | 0.09 |
ENSRNOT00000001371
|
Gpalpp1
|
GPALPP motifs containing 1 |
| chr2_+_210045161 | 0.09 |
ENSRNOT00000024455
|
Slc16a4
|
solute carrier family 16, member 4 |
| chr11_-_60882379 | 0.09 |
ENSRNOT00000002799
|
Cd200r1
|
CD200 receptor 1 |
| chr20_+_20236151 | 0.09 |
ENSRNOT00000079630
|
Ank3
|
ankyrin 3 |
| chr1_+_69615603 | 0.09 |
ENSRNOT00000084806
|
Zfp418
|
zinc finger protein 418 |
| chr6_+_145546595 | 0.08 |
ENSRNOT00000007112
|
Rapgef5
|
Rap guanine nucleotide exchange factor 5 |
| chr14_+_113867209 | 0.08 |
ENSRNOT00000067591
|
Ccdc88a
|
coiled coil domain containing 88A |
| chr13_+_80464348 | 0.08 |
ENSRNOT00000076324
|
Vamp4
|
vesicle-associated membrane protein 4 |
| chr3_-_57192125 | 0.08 |
ENSRNOT00000032528
|
RGD1565767
|
similar to ribosomal protein L15 |
| chr8_-_21492801 | 0.08 |
ENSRNOT00000077465
|
Zfp426
|
zinc finger protein 426 |
| chr3_-_151625644 | 0.08 |
ENSRNOT00000026657
|
Rbm12
|
RNA binding motif protein 12 |
| chr8_+_53678777 | 0.08 |
ENSRNOT00000045944
|
Drd2
|
dopamine receptor D2 |
| chr8_-_96547568 | 0.08 |
ENSRNOT00000078343
|
RGD1560775
|
similar to RIKEN cDNA 4930579C12 gene |
| chr3_-_146470293 | 0.08 |
ENSRNOT00000009627
|
Acss1
|
acyl-CoA synthetase short-chain family member 1 |
| chr2_-_219262901 | 0.08 |
ENSRNOT00000037068
|
Gpr88
|
G-protein coupled receptor 88 |
| chr3_-_431933 | 0.08 |
ENSRNOT00000033653
|
Spopl
|
speckle type BTB/POZ protein like |
| chr9_-_52238564 | 0.08 |
ENSRNOT00000005073
|
Col5a2
|
collagen type V alpha 2 chain |
| chr8_+_82038967 | 0.07 |
ENSRNOT00000079535
|
Myo5a
|
myosin VA |
| chr5_-_149987910 | 0.07 |
ENSRNOT00000091637
|
Ptpru
|
protein tyrosine phosphatase, receptor type, U |
| chr18_+_15467870 | 0.07 |
ENSRNOT00000091696
|
B4galt6
|
beta-1,4-galactosyltransferase 6 |
| chr9_+_61738471 | 0.07 |
ENSRNOT00000090305
|
AABR07067762.1
|
|
| chr7_+_112057030 | 0.07 |
ENSRNOT00000035216
|
AABR07058366.1
|
|
| chr1_-_260992291 | 0.07 |
ENSRNOT00000035415
ENSRNOT00000034758 |
Slit1
|
slit guidance ligand 1 |
| chr18_-_63357194 | 0.07 |
ENSRNOT00000089408
ENSRNOT00000066103 |
Spire1
|
spire-type actin nucleation factor 1 |
| chr9_+_81880177 | 0.07 |
ENSRNOT00000022839
|
Stk36
|
serine/threonine kinase 36 |
| chr11_-_31238026 | 0.07 |
ENSRNOT00000032366
|
RGD1562726
|
similar to Putative protein C21orf62 homolog |
| chr8_-_13835168 | 0.07 |
ENSRNOT00000014435
|
Med17
|
mediator complex subunit 17 |
| chrX_+_71199491 | 0.07 |
ENSRNOT00000076168
ENSRNOT00000005077 ENSRNOT00000005102 |
Nlgn3
|
neuroligin 3 |
| chr3_+_79823945 | 0.07 |
ENSRNOT00000014484
|
Celf1
|
CUGBP, Elav-like family member 1 |
| chr4_-_165456677 | 0.07 |
ENSRNOT00000082207
|
Klra2
|
killer cell lectin-like receptor, subfamily A, member 2 |
| chr19_-_15540773 | 0.07 |
ENSRNOT00000022359
|
Lpcat2
|
lysophosphatidylcholine acyltransferase 2 |
| chr16_+_11599753 | 0.07 |
ENSRNOT00000079833
|
Grid1
|
glutamate ionotropic receptor delta type subunit 1 |
| chr3_+_8958090 | 0.07 |
ENSRNOT00000086789
ENSRNOT00000064557 |
Dolpp1
|
dolichyldiphosphatase 1 |
| chr4_-_164123974 | 0.07 |
ENSRNOT00000082447
|
LOC502907
|
similar to immunoreceptor Ly49si1 |
| chr13_+_51384562 | 0.07 |
ENSRNOT00000077928
|
Kdm5b
|
lysine demethylase 5B |
| chr16_-_20097287 | 0.07 |
ENSRNOT00000025162
|
Unc13a
|
unc-13 homolog A |
| chr9_+_18001105 | 0.07 |
ENSRNOT00000071814
|
AABR07066826.2
|
|
| chr6_-_133716847 | 0.07 |
ENSRNOT00000072399
|
Rtl1
|
retrotransposon-like 1 |
| chr5_+_27312928 | 0.07 |
ENSRNOT00000078102
|
Runx1t1
|
RUNX1 translocation partner 1 |
| chr1_+_255801694 | 0.07 |
ENSRNOT00000018878
|
AC103056.1
|
|
| chr7_-_125465848 | 0.07 |
ENSRNOT00000039588
|
Ldoc1l
|
leucine zipper, down-regulated in cancer 1-like |
| chr1_-_101664436 | 0.07 |
ENSRNOT00000028522
|
Sec1
|
secretory blood group 1 |
| chr11_-_80650802 | 0.07 |
ENSRNOT00000043660
|
Rtp4
|
receptor (chemosensory) transporter protein 4 |
| chr19_-_44211208 | 0.07 |
ENSRNOT00000026309
|
Adat1
|
adenosine deaminase, tRNA-specific 1 |
| chr4_+_61814974 | 0.07 |
ENSRNOT00000074951
|
Akr1b10
|
aldo-keto reductase family 1 member B10 |
| chr1_-_37741709 | 0.06 |
ENSRNOT00000079186
|
Fastkd3
|
FAST kinase domains 3 |
| chr8_-_120446455 | 0.06 |
ENSRNOT00000085161
ENSRNOT00000042854 ENSRNOT00000037199 |
Arpp21
|
cAMP regulated phosphoprotein 21 |
| chr2_+_147496229 | 0.06 |
ENSRNOT00000022105
|
Tm4sf4
|
transmembrane 4 L six family member 4 |
| chr1_-_259484569 | 0.06 |
ENSRNOT00000021289
ENSRNOT00000021114 ENSRNOT00000021229 ENSRNOT00000021347 ENSRNOT00000021226 |
Sorbs1
|
sorbin and SH3 domain containing 1 |
| chr11_-_83483513 | 0.06 |
ENSRNOT00000084380
|
AABR07034673.1
|
|
| chr7_-_124929025 | 0.06 |
ENSRNOT00000015447
|
Efcab6
|
EF-hand calcium binding domain 6 |
| chr2_-_234296145 | 0.06 |
ENSRNOT00000014155
|
Elovl6
|
ELOVL fatty acid elongase 6 |
| chr18_-_86878142 | 0.06 |
ENSRNOT00000058139
|
Dok6
|
docking protein 6 |
| chr12_-_37688743 | 0.06 |
ENSRNOT00000030251
|
RGD1563482
|
similar to hypothetical protein FLJ38663 |
| chr2_+_57276919 | 0.06 |
ENSRNOT00000063899
|
RGD1310081
|
similar to hypothetical protein FLJ13231 |
| chr9_+_12475006 | 0.06 |
ENSRNOT00000079703
|
LOC100912293
|
uncharacterized LOC100912293 |
| chrM_+_11736 | 0.06 |
ENSRNOT00000048767
|
Mt-nd5
|
mitochondrially encoded NADH dehydrogenase 5 |
| chr8_-_36374673 | 0.06 |
ENSRNOT00000013763
|
Dcps
|
decapping enzyme, scavenger |
| chr8_+_72029489 | 0.06 |
ENSRNOT00000089336
|
Herc1
|
HECT and RLD domain containing E3 ubiquitin protein ligase family member 1 |
| chrX_-_142248369 | 0.06 |
ENSRNOT00000091330
|
Fgf13
|
fibroblast growth factor 13 |
| chrX_+_70438617 | 0.06 |
ENSRNOT00000076671
|
Arr3
|
arrestin 3 |
| chr12_-_16027881 | 0.06 |
ENSRNOT00000064726
|
Brat1
|
BRCA1-associated ATM activator 1 |
| chrX_+_51286737 | 0.06 |
ENSRNOT00000035692
|
Dmd
|
dystrophin |
| chr16_-_32439421 | 0.06 |
ENSRNOT00000043100
|
Nek1
|
NIMA-related kinase 1 |
| chr7_+_123482255 | 0.06 |
ENSRNOT00000064487
|
LOC688613
|
hypothetical protein LOC688613 |
| chr9_+_8399632 | 0.06 |
ENSRNOT00000092165
|
LOC100360856
|
hypothetical protein LOC100360856 |
| chr1_+_72956026 | 0.06 |
ENSRNOT00000031462
|
Rdh13
|
retinol dehydrogenase 13 |
| chr3_+_69549673 | 0.06 |
ENSRNOT00000043974
|
Zfp804a
|
zinc finger protein 804A |
| chr3_+_163664136 | 0.06 |
ENSRNOT00000010210
|
Cse1l
|
chromosome segregation 1 like |
| chr1_+_164706276 | 0.06 |
ENSRNOT00000024311
|
Olr36
|
olfactory receptor 36 |
| chr13_-_81698833 | 0.06 |
ENSRNOT00000005148
|
Gorab
|
golgin, RAB6-interacting |
| chr18_-_81682206 | 0.06 |
ENSRNOT00000058219
|
LOC100359752
|
hypothetical protein LOC100359752 |
| chr2_-_20152884 | 0.06 |
ENSRNOT00000021941
|
Atg10
|
autophagy related 10 |
| chr16_-_9658484 | 0.06 |
ENSRNOT00000065216
|
Mapk8
|
mitogen-activated protein kinase 8 |
| chr7_-_130827152 | 0.06 |
ENSRNOT00000019406
|
Syt10
|
synaptotagmin 10 |
| chr6_+_64297888 | 0.06 |
ENSRNOT00000050222
ENSRNOT00000083088 ENSRNOT00000093147 |
Nrcam
|
neuronal cell adhesion molecule |
| chr10_-_95262024 | 0.05 |
ENSRNOT00000066487
|
Bptf
|
bromodomain PHD finger transcription factor |
| chr4_-_129515435 | 0.05 |
ENSRNOT00000039353
|
Eogt
|
EGF domain specific O-linked N-acetylglucosamine transferase |
| chr8_-_39201588 | 0.05 |
ENSRNOT00000011226
|
Stt3a
|
STT3A, catalytic subunit of the oligosaccharyltransferase complex |
| chr17_+_9746485 | 0.05 |
ENSRNOT00000072298
|
Pfn3
|
profilin 3 |
| chr6_+_47916188 | 0.05 |
ENSRNOT00000011819
|
Rnaseh1
|
ribonuclease H1 |
| chr8_-_13906355 | 0.05 |
ENSRNOT00000029634
|
Cep295
|
centrosomal protein 295 |
| chr9_+_8349033 | 0.05 |
ENSRNOT00000073775
|
LOC100360856
|
hypothetical protein LOC100360856 |
| chr6_-_1454480 | 0.05 |
ENSRNOT00000072810
|
Eif2ak2
|
eukaryotic translation initiation factor 2-alpha kinase 2 |
| chr8_-_49271834 | 0.05 |
ENSRNOT00000085022
|
Ube4a
|
ubiquitination factor E4A |
| chr16_-_32299542 | 0.05 |
ENSRNOT00000072321
|
AABR07025299.1
|
|
| chr1_-_140535934 | 0.05 |
ENSRNOT00000065457
|
Det1
|
de-etiolated homolog 1 (Arabidopsis) |
| chr4_-_155275161 | 0.05 |
ENSRNOT00000032690
|
Rimklb
|
ribosomal modification protein rimK-like family member B |
| chr1_-_247985497 | 0.05 |
ENSRNOT00000078998
|
Ranbp6
|
RAN binding protein 6 |
| chr15_+_41448064 | 0.05 |
ENSRNOT00000019551
|
Sacs
|
sacsin molecular chaperone |
| chr7_+_132378273 | 0.05 |
ENSRNOT00000010990
|
LOC690142
|
hypothetical protein LOC690142 |
| chr2_-_91497091 | 0.05 |
ENSRNOT00000015185
|
Pcsk1
|
proprotein convertase subtilisin/kexin type 1 |
| chr16_+_48120864 | 0.05 |
ENSRNOT00000068562
|
Stox2
|
storkhead box 2 |
| chr16_-_81583374 | 0.05 |
ENSRNOT00000092501
|
LOC103693999
|
transmembrane and coiled-coil domain-containing protein 3 |
| chr6_+_49968473 | 0.05 |
ENSRNOT00000007466
|
Fam110c
|
family with sequence similarity 110, member C |
| chr5_-_164648328 | 0.05 |
ENSRNOT00000090811
|
Zfp933
|
zinc finger protein 933 |
| chr4_-_81968832 | 0.05 |
ENSRNOT00000016608
|
Skap2
|
src kinase associated phosphoprotein 2 |
| chr8_-_92942076 | 0.05 |
ENSRNOT00000056937
|
Fam46a
|
family with sequence similarity 46, member A |
| chr14_-_8600512 | 0.05 |
ENSRNOT00000092537
|
Arhgap24
|
Rho GTPase activating protein 24 |
| chrX_-_915953 | 0.05 |
ENSRNOT00000075264
|
Spaca5
|
sperm acrosome associated 5 |
| chr1_-_16687817 | 0.05 |
ENSRNOT00000091376
ENSRNOT00000081620 |
Myb
|
MYB proto-oncogene, transcription factor |
| chr6_+_97168453 | 0.05 |
ENSRNOT00000085790
|
Syt16
|
synaptotagmin 16 |
| chr13_+_51384389 | 0.05 |
ENSRNOT00000087025
|
Kdm5b
|
lysine demethylase 5B |
| chr9_+_43889473 | 0.05 |
ENSRNOT00000024330
|
Inpp4a
|
inositol polyphosphate-4-phosphatase type I A |
| chr10_+_76343847 | 0.05 |
ENSRNOT00000055674
|
Trim25
|
tripartite motif-containing 25 |
| chr5_+_156615886 | 0.05 |
ENSRNOT00000076439
|
Sh2d5
|
SH2 domain containing 5 |
| chr9_+_73319710 | 0.05 |
ENSRNOT00000092485
|
Map2
|
microtubule-associated protein 2 |
| chr2_+_187447501 | 0.05 |
ENSRNOT00000038589
|
Iqgap3
|
IQ motif containing GTPase activating protein 3 |
| chrX_-_1076850 | 0.05 |
ENSRNOT00000090671
|
LOC100363372
|
zinc finger protein 81 (HFZ20)-like |
| chr18_+_17091310 | 0.05 |
ENSRNOT00000093285
|
Fhod3
|
formin homology 2 domain containing 3 |
| chrX_-_156891213 | 0.05 |
ENSRNOT00000082899
|
Avpr2
|
arginine vasopressin receptor 2 |
| chr10_+_36589181 | 0.05 |
ENSRNOT00000045596
|
Zfp354a
|
zinc finger protein 354A |
| chr5_-_145123861 | 0.05 |
ENSRNOT00000064015
|
Zmym1
|
zinc finger MYM-type containing 1 |
| chr10_-_49149479 | 0.05 |
ENSRNOT00000004291
|
Zfp287
|
zinc finger protein 287 |
| chr7_-_107223047 | 0.05 |
ENSRNOT00000007250
ENSRNOT00000084875 |
Lrrc6
|
leucine rich repeat containing 6 |
| chrX_+_123751293 | 0.04 |
ENSRNOT00000089883
|
Nkap
|
NFKB activating protein |
| chr19_+_25043680 | 0.04 |
ENSRNOT00000043971
|
Adgrl1
|
adhesion G protein-coupled receptor L1 |
| chr4_+_170820594 | 0.04 |
ENSRNOT00000032568
|
LOC500354
|
similar to C030030A07Rik protein |
| chr7_-_139675245 | 0.04 |
ENSRNOT00000030943
|
Senp1
|
SUMO1/sentrin specific peptidase 1 |
| chr19_-_50220455 | 0.04 |
ENSRNOT00000079760
|
Sdr42e1
|
short chain dehydrogenase/reductase family 42E, member 1 |
| chr1_-_38538987 | 0.04 |
ENSRNOT00000090406
ENSRNOT00000071275 |
LOC102551340
|
zinc finger protein 728-like |
| chr2_-_187822997 | 0.04 |
ENSRNOT00000092932
|
Sema4a
|
semaphorin 4A |
| chr3_+_121408146 | 0.04 |
ENSRNOT00000023708
|
Fbln7
|
fibulin 7 |
| chr17_+_34704616 | 0.04 |
ENSRNOT00000090706
ENSRNOT00000083674 ENSRNOT00000077110 |
Exoc2
|
exocyst complex component 2 |
| chr10_+_67532030 | 0.04 |
ENSRNOT00000005428
|
Rhot1
|
ras homolog family member T1 |
| chr7_+_20462081 | 0.04 |
ENSRNOT00000088383
|
AABR07056131.1
|
|
| chr12_-_12546111 | 0.04 |
ENSRNOT00000046381
|
Lmtk2
|
lemur tyrosine kinase 2 |
| chr9_-_50868238 | 0.04 |
ENSRNOT00000015600
|
Tex30
|
testis expressed 30 |
| chr4_+_157524423 | 0.04 |
ENSRNOT00000036654
|
Zfp384
|
zinc finger protein 384 |
| chr19_-_37210412 | 0.04 |
ENSRNOT00000083097
|
B3gnt9
|
UDP-GlcNAc:betaGal beta-1,3-N-acetylglucosaminyltransferase 9 |
| chr18_+_27576129 | 0.04 |
ENSRNOT00000070930
|
Kdm3b
|
lysine demethylase 3B |
| chr19_+_25983169 | 0.04 |
ENSRNOT00000004404
|
Syce2
|
synaptonemal complex central element protein 2 |
| chrX_+_112358748 | 0.04 |
ENSRNOT00000074776
|
Atg4a
|
autophagy related 4A, cysteine peptidase |
| chr8_-_55402711 | 0.04 |
ENSRNOT00000091732
|
Sik2
|
salt-inducible kinase 2 |
| chr9_+_43093138 | 0.04 |
ENSRNOT00000021592
|
Cnnm3
|
cyclin and CBS domain divalent metal cation transport mediator 3 |
| chr4_-_22192474 | 0.04 |
ENSRNOT00000043822
|
Abcb1a
|
ATP binding cassette subfamily B member 1A |
| chrX_-_74706214 | 0.04 |
ENSRNOT00000040637
|
Slc16a2
|
solute carrier family 16 member 2 |
| chr1_-_212354273 | 0.04 |
ENSRNOT00000024573
|
Tubgcp2
|
tubulin, gamma complex associated protein 2 |
| chr4_+_117594805 | 0.04 |
ENSRNOT00000074924
|
LOC103690067
|
EKC/KEOPS complex subunit Tprkb |
| chr5_-_113578928 | 0.04 |
ENSRNOT00000010621
|
Plaa
|
phospholipase A2, activating protein |
| chrX_-_14910727 | 0.04 |
ENSRNOT00000085079
ENSRNOT00000030146 |
Ssx1
|
SSX family member 1 |
| chr17_+_81798756 | 0.04 |
ENSRNOT00000066826
|
Cacnb2
|
calcium voltage-gated channel auxiliary subunit beta 2 |
| chr6_+_137959171 | 0.04 |
ENSRNOT00000006835
|
Crip1
|
cysteine rich protein 1 |
| chr9_-_81864202 | 0.04 |
ENSRNOT00000084964
|
Zfp142
|
zinc finger protein 142 |
| chr20_-_54517709 | 0.04 |
ENSRNOT00000076234
|
Grik2
|
glutamate ionotropic receptor kainate type subunit 2 |
| chr1_+_25173242 | 0.04 |
ENSRNOT00000016518
|
Clvs2
|
clavesin 2 |
| chr3_+_79498179 | 0.04 |
ENSRNOT00000030750
|
Nup160
|
nucleoporin 160 |
| chr19_+_43338166 | 0.04 |
ENSRNOT00000091720
ENSRNOT00000084739 |
Fuk
|
fucokinase |
| chr20_+_47395014 | 0.04 |
ENSRNOT00000057116
|
Ostm1
|
osteopetrosis associated transmembrane protein 1 |
| chr3_-_2853272 | 0.04 |
ENSRNOT00000023022
|
Fcna
|
ficolin A |
| chr5_-_50068706 | 0.04 |
ENSRNOT00000084643
|
Orc3
|
origin recognition complex, subunit 3 |
| chrX_-_72034099 | 0.04 |
ENSRNOT00000004310
|
Ercc6l
|
ERCC excision repair 6 like, spindle assembly checkpoint helicase |
| chr8_-_8524643 | 0.04 |
ENSRNOT00000009418
|
Cntn5
|
contactin 5 |
| chrX_+_21499934 | 0.04 |
ENSRNOT00000090890
ENSRNOT00000081037 |
Huwe1
|
HECT, UBA and WWE domain containing 1, E3 ubiquitin protein ligase |
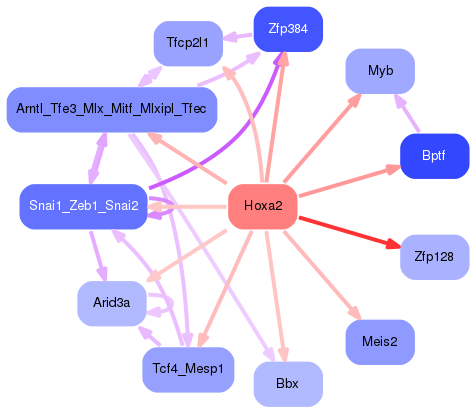
Network of associatons between targets according to the STRING database.

First level regulatory network of Hoxa2
Gene Ontology Analysis
Gene overrepresentation in biological process category:
| Log-likelihood per target | Total log-likelihood | Term | Description |
|---|---|---|---|
| 0.0 | 0.2 | GO:1900168 | glial cell-derived neurotrophic factor secretion(GO:0044467) positive regulation of neurotransmitter uptake(GO:0051582) positive regulation of dopamine uptake involved in synaptic transmission(GO:0051586) positive regulation of catecholamine uptake involved in synaptic transmission(GO:0051944) negative regulation of dopamine receptor signaling pathway(GO:0060160) regulation of glial cell-derived neurotrophic factor secretion(GO:1900166) positive regulation of glial cell-derived neurotrophic factor secretion(GO:1900168) |
| 0.0 | 0.1 | GO:0006083 | acetate metabolic process(GO:0006083) |
| 0.0 | 0.1 | GO:0008594 | photoreceptor cell morphogenesis(GO:0008594) |
| 0.0 | 0.1 | GO:1990168 | protein K27-linked deubiquitination(GO:1990167) protein K33-linked deubiquitination(GO:1990168) |
| 0.0 | 0.1 | GO:2000861 | estrogen secretion(GO:0035937) estradiol secretion(GO:0035938) regulation of estrogen secretion(GO:2000861) regulation of estradiol secretion(GO:2000864) |
| 0.0 | 0.1 | GO:1903566 | positive regulation of protein localization to cilium(GO:1903566) |
| 0.0 | 0.2 | GO:0032252 | secretory granule localization(GO:0032252) |
| 0.0 | 0.1 | GO:0070649 | formin-nucleated actin cable assembly(GO:0070649) |
| 0.0 | 0.1 | GO:0006663 | platelet activating factor biosynthetic process(GO:0006663) |
| 0.0 | 0.1 | GO:1900827 | positive regulation of cell communication by electrical coupling(GO:0010650) positive regulation of membrane depolarization during cardiac muscle cell action potential(GO:1900827) |
| 0.0 | 0.1 | GO:0021627 | muscle attachment(GO:0016203) olfactory nerve morphogenesis(GO:0021627) olfactory nerve structural organization(GO:0021629) |
| 0.0 | 0.1 | GO:0009644 | response to high light intensity(GO:0009644) |
| 0.0 | 0.1 | GO:1903225 | negative regulation of endodermal cell differentiation(GO:1903225) |
| 0.0 | 0.1 | GO:1902595 | regulation of DNA replication origin binding(GO:1902595) |
| 0.0 | 0.1 | GO:0021834 | chemorepulsion involved in embryonic olfactory bulb interneuron precursor migration(GO:0021834) |
| 0.0 | 0.1 | GO:0007228 | positive regulation of hh target transcription factor activity(GO:0007228) |
| 0.0 | 0.1 | GO:0010157 | response to chlorate(GO:0010157) |
| 0.0 | 0.1 | GO:0006714 | sesquiterpenoid metabolic process(GO:0006714) polyprenol catabolic process(GO:0016095) |
| 0.0 | 0.0 | GO:2000845 | positive regulation of testosterone secretion(GO:2000845) |
| 0.0 | 0.1 | GO:0061743 | motor learning(GO:0061743) |
| 0.0 | 0.1 | GO:0034625 | fatty acid elongation, monounsaturated fatty acid(GO:0034625) |
| 0.0 | 0.0 | GO:1904879 | positive regulation of calcium ion transmembrane transport via high voltage-gated calcium channel(GO:1904879) |
| 0.0 | 0.1 | GO:1900451 | positive regulation of glutamate receptor signaling pathway(GO:1900451) |
| 0.0 | 0.0 | GO:0042350 | GDP-L-fucose biosynthetic process(GO:0042350) |
| 0.0 | 0.0 | GO:0002752 | cell surface pattern recognition receptor signaling pathway(GO:0002752) |
| 0.0 | 0.0 | GO:0006267 | pre-replicative complex assembly involved in nuclear cell cycle DNA replication(GO:0006267) pre-replicative complex assembly(GO:0036388) pre-replicative complex assembly involved in cell cycle DNA replication(GO:1902299) |
| 0.0 | 0.1 | GO:1904008 | response to monosodium glutamate(GO:1904008) |
| 0.0 | 0.1 | GO:0007021 | tubulin complex assembly(GO:0007021) |
| 0.0 | 0.0 | GO:0002143 | tRNA wobble position uridine thiolation(GO:0002143) |
| 0.0 | 0.0 | GO:0021817 | nucleokinesis involved in cell motility in cerebral cortex radial glia guided migration(GO:0021817) nuclear migration along microtubule(GO:0030473) nuclear matrix anchoring at nuclear membrane(GO:0090292) |
| 0.0 | 0.1 | GO:0060385 | axonogenesis involved in innervation(GO:0060385) |
| 0.0 | 0.2 | GO:0090129 | positive regulation of synapse maturation(GO:0090129) |
| 0.0 | 0.0 | GO:1905231 | carbohydrate export(GO:0033231) daunorubicin transport(GO:0043215) response to borneol(GO:1905230) cellular response to borneol(GO:1905231) response to codeine(GO:1905233) response to quercetin(GO:1905235) drug transport across blood-brain barrier(GO:1990962) establishment of blood-retinal barrier(GO:1990963) |
| 0.0 | 0.1 | GO:1901620 | regulation of smoothened signaling pathway involved in dorsal/ventral neural tube patterning(GO:1901620) |
| 0.0 | 0.0 | GO:0060938 | transforming growth factor beta receptor complex assembly(GO:0007181) cardiac fibroblast cell differentiation(GO:0060935) cardiac fibroblast cell development(GO:0060936) epicardium-derived cardiac fibroblast cell differentiation(GO:0060938) epicardium-derived cardiac fibroblast cell development(GO:0060939) |
| 0.0 | 0.0 | GO:1900245 | positive regulation of MDA-5 signaling pathway(GO:1900245) |
| 0.0 | 0.1 | GO:0001992 | regulation of systemic arterial blood pressure by vasopressin(GO:0001992) |
| 0.0 | 0.1 | GO:0009298 | GDP-mannose biosynthetic process(GO:0009298) |
| 0.0 | 0.0 | GO:0036500 | ATF6-mediated unfolded protein response(GO:0036500) |
| 0.0 | 0.0 | GO:0043137 | DNA replication, removal of RNA primer(GO:0043137) |
| 0.0 | 0.0 | GO:1990481 | mRNA pseudouridine synthesis(GO:1990481) |
| 0.0 | 0.0 | GO:0060082 | eye blink reflex(GO:0060082) |
Gene overrepresentation in cellular component category:
| Log-likelihood per target | Total log-likelihood | Term | Description |
|---|---|---|---|
| 0.0 | 0.1 | GO:0042642 | actomyosin, myosin complex part(GO:0042642) |
| 0.0 | 0.1 | GO:0005899 | insulin receptor complex(GO:0005899) |
| 0.0 | 0.1 | GO:0005588 | collagen type V trimer(GO:0005588) |
| 0.0 | 0.2 | GO:0097442 | CA3 pyramidal cell dendrite(GO:0097442) |
| 0.0 | 0.1 | GO:0005879 | axonemal microtubule(GO:0005879) |
| 0.0 | 0.0 | GO:0008275 | gamma-tubulin small complex(GO:0008275) |
| 0.0 | 0.0 | GO:0005656 | nuclear pre-replicative complex(GO:0005656) pre-replicative complex(GO:0036387) |
| 0.0 | 0.0 | GO:0034673 | inhibin-betaglycan-ActRII complex(GO:0034673) |
| 0.0 | 0.0 | GO:0089717 | spanning component of plasma membrane(GO:0044214) spanning component of membrane(GO:0089717) |
Gene overrepresentation in molecular function category:
| Log-likelihood per target | Total log-likelihood | Term | Description |
|---|---|---|---|
| 0.0 | 0.2 | GO:0001591 | dopamine neurotransmitter receptor activity, coupled via Gi/Go(GO:0001591) |
| 0.0 | 0.1 | GO:0008107 | galactoside 2-alpha-L-fucosyltransferase activity(GO:0008107) alpha-(1,2)-fucosyltransferase activity(GO:0031127) |
| 0.0 | 0.2 | GO:0017034 | Rap guanyl-nucleotide exchange factor activity(GO:0017034) |
| 0.0 | 0.1 | GO:0003987 | acetate-CoA ligase activity(GO:0003987) |
| 0.0 | 0.1 | GO:0034647 | histone demethylase activity (H3-trimethyl-K4 specific)(GO:0034647) |
| 0.0 | 0.1 | GO:0009019 | tRNA (guanine-N1-)-methyltransferase activity(GO:0009019) |
| 0.0 | 0.1 | GO:0008489 | UDP-galactose:glucosylceramide beta-1,4-galactosyltransferase activity(GO:0008489) |
| 0.0 | 0.1 | GO:0047184 | 1-acylglycerophosphocholine O-acyltransferase activity(GO:0047184) |
| 0.0 | 0.1 | GO:0031849 | olfactory receptor binding(GO:0031849) |
| 0.0 | 0.2 | GO:0003747 | translation release factor activity(GO:0003747) translation termination factor activity(GO:0008079) |
| 0.0 | 0.1 | GO:0070401 | NADP-retinol dehydrogenase activity(GO:0052650) NADP+ binding(GO:0070401) |
| 0.0 | 0.1 | GO:0070568 | guanylyltransferase activity(GO:0070568) |
| 0.0 | 0.1 | GO:0070097 | alpha-catenin binding(GO:0045294) delta-catenin binding(GO:0070097) |
| 0.0 | 0.1 | GO:0016262 | protein N-acetylglucosaminyltransferase activity(GO:0016262) |
| 0.0 | 0.2 | GO:0002162 | dystroglycan binding(GO:0002162) |
| 0.0 | 0.1 | GO:0048495 | Roundabout binding(GO:0048495) |
| 0.0 | 0.1 | GO:0102337 | fatty acid elongase activity(GO:0009922) 3-oxo-arachidoyl-CoA synthase activity(GO:0102336) 3-oxo-cerotoyl-CoA synthase activity(GO:0102337) 3-oxo-lignoceronyl-CoA synthase activity(GO:0102338) |