Project
GSE49485: Hypoxia transcriptome sequencing of rat brain.
Navigation
Downloads
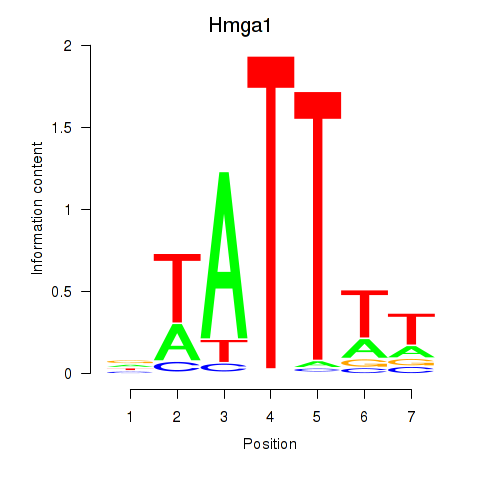
Results for Hmga1
Z-value: 0.47
Motif logo
Transcription factors associated with Hmga1
| Gene Symbol | Gene ID | Gene Info |
|---|---|---|
|
Hmga1
|
ENSRNOG00000000488 | high mobility group AT-hook 1 |
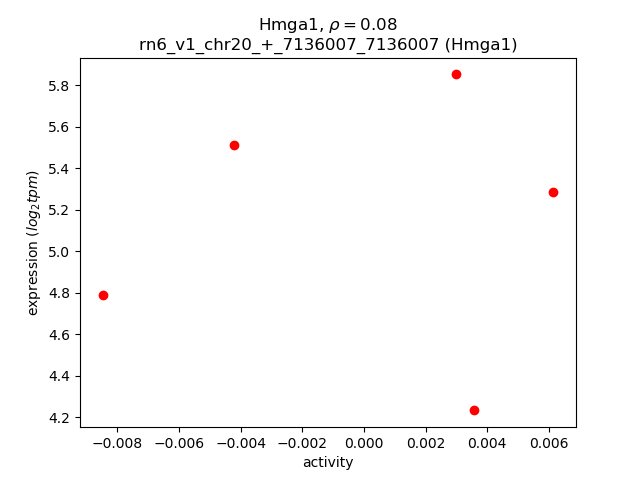
Activity-expression correlation:
| Gene | Promoter | Pearson corr. coef. | P-value | Plot |
|---|---|---|---|---|
| Hmga1 | rn6_v1_chr20_+_7136007_7136007 | 0.08 | 9.0e-01 | Click! |
Activity profile of Hmga1 motif
Sorted Z-values of Hmga1 motif
| Promoter | Log-likelihood | Transcript | Gene | Gene Info |
|---|---|---|---|---|
| chr16_-_73827488 | 0.22 |
ENSRNOT00000064070
|
Ank1
|
ankyrin 1 |
| chr11_-_31180616 | 0.17 |
ENSRNOT00000065535
ENSRNOT00000052033 ENSRNOT00000002812 |
Synj1
|
synaptojanin 1 |
| chr6_+_73553210 | 0.15 |
ENSRNOT00000006562
|
Akap6
|
A-kinase anchoring protein 6 |
| chr9_-_88816898 | 0.15 |
ENSRNOT00000083667
|
Slc19a3
|
solute carrier family 19 member 3 |
| chr2_-_208225888 | 0.14 |
ENSRNOT00000054860
|
AABR07012775.1
|
|
| chr7_+_74350479 | 0.14 |
ENSRNOT00000089034
|
AABR07057495.1
|
|
| chr13_-_61591139 | 0.14 |
ENSRNOT00000005324
|
Rgs18
|
regulator of G-protein signaling 18 |
| chr13_+_98311827 | 0.14 |
ENSRNOT00000082844
|
Cdc42bpa
|
CDC42 binding protein kinase alpha |
| chr9_+_121831716 | 0.13 |
ENSRNOT00000056250
ENSRNOT00000056251 |
Yes1
|
YES proto-oncogene 1, Src family tyrosine kinase |
| chr2_-_149444548 | 0.12 |
ENSRNOT00000018600
|
P2ry12
|
purinergic receptor P2Y12 |
| chrX_-_158288109 | 0.11 |
ENSRNOT00000072527
|
LOC103690175
|
PHD finger protein 6 |
| chr4_-_16654811 | 0.11 |
ENSRNOT00000008637
|
Pclo
|
piccolo (presynaptic cytomatrix protein) |
| chr16_-_70705128 | 0.11 |
ENSRNOT00000071258
|
Rnf170
|
ring finger protein 170 |
| chr18_+_30562178 | 0.11 |
ENSRNOT00000040998
|
LOC108348771
|
protocadherin beta-16-like |
| chr12_-_5773036 | 0.11 |
ENSRNOT00000041365
|
Fry
|
FRY microtubule binding protein |
| chr18_+_30864216 | 0.10 |
ENSRNOT00000027015
|
Pcdhga7
|
protocadherin gamma subfamily A, 7 |
| chr9_-_28732919 | 0.10 |
ENSRNOT00000083915
|
Rims1
|
regulating synaptic membrane exocytosis 1 |
| chr14_-_28967980 | 0.10 |
ENSRNOT00000048175
|
Adgrl3
|
adhesion G protein-coupled receptor L3 |
| chr19_-_22194740 | 0.10 |
ENSRNOT00000086187
|
Phkb
|
phosphorylase kinase regulatory subunit beta |
| chr4_-_89281222 | 0.10 |
ENSRNOT00000010898
|
Fam13a
|
family with sequence similarity 13, member A |
| chr11_-_11213821 | 0.10 |
ENSRNOT00000093706
|
Robo2
|
roundabout guidance receptor 2 |
| chr4_+_120672152 | 0.09 |
ENSRNOT00000077231
|
Mgll
|
monoglyceride lipase |
| chrX_-_76708878 | 0.09 |
ENSRNOT00000045534
|
Atrx
|
ATRX, chromatin remodeler |
| chr2_+_186980992 | 0.09 |
ENSRNOT00000020717
|
Arhgef11
|
Rho guanine nucleotide exchange factor 11 |
| chr9_-_73799427 | 0.09 |
ENSRNOT00000067589
|
Kansl1l
|
KAT8 regulatory NSL complex subunit 1-like |
| chr6_+_27887797 | 0.09 |
ENSRNOT00000015827
|
Asxl2
|
additional sex combs like 2, transcriptional regulator |
| chrX_-_10031167 | 0.09 |
ENSRNOT00000060988
|
Gpr34
|
G protein-coupled receptor 34 |
| chr4_-_135069970 | 0.09 |
ENSRNOT00000008221
|
Cntn3
|
contactin 3 |
| chr2_+_231941794 | 0.09 |
ENSRNOT00000091475
|
AABR07013288.4
|
|
| chr13_-_90710148 | 0.08 |
ENSRNOT00000010113
ENSRNOT00000080638 |
Kcnj9
|
potassium voltage-gated channel subfamily J member 9 |
| chr3_-_66885085 | 0.08 |
ENSRNOT00000084299
ENSRNOT00000090547 |
Pde1a
|
phosphodiesterase 1A |
| chr8_-_8524643 | 0.08 |
ENSRNOT00000009418
|
Cntn5
|
contactin 5 |
| chr3_+_150135821 | 0.08 |
ENSRNOT00000047286
|
Zfp341
|
zinc finger protein 341 |
| chr2_+_186980793 | 0.08 |
ENSRNOT00000091336
|
Arhgef11
|
Rho guanine nucleotide exchange factor 11 |
| chr4_+_157705790 | 0.08 |
ENSRNOT00000025970
|
Mrpl51
|
mitochondrial ribosomal protein L51 |
| chr1_-_67134827 | 0.08 |
ENSRNOT00000045214
|
Vom1r45
|
vomeronasal 1 receptor 45 |
| chr5_+_116420690 | 0.07 |
ENSRNOT00000087089
|
Nfia
|
nuclear factor I/A |
| chrX_+_54062935 | 0.07 |
ENSRNOT00000004854
|
Tab3
|
TGF-beta activated kinase 1/MAP3K7 binding protein 3 |
| chr13_+_98231326 | 0.07 |
ENSRNOT00000003837
|
Cdc42bpa
|
CDC42 binding protein kinase alpha |
| chr17_-_57394985 | 0.07 |
ENSRNOT00000019968
|
Epc1
|
enhancer of polycomb homolog 1 |
| chrX_+_908044 | 0.07 |
ENSRNOT00000072087
|
Zfp300
|
zinc finger protein 300 |
| chr15_-_40542495 | 0.07 |
ENSRNOT00000063943
|
Nup58
|
nucleoporin 58 |
| chr7_+_80750725 | 0.07 |
ENSRNOT00000079962
|
Oxr1
|
oxidation resistance 1 |
| chr1_-_128287151 | 0.07 |
ENSRNOT00000084946
ENSRNOT00000089723 |
Mef2a
|
myocyte enhancer factor 2a |
| chr16_+_50152008 | 0.07 |
ENSRNOT00000019237
|
Klkb1
|
kallikrein B1 |
| chr20_+_26755911 | 0.07 |
ENSRNOT00000083017
|
Herc4
|
HECT and RLD domain containing E3 ubiquitin protein ligase 4 |
| chr5_+_2278357 | 0.06 |
ENSRNOT00000066590
|
Stau2
|
staufen double-stranded RNA binding protein 2 |
| chr13_+_44615553 | 0.06 |
ENSRNOT00000082439
ENSRNOT00000005289 |
Rab3gap1
|
RAB3 GTPase activating protein catalytic subunit 1 |
| chr12_-_37682964 | 0.06 |
ENSRNOT00000001421
|
RGD1563482
|
similar to hypothetical protein FLJ38663 |
| chr11_-_90406797 | 0.06 |
ENSRNOT00000073049
|
Snai2
|
snail family transcriptional repressor 2 |
| chr11_+_62584959 | 0.06 |
ENSRNOT00000071065
|
Gramd1c
|
GRAM domain containing 1C |
| chr14_-_3288017 | 0.06 |
ENSRNOT00000080452
|
LOC689986
|
hypothetical protein LOC689986 |
| chr14_-_81399353 | 0.06 |
ENSRNOT00000018340
|
Add1
|
adducin 1 |
| chr5_-_8864578 | 0.06 |
ENSRNOT00000008480
|
Cspp1
|
centrosome and spindle pole associated protein 1 |
| chr2_+_196013799 | 0.06 |
ENSRNOT00000084023
|
Pogz
|
pogo transposable element with ZNF domain |
| chr17_-_53713408 | 0.06 |
ENSRNOT00000022445
|
LOC100912163
|
AT-rich interactive domain-containing protein 4B-like |
| chr15_-_19541815 | 0.06 |
ENSRNOT00000008372
|
Txndc16
|
thioredoxin domain containing 16 |
| chr2_-_231648122 | 0.05 |
ENSRNOT00000014962
|
Ank2
|
ankyrin 2 |
| chr9_-_52830457 | 0.05 |
ENSRNOT00000073557
|
Slc40a1
|
solute carrier family 40 member 1 |
| chr8_-_90962470 | 0.05 |
ENSRNOT00000086426
|
Lca5
|
LCA5, lebercilin |
| chr9_-_81772851 | 0.05 |
ENSRNOT00000032719
|
Usp37
|
ubiquitin specific peptidase 37 |
| chr16_-_6404957 | 0.05 |
ENSRNOT00000048459
|
Cacna1d
|
calcium voltage-gated channel subunit alpha1 D |
| chr18_-_1828606 | 0.05 |
ENSRNOT00000033312
|
Esco1
|
establishment of sister chromatid cohesion N-acetyltransferase 1 |
| chr16_-_6404578 | 0.05 |
ENSRNOT00000051371
|
Cacna1d
|
calcium voltage-gated channel subunit alpha1 D |
| chrX_-_29648359 | 0.05 |
ENSRNOT00000086721
ENSRNOT00000006777 |
Gpm6b
|
glycoprotein m6b |
| chr16_-_3139177 | 0.05 |
ENSRNOT00000039311
|
Ccdc66
|
coiled-coil domain containing 66 |
| chr4_+_99823252 | 0.05 |
ENSRNOT00000013587
|
Polr1a
|
RNA polymerase I subunit A |
| chr3_+_103753238 | 0.05 |
ENSRNOT00000007144
|
Slc12a6
|
solute carrier family 12, member 6 |
| chr4_+_118655728 | 0.05 |
ENSRNOT00000043082
|
Aak1
|
AP2 associated kinase 1 |
| chr1_+_57692836 | 0.05 |
ENSRNOT00000083968
ENSRNOT00000019358 |
Chd1
|
chromodomain helicase DNA binding protein 1 |
| chr8_+_117308469 | 0.05 |
ENSRNOT00000080778
|
Qrich1
|
glutamine-rich 1 |
| chr7_+_132378273 | 0.05 |
ENSRNOT00000010990
|
LOC690142
|
hypothetical protein LOC690142 |
| chr4_+_138269142 | 0.05 |
ENSRNOT00000007788
|
Cntn4
|
contactin 4 |
| chr14_+_7171613 | 0.05 |
ENSRNOT00000081600
|
Klhl8
|
kelch-like family member 8 |
| chr3_-_133122691 | 0.04 |
ENSRNOT00000083637
|
Tasp1
|
taspase 1 |
| chr6_+_134844676 | 0.04 |
ENSRNOT00000007595
|
Ppp2r5c
|
protein phosphatase 2, regulatory subunit B', gamma |
| chr4_-_99822879 | 0.04 |
ENSRNOT00000012622
ENSRNOT00000078991 |
Ptcd3
|
Pentatricopeptide repeat domain 3 |
| chr6_-_61405195 | 0.04 |
ENSRNOT00000008655
|
Lrrn3
|
leucine rich repeat neuronal 3 |
| chr8_-_90984224 | 0.04 |
ENSRNOT00000044931
|
Lca5
|
LCA5, lebercilin |
| chr5_-_83648044 | 0.04 |
ENSRNOT00000046725
|
RGD1561195
|
similar to ribosomal protein L31 |
| chr8_-_96266342 | 0.04 |
ENSRNOT00000078891
|
Syncrip
|
synaptotagmin binding, cytoplasmic RNA interacting protein |
| chr1_+_257724842 | 0.04 |
ENSRNOT00000075515
|
AABR07006774.1
|
|
| chr9_-_65442257 | 0.04 |
ENSRNOT00000037660
|
Fam126b
|
family with sequence similarity 126, member B |
| chr16_-_10603850 | 0.04 |
ENSRNOT00000087737
|
Fam35a
|
family with sequence similarity 35, member A |
| chr4_-_50200328 | 0.03 |
ENSRNOT00000060530
|
Aass
|
aminoadipate-semialdehyde synthase |
| chr14_+_48768537 | 0.03 |
ENSRNOT00000082599
|
Arap2
|
ArfGAP with RhoGAP domain, ankyrin repeat and PH domain 2 |
| chr20_+_18833481 | 0.03 |
ENSRNOT00000080846
|
Bicc1
|
BicC family RNA binding protein 1 |
| chr6_+_106496992 | 0.03 |
ENSRNOT00000086136
ENSRNOT00000058181 |
Rgs6
|
regulator of G-protein signaling 6 |
| chr11_+_20474483 | 0.03 |
ENSRNOT00000082417
ENSRNOT00000002895 |
Ncam2
|
neural cell adhesion molecule 2 |
| chr2_-_18531210 | 0.03 |
ENSRNOT00000088313
|
Vcan
|
versican |
| chr19_-_49510901 | 0.03 |
ENSRNOT00000082929
ENSRNOT00000079969 |
LOC687399
|
hypothetical protein LOC687399 |
| chr14_+_21177237 | 0.03 |
ENSRNOT00000004866
|
Jchain
|
immunoglobulin joining chain |
| chr19_-_11669578 | 0.03 |
ENSRNOT00000026373
|
Gnao1
|
G protein subunit alpha o1 |
| chrX_+_84064427 | 0.03 |
ENSRNOT00000046364
|
Zfp711
|
zinc finger protein 711 |
| chr7_-_142063212 | 0.03 |
ENSRNOT00000089912
|
Slc11a2
|
solute carrier family 11 member 2 |
| chr14_+_108143869 | 0.03 |
ENSRNOT00000090003
|
Usp34
|
ubiquitin specific peptidase 34 |
| chr16_-_7336335 | 0.03 |
ENSRNOT00000044991
|
Phf7
|
PHD finger protein 7 |
| chr14_-_5006594 | 0.03 |
ENSRNOT00000076571
|
Zfp326
|
zinc finger protein 326 |
| chr9_+_2202511 | 0.03 |
ENSRNOT00000017556
|
Satb1
|
SATB homeobox 1 |
| chr3_+_98297554 | 0.03 |
ENSRNOT00000006524
|
Kcna4
|
potassium voltage-gated channel subfamily A member 4 |
| chr2_-_22096949 | 0.03 |
ENSRNOT00000089325
|
Zfyve16
|
zinc finger FYVE-type containing 16 |
| chr17_-_15429051 | 0.03 |
ENSRNOT00000074667
|
Nol8
|
nucleolar protein 8 |
| chr14_+_48726045 | 0.03 |
ENSRNOT00000086646
|
Arap2
|
ArfGAP with RhoGAP domain, ankyrin repeat and PH domain 2 |
| chr14_-_102293677 | 0.03 |
ENSRNOT00000008135
|
Etaa1
|
Ewing tumor-associated antigen 1 |
| chr2_+_185591959 | 0.03 |
ENSRNOT00000057084
|
Lrba
|
LPS responsive beige-like anchor protein |
| chrX_+_71342775 | 0.02 |
ENSRNOT00000004888
|
Itgb1bp2
|
integrin subunit beta 1 binding protein 2 |
| chr3_-_150960030 | 0.02 |
ENSRNOT00000024714
|
Ncoa6
|
nuclear receptor coactivator 6 |
| chr12_-_37411525 | 0.02 |
ENSRNOT00000087698
|
Tctn2
|
tectonic family member 2 |
| chr9_-_66019065 | 0.02 |
ENSRNOT00000088729
|
Als2
|
ALS2, alsin Rho guanine nucleotide exchange factor |
| chr3_+_154910626 | 0.02 |
ENSRNOT00000079515
|
Ralgapb
|
Ral GTPase activating protein non-catalytic beta subunit |
| chr16_-_19583386 | 0.02 |
ENSRNOT00000090131
|
Zfp617
|
zinc finger protein 617 |
| chr1_-_155955173 | 0.02 |
ENSRNOT00000079345
|
AABR07004776.1
|
|
| chr16_-_6405117 | 0.02 |
ENSRNOT00000047737
|
Cacna1d
|
calcium voltage-gated channel subunit alpha1 D |
| chr18_+_30574627 | 0.02 |
ENSRNOT00000060484
|
Pcdhb19
|
protocadherin beta 19 |
| chr11_-_4332255 | 0.02 |
ENSRNOT00000087133
|
Cadm2
|
cell adhesion molecule 2 |
| chrX_+_20423401 | 0.02 |
ENSRNOT00000093162
|
Wnk3
|
WNK lysine deficient protein kinase 3 |
| chr2_+_237755673 | 0.02 |
ENSRNOT00000083937
|
Tbck
|
TBC1 domain containing kinase |
| chr7_+_140758615 | 0.02 |
ENSRNOT00000089448
|
Troap
|
trophinin associated protein |
| chr7_+_37101391 | 0.02 |
ENSRNOT00000029764
|
Eea1
|
early endosome antigen 1 |
| chr1_-_90149991 | 0.02 |
ENSRNOT00000076987
|
RGD1308428
|
similar to RIKEN cDNA 4931406P16 |
| chr14_+_34455934 | 0.02 |
ENSRNOT00000085991
ENSRNOT00000002981 |
Clock
|
clock circadian regulator |
| chr17_+_44766313 | 0.02 |
ENSRNOT00000091688
|
Hist1h1b
|
histone cluster 1 H1 family member b |
| chr4_+_102426224 | 0.02 |
ENSRNOT00000073768
|
LOC103694107
|
NADH dehydrogenase [ubiquinone] 1 beta subcomplex subunit 3 pseudogene |
| chr3_+_172385672 | 0.02 |
ENSRNOT00000090989
|
Gnas
|
GNAS complex locus |
| chr13_-_55173692 | 0.02 |
ENSRNOT00000064785
ENSRNOT00000029878 ENSRNOT00000029865 ENSRNOT00000060292 ENSRNOT00000000814 |
Ptprc
|
protein tyrosine phosphatase, receptor type, C |
| chr13_+_57243877 | 0.02 |
ENSRNOT00000083693
|
Kcnt2
|
potassium sodium-activated channel subfamily T member 2 |
| chr8_-_53899669 | 0.02 |
ENSRNOT00000082257
|
Ncam1
|
neural cell adhesion molecule 1 |
| chr16_-_2227258 | 0.02 |
ENSRNOT00000089377
ENSRNOT00000067464 |
Slmap
|
sarcolemma associated protein |
| chr2_+_235264219 | 0.02 |
ENSRNOT00000086245
|
Cfi
|
complement factor I |
| chr10_+_97771264 | 0.01 |
ENSRNOT00000005257
|
Arsg
|
arylsulfatase G |
| chr1_-_255976425 | 0.01 |
ENSRNOT00000085303
|
Ide
|
insulin degrading enzyme |
| chr2_-_184263564 | 0.01 |
ENSRNOT00000015279
|
Fbxw7
|
F-box and WD repeat domain containing 7 |
| chr6_+_95323579 | 0.01 |
ENSRNOT00000007369
|
Pcnx4
|
pecanex homolog 4 (Drosophila) |
| chr8_-_126390801 | 0.01 |
ENSRNOT00000089732
|
AABR07071661.1
|
|
| chr2_-_258932200 | 0.01 |
ENSRNOT00000045905
|
Adgrl2
|
adhesion G protein-coupled receptor L2 |
| chr15_-_42517553 | 0.01 |
ENSRNOT00000081500
ENSRNOT00000021320 |
Esco2
|
establishment of sister chromatid cohesion N-acetyltransferase 2 |
| chr5_+_36566783 | 0.01 |
ENSRNOT00000077650
|
Fbxl4
|
F-box and leucine-rich repeat protein 4 |
| chr11_-_61698595 | 0.01 |
ENSRNOT00000093445
|
Ccdc191
|
coiled-coil domain containing 191 |
| chrX_-_142248369 | 0.01 |
ENSRNOT00000091330
|
Fgf13
|
fibroblast growth factor 13 |
| chr5_-_50138475 | 0.01 |
ENSRNOT00000011969
|
Slc35a1
|
solute carrier family 35 member A1 |
| chr3_-_147188929 | 0.01 |
ENSRNOT00000055455
|
Rad21l1
|
RAD21 cohesin complex component like 1 |
| chr11_+_7265828 | 0.01 |
ENSRNOT00000084765
|
Gbe1
|
1,4-alpha-glucan branching enzyme 1 |
| chr6_-_137733026 | 0.01 |
ENSRNOT00000019213
|
Jag2
|
jagged 2 |
| chr8_+_107508351 | 0.01 |
ENSRNOT00000081594
|
Cep70
|
centrosomal protein 70 |
| chr9_-_44419998 | 0.01 |
ENSRNOT00000091397
ENSRNOT00000083747 |
Tsga10
|
testis specific 10 |
| chr3_-_48535909 | 0.01 |
ENSRNOT00000008148
|
Fap
|
fibroblast activation protein, alpha |
| chr5_+_3675833 | 0.00 |
ENSRNOT00000011083
|
RGD1564405
|
similar to mKIAA1321 protein |
| chr1_+_13261876 | 0.00 |
ENSRNOT00000090703
|
Reps1
|
RALBP1 associated Eps domain containing 1 |
| chr1_-_183729569 | 0.00 |
ENSRNOT00000083293
|
Copb1
|
coatomer protein complex, subunit beta 1 |
| chr14_+_70780623 | 0.00 |
ENSRNOT00000083871
ENSRNOT00000058803 |
Ldb2
|
LIM domain binding 2 |
| chr9_-_115382445 | 0.00 |
ENSRNOT00000091316
|
Ptprm
|
protein tyrosine phosphatase, receptor type, M |
| chrX_+_78042859 | 0.00 |
ENSRNOT00000003286
|
Lpar4
|
lysophosphatidic acid receptor 4 |
| chr14_-_33543238 | 0.00 |
ENSRNOT00000066382
|
Srp72
|
signal recognition particle 72 |
| chrX_-_95062132 | 0.00 |
ENSRNOT00000049956
|
Nap1l3
|
nucleosome assembly protein 1-like 3 |
| chr6_+_122751016 | 0.00 |
ENSRNOT00000078050
|
Zc3h14
|
zinc finger CCCH type containing 14 |
| chr3_-_104018861 | 0.00 |
ENSRNOT00000008387
|
Chrm5
|
cholinergic receptor, muscarinic 5 |
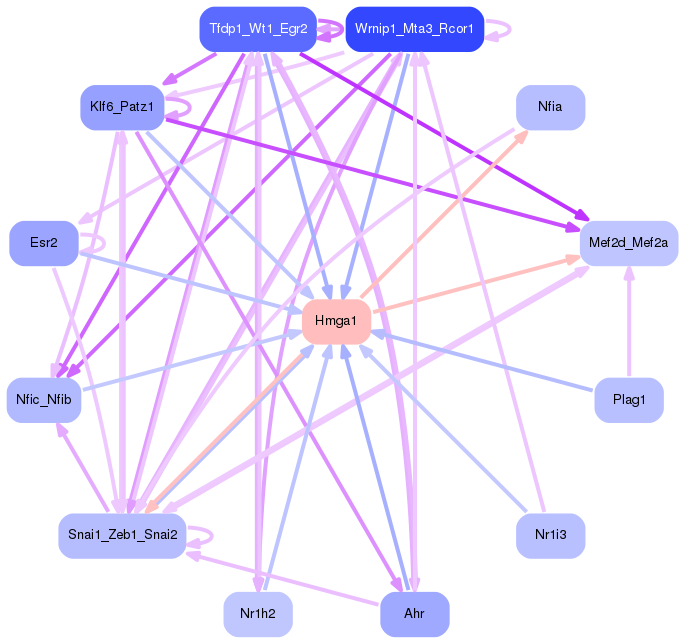
Network of associatons between targets according to the STRING database.

First level regulatory network of Hmga1
Gene Ontology Analysis
Gene overrepresentation in biological process category:
| Log-likelihood per target | Total log-likelihood | Term | Description |
|---|---|---|---|
| 0.1 | 0.2 | GO:0071934 | thiamine transmembrane transport(GO:0071934) |
| 0.0 | 0.1 | GO:1904139 | microglial cell migration(GO:1904124) regulation of microglial cell migration(GO:1904139) |
| 0.0 | 0.2 | GO:1902261 | positive regulation of delayed rectifier potassium channel activity(GO:1902261) |
| 0.0 | 0.1 | GO:0031632 | positive regulation of synaptic vesicle fusion to presynaptic membrane(GO:0031632) |
| 0.0 | 0.1 | GO:1901580 | post-embryonic appendage morphogenesis(GO:0035120) post-embryonic limb morphogenesis(GO:0035127) post-embryonic forelimb morphogenesis(GO:0035128) telomeric repeat-containing RNA transcription(GO:0097393) telomeric repeat-containing RNA transcription from RNA pol II promoter(GO:0097394) regulation of telomeric RNA transcription from RNA pol II promoter(GO:1901580) negative regulation of telomeric RNA transcription from RNA pol II promoter(GO:1901581) positive regulation of telomeric RNA transcription from RNA pol II promoter(GO:1901582) |
| 0.0 | 0.2 | GO:0099590 | neurotransmitter receptor internalization(GO:0099590) |
| 0.0 | 0.1 | GO:1904428 | negative regulation of tubulin deacetylation(GO:1904428) |
| 0.0 | 0.1 | GO:2000124 | regulation of endocannabinoid signaling pathway(GO:2000124) |
| 0.0 | 0.1 | GO:0055005 | ventricular cardiac myofibril assembly(GO:0055005) |
| 0.0 | 0.1 | GO:1903233 | regulation of calcium ion-dependent exocytosis of neurotransmitter(GO:1903233) positive regulation of endoplasmic reticulum tubular network organization(GO:1903373) |
| 0.0 | 0.1 | GO:0070563 | negative regulation of vitamin D receptor signaling pathway(GO:0070563) |
| 0.0 | 0.1 | GO:0050925 | negative regulation of negative chemotaxis(GO:0050925) |
| 0.0 | 0.1 | GO:0099526 | synaptic vesicle targeting(GO:0016080) presynaptic signal transduction(GO:0098928) presynapse to nucleus signaling pathway(GO:0099526) |
| 0.0 | 0.1 | GO:0034395 | regulation of transcription from RNA polymerase II promoter in response to iron(GO:0034395) |
| 0.0 | 0.1 | GO:1900157 | regulation of bone mineralization involved in bone maturation(GO:1900157) |
| 0.0 | 0.1 | GO:0060060 | post-embryonic retina morphogenesis in camera-type eye(GO:0060060) |
| 0.0 | 0.0 | GO:0071477 | hypotonic salinity response(GO:0042539) cellular hypotonic salinity response(GO:0071477) |
| 0.0 | 0.1 | GO:0098964 | dendritic transport of ribonucleoprotein complex(GO:0098961) dendritic transport of messenger ribonucleoprotein complex(GO:0098963) anterograde dendritic transport of messenger ribonucleoprotein complex(GO:0098964) |
| 0.0 | 0.1 | GO:0034421 | post-translational protein acetylation(GO:0034421) |
| 0.0 | 0.2 | GO:0007097 | nuclear migration(GO:0007097) |
| 0.0 | 0.1 | GO:0086046 | membrane depolarization during SA node cell action potential(GO:0086046) |
| 0.0 | 0.1 | GO:0033292 | T-tubule organization(GO:0033292) protein localization to M-band(GO:0036309) protein localization to T-tubule(GO:0036371) |
| 0.0 | 0.0 | GO:0033512 | L-lysine catabolic process to acetyl-CoA via saccharopine(GO:0033512) |
| 0.0 | 0.1 | GO:0051919 | positive regulation of fibrinolysis(GO:0051919) |
| 0.0 | 0.0 | GO:0035444 | nickel cation transport(GO:0015675) vanadium ion transport(GO:0015676) lead ion transport(GO:0015692) nickel cation transmembrane transport(GO:0035444) |
| 0.0 | 0.1 | GO:0051611 | negative regulation of neurotransmitter uptake(GO:0051581) regulation of serotonin uptake(GO:0051611) negative regulation of serotonin uptake(GO:0051612) |
| 0.0 | 0.1 | GO:1903142 | positive regulation of endothelial cell development(GO:1901552) positive regulation of establishment of endothelial barrier(GO:1903142) |
Gene overrepresentation in cellular component category:
| Log-likelihood per target | Total log-likelihood | Term | Description |
|---|---|---|---|
| 0.1 | 0.2 | GO:0014701 | junctional sarcoplasmic reticulum membrane(GO:0014701) |
| 0.0 | 0.1 | GO:0044317 | rod spherule(GO:0044317) |
| 0.0 | 0.1 | GO:1990421 | subtelomeric heterochromatin(GO:1990421) nuclear subtelomeric heterochromatin(GO:1990707) |
| 0.0 | 0.2 | GO:0014731 | spectrin-associated cytoskeleton(GO:0014731) |
| 0.0 | 0.1 | GO:0032777 | Piccolo NuA4 histone acetyltransferase complex(GO:0032777) |
| 0.0 | 0.1 | GO:0098831 | presynaptic active zone cytoplasmic component(GO:0098831) |
| 0.0 | 0.1 | GO:0005964 | phosphorylase kinase complex(GO:0005964) |
| 0.0 | 0.0 | GO:0042571 | immunoglobulin complex, circulating(GO:0042571) |
| 0.0 | 0.0 | GO:0070826 | paraferritin complex(GO:0070826) |
| 0.0 | 0.0 | GO:0044609 | DBIRD complex(GO:0044609) |
| 0.0 | 0.1 | GO:1990454 | L-type voltage-gated calcium channel complex(GO:1990454) |
Gene overrepresentation in molecular function category:
| Log-likelihood per target | Total log-likelihood | Term | Description |
|---|---|---|---|
| 0.1 | 0.2 | GO:0043812 | phosphatidylinositol-4-phosphate phosphatase activity(GO:0043812) |
| 0.1 | 0.2 | GO:0015563 | thiamine transmembrane transporter activity(GO:0015234) uptake transmembrane transporter activity(GO:0015563) |
| 0.0 | 0.2 | GO:0008093 | cytoskeletal adaptor activity(GO:0008093) |
| 0.0 | 0.1 | GO:0086059 | voltage-gated calcium channel activity involved SA node cell action potential(GO:0086059) |
| 0.0 | 0.1 | GO:0048101 | calcium- and calmodulin-regulated 3',5'-cyclic-GMP phosphodiesterase activity(GO:0048101) |
| 0.0 | 0.1 | GO:0015616 | DNA translocase activity(GO:0015616) |
| 0.0 | 0.2 | GO:0043495 | protein anchor(GO:0043495) |
| 0.0 | 0.1 | GO:0015467 | G-protein activated inward rectifier potassium channel activity(GO:0015467) |
| 0.0 | 0.1 | GO:0001609 | G-protein coupled adenosine receptor activity(GO:0001609) |
| 0.0 | 0.1 | GO:0004689 | phosphorylase kinase activity(GO:0004689) |
| 0.0 | 0.0 | GO:0015639 | cadmium ion transmembrane transporter activity(GO:0015086) lead ion transmembrane transporter activity(GO:0015094) nickel cation transmembrane transporter activity(GO:0015099) vanadium ion transmembrane transporter activity(GO:0015100) ferrous iron uptake transmembrane transporter activity(GO:0015639) chromium ion transmembrane transporter activity(GO:0070835) |