Project
GSE49485: Hypoxia transcriptome sequencing of rat brain.
Navigation
Downloads
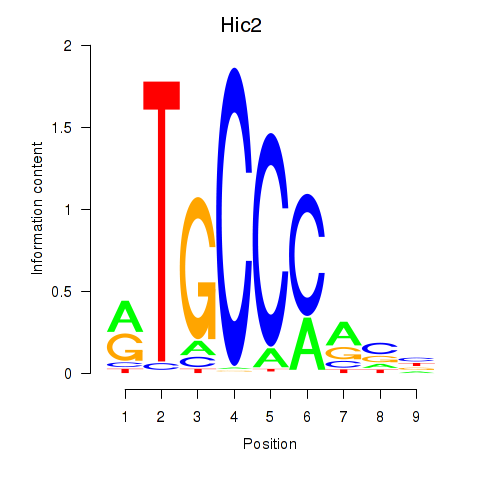
Results for Hic2
Z-value: 2.20
Motif logo
Transcription factors associated with Hic2
| Gene Symbol | Gene ID | Gene Info |
|---|---|---|
|
Hic2
|
ENSRNOG00000051458 | HIC ZBTB transcriptional repressor 2 |
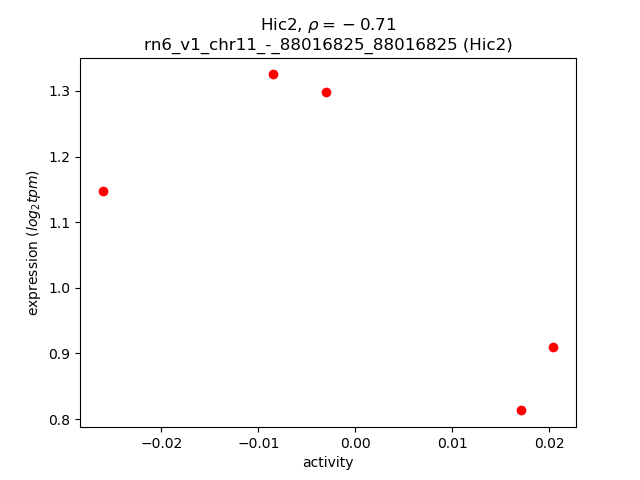
Activity-expression correlation:
| Gene | Promoter | Pearson corr. coef. | P-value | Plot |
|---|---|---|---|---|
| Hic2 | rn6_v1_chr11_-_88016825_88016825 | -0.71 | 1.8e-01 | Click! |
Activity profile of Hic2 motif
Sorted Z-values of Hic2 motif
| Promoter | Log-likelihood | Transcript | Gene | Gene Info |
|---|---|---|---|---|
| chr3_-_123119460 | 3.00 |
ENSRNOT00000028833
|
Avp
|
arginine vasopressin |
| chr3_+_123106694 | 2.08 |
ENSRNOT00000028829
|
Oxt
|
oxytocin/neurophysin 1 prepropeptide |
| chr12_-_30304036 | 2.01 |
ENSRNOT00000001218
|
Nupr2
|
nuclear protein 2, transcriptional regulator |
| chr5_-_156811650 | 1.48 |
ENSRNOT00000068065
|
Fam43b
|
family with sequence similarity 43, member B |
| chr2_-_187160373 | 1.45 |
ENSRNOT00000018961
|
Ntrk1
|
neurotrophic receptor tyrosine kinase 1 |
| chr9_+_82120059 | 1.33 |
ENSRNOT00000057368
|
Cdk5r2
|
cyclin-dependent kinase 5 regulatory subunit 2 |
| chr15_+_37790141 | 1.19 |
ENSRNOT00000076392
ENSRNOT00000091953 |
Il17d
|
interleukin 17D |
| chr8_+_116776494 | 1.18 |
ENSRNOT00000050702
|
Cdhr4
|
cadherin-related family member 4 |
| chr11_+_89008008 | 1.09 |
ENSRNOT00000074586
|
Cebpd
|
CCAAT/enhancer binding protein delta |
| chr1_-_216080287 | 1.06 |
ENSRNOT00000027682
|
Th
|
tyrosine hydroxylase |
| chr10_+_109278712 | 1.05 |
ENSRNOT00000065565
|
LOC690871
|
hypothetical protein LOC690871 |
| chrX_+_62363953 | 0.96 |
ENSRNOT00000083362
|
Arx
|
aristaless related homeobox |
| chr10_-_90312386 | 0.96 |
ENSRNOT00000028445
|
Slc4a1
|
solute carrier family 4 member 1 |
| chr1_+_168964202 | 0.92 |
ENSRNOT00000089102
|
LOC103694855
|
hemoglobin subunit beta-2-like |
| chr10_-_15600858 | 0.85 |
ENSRNOT00000035459
|
Hbq1b
|
hemoglobin, theta 1B |
| chr3_-_9738752 | 0.84 |
ENSRNOT00000045993
|
Ptges
|
prostaglandin E synthase |
| chr2_-_30127269 | 0.75 |
ENSRNOT00000023869
|
Cartpt
|
CART prepropeptide |
| chr6_+_133576568 | 0.74 |
ENSRNOT00000085933
|
Dlk1
|
delta like non-canonical Notch ligand 1 |
| chr10_+_55940533 | 0.71 |
ENSRNOT00000012061
|
RGD1563441
|
similar to RIKEN cDNA A030009H04 |
| chr14_+_43694183 | 0.68 |
ENSRNOT00000046342
|
RGD1563570
|
similar to ribosomal protein S23 |
| chr16_+_21282467 | 0.66 |
ENSRNOT00000065345
|
Yjefn3
|
YjeF N-terminal domain containing 3 |
| chr6_+_133552821 | 0.66 |
ENSRNOT00000006339
|
Dlk1
|
delta like non-canonical Notch ligand 1 |
| chr8_+_58870516 | 0.65 |
ENSRNOT00000033900
|
Gldn
|
gliomedin |
| chr20_+_6351458 | 0.64 |
ENSRNOT00000091731
|
Cdkn1a
|
cyclin-dependent kinase inhibitor 1A |
| chr6_+_51662224 | 0.64 |
ENSRNOT00000060006
|
Ccdc71l
|
coiled-coil domain containing 71-like |
| chr3_+_3788583 | 0.62 |
ENSRNOT00000084567
|
Gpsm1
|
G-protein signaling modulator 1 |
| chr5_-_137372524 | 0.60 |
ENSRNOT00000009061
|
Tmem125
|
transmembrane protein 125 |
| chr20_-_3439983 | 0.59 |
ENSRNOT00000080822
ENSRNOT00000001099 |
Ier3
|
immediate early response 3 |
| chr4_-_117490721 | 0.57 |
ENSRNOT00000021103
|
Nat8f3
|
N-acetyltransferase 8 (GCN5-related) family member 3 |
| chr5_-_79874671 | 0.56 |
ENSRNOT00000084563
|
Tnc
|
tenascin C |
| chr20_-_29511382 | 0.56 |
ENSRNOT00000085026
|
Ddit4
|
DNA-damage-inducible transcript 4 |
| chr6_-_109004598 | 0.56 |
ENSRNOT00000007790
|
Pgf
|
placental growth factor |
| chr1_+_88182585 | 0.55 |
ENSRNOT00000044145
|
Yif1b
|
Yip1 interacting factor homolog B, membrane trafficking protein |
| chr3_+_110975923 | 0.54 |
ENSRNOT00000016458
|
Gchfr
|
GTP cyclohydrolase I feedback regulator |
| chr7_-_143353925 | 0.53 |
ENSRNOT00000068533
|
Krt71
|
keratin 71 |
| chr1_+_87180624 | 0.51 |
ENSRNOT00000056933
ENSRNOT00000027987 |
LOC103689986
|
protein YIF1B |
| chr1_-_88881460 | 0.51 |
ENSRNOT00000028287
|
Hcst
|
hematopoietic cell signal transducer |
| chr14_+_34389991 | 0.51 |
ENSRNOT00000002953
|
Pdcl2
|
phosducin-like 2 |
| chr12_+_47698947 | 0.49 |
ENSRNOT00000001586
|
Trpv4
|
transient receptor potential cation channel, subfamily V, member 4 |
| chr1_-_190965115 | 0.49 |
ENSRNOT00000023483
|
AC103221.1
|
|
| chr7_+_117519075 | 0.49 |
ENSRNOT00000029768
|
Scx
|
scleraxis bHLH transcription factor |
| chr9_-_82699551 | 0.49 |
ENSRNOT00000020673
|
Obsl1
|
obscurin-like 1 |
| chr1_+_81373340 | 0.48 |
ENSRNOT00000026814
|
Zfp428
|
zinc finger protein 428 |
| chr3_-_58181971 | 0.45 |
ENSRNOT00000002076
|
Dlx2
|
distal-less homeobox 2 |
| chr9_+_70310932 | 0.45 |
ENSRNOT00000088268
|
LOC103690541
|
uncharacterized LOC103690541 |
| chr10_+_10889488 | 0.45 |
ENSRNOT00000071746
|
Ubald1
|
UBA-like domain containing 1 |
| chr1_+_261229347 | 0.44 |
ENSRNOT00000018485
|
Ubtd1
|
ubiquitin domain containing 1 |
| chr19_-_59502161 | 0.44 |
ENSRNOT00000075292
|
Irf2bp2
|
interferon regulatory factor 2 binding protein 2 |
| chr5_-_136762986 | 0.44 |
ENSRNOT00000026852
|
Artn
|
artemin |
| chr3_-_165360292 | 0.43 |
ENSRNOT00000065615
|
Nfatc2
|
nuclear factor of activated T-cells 2 |
| chr4_+_96831880 | 0.42 |
ENSRNOT00000068400
|
RSA-14-44
|
RSA-14-44 protein |
| chr8_+_118662335 | 0.41 |
ENSRNOT00000029755
|
Ngp
|
neutrophilic granule protein |
| chr6_-_135939534 | 0.41 |
ENSRNOT00000052237
|
Diras3
|
DIRAS family GTPase 3 |
| chr13_-_50549981 | 0.40 |
ENSRNOT00000003918
ENSRNOT00000080486 |
Golt1a
|
golgi transport 1A |
| chr11_+_47243342 | 0.40 |
ENSRNOT00000041116
|
Nfkbiz
|
NFKB inhibitor zeta |
| chr10_-_106976040 | 0.40 |
ENSRNOT00000003940
|
Socs3
|
suppressor of cytokine signaling 3 |
| chr2_-_210116038 | 0.40 |
ENSRNOT00000074950
|
LOC684509
|
similar to NADH-ubiquinone oxidoreductase B9 subunit (Complex I-B9) (CI-B9) |
| chr5_+_14890408 | 0.40 |
ENSRNOT00000033116
|
Sox17
|
SRY box 17 |
| chr16_-_64778486 | 0.39 |
ENSRNOT00000031701
|
Rnf122
|
ring finger protein 122 |
| chr1_+_8933831 | 0.39 |
ENSRNOT00000076049
ENSRNOT00000016215 |
Nmbr
|
neuromedin B receptor |
| chr1_-_166939541 | 0.38 |
ENSRNOT00000079675
|
Folr1
|
folate receptor 1 |
| chr4_-_7228675 | 0.38 |
ENSRNOT00000064386
|
Agap3
|
ArfGAP with GTPase domain, ankyrin repeat and PH domain 3 |
| chr7_-_12609868 | 0.38 |
ENSRNOT00000016396
|
Kiss1r
|
KISS1 receptor |
| chr2_+_187740531 | 0.38 |
ENSRNOT00000092653
|
Paqr6
|
progestin and adipoQ receptor family member 6 |
| chr4_-_56453563 | 0.38 |
ENSRNOT00000060362
|
Prrt4
|
proline-rich transmembrane protein 4 |
| chr20_+_13670066 | 0.37 |
ENSRNOT00000031400
|
LOC103694874
|
stromelysin-3 |
| chr7_-_12635943 | 0.37 |
ENSRNOT00000015029
|
Cfd
|
complement factor D |
| chr13_-_44345735 | 0.37 |
ENSRNOT00000005006
|
Tmem163
|
transmembrane protein 163 |
| chr7_-_122926336 | 0.37 |
ENSRNOT00000000205
|
Chadl
|
chondroadherin-like |
| chr2_-_207455258 | 0.36 |
ENSRNOT00000019349
|
Wnt2b
|
wingless-type MMTV integration site family, member 2B |
| chr7_-_70452675 | 0.36 |
ENSRNOT00000090498
|
AC114111.1
|
|
| chr17_-_44793927 | 0.36 |
ENSRNOT00000086309
|
Hist1h2bo
|
histone cluster 1 H2B family member o |
| chr3_-_123698072 | 0.35 |
ENSRNOT00000077819
|
RGD1311739
|
similar to RIKEN cDNA 1700037H04 |
| chr5_-_145377221 | 0.35 |
ENSRNOT00000019246
|
Gja4
|
gap junction protein, alpha 4 |
| chr20_+_31234493 | 0.35 |
ENSRNOT00000000675
|
Npffr1
|
neuropeptide FF receptor 1 |
| chr12_+_24651314 | 0.35 |
ENSRNOT00000077016
ENSRNOT00000071569 |
Vps37d
|
VPS37D, ESCRT-I subunit |
| chr3_-_161812243 | 0.35 |
ENSRNOT00000025238
ENSRNOT00000087646 |
Slc35c2
|
solute carrier family 35 member C2 |
| chr12_-_19167015 | 0.34 |
ENSRNOT00000001797
|
Gjc3
|
gap junction protein, gamma 3 |
| chr5_+_137371825 | 0.34 |
ENSRNOT00000072816
|
Tmem125
|
transmembrane protein 125 |
| chr4_-_157263890 | 0.34 |
ENSRNOT00000065416
|
Ptpn6
|
protein tyrosine phosphatase, non-receptor type 6 |
| chr7_-_117364322 | 0.34 |
ENSRNOT00000080724
|
Oplah
|
5-oxoprolinase (ATP-hydrolysing) |
| chr11_-_34142753 | 0.33 |
ENSRNOT00000002297
|
Cldn14
|
claudin 14 |
| chr10_-_62483342 | 0.33 |
ENSRNOT00000079956
|
LOC100912068
|
hypermethylated in cancer 1 protein-like |
| chr10_-_108196217 | 0.33 |
ENSRNOT00000075440
|
Cbx4
|
chromobox 4 |
| chr20_+_8165307 | 0.33 |
ENSRNOT00000000637
|
Pim1
|
Pim-1 proto-oncogene, serine/threonine kinase |
| chr4_+_7355574 | 0.33 |
ENSRNOT00000013800
|
Kcnh2
|
potassium voltage-gated channel subfamily H member 2 |
| chr7_+_141370491 | 0.33 |
ENSRNOT00000087662
|
Gpd1
|
glycerol-3-phosphate dehydrogenase 1 |
| chr6_+_135856218 | 0.33 |
ENSRNOT00000066715
|
RGD1560608
|
similar to novel protein |
| chr5_+_16845631 | 0.32 |
ENSRNOT00000047889
|
Chchd7
|
coiled-coil-helix-coiled-coil-helix domain containing 7 |
| chr19_+_25143428 | 0.32 |
ENSRNOT00000007535
|
Palm3
|
paralemmin 3 |
| chr14_-_59980586 | 0.32 |
ENSRNOT00000064713
|
LOC100361259
|
60S ribosomal protein L13-like |
| chr19_+_55246926 | 0.32 |
ENSRNOT00000017358
|
Il17c
|
interleukin 17C |
| chr2_-_227411964 | 0.32 |
ENSRNOT00000019931
|
Synpo2
|
synaptopodin 2 |
| chr11_-_33003021 | 0.32 |
ENSRNOT00000084134
|
Runx1
|
runt-related transcription factor 1 |
| chr1_-_222242644 | 0.32 |
ENSRNOT00000050891
|
Vegfb
|
vascular endothelial growth factor B |
| chr8_+_107699480 | 0.31 |
ENSRNOT00000048864
|
Nme9
|
NME/NM23 family member 9 |
| chr7_+_12764993 | 0.31 |
ENSRNOT00000017064
|
Grin3b
|
glutamate ionotropic receptor NMDA type subunit 3B |
| chr1_-_82279145 | 0.31 |
ENSRNOT00000057433
|
Cxcl17
|
C-X-C motif chemokine ligand 17 |
| chr2_+_206064394 | 0.31 |
ENSRNOT00000077739
|
Syt6
|
synaptotagmin 6 |
| chr3_+_109862117 | 0.31 |
ENSRNOT00000083351
ENSRNOT00000070912 |
Thbs1
|
thrombospondin 1 |
| chr10_-_29450644 | 0.31 |
ENSRNOT00000087937
|
Adra1b
|
adrenoceptor alpha 1B |
| chr1_+_101412736 | 0.30 |
ENSRNOT00000067468
|
Lhb
|
luteinizing hormone beta polypeptide |
| chr5_-_142845116 | 0.30 |
ENSRNOT00000065105
|
RGD1559909
|
RGD1559909 |
| chr7_-_142348232 | 0.30 |
ENSRNOT00000078848
|
Galnt6
|
polypeptide N-acetylgalactosaminyltransferase 6 |
| chr19_+_55094585 | 0.30 |
ENSRNOT00000068452
|
Zfpm1
|
zinc finger protein, multitype 1 |
| chr8_+_118378059 | 0.30 |
ENSRNOT00000043247
|
AABR07071482.1
|
|
| chr10_+_103438303 | 0.29 |
ENSRNOT00000085262
|
Cd300a
|
Cd300a molecule |
| chr10_-_88677055 | 0.29 |
ENSRNOT00000025590
|
Ghdc
|
GH3 domain containing |
| chr5_-_78285451 | 0.29 |
ENSRNOT00000019924
|
Rnf183
|
ring finger protein 183 |
| chr1_+_219390523 | 0.29 |
ENSRNOT00000054852
|
Gpr152
|
G protein-coupled receptor 152 |
| chr5_+_151436464 | 0.29 |
ENSRNOT00000012463
|
Map3k6
|
mitogen-activated protein kinase kinase kinase 6 |
| chr6_-_110904288 | 0.29 |
ENSRNOT00000014645
|
Irf2bpl
|
interferon regulatory factor 2 binding protein-like |
| chr1_+_213595240 | 0.29 |
ENSRNOT00000017137
|
Scgb1c1
|
secretoglobin, family 1C, member 1 |
| chr2_+_227657983 | 0.29 |
ENSRNOT00000021116
|
Prss12
|
protease, serine 12 |
| chr10_+_103874383 | 0.29 |
ENSRNOT00000038935
|
Otop2
|
otopetrin 2 |
| chr5_+_152290084 | 0.29 |
ENSRNOT00000089849
|
Aim1l
|
absent in melanoma 1-like |
| chr8_-_23014499 | 0.29 |
ENSRNOT00000017820
|
Ccdc151
|
coiled-coil domain containing 151 |
| chr3_+_15379109 | 0.28 |
ENSRNOT00000036495
|
Morn5
|
MORN repeat containing 5 |
| chr4_-_30556814 | 0.28 |
ENSRNOT00000012760
|
Pdk4
|
pyruvate dehydrogenase kinase 4 |
| chrX_-_69218526 | 0.28 |
ENSRNOT00000092321
ENSRNOT00000074071 ENSRNOT00000092571 |
Pja1
|
praja ring finger ubiquitin ligase 1 |
| chr7_+_71023976 | 0.28 |
ENSRNOT00000005679
|
Tac3
|
tachykinin 3 |
| chr6_-_33691301 | 0.28 |
ENSRNOT00000008008
|
Rhob
|
ras homolog family member B |
| chr5_-_147584038 | 0.27 |
ENSRNOT00000010983
|
Zbtb8a
|
zinc finger and BTB domain containing 8a |
| chr3_-_14538241 | 0.27 |
ENSRNOT00000025904
|
Stom
|
stomatin |
| chr4_+_7377563 | 0.27 |
ENSRNOT00000084826
|
Kcnh2
|
potassium voltage-gated channel subfamily H member 2 |
| chrX_-_155862363 | 0.27 |
ENSRNOT00000089847
|
Dkc1
|
dyskerin pseudouridine synthase 1 |
| chr6_-_128690741 | 0.27 |
ENSRNOT00000035826
|
Syne3
|
spectrin repeat containing, nuclear envelope family member 3 |
| chr15_+_75067297 | 0.27 |
ENSRNOT00000057931
|
LOC498555
|
similar to 60S acidic ribosomal protein P2 |
| chr10_+_4719713 | 0.27 |
ENSRNOT00000003412
|
Litaf
|
lipopolysaccharide-induced TNF factor |
| chr10_-_65334500 | 0.26 |
ENSRNOT00000012825
|
Dhrs13
|
dehydrogenase/reductase 13 |
| chrX_+_65226748 | 0.26 |
ENSRNOT00000076181
|
Msn
|
moesin |
| chr4_-_150244372 | 0.26 |
ENSRNOT00000047685
|
Ret
|
ret proto-oncogene |
| chr1_-_173764246 | 0.26 |
ENSRNOT00000019690
ENSRNOT00000086944 |
Lmo1
|
LIM domain only 1 |
| chr20_-_10013190 | 0.26 |
ENSRNOT00000084726
ENSRNOT00000089112 |
Rsph1
|
radial spoke head 1 homolog |
| chr19_+_56272162 | 0.26 |
ENSRNOT00000030399
|
Afg3l1
|
AFG3(ATPase family gene 3)-like 1 (S. cerevisiae) |
| chr9_+_10535340 | 0.25 |
ENSRNOT00000075408
|
Znrf4
|
zinc and ring finger 4 |
| chr10_+_104437648 | 0.25 |
ENSRNOT00000035001
|
AC130970.1
|
|
| chr1_-_101175570 | 0.25 |
ENSRNOT00000073918
|
Gfy
|
golgi-associated, olfactory signaling regulator |
| chr16_-_84939323 | 0.25 |
ENSRNOT00000022742
|
Myo16
|
myosin XVI |
| chr17_+_35677984 | 0.25 |
ENSRNOT00000024609
|
Uqcrfs1
|
ubiquinol-cytochrome c reductase, Rieske iron-sulfur polypeptide 1 |
| chr8_+_116307141 | 0.25 |
ENSRNOT00000037375
|
Rassf1
|
Ras association domain family member 1 |
| chr5_-_145423172 | 0.24 |
ENSRNOT00000081919
|
Gjb5
|
gap junction protein, beta 5 |
| chr19_+_24701049 | 0.24 |
ENSRNOT00000035890
|
Ndufb7
|
NADH:ubiquinone oxidoreductase subunit B7 |
| chr3_+_3389612 | 0.24 |
ENSRNOT00000041984
|
Rpl8
|
ribosomal protein L8 |
| chr10_+_105156632 | 0.24 |
ENSRNOT00000086288
|
Galr2
|
galanin receptor 2 |
| chr14_+_86751157 | 0.24 |
ENSRNOT00000067997
|
LOC100360491
|
60S ribosomal protein L13-like |
| chr5_+_59008933 | 0.24 |
ENSRNOT00000023060
|
Car9
|
carbonic anhydrase 9 |
| chr19_+_10596960 | 0.24 |
ENSRNOT00000021769
|
Ciapin1
|
cytokine induced apoptosis inhibitor 1 |
| chr3_+_159368273 | 0.24 |
ENSRNOT00000041688
|
Sgk2
|
serum/glucocorticoid regulated kinase 2 |
| chr5_-_147823232 | 0.24 |
ENSRNOT00000074345
|
Iqcc
|
IQ motif containing C |
| chr1_+_221872220 | 0.24 |
ENSRNOT00000028651
|
Nrxn2
|
neurexin 2 |
| chr12_+_22449985 | 0.24 |
ENSRNOT00000075951
|
Slc12a9
|
solute carrier family 12, member 9 |
| chr17_+_70684340 | 0.24 |
ENSRNOT00000051067
|
Pfkfb3
|
6-phosphofructo-2-kinase/fructose-2,6-biphosphatase 3 |
| chr13_-_51930972 | 0.24 |
ENSRNOT00000006969
|
Lgr6
|
leucine-rich repeat-containing G protein-coupled receptor 6 |
| chr9_+_97355924 | 0.24 |
ENSRNOT00000026558
|
Ackr3
|
atypical chemokine receptor 3 |
| chr20_-_5469966 | 0.23 |
ENSRNOT00000092362
|
Tapbp
|
TAP binding protein |
| chr8_-_111965889 | 0.23 |
ENSRNOT00000032376
|
Bfsp2
|
beaded filament structural protein 2 |
| chr15_+_7871497 | 0.23 |
ENSRNOT00000046879
|
Ube2e2
|
ubiquitin-conjugating enzyme E2E 2 |
| chr3_-_154627257 | 0.23 |
ENSRNOT00000018328
|
Tgm2
|
transglutaminase 2 |
| chr5_+_137189473 | 0.23 |
ENSRNOT00000056815
|
Hyi
|
hydroxypyruvate isomerase |
| chr4_-_170860225 | 0.23 |
ENSRNOT00000007577
|
Mgp
|
matrix Gla protein |
| chr1_+_84470829 | 0.22 |
ENSRNOT00000025472
|
Ttc9b
|
tetratricopeptide repeat domain 9B |
| chr7_-_2588686 | 0.22 |
ENSRNOT00000048848
|
Rbms2
|
RNA binding motif, single stranded interacting protein 2 |
| chr17_-_90071408 | 0.22 |
ENSRNOT00000071978
|
Pdss1
|
decaprenyl diphosphate synthase subunit 1 |
| chr18_-_29015552 | 0.22 |
ENSRNOT00000028713
|
Nrg2
|
neuregulin 2 |
| chr10_-_18063391 | 0.22 |
ENSRNOT00000072297
|
Fgf18
|
fibroblast growth factor 18 |
| chr5_-_57267002 | 0.22 |
ENSRNOT00000011455
|
Bag1
|
Bcl2 associated athanogene 1 |
| chr12_+_38965063 | 0.22 |
ENSRNOT00000074936
|
Morn3
|
MORN repeat containing 3 |
| chr3_-_111080705 | 0.22 |
ENSRNOT00000079339
|
Rhov
|
ras homolog family member V |
| chrX_+_110670119 | 0.22 |
ENSRNOT00000014811
ENSRNOT00000089579 |
LOC680663
|
hypothetical protein LOC680663 |
| chr1_-_221015929 | 0.22 |
ENSRNOT00000028137
|
Sipa1
|
signal-induced proliferation-associated 1 |
| chr10_+_16542882 | 0.22 |
ENSRNOT00000028146
|
Stc2
|
stanniocalcin 2 |
| chr9_-_10441834 | 0.22 |
ENSRNOT00000043704
|
Rpl36
|
ribosomal protein L36 |
| chr5_+_154522119 | 0.22 |
ENSRNOT00000072618
|
E2f2
|
E2F transcription factor 2 |
| chr1_+_81230612 | 0.22 |
ENSRNOT00000026489
|
Kcnn4
|
potassium calcium-activated channel subfamily N member 4 |
| chr17_+_13519130 | 0.22 |
ENSRNOT00000076794
|
Sema4d
|
semaphorin 4D |
| chr2_-_260115577 | 0.22 |
ENSRNOT00000065997
|
Rabggtb
|
Rab geranylgeranyltransferase, beta subunit |
| chr1_+_12006660 | 0.22 |
ENSRNOT00000093439
|
Mcc
|
colorectal mutant cancer protein |
| chr1_+_220353356 | 0.21 |
ENSRNOT00000080189
|
Cd248
|
CD248 molecule |
| chr14_-_7054548 | 0.21 |
ENSRNOT00000002973
|
Nudt9
|
nudix hydrolase 9 |
| chr3_-_155192806 | 0.21 |
ENSRNOT00000051343
|
RGD1563145
|
similar to 60S ribosomal protein L13 |
| chr3_+_2480232 | 0.21 |
ENSRNOT00000014489
|
Tprn
|
taperin |
| chr1_+_80321585 | 0.21 |
ENSRNOT00000022895
|
Ckm
|
creatine kinase, M-type |
| chr4_+_342302 | 0.21 |
ENSRNOT00000009233
|
Insig1
|
insulin induced gene 1 |
| chr14_-_11198194 | 0.21 |
ENSRNOT00000003083
|
Enoph1
|
enolase-phosphatase 1 |
| chr1_-_88826302 | 0.21 |
ENSRNOT00000028275
|
Lrfn3
|
leucine rich repeat and fibronectin type III domain containing 3 |
| chr6_+_1657331 | 0.21 |
ENSRNOT00000049672
ENSRNOT00000079864 |
Qpct
|
glutaminyl-peptide cyclotransferase |
| chr1_+_226091774 | 0.21 |
ENSRNOT00000027693
|
Fads3
|
fatty acid desaturase 3 |
| chr3_-_17081510 | 0.21 |
ENSRNOT00000063862
|
AABR07051562.1
|
|
| chr2_-_149088787 | 0.21 |
ENSRNOT00000064833
|
Clrn1
|
clarin 1 |
| chr14_+_83724933 | 0.21 |
ENSRNOT00000029848
|
Pla2g3
|
phospholipase A2, group III |
| chr1_+_221792221 | 0.21 |
ENSRNOT00000054828
|
Nrxn2
|
neurexin 2 |
| chr1_-_89329185 | 0.20 |
ENSRNOT00000078284
|
Cd22
|
CD22 molecule |
| chr14_+_91201730 | 0.20 |
ENSRNOT00000071558
|
Vwc2
|
von Willebrand factor C domain containing 2 |
| chr12_+_13102019 | 0.20 |
ENSRNOT00000092628
|
Rac1
|
ras-related C3 botulinum toxin substrate 1 |
| chr10_+_16970626 | 0.20 |
ENSRNOT00000005383
|
Dusp1
|
dual specificity phosphatase 1 |
| chr3_+_8982122 | 0.20 |
ENSRNOT00000024914
|
Ptpa
|
protein phosphatase 2 phosphatase activator |
| chr10_+_91830654 | 0.20 |
ENSRNOT00000005176
|
Wnt3
|
wingless-type MMTV integration site family, member 3 |
| chr6_-_126582034 | 0.20 |
ENSRNOT00000010656
ENSRNOT00000080829 |
Itpk1
|
inositol-tetrakisphosphate 1-kinase |
| chr19_-_25134055 | 0.20 |
ENSRNOT00000007519
|
Misp3
|
MISP family member 3 |
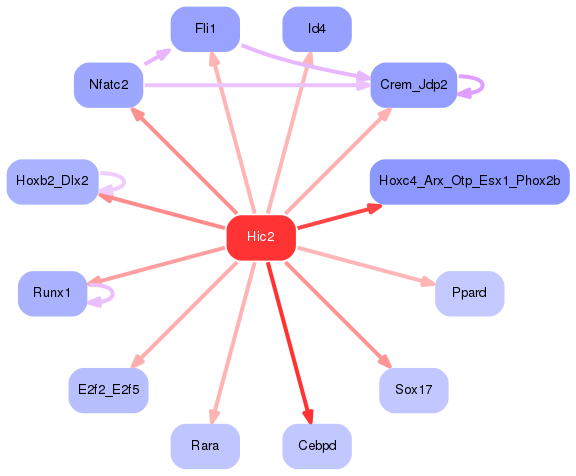
Network of associatons between targets according to the STRING database.

First level regulatory network of Hic2
Gene Ontology Analysis
Gene overrepresentation in biological process category:
| Log-likelihood per target | Total log-likelihood | Term | Description |
|---|---|---|---|
| 1.3 | 5.1 | GO:0002125 | maternal aggressive behavior(GO:0002125) |
| 0.3 | 1.3 | GO:0021586 | pons maturation(GO:0021586) |
| 0.3 | 1.1 | GO:0052314 | phytoalexin metabolic process(GO:0052314) |
| 0.2 | 0.7 | GO:0061146 | Peyer's patch morphogenesis(GO:0061146) |
| 0.2 | 1.1 | GO:0061366 | behavioral response to chemical pain(GO:0061366) behavioral response to formalin induced pain(GO:0061368) |
| 0.2 | 0.6 | GO:0097498 | endothelial tube lumen extension(GO:0097498) |
| 0.2 | 0.8 | GO:0070093 | negative regulation of glucagon secretion(GO:0070093) |
| 0.2 | 0.6 | GO:1902303 | negative regulation of potassium ion export(GO:1902303) |
| 0.2 | 0.4 | GO:0042662 | negative regulation of mesodermal cell fate specification(GO:0042662) |
| 0.2 | 1.0 | GO:0010037 | response to carbon dioxide(GO:0010037) |
| 0.2 | 1.1 | GO:0021759 | globus pallidus development(GO:0021759) |
| 0.2 | 0.5 | GO:0042539 | hypotonic salinity response(GO:0042539) cellular hypotonic salinity response(GO:0071477) chemokine (C-X-C motif) ligand 1 production(GO:0072566) regulation of chemokine (C-X-C motif) ligand 1 production(GO:2000338) |
| 0.2 | 0.5 | GO:0061056 | sclerotome development(GO:0061056) |
| 0.2 | 0.5 | GO:0021898 | regulation of transcription from RNA polymerase II promoter involved in forebrain neuron fate commitment(GO:0021882) commitment of multipotent stem cells to neuronal lineage in forebrain(GO:0021898) |
| 0.1 | 0.3 | GO:0003192 | mitral valve formation(GO:0003192) |
| 0.1 | 0.4 | GO:0060974 | cell migration involved in heart formation(GO:0060974) |
| 0.1 | 0.6 | GO:0060447 | bud outgrowth involved in lung branching(GO:0060447) |
| 0.1 | 0.4 | GO:0060478 | acrosomal vesicle exocytosis(GO:0060478) |
| 0.1 | 0.4 | GO:0061107 | seminal vesicle development(GO:0061107) |
| 0.1 | 0.3 | GO:0045819 | positive regulation of glycogen catabolic process(GO:0045819) |
| 0.1 | 0.4 | GO:1904953 | Wnt signaling pathway involved in midbrain dopaminergic neuron differentiation(GO:1904953) |
| 0.1 | 0.4 | GO:0031989 | bombesin receptor signaling pathway(GO:0031989) |
| 0.1 | 0.6 | GO:0060708 | spongiotrophoblast differentiation(GO:0060708) |
| 0.1 | 0.9 | GO:0060754 | positive regulation of mast cell chemotaxis(GO:0060754) |
| 0.1 | 0.4 | GO:0018199 | peptidyl-glutamine modification(GO:0018199) |
| 0.1 | 0.4 | GO:0060424 | foregut regionalization(GO:0060423) lung field specification(GO:0060424) lung induction(GO:0060492) |
| 0.1 | 0.2 | GO:0002397 | MHC class I protein complex assembly(GO:0002397) |
| 0.1 | 0.3 | GO:0036066 | protein O-linked fucosylation(GO:0036066) |
| 0.1 | 0.3 | GO:0006116 | NADH oxidation(GO:0006116) |
| 0.1 | 0.2 | GO:0042631 | cellular response to water deprivation(GO:0042631) |
| 0.1 | 0.1 | GO:0060764 | cell-cell signaling involved in mammary gland development(GO:0060764) |
| 0.1 | 0.3 | GO:2000872 | positive regulation of progesterone secretion(GO:2000872) |
| 0.1 | 2.4 | GO:0071157 | negative regulation of cell cycle arrest(GO:0071157) |
| 0.1 | 0.3 | GO:0010752 | negative regulation of antigen processing and presentation of peptide or polysaccharide antigen via MHC class II(GO:0002581) negative regulation of nitric oxide mediated signal transduction(GO:0010751) regulation of cGMP-mediated signaling(GO:0010752) negative regulation of endothelial cell chemotaxis(GO:2001027) |
| 0.1 | 0.3 | GO:0060101 | negative regulation of phagocytosis, engulfment(GO:0060101) |
| 0.1 | 0.4 | GO:1902608 | regulation of large conductance calcium-activated potassium channel activity(GO:1902606) positive regulation of large conductance calcium-activated potassium channel activity(GO:1902608) |
| 0.1 | 0.6 | GO:0060574 | intestinal epithelial cell maturation(GO:0060574) |
| 0.1 | 0.3 | GO:0090669 | telomerase RNA stabilization(GO:0090669) |
| 0.1 | 1.2 | GO:0045820 | negative regulation of glycolytic process(GO:0045820) |
| 0.1 | 0.2 | GO:0003219 | cardiac right ventricle formation(GO:0003219) |
| 0.1 | 0.3 | GO:0033277 | abortive mitotic cell cycle(GO:0033277) |
| 0.1 | 0.9 | GO:0015671 | oxygen transport(GO:0015671) |
| 0.1 | 0.3 | GO:1901491 | negative regulation of lymphangiogenesis(GO:1901491) |
| 0.1 | 0.4 | GO:0097116 | gephyrin clustering involved in postsynaptic density assembly(GO:0097116) |
| 0.1 | 0.6 | GO:1903054 | negative regulation of extracellular matrix organization(GO:1903054) |
| 0.1 | 0.3 | GO:0046951 | ketone body biosynthetic process(GO:0046951) |
| 0.1 | 0.3 | GO:0010510 | regulation of acetyl-CoA biosynthetic process from pyruvate(GO:0010510) |
| 0.1 | 0.1 | GO:0043400 | cortisol secretion(GO:0043400) regulation of cortisol secretion(GO:0051462) positive regulation of cortisol secretion(GO:0051464) |
| 0.1 | 0.1 | GO:0065001 | specification of axis polarity(GO:0065001) |
| 0.1 | 0.1 | GO:0039020 | pronephric nephron tubule development(GO:0039020) |
| 0.1 | 0.1 | GO:1902460 | regulation of mesenchymal stem cell proliferation(GO:1902460) positive regulation of mesenchymal stem cell proliferation(GO:1902462) |
| 0.1 | 0.3 | GO:0046013 | regulation of T cell homeostatic proliferation(GO:0046013) |
| 0.1 | 0.1 | GO:0002085 | inhibition of neuroepithelial cell differentiation(GO:0002085) negative regulation of auditory receptor cell differentiation(GO:0045608) |
| 0.1 | 0.5 | GO:0008616 | queuosine biosynthetic process(GO:0008616) queuosine metabolic process(GO:0046116) |
| 0.1 | 0.2 | GO:0048239 | negative regulation of DNA recombination at telomere(GO:0048239) regulation of DNA recombination at telomere(GO:0072695) |
| 0.1 | 0.2 | GO:1903198 | enzyme active site formation via L-cysteine sulfinic acid(GO:0018323) primary alcohol biosynthetic process(GO:0034309) cellular response to glyoxal(GO:0036471) TRAIL receptor biosynthetic process(GO:0045557) regulation of TRAIL receptor biosynthetic process(GO:0045560) glycolate biosynthetic process(GO:0046295) negative regulation of TRAIL-activated apoptotic signaling pathway(GO:1903122) regulation of pyrroline-5-carboxylate reductase activity(GO:1903167) positive regulation of pyrroline-5-carboxylate reductase activity(GO:1903168) regulation of tyrosine 3-monooxygenase activity(GO:1903176) positive regulation of tyrosine 3-monooxygenase activity(GO:1903178) L-dopa metabolic process(GO:1903184) L-dopa biosynthetic process(GO:1903185) glyoxal metabolic process(GO:1903189) regulation of L-dopa biosynthetic process(GO:1903195) positive regulation of L-dopa biosynthetic process(GO:1903197) regulation of L-dopa decarboxylase activity(GO:1903198) positive regulation of L-dopa decarboxylase activity(GO:1903200) regulation of cellular amino acid biosynthetic process(GO:2000282) positive regulation of cellular amino acid biosynthetic process(GO:2000284) |
| 0.1 | 0.3 | GO:0032020 | ISG15-protein conjugation(GO:0032020) |
| 0.1 | 0.1 | GO:1903659 | regulation of complement-dependent cytotoxicity(GO:1903659) |
| 0.1 | 0.2 | GO:0071895 | odontoblast differentiation(GO:0071895) dentinogenesis(GO:0097187) |
| 0.1 | 0.2 | GO:0003099 | positive regulation of the force of heart contraction by epinephrine-norepinephrine(GO:0001997) positive regulation of the force of heart contraction by chemical signal(GO:0003099) |
| 0.1 | 0.2 | GO:0009397 | folic acid-containing compound catabolic process(GO:0009397) pteridine-containing compound catabolic process(GO:0042560) |
| 0.1 | 0.2 | GO:1990108 | protein linear deubiquitination(GO:1990108) |
| 0.1 | 0.2 | GO:0048619 | embryonic hindgut morphogenesis(GO:0048619) |
| 0.1 | 0.2 | GO:1901187 | regulation of ephrin receptor signaling pathway(GO:1901187) |
| 0.1 | 0.2 | GO:0035105 | sterol regulatory element binding protein import into nucleus(GO:0035105) negative regulation of adipose tissue development(GO:1904178) |
| 0.1 | 0.3 | GO:0072244 | metanephric glomerular epithelium development(GO:0072244) |
| 0.1 | 0.2 | GO:0034085 | establishment of sister chromatid cohesion(GO:0034085) cohesin loading(GO:0071921) regulation of cohesin loading(GO:0071922) |
| 0.1 | 0.5 | GO:0045162 | clustering of voltage-gated sodium channels(GO:0045162) |
| 0.1 | 0.3 | GO:1902966 | regulation of protein localization to early endosome(GO:1902965) positive regulation of protein localization to early endosome(GO:1902966) |
| 0.1 | 0.2 | GO:0003253 | cardiac neural crest cell migration involved in outflow tract morphogenesis(GO:0003253) pulmonary myocardium development(GO:0003350) subthalamus development(GO:0021539) left lung development(GO:0060459) left lung morphogenesis(GO:0060460) |
| 0.1 | 0.5 | GO:0070389 | chaperone cofactor-dependent protein refolding(GO:0070389) |
| 0.0 | 0.1 | GO:0042323 | regulation of nucleoside transport(GO:0032242) negative regulation of neurotrophin production(GO:0032900) negative regulation of circadian sleep/wake cycle, non-REM sleep(GO:0042323) negative regulation of mucus secretion(GO:0070256) negative regulation of long term synaptic depression(GO:1900453) |
| 0.0 | 0.1 | GO:0048865 | endocardium morphogenesis(GO:0003160) stem cell fate commitment(GO:0048865) endocardium formation(GO:0060214) |
| 0.0 | 0.3 | GO:0008063 | Toll signaling pathway(GO:0008063) |
| 0.0 | 0.5 | GO:0071688 | striated muscle myosin thick filament assembly(GO:0071688) |
| 0.0 | 0.2 | GO:0002023 | reduction of food intake in response to dietary excess(GO:0002023) |
| 0.0 | 0.1 | GO:0021530 | spinal cord oligodendrocyte cell differentiation(GO:0021529) spinal cord oligodendrocyte cell fate specification(GO:0021530) |
| 0.0 | 0.5 | GO:2000138 | positive regulation of cell proliferation involved in heart morphogenesis(GO:2000138) |
| 0.0 | 1.4 | GO:0045746 | negative regulation of Notch signaling pathway(GO:0045746) |
| 0.0 | 0.1 | GO:0089718 | amino acid import across plasma membrane(GO:0089718) |
| 0.0 | 0.1 | GO:0010070 | zygote asymmetric cell division(GO:0010070) |
| 0.0 | 0.2 | GO:1904849 | positive regulation of cell chemotaxis to fibroblast growth factor(GO:1904849) positive regulation of endothelial cell chemotaxis to fibroblast growth factor(GO:2000546) |
| 0.0 | 0.5 | GO:0046543 | development of secondary female sexual characteristics(GO:0046543) |
| 0.0 | 0.2 | GO:0009181 | purine nucleoside diphosphate catabolic process(GO:0009137) purine ribonucleoside diphosphate catabolic process(GO:0009181) |
| 0.0 | 0.9 | GO:0010257 | NADH dehydrogenase complex assembly(GO:0010257) mitochondrial respiratory chain complex I assembly(GO:0032981) mitochondrial respiratory chain complex I biogenesis(GO:0097031) |
| 0.0 | 0.2 | GO:0072343 | pancreatic stellate cell proliferation(GO:0072343) regulation of pancreatic stellate cell proliferation(GO:2000229) |
| 0.0 | 0.3 | GO:2000288 | positive regulation of myoblast proliferation(GO:2000288) |
| 0.0 | 0.2 | GO:0070099 | regulation of chemokine-mediated signaling pathway(GO:0070099) |
| 0.0 | 0.2 | GO:0090611 | ubiquitin-independent protein catabolic process via the multivesicular body sorting pathway(GO:0090611) |
| 0.0 | 0.2 | GO:0032707 | negative regulation of interleukin-23 production(GO:0032707) |
| 0.0 | 0.1 | GO:0032430 | positive regulation of phospholipase A2 activity(GO:0032430) |
| 0.0 | 0.1 | GO:0046016 | late viral transcription(GO:0019086) positive regulation of transcription by glucose(GO:0046016) |
| 0.0 | 0.1 | GO:1903422 | negative regulation of synaptic vesicle recycling(GO:1903422) |
| 0.0 | 0.3 | GO:0090286 | cytoskeletal anchoring at nuclear membrane(GO:0090286) |
| 0.0 | 0.4 | GO:1900017 | positive regulation of cytokine production involved in inflammatory response(GO:1900017) |
| 0.0 | 0.2 | GO:1990086 | lens fiber cell apoptotic process(GO:1990086) |
| 0.0 | 0.1 | GO:0031446 | regulation of fast-twitch skeletal muscle fiber contraction(GO:0031446) positive regulation of fast-twitch skeletal muscle fiber contraction(GO:0031448) |
| 0.0 | 0.2 | GO:0019509 | L-methionine biosynthetic process from methylthioadenosine(GO:0019509) |
| 0.0 | 0.8 | GO:0001516 | prostaglandin biosynthetic process(GO:0001516) prostanoid biosynthetic process(GO:0046457) |
| 0.0 | 0.1 | GO:0006004 | fucose metabolic process(GO:0006004) |
| 0.0 | 0.1 | GO:0002148 | hypochlorous acid metabolic process(GO:0002148) hypochlorous acid biosynthetic process(GO:0002149) |
| 0.0 | 0.3 | GO:0007217 | tachykinin receptor signaling pathway(GO:0007217) |
| 0.0 | 0.4 | GO:0060033 | anatomical structure regression(GO:0060033) |
| 0.0 | 0.1 | GO:0035928 | rRNA import into mitochondrion(GO:0035928) |
| 0.0 | 0.1 | GO:0038163 | thrombopoietin-mediated signaling pathway(GO:0038163) |
| 0.0 | 0.1 | GO:0060431 | primary lung bud formation(GO:0060431) |
| 0.0 | 0.1 | GO:0009153 | purine deoxyribonucleotide biosynthetic process(GO:0009153) purine deoxyribonucleoside triphosphate biosynthetic process(GO:0009216) AMP salvage(GO:0044209) adenosine biosynthetic process(GO:0046086) |
| 0.0 | 0.3 | GO:1903748 | negative regulation of establishment of protein localization to mitochondrion(GO:1903748) |
| 0.0 | 0.1 | GO:0032218 | riboflavin transport(GO:0032218) |
| 0.0 | 0.1 | GO:0017187 | peptidyl-glutamic acid carboxylation(GO:0017187) protein carboxylation(GO:0018214) |
| 0.0 | 0.1 | GO:0036324 | vascular endothelial growth factor receptor-2 signaling pathway(GO:0036324) |
| 0.0 | 0.2 | GO:0010693 | negative regulation of alkaline phosphatase activity(GO:0010693) |
| 0.0 | 0.1 | GO:1902569 | regulation of activation of JAK2 kinase activity(GO:0010534) activation of JAK2 kinase activity(GO:0042977) negative regulation of activation of JAK2 kinase activity(GO:1902569) |
| 0.0 | 0.2 | GO:0014063 | negative regulation of serotonin secretion(GO:0014063) |
| 0.0 | 0.1 | GO:1903797 | positive regulation of inorganic anion transmembrane transport(GO:1903797) |
| 0.0 | 0.1 | GO:1990792 | response to glial cell derived neurotrophic factor(GO:1990790) cellular response to glial cell derived neurotrophic factor(GO:1990792) |
| 0.0 | 0.2 | GO:0060363 | cranial suture morphogenesis(GO:0060363) |
| 0.0 | 0.3 | GO:0044829 | positive regulation by host of viral genome replication(GO:0044829) |
| 0.0 | 0.2 | GO:1902951 | negative regulation of dendritic spine maintenance(GO:1902951) |
| 0.0 | 0.1 | GO:0090427 | activation of meiosis(GO:0090427) |
| 0.0 | 0.2 | GO:0010989 | negative regulation of low-density lipoprotein particle clearance(GO:0010989) negative regulation of Golgi to plasma membrane protein transport(GO:0042997) |
| 0.0 | 0.3 | GO:0034982 | mitochondrial protein processing(GO:0034982) |
| 0.0 | 0.1 | GO:0072144 | glomerular mesangial cell development(GO:0072144) |
| 0.0 | 0.2 | GO:0060591 | chondroblast differentiation(GO:0060591) |
| 0.0 | 0.1 | GO:0045919 | positive regulation of cytolysis(GO:0045919) |
| 0.0 | 0.1 | GO:0034316 | negative regulation of Arp2/3 complex-mediated actin nucleation(GO:0034316) |
| 0.0 | 0.1 | GO:0006420 | arginyl-tRNA aminoacylation(GO:0006420) |
| 0.0 | 0.4 | GO:0030574 | collagen catabolic process(GO:0030574) |
| 0.0 | 0.1 | GO:0015801 | aromatic amino acid transport(GO:0015801) |
| 0.0 | 0.1 | GO:0045743 | positive regulation of fibroblast growth factor receptor signaling pathway(GO:0045743) |
| 0.0 | 0.1 | GO:0070120 | ciliary neurotrophic factor-mediated signaling pathway(GO:0070120) |
| 0.0 | 0.2 | GO:1902414 | protein localization to cell junction(GO:1902414) |
| 0.0 | 0.0 | GO:0006975 | DNA damage induced protein phosphorylation(GO:0006975) |
| 0.0 | 0.2 | GO:0018344 | protein geranylgeranylation(GO:0018344) |
| 0.0 | 0.0 | GO:1905225 | response to thyrotropin-releasing hormone(GO:1905225) |
| 0.0 | 0.1 | GO:0009449 | gamma-aminobutyric acid biosynthetic process(GO:0009449) |
| 0.0 | 0.3 | GO:0010759 | positive regulation of macrophage chemotaxis(GO:0010759) |
| 0.0 | 0.2 | GO:0070307 | lens fiber cell development(GO:0070307) |
| 0.0 | 0.1 | GO:0060126 | somatotropin secreting cell differentiation(GO:0060126) |
| 0.0 | 0.1 | GO:0039663 | fusion of virus membrane with host plasma membrane(GO:0019064) membrane fusion involved in viral entry into host cell(GO:0039663) multi-organism membrane fusion(GO:0044800) |
| 0.0 | 0.1 | GO:0001579 | medium-chain fatty acid transport(GO:0001579) |
| 0.0 | 0.1 | GO:0048631 | regulation of skeletal muscle tissue growth(GO:0048631) |
| 0.0 | 0.0 | GO:0060375 | regulation of mast cell differentiation(GO:0060375) |
| 0.0 | 0.1 | GO:0006572 | tyrosine catabolic process(GO:0006572) |
| 0.0 | 0.4 | GO:1901741 | positive regulation of myoblast fusion(GO:1901741) |
| 0.0 | 0.3 | GO:0061154 | morphogenesis of an endothelium(GO:0003159) endothelial tube morphogenesis(GO:0061154) |
| 0.0 | 0.1 | GO:0045650 | negative regulation of macrophage differentiation(GO:0045650) |
| 0.0 | 0.1 | GO:0003199 | endocardial cushion to mesenchymal transition involved in heart valve formation(GO:0003199) notochord formation(GO:0014028) |
| 0.0 | 0.2 | GO:0034370 | triglyceride-rich lipoprotein particle remodeling(GO:0034370) very-low-density lipoprotein particle remodeling(GO:0034372) |
| 0.0 | 0.0 | GO:0035622 | intrahepatic bile duct development(GO:0035622) |
| 0.0 | 0.2 | GO:0051599 | response to hydrostatic pressure(GO:0051599) |
| 0.0 | 0.1 | GO:0050862 | positive regulation of T cell receptor signaling pathway(GO:0050862) |
| 0.0 | 0.2 | GO:0019372 | lipoxygenase pathway(GO:0019372) |
| 0.0 | 0.0 | GO:0030908 | intein-mediated protein splicing(GO:0016539) protein splicing(GO:0030908) |
| 0.0 | 0.2 | GO:0006957 | complement activation, alternative pathway(GO:0006957) |
| 0.0 | 0.1 | GO:1903121 | regulation of TRAIL-activated apoptotic signaling pathway(GO:1903121) |
| 0.0 | 0.1 | GO:0033564 | anterior/posterior axon guidance(GO:0033564) |
| 0.0 | 0.1 | GO:0023021 | termination of signal transduction(GO:0023021) |
| 0.0 | 0.0 | GO:0014045 | establishment of endothelial blood-brain barrier(GO:0014045) central nervous system vasculogenesis(GO:0022009) |
| 0.0 | 0.1 | GO:0051105 | regulation of DNA ligation(GO:0051105) positive regulation of DNA ligation(GO:0051106) protein localization to site of double-strand break(GO:1990166) |
| 0.0 | 0.1 | GO:2000035 | regulation of stem cell division(GO:2000035) |
| 0.0 | 0.1 | GO:0090205 | positive regulation of cholesterol biosynthetic process(GO:0045542) positive regulation of cholesterol metabolic process(GO:0090205) |
| 0.0 | 0.1 | GO:0043152 | induction of bacterial agglutination(GO:0043152) |
| 0.0 | 0.1 | GO:0061303 | cornea development in camera-type eye(GO:0061303) |
| 0.0 | 0.0 | GO:0071879 | positive regulation of adrenergic receptor signaling pathway(GO:0071879) |
| 0.0 | 0.3 | GO:0043517 | positive regulation of DNA damage response, signal transduction by p53 class mediator(GO:0043517) |
| 0.0 | 0.4 | GO:1903963 | arachidonic acid secretion(GO:0050482) arachidonate transport(GO:1903963) |
| 0.0 | 0.0 | GO:0017055 | negative regulation of RNA polymerase II transcriptional preinitiation complex assembly(GO:0017055) |
| 0.0 | 0.2 | GO:0015868 | purine nucleotide transport(GO:0015865) purine ribonucleotide transport(GO:0015868) |
| 0.0 | 0.1 | GO:1990173 | protein localization to nuclear body(GO:1903405) positive regulation of establishment of protein localization to telomere(GO:1904851) protein localization to Cajal body(GO:1904867) regulation of protein localization to Cajal body(GO:1904869) positive regulation of protein localization to Cajal body(GO:1904871) protein localization to nucleoplasm(GO:1990173) |
| 0.0 | 0.2 | GO:0043537 | negative regulation of blood vessel endothelial cell migration(GO:0043537) |
| 0.0 | 0.3 | GO:0040015 | negative regulation of multicellular organism growth(GO:0040015) |
| 0.0 | 0.1 | GO:0048478 | replication fork protection(GO:0048478) |
| 0.0 | 0.3 | GO:0007194 | negative regulation of adenylate cyclase activity(GO:0007194) |
| 0.0 | 0.2 | GO:0051044 | positive regulation of membrane protein ectodomain proteolysis(GO:0051044) |
| 0.0 | 0.0 | GO:0034441 | plasma lipoprotein particle oxidation(GO:0034441) regulation of lipoprotein oxidation(GO:0034442) negative regulation of lipoprotein oxidation(GO:0034443) |
| 0.0 | 0.8 | GO:0045669 | positive regulation of osteoblast differentiation(GO:0045669) |
| 0.0 | 0.0 | GO:0006532 | fumarate metabolic process(GO:0006106) aspartate biosynthetic process(GO:0006532) aspartate catabolic process(GO:0006533) |
| 0.0 | 0.4 | GO:0045109 | intermediate filament organization(GO:0045109) |
| 0.0 | 0.3 | GO:0051205 | protein insertion into membrane(GO:0051205) |
| 0.0 | 0.2 | GO:0071850 | mitotic cell cycle arrest(GO:0071850) |
| 0.0 | 0.2 | GO:0030150 | protein import into mitochondrial matrix(GO:0030150) |
| 0.0 | 0.1 | GO:0050957 | equilibrioception(GO:0050957) |
| 0.0 | 0.2 | GO:0035855 | megakaryocyte development(GO:0035855) |
| 0.0 | 0.2 | GO:0021924 | cell proliferation in hindbrain(GO:0021534) cell proliferation in external granule layer(GO:0021924) cerebellar granule cell precursor proliferation(GO:0021930) |
| 0.0 | 0.1 | GO:0005981 | regulation of glycogen catabolic process(GO:0005981) |
| 0.0 | 0.0 | GO:0060973 | cell migration involved in heart development(GO:0060973) |
| 0.0 | 0.0 | GO:0060741 | prostate gland stromal morphogenesis(GO:0060741) |
| 0.0 | 0.1 | GO:0000066 | mitochondrial ornithine transport(GO:0000066) L-ornithine transmembrane transport(GO:1903352) |
| 0.0 | 0.0 | GO:0002949 | tRNA threonylcarbamoyladenosine modification(GO:0002949) |
| 0.0 | 0.3 | GO:0097499 | protein localization to nonmotile primary cilium(GO:0097499) |
| 0.0 | 0.2 | GO:0035414 | negative regulation of catenin import into nucleus(GO:0035414) |
| 0.0 | 0.1 | GO:0071475 | cellular hyperosmotic salinity response(GO:0071475) |
| 0.0 | 0.0 | GO:0060157 | urinary bladder development(GO:0060157) |
| 0.0 | 0.1 | GO:0042738 | exogenous drug catabolic process(GO:0042738) |
| 0.0 | 0.3 | GO:0030823 | regulation of cGMP metabolic process(GO:0030823) |
| 0.0 | 0.1 | GO:0070535 | histone H2A K63-linked ubiquitination(GO:0070535) |
| 0.0 | 0.1 | GO:0030174 | regulation of DNA-dependent DNA replication initiation(GO:0030174) |
| 0.0 | 0.2 | GO:0036158 | outer dynein arm assembly(GO:0036158) |
| 0.0 | 0.1 | GO:0090086 | negative regulation of protein deubiquitination(GO:0090086) |
| 0.0 | 0.1 | GO:0045721 | negative regulation of gluconeogenesis(GO:0045721) |
| 0.0 | 0.1 | GO:1904528 | positive regulation of microtubule binding(GO:1904528) |
| 0.0 | 0.1 | GO:0035747 | natural killer cell chemotaxis(GO:0035747) regulation of natural killer cell chemotaxis(GO:2000501) positive regulation of natural killer cell chemotaxis(GO:2000503) |
| 0.0 | 0.0 | GO:0046103 | inosine biosynthetic process(GO:0046103) |
| 0.0 | 0.3 | GO:0001702 | gastrulation with mouth forming second(GO:0001702) |
| 0.0 | 0.1 | GO:2000234 | positive regulation of ribosome biogenesis(GO:0090070) positive regulation of rRNA processing(GO:2000234) |
| 0.0 | 0.1 | GO:0043587 | tongue morphogenesis(GO:0043587) |
| 0.0 | 0.2 | GO:0009299 | mRNA transcription(GO:0009299) |
| 0.0 | 0.3 | GO:0060325 | face morphogenesis(GO:0060325) |
| 0.0 | 0.1 | GO:0048671 | negative regulation of collateral sprouting(GO:0048671) |
| 0.0 | 0.2 | GO:0042036 | negative regulation of cytokine biosynthetic process(GO:0042036) |
| 0.0 | 0.1 | GO:0006689 | ganglioside catabolic process(GO:0006689) |
| 0.0 | 0.2 | GO:0034498 | early endosome to Golgi transport(GO:0034498) |
| 0.0 | 0.2 | GO:1901663 | ubiquinone biosynthetic process(GO:0006744) quinone biosynthetic process(GO:1901663) |
| 0.0 | 0.1 | GO:0043649 | dicarboxylic acid catabolic process(GO:0043649) |
| 0.0 | 0.1 | GO:0032511 | late endosome to vacuole transport via multivesicular body sorting pathway(GO:0032511) |
| 0.0 | 0.2 | GO:0032516 | positive regulation of phosphoprotein phosphatase activity(GO:0032516) |
| 0.0 | 0.0 | GO:0098886 | modification of dendritic spine(GO:0098886) |
| 0.0 | 0.1 | GO:0002669 | positive regulation of T cell anergy(GO:0002669) positive regulation of lymphocyte anergy(GO:0002913) |
| 0.0 | 0.1 | GO:0030206 | chondroitin sulfate biosynthetic process(GO:0030206) |
| 0.0 | 0.1 | GO:0038063 | collagen-activated tyrosine kinase receptor signaling pathway(GO:0038063) |
Gene overrepresentation in cellular component category:
| Log-likelihood per target | Total log-likelihood | Term | Description |
|---|---|---|---|
| 0.4 | 1.3 | GO:0016533 | cyclin-dependent protein kinase 5 holoenzyme complex(GO:0016533) |
| 0.2 | 0.6 | GO:0070557 | PCNA-p21 complex(GO:0070557) |
| 0.1 | 1.1 | GO:0033162 | melanosome membrane(GO:0033162) chitosome(GO:0045009) |
| 0.1 | 0.9 | GO:0005833 | hemoglobin complex(GO:0005833) |
| 0.1 | 0.3 | GO:0005745 | m-AAA complex(GO:0005745) |
| 0.1 | 0.8 | GO:0005641 | nuclear envelope lumen(GO:0005641) |
| 0.1 | 0.5 | GO:1990393 | 3M complex(GO:1990393) |
| 0.1 | 0.2 | GO:1990836 | lysosomal matrix(GO:1990836) |
| 0.1 | 0.2 | GO:0032937 | SREBP-SCAP-Insig complex(GO:0032937) |
| 0.1 | 0.2 | GO:0005853 | eukaryotic translation elongation factor 1 complex(GO:0005853) |
| 0.1 | 0.2 | GO:1902560 | GMP reductase complex(GO:1902560) |
| 0.1 | 0.2 | GO:0046691 | intracellular canaliculus(GO:0046691) |
| 0.1 | 0.5 | GO:0000813 | ESCRT I complex(GO:0000813) |
| 0.1 | 0.2 | GO:0005968 | Rab-protein geranylgeranyltransferase complex(GO:0005968) |
| 0.1 | 0.3 | GO:0090661 | box H/ACA telomerase RNP complex(GO:0090661) |
| 0.1 | 1.0 | GO:0005922 | connexon complex(GO:0005922) |
| 0.0 | 0.2 | GO:0045298 | tubulin complex(GO:0045298) |
| 0.0 | 0.3 | GO:0034992 | microtubule organizing center attachment site(GO:0034992) LINC complex(GO:0034993) |
| 0.0 | 0.1 | GO:1990032 | parallel fiber(GO:1990032) |
| 0.0 | 0.8 | GO:0005614 | interstitial matrix(GO:0005614) |
| 0.0 | 0.3 | GO:0005577 | fibrinogen complex(GO:0005577) |
| 0.0 | 0.3 | GO:0098651 | basement membrane collagen trimer(GO:0098651) |
| 0.0 | 0.2 | GO:0071797 | LUBAC complex(GO:0071797) |
| 0.0 | 0.3 | GO:0042105 | alpha-beta T cell receptor complex(GO:0042105) |
| 0.0 | 0.2 | GO:0042825 | TAP complex(GO:0042825) |
| 0.0 | 0.2 | GO:0042719 | mitochondrial intermembrane space protein transporter complex(GO:0042719) |
| 0.0 | 0.5 | GO:0031362 | anchored component of external side of plasma membrane(GO:0031362) |
| 0.0 | 0.2 | GO:0030870 | Mre11 complex(GO:0030870) |
| 0.0 | 0.4 | GO:0072687 | meiotic spindle(GO:0072687) |
| 0.0 | 0.1 | GO:0097058 | CRLF-CLCF1 complex(GO:0097058) |
| 0.0 | 0.3 | GO:0031143 | pseudopodium(GO:0031143) |
| 0.0 | 0.3 | GO:0071439 | clathrin complex(GO:0071439) |
| 0.0 | 1.7 | GO:0031902 | late endosome membrane(GO:0031902) |
| 0.0 | 0.2 | GO:0032584 | growth cone membrane(GO:0032584) |
| 0.0 | 0.1 | GO:1990130 | Iml1 complex(GO:1990130) |
| 0.0 | 0.1 | GO:0043564 | Ku70:Ku80 complex(GO:0043564) |
| 0.0 | 0.2 | GO:0044300 | cerebellar mossy fiber(GO:0044300) |
| 0.0 | 0.3 | GO:0005652 | nuclear lamina(GO:0005652) |
| 0.0 | 0.1 | GO:0034715 | pICln-Sm protein complex(GO:0034715) |
| 0.0 | 0.2 | GO:0005744 | mitochondrial inner membrane presequence translocase complex(GO:0005744) |
| 0.0 | 0.2 | GO:0005750 | mitochondrial respiratory chain complex III(GO:0005750) |
| 0.0 | 0.3 | GO:0071565 | nBAF complex(GO:0071565) |
| 0.0 | 0.1 | GO:0032280 | symmetric synapse(GO:0032280) |
| 0.0 | 0.3 | GO:0017146 | NMDA selective glutamate receptor complex(GO:0017146) |
| 0.0 | 0.3 | GO:0035102 | PRC1 complex(GO:0035102) |
| 0.0 | 0.0 | GO:0097444 | spine apparatus(GO:0097444) |
| 0.0 | 0.3 | GO:0031232 | extrinsic component of external side of plasma membrane(GO:0031232) |
| 0.0 | 0.1 | GO:0097513 | myosin II filament(GO:0097513) |
| 0.0 | 0.3 | GO:0043083 | synaptic cleft(GO:0043083) |
| 0.0 | 0.1 | GO:0030906 | retromer, cargo-selective complex(GO:0030906) |
| 0.0 | 0.1 | GO:0035189 | Rb-E2F complex(GO:0035189) |
| 0.0 | 0.2 | GO:0097433 | dense body(GO:0097433) |
| 0.0 | 0.2 | GO:0030877 | beta-catenin destruction complex(GO:0030877) |
| 0.0 | 0.9 | GO:0045271 | mitochondrial respiratory chain complex I(GO:0005747) NADH dehydrogenase complex(GO:0030964) respiratory chain complex I(GO:0045271) |
| 0.0 | 0.1 | GO:0070110 | ciliary neurotrophic factor receptor complex(GO:0070110) |
| 0.0 | 0.7 | GO:0030134 | ER to Golgi transport vesicle(GO:0030134) |
| 0.0 | 0.1 | GO:0009331 | glycerol-3-phosphate dehydrogenase complex(GO:0009331) |
| 0.0 | 0.2 | GO:0044327 | dendritic spine head(GO:0044327) |
| 0.0 | 0.1 | GO:0030485 | smooth muscle contractile fiber(GO:0030485) |
| 0.0 | 0.5 | GO:0042629 | mast cell granule(GO:0042629) |
| 0.0 | 2.1 | GO:0043195 | terminal bouton(GO:0043195) |
| 0.0 | 0.1 | GO:0016589 | NURF complex(GO:0016589) |
| 0.0 | 0.1 | GO:0001533 | cornified envelope(GO:0001533) |
| 0.0 | 0.6 | GO:0045095 | keratin filament(GO:0045095) |
| 0.0 | 0.8 | GO:0005581 | collagen trimer(GO:0005581) |
| 0.0 | 0.2 | GO:0060091 | kinocilium(GO:0060091) |
| 0.0 | 0.6 | GO:0032154 | cleavage furrow(GO:0032154) cell surface furrow(GO:0097610) |
| 0.0 | 0.1 | GO:0045180 | basal cortex(GO:0045180) |
| 0.0 | 0.1 | GO:0042587 | glycogen granule(GO:0042587) |
| 0.0 | 0.2 | GO:0097038 | perinuclear endoplasmic reticulum(GO:0097038) |
| 0.0 | 1.3 | GO:0030863 | cortical cytoskeleton(GO:0030863) |
| 0.0 | 0.0 | GO:0031308 | intrinsic component of nuclear outer membrane(GO:0031308) integral component of nuclear outer membrane(GO:0031309) |
| 0.0 | 0.2 | GO:0098563 | integral component of synaptic vesicle membrane(GO:0030285) intrinsic component of synaptic vesicle membrane(GO:0098563) |
| 0.0 | 1.0 | GO:0022625 | cytosolic large ribosomal subunit(GO:0022625) |
| 0.0 | 0.1 | GO:0002199 | zona pellucida receptor complex(GO:0002199) |
| 0.0 | 0.1 | GO:0031298 | replication fork protection complex(GO:0031298) |
| 0.0 | 0.2 | GO:0034364 | high-density lipoprotein particle(GO:0034364) |
Gene overrepresentation in molecular function category:
| Log-likelihood per target | Total log-likelihood | Term | Description |
|---|---|---|---|
| 1.0 | 3.0 | GO:0031893 | vasopressin receptor binding(GO:0031893) |
| 0.4 | 1.4 | GO:0005030 | neurotrophin receptor activity(GO:0005030) |
| 0.3 | 0.8 | GO:0050220 | prostaglandin-E synthase activity(GO:0050220) |
| 0.2 | 0.6 | GO:0019912 | cyclin-dependent protein kinase activating kinase activity(GO:0019912) |
| 0.2 | 1.1 | GO:0016714 | oxidoreductase activity, acting on paired donors, with incorporation or reduction of molecular oxygen, reduced pteridine as one donor, and incorporation of one atom of oxygen(GO:0016714) |
| 0.1 | 0.4 | GO:0004946 | bombesin receptor activity(GO:0004946) |
| 0.1 | 0.3 | GO:0017168 | 5-oxoprolinase (ATP-hydrolyzing) activity(GO:0017168) |
| 0.1 | 2.8 | GO:0005184 | neuropeptide hormone activity(GO:0005184) |
| 0.1 | 0.8 | GO:0004966 | galanin receptor activity(GO:0004966) |
| 0.1 | 0.3 | GO:0042296 | ISG15 transferase activity(GO:0042296) |
| 0.1 | 0.3 | GO:0004937 | alpha1-adrenergic receptor activity(GO:0004937) |
| 0.1 | 0.4 | GO:0051870 | methotrexate binding(GO:0051870) |
| 0.1 | 1.0 | GO:0005172 | vascular endothelial growth factor receptor binding(GO:0005172) |
| 0.1 | 0.9 | GO:0005344 | oxygen transporter activity(GO:0005344) |
| 0.1 | 0.3 | GO:0004368 | glycerol-3-phosphate dehydrogenase activity(GO:0004368) |
| 0.1 | 0.8 | GO:0055131 | C3HC4-type RING finger domain binding(GO:0055131) |
| 0.1 | 0.2 | GO:0016492 | G-protein coupled neurotensin receptor activity(GO:0016492) |
| 0.1 | 1.0 | GO:0001206 | transcriptional repressor activity, RNA polymerase II distal enhancer sequence-specific binding(GO:0001206) |
| 0.1 | 0.5 | GO:0008479 | queuine tRNA-ribosyltransferase activity(GO:0008479) |
| 0.1 | 0.2 | GO:0004663 | Rab geranylgeranyltransferase activity(GO:0004663) |
| 0.1 | 0.3 | GO:0004740 | pyruvate dehydrogenase (acetyl-transferring) kinase activity(GO:0004740) |
| 0.1 | 0.6 | GO:0045545 | syndecan binding(GO:0045545) |
| 0.1 | 0.2 | GO:0008330 | protein tyrosine/threonine phosphatase activity(GO:0008330) |
| 0.1 | 0.2 | GO:1902379 | chemoattractant activity involved in axon guidance(GO:1902379) |
| 0.1 | 0.4 | GO:0097109 | neuroligin family protein binding(GO:0097109) |
| 0.1 | 0.2 | GO:0036470 | tyrosine 3-monooxygenase activator activity(GO:0036470) L-dopa decarboxylase activator activity(GO:0036478) |
| 0.1 | 0.3 | GO:0070052 | collagen V binding(GO:0070052) |
| 0.1 | 0.2 | GO:0016657 | GMP reductase activity(GO:0003920) oxidoreductase activity, acting on NAD(P)H, nitrogenous group as acceptor(GO:0016657) |
| 0.1 | 0.2 | GO:0016509 | long-chain-enoyl-CoA hydratase activity(GO:0016508) long-chain-3-hydroxyacyl-CoA dehydrogenase activity(GO:0016509) |
| 0.1 | 0.2 | GO:0004939 | beta-adrenergic receptor activity(GO:0004939) |
| 0.1 | 0.8 | GO:0005092 | GDP-dissociation inhibitor activity(GO:0005092) |
| 0.1 | 0.5 | GO:0086080 | protein binding involved in heterotypic cell-cell adhesion(GO:0086080) |
| 0.1 | 0.2 | GO:1990460 | leptin receptor binding(GO:1990460) |
| 0.0 | 0.4 | GO:0022833 | mechanically-gated ion channel activity(GO:0008381) mechanically gated channel activity(GO:0022833) |
| 0.0 | 0.2 | GO:1990932 | 5.8S rRNA binding(GO:1990932) |
| 0.0 | 0.7 | GO:0051371 | muscle alpha-actinin binding(GO:0051371) |
| 0.0 | 0.1 | GO:0032810 | sterol response element binding(GO:0032810) |
| 0.0 | 0.2 | GO:0030297 | transmembrane receptor protein tyrosine kinase activator activity(GO:0030297) |
| 0.0 | 0.2 | GO:0099609 | microtubule lateral binding(GO:0099609) |
| 0.0 | 0.2 | GO:0042610 | CD8 receptor binding(GO:0042610) |
| 0.0 | 0.2 | GO:0005111 | type 1 fibroblast growth factor receptor binding(GO:0005105) type 2 fibroblast growth factor receptor binding(GO:0005111) |
| 0.0 | 0.2 | GO:0086089 | voltage-gated potassium channel activity involved in atrial cardiac muscle cell action potential repolarization(GO:0086089) |
| 0.0 | 1.4 | GO:0043539 | protein serine/threonine kinase activator activity(GO:0043539) |
| 0.0 | 0.4 | GO:0051022 | Rho GDP-dissociation inhibitor binding(GO:0051022) |
| 0.0 | 0.2 | GO:0047631 | adenosine-diphosphatase activity(GO:0043262) ADP-ribose diphosphatase activity(GO:0047631) |
| 0.0 | 0.1 | GO:0047057 | oxidoreductase activity, acting on the CH-OH group of donors, disulfide as acceptor(GO:0016900) vitamin-K-epoxide reductase (warfarin-sensitive) activity(GO:0047057) |
| 0.0 | 0.3 | GO:0008429 | phosphatidylethanolamine binding(GO:0008429) |
| 0.0 | 0.2 | GO:0046978 | TAP binding(GO:0046977) TAP1 binding(GO:0046978) TAP2 binding(GO:0046979) |
| 0.0 | 0.2 | GO:0034186 | apolipoprotein A-I binding(GO:0034186) |
| 0.0 | 0.3 | GO:0003720 | telomerase activity(GO:0003720) RNA-directed DNA polymerase activity(GO:0003964) |
| 0.0 | 0.1 | GO:0033906 | hyaluronoglucuronidase activity(GO:0033906) |
| 0.0 | 0.3 | GO:0019198 | transmembrane receptor protein tyrosine phosphatase activity(GO:0005001) transmembrane receptor protein phosphatase activity(GO:0019198) |
| 0.0 | 0.8 | GO:0015106 | bicarbonate transmembrane transporter activity(GO:0015106) |
| 0.0 | 0.1 | GO:0004792 | thiosulfate sulfurtransferase activity(GO:0004792) |
| 0.0 | 0.1 | GO:0004668 | protein-arginine deiminase activity(GO:0004668) |
| 0.0 | 0.1 | GO:0032217 | riboflavin transporter activity(GO:0032217) |
| 0.0 | 0.2 | GO:0046912 | transferase activity, transferring acyl groups, acyl groups converted into alkyl on transfer(GO:0046912) |
| 0.0 | 0.1 | GO:0005006 | epidermal growth factor-activated receptor activity(GO:0005006) |
| 0.0 | 0.6 | GO:0016854 | racemase and epimerase activity(GO:0016854) |
| 0.0 | 0.2 | GO:0008121 | ubiquinol-cytochrome-c reductase activity(GO:0008121) oxidoreductase activity, acting on diphenols and related substances as donors, cytochrome as acceptor(GO:0016681) |
| 0.0 | 0.1 | GO:0016833 | oxo-acid-lyase activity(GO:0016833) |
| 0.0 | 0.1 | GO:0032795 | heterotrimeric G-protein binding(GO:0032795) |
| 0.0 | 0.2 | GO:0008430 | selenium binding(GO:0008430) |
| 0.0 | 0.2 | GO:0046790 | virion binding(GO:0046790) |
| 0.0 | 0.1 | GO:0032564 | dATP binding(GO:0032564) |
| 0.0 | 0.1 | GO:0004814 | arginine-tRNA ligase activity(GO:0004814) |
| 0.0 | 0.3 | GO:0004653 | polypeptide N-acetylgalactosaminyltransferase activity(GO:0004653) |
| 0.0 | 0.1 | GO:0071936 | coreceptor activity involved in Wnt signaling pathway(GO:0071936) |
| 0.0 | 0.1 | GO:0005163 | nerve growth factor receptor binding(GO:0005163) |
| 0.0 | 0.2 | GO:0016494 | C-X-C chemokine receptor activity(GO:0016494) |
| 0.0 | 0.2 | GO:0003810 | protein-glutamine gamma-glutamyltransferase activity(GO:0003810) |
| 0.0 | 0.1 | GO:0008427 | calcium-dependent protein kinase inhibitor activity(GO:0008427) |
| 0.0 | 0.3 | GO:0043024 | ribosomal small subunit binding(GO:0043024) |
| 0.0 | 0.2 | GO:0015450 | protein channel activity(GO:0015266) P-P-bond-hydrolysis-driven protein transmembrane transporter activity(GO:0015450) |
| 0.0 | 0.2 | GO:0004111 | creatine kinase activity(GO:0004111) |
| 0.0 | 0.1 | GO:0004969 | histamine receptor activity(GO:0004969) |
| 0.0 | 0.5 | GO:0010485 | H4 histone acetyltransferase activity(GO:0010485) |
| 0.0 | 0.1 | GO:0004351 | glutamate decarboxylase activity(GO:0004351) |
| 0.0 | 0.2 | GO:0098505 | G-rich strand telomeric DNA binding(GO:0098505) |
| 0.0 | 0.1 | GO:0033142 | progesterone receptor binding(GO:0033142) |
| 0.0 | 0.1 | GO:0005042 | netrin receptor activity(GO:0005042) |
| 0.0 | 0.2 | GO:0016861 | intramolecular oxidoreductase activity, interconverting aldoses and ketoses(GO:0016861) |
| 0.0 | 0.1 | GO:0015173 | aromatic amino acid transmembrane transporter activity(GO:0015173) thyroid hormone transmembrane transporter activity(GO:0015349) |
| 0.0 | 0.4 | GO:0008253 | 5'-nucleotidase activity(GO:0008253) |
| 0.0 | 0.2 | GO:0051766 | inositol trisphosphate kinase activity(GO:0051766) |
| 0.0 | 0.2 | GO:0000774 | adenyl-nucleotide exchange factor activity(GO:0000774) |
| 0.0 | 0.1 | GO:0004365 | glyceraldehyde-3-phosphate dehydrogenase (NAD+) (phosphorylating) activity(GO:0004365) glyceraldehyde-3-phosphate dehydrogenase (NAD(P)+) (phosphorylating) activity(GO:0043891) |
| 0.0 | 0.6 | GO:0071889 | 14-3-3 protein binding(GO:0071889) |
| 0.0 | 0.2 | GO:0044323 | retinoic acid-responsive element binding(GO:0044323) |
| 0.0 | 0.2 | GO:0016742 | hydroxymethyl-, formyl- and related transferase activity(GO:0016742) |
| 0.0 | 0.1 | GO:0004977 | melanocortin receptor activity(GO:0004977) |
| 0.0 | 0.1 | GO:0051538 | 3 iron, 4 sulfur cluster binding(GO:0051538) |
| 0.0 | 0.1 | GO:0004768 | stearoyl-CoA 9-desaturase activity(GO:0004768) |
| 0.0 | 0.2 | GO:0048018 | receptor agonist activity(GO:0048018) |
| 0.0 | 0.4 | GO:0005212 | structural constituent of eye lens(GO:0005212) |
| 0.0 | 0.2 | GO:0022820 | potassium:chloride symporter activity(GO:0015379) potassium ion symporter activity(GO:0022820) |
| 0.0 | 0.1 | GO:0005127 | ciliary neurotrophic factor receptor binding(GO:0005127) |
| 0.0 | 0.2 | GO:0030215 | semaphorin receptor binding(GO:0030215) |
| 0.0 | 0.2 | GO:0004089 | carbonate dehydratase activity(GO:0004089) |
| 0.0 | 0.1 | GO:0070181 | small ribosomal subunit rRNA binding(GO:0070181) |
| 0.0 | 0.3 | GO:0019789 | SUMO transferase activity(GO:0019789) |
| 0.0 | 0.5 | GO:0008188 | neuropeptide receptor activity(GO:0008188) |
| 0.0 | 0.1 | GO:0015217 | ATP transmembrane transporter activity(GO:0005347) ADP transmembrane transporter activity(GO:0015217) |
| 0.0 | 0.0 | GO:0102007 | lactonohydrolase activity(GO:0046573) acyl-L-homoserine-lactone lactonohydrolase activity(GO:0102007) |
| 0.0 | 0.3 | GO:0016594 | glycine binding(GO:0016594) |
| 0.0 | 0.1 | GO:0004308 | exo-alpha-sialidase activity(GO:0004308) alpha-sialidase activity(GO:0016997) |
| 0.0 | 0.0 | GO:0080130 | L-aspartate:2-oxoglutarate aminotransferase activity(GO:0004069) L-phenylalanine:2-oxoglutarate aminotransferase activity(GO:0080130) |
| 0.0 | 0.1 | GO:0051575 | 5'-deoxyribose-5-phosphate lyase activity(GO:0051575) |
| 0.0 | 0.1 | GO:1990446 | U1 snRNP binding(GO:1990446) |
| 0.0 | 0.1 | GO:0042834 | peptidoglycan binding(GO:0042834) |
| 0.0 | 0.2 | GO:0030898 | actin-dependent ATPase activity(GO:0030898) |
| 0.0 | 0.1 | GO:0032050 | clathrin heavy chain binding(GO:0032050) |
| 0.0 | 0.1 | GO:0031750 | D3 dopamine receptor binding(GO:0031750) |
| 0.0 | 0.1 | GO:0008889 | glycerophosphodiester phosphodiesterase activity(GO:0008889) |
| 0.0 | 0.4 | GO:0030742 | GTP-dependent protein binding(GO:0030742) |
| 0.0 | 0.1 | GO:0004897 | ciliary neurotrophic factor receptor activity(GO:0004897) |
| 0.0 | 0.1 | GO:0005432 | calcium:sodium antiporter activity(GO:0005432) |
| 0.0 | 0.2 | GO:0031078 | histone deacetylase activity (H3-K14 specific)(GO:0031078) NAD-dependent histone deacetylase activity (H3-K14 specific)(GO:0032041) |
| 0.0 | 0.1 | GO:0086006 | voltage-gated sodium channel activity involved in cardiac muscle cell action potential(GO:0086006) |
| 0.0 | 0.1 | GO:0050692 | DBD domain binding(GO:0050692) |
| 0.0 | 0.1 | GO:0008432 | JUN kinase binding(GO:0008432) |
| 0.0 | 0.2 | GO:0070097 | delta-catenin binding(GO:0070097) |
| 0.0 | 0.1 | GO:0031957 | very long-chain fatty acid-CoA ligase activity(GO:0031957) |
| 0.0 | 0.4 | GO:0001205 | transcriptional activator activity, RNA polymerase II distal enhancer sequence-specific binding(GO:0001205) |
| 0.0 | 0.8 | GO:0003705 | transcription factor activity, RNA polymerase II distal enhancer sequence-specific binding(GO:0003705) |
| 0.0 | 0.1 | GO:0035256 | G-protein coupled glutamate receptor binding(GO:0035256) |
| 0.0 | 0.1 | GO:0016421 | CoA carboxylase activity(GO:0016421) |
| 0.0 | 0.1 | GO:0005095 | GTPase inhibitor activity(GO:0005095) |
| 0.0 | 0.1 | GO:0003956 | NAD(P)+-protein-arginine ADP-ribosyltransferase activity(GO:0003956) |
| 0.0 | 0.0 | GO:0016823 | hydrolase activity, acting on acid carbon-carbon bonds(GO:0016822) hydrolase activity, acting on acid carbon-carbon bonds, in ketonic substances(GO:0016823) |
| 0.0 | 0.3 | GO:0051537 | 2 iron, 2 sulfur cluster binding(GO:0051537) |
| 0.0 | 0.1 | GO:0004331 | fructose-2,6-bisphosphate 2-phosphatase activity(GO:0004331) |
| 0.0 | 0.1 | GO:0001054 | RNA polymerase I activity(GO:0001054) |
| 0.0 | 0.4 | GO:0001102 | RNA polymerase II activating transcription factor binding(GO:0001102) |
| 0.0 | 0.1 | GO:0033691 | sialic acid binding(GO:0033691) |
| 0.0 | 0.2 | GO:0016922 | ligand-dependent nuclear receptor binding(GO:0016922) |
| 0.0 | 0.3 | GO:1990841 | promoter-specific chromatin binding(GO:1990841) |
| 0.0 | 0.1 | GO:0016286 | small conductance calcium-activated potassium channel activity(GO:0016286) |
| 0.0 | 0.2 | GO:0034236 | protein kinase A catalytic subunit binding(GO:0034236) |
Gene overrepresentation in curated gene sets: canonical pathways category:
| Log-likelihood per target | Total log-likelihood | Term | Description |
|---|---|---|---|
| 0.1 | 2.3 | SA TRKA RECEPTOR | The TrkA receptor binds nerve growth factor to activate MAP kinase pathways and promote cell growth. |
| 0.1 | 0.6 | PID VEGF VEGFR PATHWAY | VEGF and VEGFR signaling network |
| 0.1 | 2.6 | PID HNF3B PATHWAY | FOXA2 and FOXA3 transcription factor networks |
| 0.0 | 1.1 | PID P38 MK2 PATHWAY | p38 signaling mediated by MAPKAP kinases |
| 0.0 | 1.5 | PID LIS1 PATHWAY | Lissencephaly gene (LIS1) in neuronal migration and development |
| 0.0 | 0.8 | PID INTEGRIN A9B1 PATHWAY | Alpha9 beta1 integrin signaling events |
| 0.0 | 0.3 | PID IL5 PATHWAY | IL5-mediated signaling events |
| 0.0 | 0.2 | PID AJDISS 2PATHWAY | Posttranslational regulation of adherens junction stability and dissassembly |
| 0.0 | 0.2 | SA REG CASCADE OF CYCLIN EXPR | Expression of cyclins regulates progression through the cell cycle by activating cyclin-dependent kinases. |
| 0.0 | 0.3 | PID RET PATHWAY | Signaling events regulated by Ret tyrosine kinase |
| 0.0 | 0.3 | PID PRL SIGNALING EVENTS PATHWAY | Signaling events mediated by PRL |
| 0.0 | 0.5 | PID WNT SIGNALING PATHWAY | Wnt signaling network |
| 0.0 | 0.6 | PID IL23 PATHWAY | IL23-mediated signaling events |
| 0.0 | 0.1 | ST IL 13 PATHWAY | Interleukin 13 (IL-13) Pathway |
| 0.0 | 0.4 | PID REELIN PATHWAY | Reelin signaling pathway |
| 0.0 | 1.0 | WNT SIGNALING | Genes related to Wnt-mediated signal transduction |
| 0.0 | 0.4 | PID P38 MKK3 6PATHWAY | p38 MAPK signaling pathway |
| 0.0 | 0.8 | PID BCR 5PATHWAY | BCR signaling pathway |
| 0.0 | 0.3 | PID WNT NONCANONICAL PATHWAY | Noncanonical Wnt signaling pathway |
| 0.0 | 0.2 | ST G ALPHA S PATHWAY | G alpha s Pathway |
| 0.0 | 0.8 | PID CMYB PATHWAY | C-MYB transcription factor network |
| 0.0 | 0.1 | SA MMP CYTOKINE CONNECTION | Cytokines can induce activation of matrix metalloproteinases, which degrade extracellular matrix. |
| 0.0 | 0.2 | ST P38 MAPK PATHWAY | p38 MAPK Pathway |
| 0.0 | 0.4 | PID RXR VDR PATHWAY | RXR and RAR heterodimerization with other nuclear receptor |
| 0.0 | 0.5 | NABA BASEMENT MEMBRANES | Genes encoding structural components of basement membranes |
Gene overrepresentation in curated gene sets: REACTOME pathways category:
| Log-likelihood per target | Total log-likelihood | Term | Description |
|---|---|---|---|
| 0.3 | 3.0 | REACTOME TRANSPORT OF ORGANIC ANIONS | Genes involved in Transport of organic anions |
| 0.1 | 1.6 | REACTOME RETROGRADE NEUROTROPHIN SIGNALLING | Genes involved in Retrograde neurotrophin signalling |
| 0.1 | 0.9 | REACTOME AMINE DERIVED HORMONES | Genes involved in Amine-derived hormones |
| 0.0 | 0.7 | REACTOME AKT PHOSPHORYLATES TARGETS IN THE CYTOSOL | Genes involved in AKT phosphorylates targets in the cytosol |
| 0.0 | 0.5 | REACTOME TETRAHYDROBIOPTERIN BH4 SYNTHESIS RECYCLING SALVAGE AND REGULATION | Genes involved in Tetrahydrobiopterin (BH4) synthesis, recycling, salvage and regulation |
| 0.0 | 0.4 | REACTOME HORMONE LIGAND BINDING RECEPTORS | Genes involved in Hormone ligand-binding receptors |
| 0.0 | 0.7 | REACTOME REGULATION OF IFNA SIGNALING | Genes involved in Regulation of IFNA signaling |
| 0.0 | 0.0 | REACTOME SIGNALING BY NOTCH2 | Genes involved in Signaling by NOTCH2 |
| 0.0 | 1.1 | REACTOME ACTIVATED NOTCH1 TRANSMITS SIGNAL TO THE NUCLEUS | Genes involved in Activated NOTCH1 Transmits Signal to the Nucleus |
| 0.0 | 0.7 | REACTOME GAP JUNCTION ASSEMBLY | Genes involved in Gap junction assembly |
| 0.0 | 0.3 | REACTOME MEMBRANE BINDING AND TARGETTING OF GAG PROTEINS | Genes involved in Membrane binding and targetting of GAG proteins |
| 0.0 | 0.7 | REACTOME PACKAGING OF TELOMERE ENDS | Genes involved in Packaging Of Telomere Ends |
| 0.0 | 0.9 | REACTOME SEMA4D INDUCED CELL MIGRATION AND GROWTH CONE COLLAPSE | Genes involved in Sema4D induced cell migration and growth-cone collapse |
| 0.0 | 4.2 | REACTOME PEPTIDE LIGAND BINDING RECEPTORS | Genes involved in Peptide ligand-binding receptors |
| 0.0 | 0.3 | REACTOME FGFR2C LIGAND BINDING AND ACTIVATION | Genes involved in FGFR2c ligand binding and activation |
| 0.0 | 0.2 | REACTOME DOWNREGULATION OF ERBB2 ERBB3 SIGNALING | Genes involved in Downregulation of ERBB2:ERBB3 signaling |
| 0.0 | 0.4 | REACTOME INITIAL TRIGGERING OF COMPLEMENT | Genes involved in Initial triggering of complement |
| 0.0 | 0.6 | REACTOME TIGHT JUNCTION INTERACTIONS | Genes involved in Tight junction interactions |
| 0.0 | 0.3 | REACTOME MITOCHONDRIAL FATTY ACID BETA OXIDATION | Genes involved in Mitochondrial Fatty Acid Beta-Oxidation |
| 0.0 | 0.6 | REACTOME AMINE LIGAND BINDING RECEPTORS | Genes involved in Amine ligand-binding receptors |
| 0.0 | 0.1 | REACTOME TRAFFICKING OF GLUR2 CONTAINING AMPA RECEPTORS | Genes involved in Trafficking of GluR2-containing AMPA receptors |
| 0.0 | 0.2 | REACTOME ENDOSOMAL SORTING COMPLEX REQUIRED FOR TRANSPORT ESCRT | Genes involved in Endosomal Sorting Complex Required For Transport (ESCRT) |
| 0.0 | 0.8 | REACTOME VOLTAGE GATED POTASSIUM CHANNELS | Genes involved in Voltage gated Potassium channels |
| 0.0 | 1.3 | REACTOME TRANSCRIPTIONAL REGULATION OF WHITE ADIPOCYTE DIFFERENTIATION | Genes involved in Transcriptional Regulation of White Adipocyte Differentiation |
| 0.0 | 0.2 | REACTOME REGULATION OF PYRUVATE DEHYDROGENASE PDH COMPLEX | Genes involved in Regulation of pyruvate dehydrogenase (PDH) complex |
| 0.0 | 0.3 | REACTOME LYSOSOME VESICLE BIOGENESIS | Genes involved in Lysosome Vesicle Biogenesis |
| 0.0 | 0.1 | REACTOME GAMMA CARBOXYLATION TRANSPORT AND AMINO TERMINAL CLEAVAGE OF PROTEINS | Genes involved in Gamma-carboxylation, transport, and amino-terminal cleavage of proteins |
| 0.0 | 0.4 | REACTOME REGULATION OF BETA CELL DEVELOPMENT | Genes involved in Regulation of beta-cell development |
| 0.0 | 0.2 | REACTOME ACYL CHAIN REMODELLING OF PG | Genes involved in Acyl chain remodelling of PG |
| 0.0 | 0.2 | REACTOME PURINE SALVAGE | Genes involved in Purine salvage |
| 0.0 | 0.2 | REACTOME RAP1 SIGNALLING | Genes involved in Rap1 signalling |
| 0.0 | 0.5 | REACTOME IMMUNOREGULATORY INTERACTIONS BETWEEN A LYMPHOID AND A NON LYMPHOID CELL | Genes involved in Immunoregulatory interactions between a Lymphoid and a non-Lymphoid cell |
| 0.0 | 0.2 | REACTOME ASSOCIATION OF LICENSING FACTORS WITH THE PRE REPLICATIVE COMPLEX | Genes involved in Association of licensing factors with the pre-replicative complex |
| 0.0 | 0.1 | REACTOME ALPHA LINOLENIC ACID ALA METABOLISM | Genes involved in alpha-linolenic acid (ALA) metabolism |
| 0.0 | 0.2 | REACTOME PLATELET ADHESION TO EXPOSED COLLAGEN | Genes involved in Platelet Adhesion to exposed collagen |
| 0.0 | 0.2 | REACTOME METABOLISM OF POLYAMINES | Genes involved in Metabolism of polyamines |
| 0.0 | 0.2 | REACTOME YAP1 AND WWTR1 TAZ STIMULATED GENE EXPRESSION | Genes involved in YAP1- and WWTR1 (TAZ)-stimulated gene expression |
| 0.0 | 0.2 | REACTOME HDL MEDIATED LIPID TRANSPORT | Genes involved in HDL-mediated lipid transport |
| 0.0 | 0.1 | REACTOME PD1 SIGNALING | Genes involved in PD-1 signaling |
| 0.0 | 0.3 | REACTOME GLUTATHIONE CONJUGATION | Genes involved in Glutathione conjugation |
| 0.0 | 0.1 | REACTOME P2Y RECEPTORS | Genes involved in P2Y receptors |
| 0.0 | 0.2 | REACTOME HS GAG DEGRADATION | Genes involved in HS-GAG degradation |
| 0.0 | 0.1 | REACTOME HYALURONAN UPTAKE AND DEGRADATION | Genes involved in Hyaluronan uptake and degradation |