Project
GSE49485: Hypoxia transcriptome sequencing of rat brain.
Navigation
Downloads
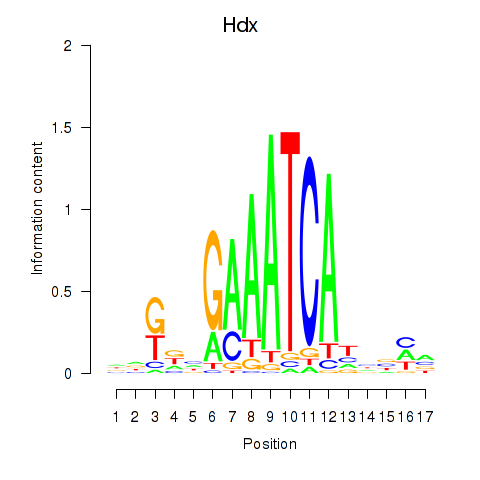
Results for Hdx
Z-value: 0.44
Motif logo
Transcription factors associated with Hdx
| Gene Symbol | Gene ID | Gene Info |
|---|---|---|
|
Hdx
|
ENSRNOG00000037799 | highly divergent homeobox |
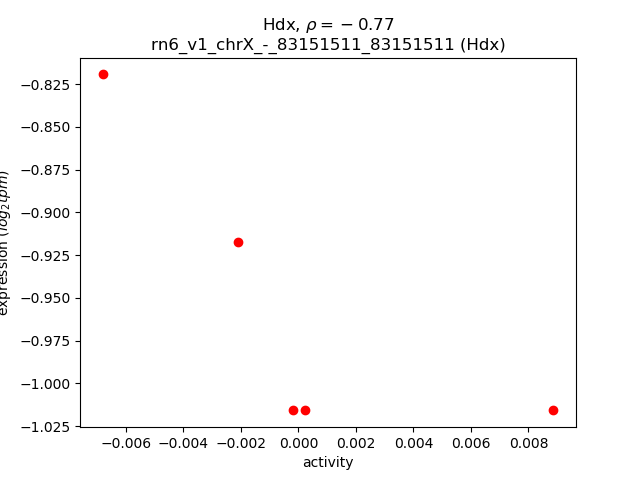
Activity-expression correlation:
| Gene | Promoter | Pearson corr. coef. | P-value | Plot |
|---|---|---|---|---|
| Hdx | rn6_v1_chrX_-_83151511_83151511 | -0.77 | 1.3e-01 | Click! |
Activity profile of Hdx motif
Sorted Z-values of Hdx motif
| Promoter | Log-likelihood | Transcript | Gene | Gene Info |
|---|---|---|---|---|
| chrX_-_32153794 | 0.39 |
ENSRNOT00000005348
|
Tmem27
|
transmembrane protein 27 |
| chr4_+_94696965 | 0.19 |
ENSRNOT00000064696
|
Grid2
|
glutamate ionotropic receptor delta type subunit 2 |
| chr15_+_24159647 | 0.14 |
ENSRNOT00000082675
|
Lgals3
|
galectin 3 |
| chr2_+_140708397 | 0.13 |
ENSRNOT00000088846
|
Mgst2
|
microsomal glutathione S-transferase 2 |
| chr14_+_34354503 | 0.12 |
ENSRNOT00000002941
|
Nmu
|
neuromedin U |
| chr20_+_6351458 | 0.10 |
ENSRNOT00000091731
|
Cdkn1a
|
cyclin-dependent kinase inhibitor 1A |
| chrX_+_29504349 | 0.10 |
ENSRNOT00000005981
|
Tceanc
|
transcription elongation factor A N-terminal and central domain containing |
| chr1_-_89358166 | 0.10 |
ENSRNOT00000044532
|
Mag
|
myelin-associated glycoprotein |
| chr11_+_67451549 | 0.10 |
ENSRNOT00000042777
|
Stfa2l2
|
stefin A2-like 2 |
| chr10_+_71202456 | 0.10 |
ENSRNOT00000076893
|
Hnf1b
|
HNF1 homeobox B |
| chr19_-_345698 | 0.09 |
ENSRNOT00000044037
|
LOC501297
|
hypothetical LOC501297 |
| chr7_-_140770647 | 0.09 |
ENSRNOT00000081784
|
C1ql4
|
complement C1q like 4 |
| chr4_+_84423653 | 0.09 |
ENSRNOT00000012655
|
Chn2
|
chimerin 2 |
| chr4_+_165732643 | 0.09 |
ENSRNOT00000034403
|
LOC690326
|
hypothetical protein LOC690326 |
| chr2_-_96032722 | 0.09 |
ENSRNOT00000015746
|
LOC100360846
|
proteasome subunit beta type 6-like |
| chr10_+_96661696 | 0.08 |
ENSRNOT00000077567
|
AABR07030630.1
|
|
| chr18_-_4371899 | 0.08 |
ENSRNOT00000051207
|
LOC108349606
|
60S ribosomal protein L7a-like |
| chr7_-_107385528 | 0.08 |
ENSRNOT00000093352
|
Tmem71
|
transmembrane protein 71 |
| chr8_+_58347736 | 0.08 |
ENSRNOT00000080227
ENSRNOT00000066222 |
Slc35f2
|
solute carrier family 35, member F2 |
| chr4_+_154423209 | 0.08 |
ENSRNOT00000075799
|
LOC100911545
|
alpha-2-macroglobulin-like |
| chr10_-_56403188 | 0.08 |
ENSRNOT00000019947
|
Chrnb1
|
cholinergic receptor nicotinic beta 1 subunit |
| chr2_-_28799266 | 0.07 |
ENSRNOT00000089293
|
Tmem171
|
transmembrane protein 171 |
| chr2_-_235249571 | 0.07 |
ENSRNOT00000093631
ENSRNOT00000085096 |
Rrh
|
retinal pigment epithelium derived rhodopsin homolog |
| chr3_-_110021149 | 0.07 |
ENSRNOT00000007808
|
Fsip1
|
fibrous sheath interacting protein 1 |
| chr8_+_49354115 | 0.07 |
ENSRNOT00000032837
|
Mpzl3
|
myelin protein zero-like 3 |
| chr11_-_89239798 | 0.07 |
ENSRNOT00000089517
|
Spidr
|
scaffolding protein involved in DNA repair |
| chr3_+_11587941 | 0.07 |
ENSRNOT00000071505
|
Dpm2
|
dolichyl-phosphate mannosyltransferase subunit 2, regulatory |
| chr10_+_35537977 | 0.07 |
ENSRNOT00000071917
|
Rnf130
|
ring finger protein 130 |
| chr16_+_70905993 | 0.06 |
ENSRNOT00000078964
|
AABR07026294.1
|
|
| chr7_-_124172979 | 0.06 |
ENSRNOT00000074960
|
Arfgap3
|
ADP-ribosylation factor GTPase activating protein 3 |
| chr3_+_147226004 | 0.06 |
ENSRNOT00000012765
|
Tmem74b
|
transmembrane protein 74B |
| chr17_+_10676943 | 0.06 |
ENSRNOT00000000116
|
Thoc3
|
THO complex 3 |
| chr5_+_48011864 | 0.06 |
ENSRNOT00000067610
|
Mdn1
|
midasin AAA ATPase 1 |
| chr3_+_55623634 | 0.06 |
ENSRNOT00000080525
|
Dhrs9
|
dehydrogenase/reductase 9 |
| chr10_-_87261717 | 0.06 |
ENSRNOT00000015740
|
Krt27
|
keratin 27 |
| chr8_-_72204730 | 0.06 |
ENSRNOT00000023810
|
Fbxl22
|
F-box and leucine-rich repeat protein 22 |
| chr7_+_79138925 | 0.06 |
ENSRNOT00000047511
|
AABR07057586.1
|
|
| chr9_+_101284902 | 0.06 |
ENSRNOT00000065533
|
NEWGENE_1308624
|
sialidase 4 |
| chr6_+_96007805 | 0.06 |
ENSRNOT00000010163
|
Mnat1
|
MNAT CDK-activating kinase assembly factor 1 |
| chr1_-_255557055 | 0.05 |
ENSRNOT00000033780
|
Fgfbp3
|
fibroblast growth factor binding protein 3 |
| chr10_+_64952119 | 0.05 |
ENSRNOT00000012154
|
Pipox
|
pipecolic acid and sarcosine oxidase |
| chr1_-_170933660 | 0.05 |
ENSRNOT00000045360
|
Olr219
|
olfactory receptor 219 |
| chr20_+_13827132 | 0.05 |
ENSRNOT00000001664
|
Ddt
|
D-dopachrome tautomerase |
| chr8_+_128792707 | 0.05 |
ENSRNOT00000083329
|
Slc25a38
|
solute carrier family 25, member 38 |
| chr17_+_88963981 | 0.05 |
ENSRNOT00000025053
|
Myo3a
|
myosin IIIA |
| chr12_+_4310334 | 0.05 |
ENSRNOT00000041244
|
Vom2r60
|
vomeronasal 2 receptor, 60 |
| chr3_-_103745236 | 0.05 |
ENSRNOT00000006876
|
Nutm1
|
NUT midline carcinoma, family member 1 |
| chr8_+_73593310 | 0.05 |
ENSRNOT00000012048
|
C2cd4b
|
C2 calcium-dependent domain containing 4B |
| chr10_-_44147035 | 0.05 |
ENSRNOT00000041113
|
Olr1424
|
olfactory receptor 1424 |
| chr19_+_27835890 | 0.05 |
ENSRNOT00000042150
|
LOC100909409
|
disks large homolog 5-like |
| chr7_-_141624972 | 0.05 |
ENSRNOT00000078785
|
AABR07058884.1
|
|
| chr1_-_146823762 | 0.05 |
ENSRNOT00000018098
|
Zfand6
|
zinc finger AN1-type containing 6 |
| chr1_-_155955173 | 0.05 |
ENSRNOT00000079345
|
AABR07004776.1
|
|
| chr14_+_110676090 | 0.05 |
ENSRNOT00000029513
|
Fancl
|
Fanconi anemia, complementation group L |
| chr19_-_23944820 | 0.05 |
ENSRNOT00000080337
|
Zfp330
|
zinc finger protein 330 |
| chr2_-_154418629 | 0.05 |
ENSRNOT00000076274
ENSRNOT00000076165 |
Plch1
|
phospholipase C, eta 1 |
| chr15_-_27849974 | 0.05 |
ENSRNOT00000012790
|
Osgep
|
O-sialoglycoprotein endopeptidase |
| chr8_-_112648880 | 0.04 |
ENSRNOT00000015265
|
Ackr4
|
atypical chemokine receptor 4 |
| chr5_+_13379772 | 0.04 |
ENSRNOT00000010032
|
Npbwr1
|
neuropeptides B/W receptor 1 |
| chr8_-_49502647 | 0.04 |
ENSRNOT00000040313
|
Tmprss4
|
transmembrane protease, serine 4 |
| chr20_-_10013190 | 0.04 |
ENSRNOT00000084726
ENSRNOT00000089112 |
Rsph1
|
radial spoke head 1 homolog |
| chr15_+_27849979 | 0.04 |
ENSRNOT00000013176
|
Apex1
|
apurinic/apyrimidinic endodeoxyribonuclease 1 |
| chr13_-_53870428 | 0.04 |
ENSRNOT00000000812
|
Nr5a2
|
nuclear receptor subfamily 5, group A, member 2 |
| chr18_-_63825408 | 0.04 |
ENSRNOT00000043709
|
RGD1562758
|
similar to glyceraldehyde-3-phosphate dehydrogenase |
| chr1_-_237910012 | 0.04 |
ENSRNOT00000023664
|
Anxa1
|
annexin A1 |
| chr14_+_89314176 | 0.04 |
ENSRNOT00000006765
|
Upp1
|
uridine phosphorylase 1 |
| chr11_-_55044581 | 0.04 |
ENSRNOT00000046330
|
Morc1
|
MORC family CW-type zinc finger 1 |
| chr5_+_2632712 | 0.04 |
ENSRNOT00000009431
|
Rpl7
|
ribosomal protein L7 |
| chr11_+_86421106 | 0.04 |
ENSRNOT00000002599
|
LOC100362453
|
serine/threonine-protein phosphatase 2A catalytic subunit alpha-like |
| chrX_+_159158194 | 0.04 |
ENSRNOT00000043820
ENSRNOT00000001169 ENSRNOT00000083502 |
Fhl1
|
four and a half LIM domains 1 |
| chr7_-_70643169 | 0.04 |
ENSRNOT00000010106
|
Inhbe
|
inhibin beta E subunit |
| chr11_-_17684903 | 0.04 |
ENSRNOT00000051213
|
Tmprss15
|
transmembrane protease, serine 15 |
| chr1_+_225048149 | 0.04 |
ENSRNOT00000036454
|
Lrrn4cl
|
LRRN4 C-terminal like |
| chr9_+_8054466 | 0.03 |
ENSRNOT00000081513
|
Adgre4
|
adhesion G protein-coupled receptor E4 |
| chr11_+_54619129 | 0.03 |
ENSRNOT00000059924
|
Trat1
|
T cell receptor associated transmembrane adaptor 1 |
| chr5_+_107711077 | 0.03 |
ENSRNOT00000029486
|
Mtap
|
methylthioadenosine phosphorylase |
| chr10_-_56289882 | 0.03 |
ENSRNOT00000090762
ENSRNOT00000056903 |
Tnfsf13
|
tumor necrosis factor superfamily member 13 |
| chr5_+_79383511 | 0.03 |
ENSRNOT00000011799
|
Tmem268
|
transmembrane protein 268 |
| chr10_+_14062331 | 0.03 |
ENSRNOT00000029652
|
Noxo1
|
NADPH oxidase organizer 1 |
| chr19_-_26141111 | 0.03 |
ENSRNOT00000067518
|
Asna1
|
arsA arsenite transporter, ATP-binding, homolog 1 (bacterial) |
| chr4_-_163954817 | 0.03 |
ENSRNOT00000079951
|
Ly49si3
|
immunoreceptor Ly49si3 |
| chr12_+_3969493 | 0.03 |
ENSRNOT00000042692
|
Vom2r59
|
vomeronasal 2 receptor, 59 |
| chr5_-_155252003 | 0.03 |
ENSRNOT00000017060
|
C1qb
|
complement C1q B chain |
| chr13_+_56202911 | 0.03 |
ENSRNOT00000075072
|
Dennd1b
|
DENN domain containing 1B |
| chr1_-_61686944 | 0.03 |
ENSRNOT00000059638
|
Vom1r23
|
vomeronasal 1 receptor 23 |
| chr1_+_63263722 | 0.03 |
ENSRNOT00000088203
|
LOC100911184
|
vomeronasal type-1 receptor 4-like |
| chr10_+_86399827 | 0.03 |
ENSRNOT00000009299
|
Grb7
|
growth factor receptor bound protein 7 |
| chr9_-_4447715 | 0.03 |
ENSRNOT00000061882
|
Kat2b
|
lysine acetyltransferase 2B |
| chrX_-_37705263 | 0.03 |
ENSRNOT00000043666
|
Map3k15
|
mitogen-activated protein kinase kinase kinase 15 |
| chr9_+_95161157 | 0.03 |
ENSRNOT00000071200
|
Ugt1a5
|
UDP glucuronosyltransferase family 1 member A5 |
| chr1_-_98493978 | 0.03 |
ENSRNOT00000023942
|
Nkg7
|
natural killer cell granule protein 7 |
| chr1_+_66959610 | 0.03 |
ENSRNOT00000072122
ENSRNOT00000045994 |
Vom1r48
|
vomeronasal 1 receptor 48 |
| chr19_-_28296640 | 0.03 |
ENSRNOT00000041115
ENSRNOT00000042781 |
AABR07043429.1
|
|
| chr5_-_131860637 | 0.03 |
ENSRNOT00000064569
ENSRNOT00000080242 |
Slc5a9
|
solute carrier family 5 member 9 |
| chr1_+_83626639 | 0.03 |
ENSRNOT00000028261
|
Cyp2g1
|
cytochrome P450, family 2, subfamily g, polypeptide 1 |
| chr1_-_116153722 | 0.03 |
ENSRNOT00000041605
|
Fpr3
|
formyl peptide receptor 3 |
| chr13_+_89975267 | 0.03 |
ENSRNOT00000006266
ENSRNOT00000000053 |
Cd244
|
CD244 molecule |
| chr2_+_86971147 | 0.03 |
ENSRNOT00000032909
|
Zfp458
|
zinc finger protein 458 |
| chr8_-_16486419 | 0.03 |
ENSRNOT00000033223
|
LOC690235
|
similar to MAP/microtubule affinity-regulating kinase 4 (MAP/microtubule affinity-regulating kinase-like 1) |
| chr12_-_18139444 | 0.03 |
ENSRNOT00000028927
|
RGD1566386
|
similar to Hypothetical protein A430033K04 |
| chr4_-_119148358 | 0.03 |
ENSRNOT00000012218
|
Gkn1
|
gastrokine 1 |
| chr15_-_49467174 | 0.03 |
ENSRNOT00000019209
|
Adam7
|
ADAM metallopeptidase domain 7 |
| chr15_-_44673765 | 0.03 |
ENSRNOT00000048783
|
AABR07018167.1
|
|
| chr19_+_12097632 | 0.03 |
ENSRNOT00000049452
|
Ces5a
|
carboxylesterase 5A |
| chr5_-_101588001 | 0.03 |
ENSRNOT00000016130
|
Psip1
|
PC4 and SFRS1 interacting protein 1 |
| chr3_-_114235933 | 0.03 |
ENSRNOT00000023939
|
Duox2
|
dual oxidase 2 |
| chr17_-_57984036 | 0.03 |
ENSRNOT00000022389
|
Idi1
|
isopentenyl-diphosphate delta isomerase 1 |
| chr3_+_104749051 | 0.03 |
ENSRNOT00000000010
|
Tmco5b
|
transmembrane and coiled-coil domains 5B |
| chr5_-_58476251 | 0.03 |
ENSRNOT00000013151
|
Stoml2
|
stomatin like 2 |
| chr12_+_18679789 | 0.03 |
ENSRNOT00000001863
|
Cyp3a9
|
cytochrome P450, family 3, subfamily a, polypeptide 9 |
| chr5_-_157820889 | 0.03 |
ENSRNOT00000024326
|
Mrto4
|
MRT4 homolog, ribosome maturation factor |
| chr9_+_4817854 | 0.03 |
ENSRNOT00000040879
|
LOC100910526
|
sulfotransferase 1C2-like |
| chr15_+_19195666 | 0.03 |
ENSRNOT00000041790
|
Ptgdrl
|
prostaglandin D2 receptor-like |
| chr5_-_77903062 | 0.02 |
ENSRNOT00000073954
ENSRNOT00000059320 ENSRNOT00000089382 ENSRNOT00000076074 ENSRNOT00000074349 |
LOC100912565
Rn50_5_0814.4
|
major urinary protein-like alpha2u globulin (LOC298111), mRNA |
| chr2_-_112802073 | 0.02 |
ENSRNOT00000093081
|
Ect2
|
epithelial cell transforming 2 |
| chrM_+_14136 | 0.02 |
ENSRNOT00000042098
|
Mt-cyb
|
mitochondrially encoded cytochrome b |
| chr10_-_89816491 | 0.02 |
ENSRNOT00000028220
|
Meox1
|
mesenchyme homeobox 1 |
| chr1_+_82419947 | 0.02 |
ENSRNOT00000027964
|
B3gnt8
|
UDP-GlcNAc:betaGal beta-1,3-N-acetylglucosaminyltransferase 8 |
| chr2_+_203200427 | 0.02 |
ENSRNOT00000020566
|
Vtcn1
|
V-set domain containing T cell activation inhibitor 1 |
| chr1_-_228505080 | 0.02 |
ENSRNOT00000028600
|
Olr322
|
olfactory receptor 322 |
| chr7_+_107413691 | 0.02 |
ENSRNOT00000007587
|
Phf20l1
|
PHD finger protein 20-like protein 1 |
| chr3_-_50120392 | 0.02 |
ENSRNOT00000006175
|
Fign
|
fidgetin, microtubule severing factor |
| chr7_-_97067864 | 0.02 |
ENSRNOT00000078009
|
Slc22a22
|
solute carrier family 22 (organic cation transporter), member 22 |
| chr1_+_24900858 | 0.02 |
ENSRNOT00000075616
|
LOC501467
|
similar to spermatogenesis associated glutamate (E)-rich protein 4d |
| chr2_+_237755673 | 0.02 |
ENSRNOT00000083937
|
Tbck
|
TBC1 domain containing kinase |
| chr7_-_15856676 | 0.02 |
ENSRNOT00000086553
|
AABR07055919.1
|
|
| chr8_-_6235967 | 0.02 |
ENSRNOT00000068290
|
LOC654482
|
hypothetical protein LOC654482 |
| chr1_+_248723397 | 0.02 |
ENSRNOT00000072188
|
LOC100911854
|
mannose-binding protein C-like |
| chr3_+_1478525 | 0.02 |
ENSRNOT00000008161
|
Psd4
|
pleckstrin and Sec7 domain containing 4 |
| chr5_-_59913348 | 0.02 |
ENSRNOT00000018164
|
LOC100359916
|
heterogeneous nuclear ribonucleoprotein K-like |
| chr17_-_43614844 | 0.02 |
ENSRNOT00000023054
|
Hist1h1a
|
histone cluster 1 H1 family member a |
| chr1_+_201950144 | 0.02 |
ENSRNOT00000027967
|
Pstk
|
phosphoseryl-tRNA kinase |
| chr8_+_99713783 | 0.02 |
ENSRNOT00000089624
|
Plscr1
|
phospholipid scramblase 1 |
| chr4_-_165195489 | 0.02 |
ENSRNOT00000079429
|
Klra5
|
killer cell lectin-like receptor, subfamily A, member 5 |
| chr1_-_103909926 | 0.02 |
ENSRNOT00000051589
|
Mrgprb3
|
MAS-related GPR, member B3 |
| chr8_-_115179191 | 0.02 |
ENSRNOT00000017224
|
Parp3
|
poly (ADP-ribose) polymerase family, member 3 |
| chr7_+_66717434 | 0.02 |
ENSRNOT00000077878
|
Mon2
|
MON2 homolog, regulator of endosome-to-Golgi trafficking |
| chr1_+_229416489 | 0.02 |
ENSRNOT00000028617
|
Olr336
|
olfactory receptor 336 |
| chr10_+_83476107 | 0.02 |
ENSRNOT00000075733
|
Phb
|
prohibitin |
| chr3_+_138508899 | 0.02 |
ENSRNOT00000009437
|
Kat14
|
lysine acetyltransferase 14 |
| chr1_-_67302751 | 0.02 |
ENSRNOT00000041518
|
Vom1r42
|
vomeronasal 1 receptor 42 |
| chr19_-_462559 | 0.02 |
ENSRNOT00000046676
|
AABR07042633.1
|
|
| chr1_+_228317412 | 0.02 |
ENSRNOT00000028575
|
Olr319
|
olfactory receptor 319 |
| chr15_+_48674380 | 0.02 |
ENSRNOT00000018762
|
Fbxo16
|
F-box protein 16 |
| chr1_-_62114672 | 0.02 |
ENSRNOT00000072607
|
AABR07001923.1
|
|
| chr5_+_154898929 | 0.02 |
ENSRNOT00000016093
|
Luzp1
|
leucine zipper protein 1 |
| chr9_+_23503236 | 0.02 |
ENSRNOT00000017996
|
Crisp2
|
cysteine-rich secretory protein 2 |
| chr1_+_100845563 | 0.02 |
ENSRNOT00000027478
|
Akt1s1
|
AKT1 substrate 1 |
| chr17_-_43537293 | 0.02 |
ENSRNOT00000091749
|
Slc17a3
|
solute carrier family 17 member 3 |
| chr10_-_98469799 | 0.02 |
ENSRNOT00000087502
ENSRNOT00000088646 |
Abca9
|
ATP binding cassette subfamily A member 9 |
| chrX_+_48196916 | 0.02 |
ENSRNOT00000045976
|
Da2-19
|
uncharacterized LOC302729 |
| chr5_-_152227677 | 0.02 |
ENSRNOT00000020051
|
Dhdds
|
dehydrodolichyl diphosphate synthase subunit |
| chr18_-_53181503 | 0.02 |
ENSRNOT00000066548
|
Fbn2
|
fibrillin 2 |
| chr9_+_17911944 | 0.02 |
ENSRNOT00000080940
|
Spats1
|
spermatogenesis associated, serine-rich 1 |
| chr5_+_157282669 | 0.02 |
ENSRNOT00000022827
|
Pla2g2a
|
phospholipase A2 group IIA |
| chrX_+_106360393 | 0.02 |
ENSRNOT00000004260
|
Gprasp2
|
G protein-coupled receptor associated sorting protein 2 |
| chr18_+_87637608 | 0.02 |
ENSRNOT00000070851
|
LOC102550729
|
zinc finger protein 120-like |
| chr20_+_41266566 | 0.02 |
ENSRNOT00000000653
|
Frk
|
fyn-related Src family tyrosine kinase |
| chr1_+_64740487 | 0.02 |
ENSRNOT00000081213
|
LOC103691005
|
zinc finger protein 679-like |
| chr1_-_170073473 | 0.01 |
ENSRNOT00000085141
|
Olr196
|
olfactory receptor 196 |
| chr16_-_69935976 | 0.01 |
ENSRNOT00000016415
ENSRNOT00000093123 |
Cnga2
|
cyclic nucleotide gated channel alpha 2 |
| chr17_+_6684621 | 0.01 |
ENSRNOT00000089138
|
RGD1311345
|
similar to CG9752-PA |
| chr16_+_68633720 | 0.01 |
ENSRNOT00000081838
|
LOC100911229
|
sperm motility kinase-like |
| chr1_+_46779860 | 0.01 |
ENSRNOT00000075268
|
Snx9
|
sorting nexin 9 |
| chr5_+_124300477 | 0.01 |
ENSRNOT00000010100
|
C8b
|
complement C8 beta chain |
| chr16_-_69898976 | 0.01 |
ENSRNOT00000082752
ENSRNOT00000092950 |
Cnga2
|
cyclic nucleotide gated channel alpha 2 |
| chrM_-_14061 | 0.01 |
ENSRNOT00000051268
|
Mt-nd6
|
mitochondrially encoded NADH dehydrogenase 6 |
| chr12_+_9846398 | 0.01 |
ENSRNOT00000075162
|
Mtif3
|
mitochondrial translational initiation factor 3 |
| chr15_+_32811135 | 0.01 |
ENSRNOT00000067689
|
AABR07017902.1
|
|
| chr11_-_75144903 | 0.01 |
ENSRNOT00000002329
|
Hrasls
|
HRAS-like suppressor |
| chr14_-_21748356 | 0.01 |
ENSRNOT00000002670
|
Cabs1
|
calcium binding protein, spermatid associated 1 |
| chr2_-_102838745 | 0.01 |
ENSRNOT00000082084
|
Cyp7b1
|
cytochrome P450, family 7, subfamily b, polypeptide 1 |
| chrX_-_144001727 | 0.01 |
ENSRNOT00000078404
|
RGD1560585
|
similar to RIKEN cDNA 1700001F22 |
| chr7_+_36826360 | 0.01 |
ENSRNOT00000029783
|
Ndufa13
|
NADH:ubiquinone oxidoreductase subunit A13 |
| chr12_+_18516946 | 0.01 |
ENSRNOT00000029485
|
Dhrsx
|
dehydrogenase/reductase X-linked |
| chr7_+_144623555 | 0.01 |
ENSRNOT00000022217
|
Hoxc6
|
homeo box C6 |
| chr1_-_67284864 | 0.01 |
ENSRNOT00000082908
|
LOC691661
|
similar to zinc finger and SCAN domain containing 4 |
| chr2_+_187668796 | 0.01 |
ENSRNOT00000025824
|
Cct3
|
chaperonin containing TCP1 subunit 3 |
| chr13_-_67819835 | 0.01 |
ENSRNOT00000093666
|
Hmcn1
|
hemicentin 1 |
| chr3_-_151548995 | 0.01 |
ENSRNOT00000071825
|
LOC102550306
|
uncharacterized LOC102550306 |
| chr14_-_16996962 | 0.01 |
ENSRNOT00000091936
|
AC103535.1
|
|
| chr1_-_217748628 | 0.01 |
ENSRNOT00000075089
|
Fadd
|
Fas associated via death domain |
| chr5_+_29622281 | 0.01 |
ENSRNOT00000012377
|
Nbn
|
nibrin |
| chr9_+_40817654 | 0.01 |
ENSRNOT00000037392
|
AABR07067339.1
|
|
| chr1_-_80271001 | 0.01 |
ENSRNOT00000034266
|
Cd3eap
|
CD3e molecule associated protein |
| chr18_-_19149470 | 0.01 |
ENSRNOT00000061146
|
Spata45
|
spermatogenesis associated 45 |
| chr3_+_66673246 | 0.01 |
ENSRNOT00000081338
|
Ppp1r1c
|
protein phosphatase 1, regulatory (inhibitor) subunit 1C |
| chr1_-_7443863 | 0.01 |
ENSRNOT00000088558
|
Phactr2
|
phosphatase and actin regulator 2 |
| chr3_-_151258580 | 0.01 |
ENSRNOT00000026120
|
Edem2
|
ER degradation enhancing alpha-mannosidase like protein 2 |
| chr7_-_107391184 | 0.01 |
ENSRNOT00000056793
|
Tmem71
|
transmembrane protein 71 |
| chr20_+_5049496 | 0.01 |
ENSRNOT00000088251
ENSRNOT00000001118 |
Ddah2
|
dimethylarginine dimethylaminohydrolase 2 |
| chr10_-_34242985 | 0.01 |
ENSRNOT00000046438
|
RGD1559575
|
similar to novel protein |
| chr8_+_36766977 | 0.01 |
ENSRNOT00000017648
|
Pus3
|
pseudouridylate synthase 3 |
| chr2_-_89310946 | 0.01 |
ENSRNOT00000015195
|
Ralyl
|
RALY RNA binding protein-like |
| chr5_-_151029233 | 0.01 |
ENSRNOT00000089155
|
Ppp1r8
|
protein phosphatase 1, regulatory subunit 8 |
| chr1_-_100231460 | 0.01 |
ENSRNOT00000032200
|
Acpt
|
acid phosphatase, testicular |
| chr5_-_128333805 | 0.01 |
ENSRNOT00000037523
|
Zfyve9
|
zinc finger FYVE-type containing 9 |
| chr4_+_66165845 | 0.01 |
ENSRNOT00000064175
|
Ubn2
|
ubinuclein 2 |
| chr7_+_142397371 | 0.00 |
ENSRNOT00000040890
ENSRNOT00000065379 |
Slc4a8
|
solute carrier family 4 member 8 |
| chrX_+_25016401 | 0.00 |
ENSRNOT00000059270
|
Clcn4
|
chloride voltage-gated channel 4 |
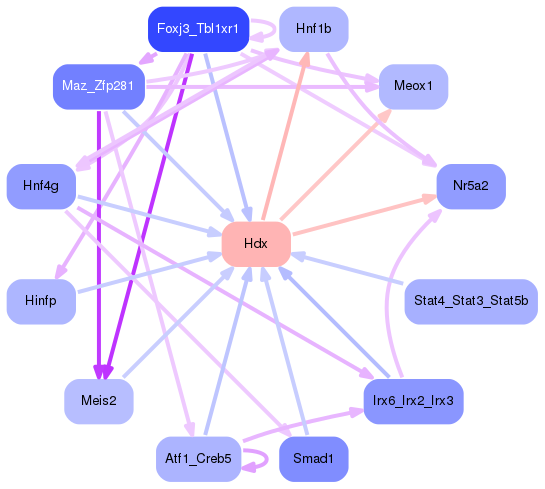
Network of associatons between targets according to the STRING database.

First level regulatory network of Hdx
Gene Ontology Analysis
Gene overrepresentation in biological process category:
| Log-likelihood per target | Total log-likelihood | Term | Description |
|---|---|---|---|
| 0.0 | 0.1 | GO:1903769 | negative regulation of cell proliferation in bone marrow(GO:1903769) |
| 0.0 | 0.4 | GO:0035542 | regulation of SNARE complex assembly(GO:0035542) |
| 0.0 | 0.1 | GO:0039020 | regulation of pronephros size(GO:0035565) pronephric nephron tubule development(GO:0039020) hepatoblast differentiation(GO:0061017) |
| 0.0 | 0.0 | GO:0002949 | tRNA threonylcarbamoyladenosine modification(GO:0002949) |
| 0.0 | 0.1 | GO:0060574 | intestinal epithelial cell maturation(GO:0060574) |
| 0.0 | 0.0 | GO:0071661 | granzyme B production(GO:0071613) regulation of granzyme B production(GO:0071661) positive regulation of granzyme B production(GO:0071663) |
| 0.0 | 0.2 | GO:0021707 | cerebellar granular layer formation(GO:0021684) cerebellar granule cell differentiation(GO:0021707) |
| 0.0 | 0.1 | GO:0046440 | lysine catabolic process(GO:0006554) L-lysine catabolic process to acetyl-CoA(GO:0019474) L-lysine catabolic process(GO:0019477) L-lysine metabolic process(GO:0046440) |
| 0.0 | 0.0 | GO:0070637 | nicotinamide riboside catabolic process(GO:0006738) nicotinamide riboside metabolic process(GO:0046495) pyridine nucleoside metabolic process(GO:0070637) pyridine nucleoside catabolic process(GO:0070638) |
| 0.0 | 0.0 | GO:0002426 | immunoglobulin production in mucosal tissue(GO:0002426) |
| 0.0 | 0.1 | GO:0036233 | glycine import(GO:0036233) |
| 0.0 | 0.0 | GO:0018076 | N-terminal peptidyl-lysine acetylation(GO:0018076) |
| 0.0 | 0.0 | GO:0061113 | pancreas morphogenesis(GO:0061113) |
Gene overrepresentation in cellular component category:
| Log-likelihood per target | Total log-likelihood | Term | Description |
|---|---|---|---|
| 0.0 | 0.1 | GO:0070557 | PCNA-p21 complex(GO:0070557) |
| 0.0 | 0.1 | GO:0097453 | mesaxon(GO:0097453) ensheathing process(GO:1990015) |
| 0.0 | 0.1 | GO:0033185 | dolichol-phosphate-mannose synthase complex(GO:0033185) |
| 0.0 | 0.0 | GO:0000408 | EKC/KEOPS complex(GO:0000408) |
Gene overrepresentation in molecular function category:
| Log-likelihood per target | Total log-likelihood | Term | Description |
|---|---|---|---|
| 0.1 | 0.4 | GO:0008241 | peptidyl-dipeptidase activity(GO:0008241) |
| 0.0 | 0.1 | GO:0004464 | leukotriene-C4 synthase activity(GO:0004464) |
| 0.0 | 0.1 | GO:0019912 | cyclin-dependent protein kinase activating kinase activity(GO:0019912) |
| 0.0 | 0.1 | GO:0001565 | phorbol ester receptor activity(GO:0001565) |
| 0.0 | 0.1 | GO:0050785 | IgE binding(GO:0019863) advanced glycation end-product receptor activity(GO:0050785) |
| 0.0 | 0.1 | GO:0004582 | dolichyl-phosphate beta-D-mannosyltransferase activity(GO:0004582) |
| 0.0 | 0.1 | GO:0004167 | dopachrome isomerase activity(GO:0004167) |
| 0.0 | 0.1 | GO:0060002 | plus-end directed microfilament motor activity(GO:0060002) |
| 0.0 | 0.0 | GO:0050429 | calcium-dependent phospholipase C activity(GO:0050429) |
| 0.0 | 0.1 | GO:0061575 | cyclin-dependent protein serine/threonine kinase activator activity(GO:0061575) |
| 0.0 | 0.0 | GO:0008311 | double-stranded DNA 3'-5' exodeoxyribonuclease activity(GO:0008311) |
| 0.0 | 0.1 | GO:0016647 | oxidoreductase activity, acting on the CH-NH group of donors, oxygen as acceptor(GO:0016647) |
| 0.0 | 0.1 | GO:0047035 | testosterone dehydrogenase (NAD+) activity(GO:0047035) |
| 0.0 | 0.0 | GO:0004731 | purine-nucleoside phosphorylase activity(GO:0004731) |
Gene overrepresentation in curated gene sets: canonical pathways category:
| Log-likelihood per target | Total log-likelihood | Term | Description |
|---|---|---|---|
| 0.0 | 0.1 | SA G2 AND M PHASES | Cdc25 activates the cdc2/cyclin B complex to induce the G2/M transition. |
Gene overrepresentation in curated gene sets: REACTOME pathways category:
| Log-likelihood per target | Total log-likelihood | Term | Description |
|---|---|---|---|
| 0.0 | 0.1 | REACTOME OPSINS | Genes involved in Opsins |
| 0.0 | 0.1 | REACTOME ADVANCED GLYCOSYLATION ENDPRODUCT RECEPTOR SIGNALING | Genes involved in Advanced glycosylation endproduct receptor signaling |