Project
GSE49485: Hypoxia transcriptome sequencing of rat brain.
Navigation
Downloads
Results for Hcfc1_Six5_Smarcc2_Zfp143
Z-value: 2.16
Motif logo
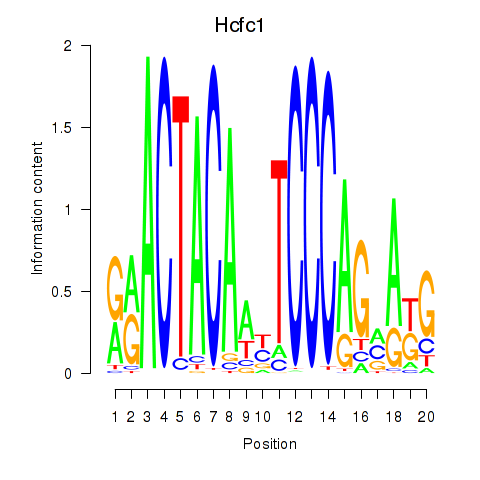
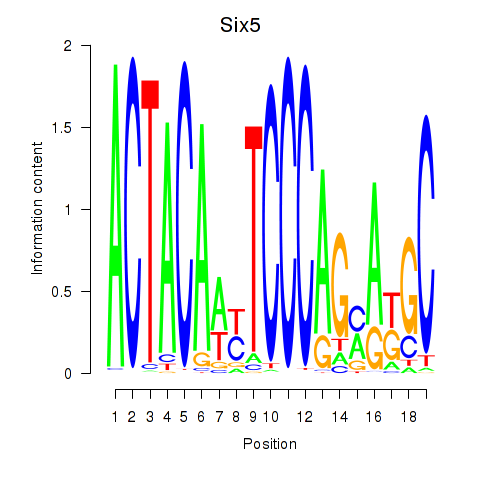
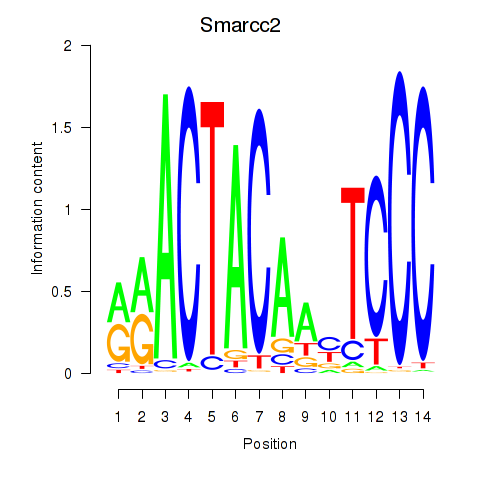
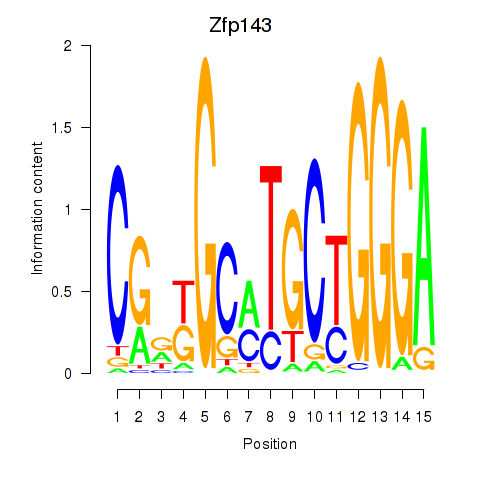
Transcription factors associated with Hcfc1_Six5_Smarcc2_Zfp143
| Gene Symbol | Gene ID | Gene Info |
|---|---|---|
|
Hcfc1
|
ENSRNOG00000051948 | host cell factor C1 |
|
Six5
|
ENSRNOG00000060146 | SIX homeobox 5 |
|
Smarcc2
|
ENSRNOG00000031135 | SWI/SNF related, matrix associated, actin dependent regulator of chromatin, subfamily c, member 2 |
|
Zfp143
|
ENSRNOG00000010087 | zinc finger protein 143 |
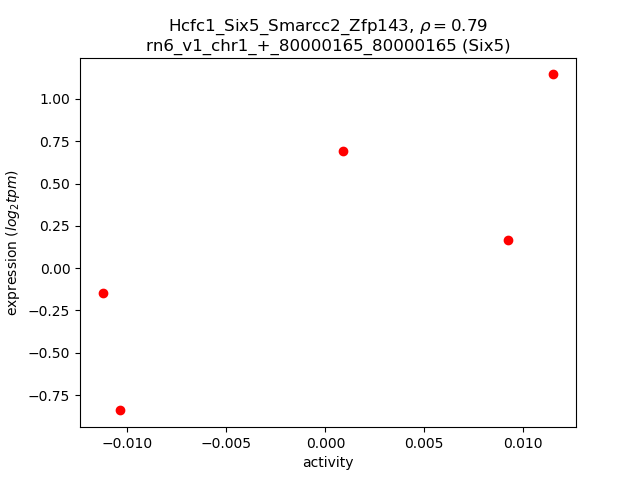
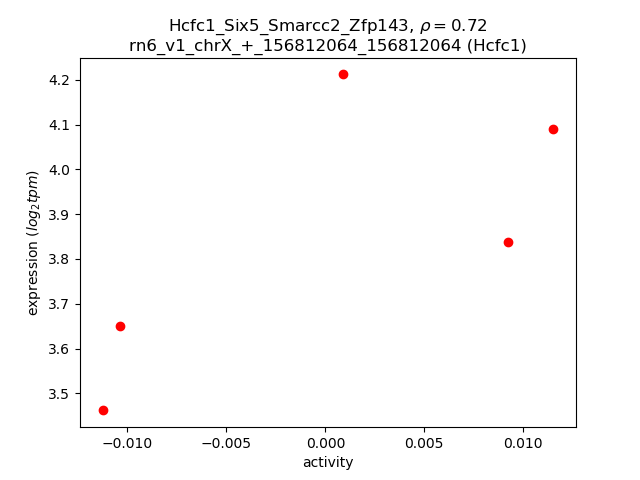
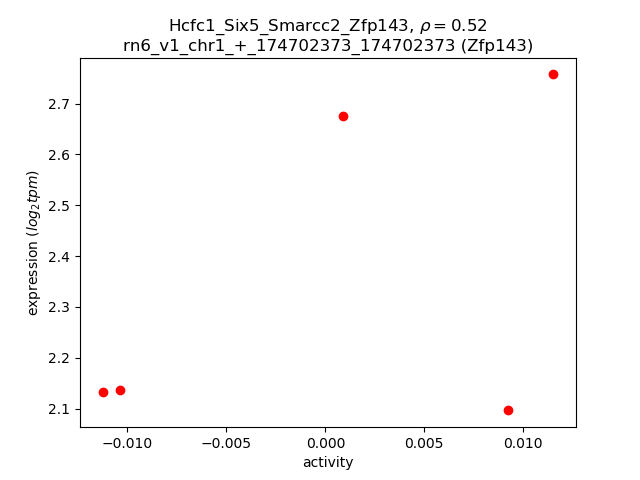
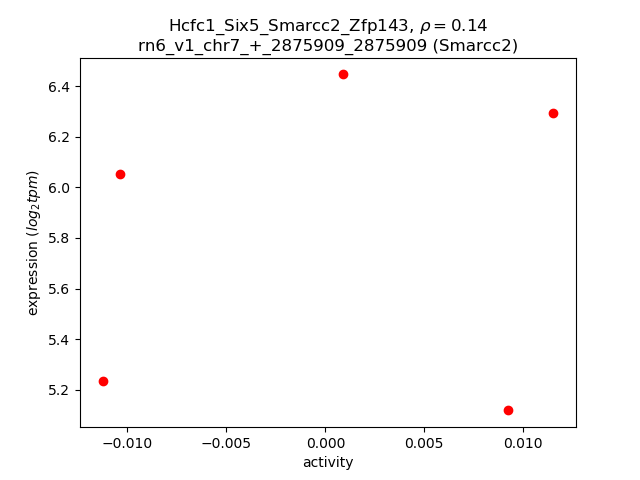
Activity-expression correlation:
| Gene | Promoter | Pearson corr. coef. | P-value | Plot |
|---|---|---|---|---|
| Six5 | rn6_v1_chr1_+_80000165_80000165 | 0.79 | 1.1e-01 | Click! |
| Hcfc1 | rn6_v1_chrX_+_156812064_156812064 | 0.72 | 1.7e-01 | Click! |
| Zfp143 | rn6_v1_chr1_+_174702373_174702373 | 0.52 | 3.6e-01 | Click! |
| Smarcc2 | rn6_v1_chr7_+_2875909_2875909 | 0.14 | 8.2e-01 | Click! |
Activity profile of Hcfc1_Six5_Smarcc2_Zfp143 motif
Sorted Z-values of Hcfc1_Six5_Smarcc2_Zfp143 motif
| Promoter | Log-likelihood | Transcript | Gene | Gene Info |
|---|---|---|---|---|
| chr19_+_54766589 | 1.83 |
ENSRNOT00000025894
|
Banp
|
Btg3 associated nuclear protein |
| chr13_-_68785760 | 1.47 |
ENSRNOT00000086460
ENSRNOT00000044255 |
Swt1
|
SWT1 RNA endoribonuclease homolog |
| chr6_-_115616766 | 1.24 |
ENSRNOT00000006143
ENSRNOT00000045870 |
Sel1l
|
SEL1L ERAD E3 ligase adaptor subunit |
| chr13_+_68785827 | 1.17 |
ENSRNOT00000003517
|
Trmt1l
|
tRNA methyltransferase 1-like |
| chr14_+_38192446 | 0.99 |
ENSRNOT00000090242
|
Nfxl1
|
nuclear transcription factor, X-box binding-like 1 |
| chr5_+_165922915 | 0.94 |
ENSRNOT00000089179
ENSRNOT00000059522 |
Dffa
|
DNA fragmentation factor subunit alpha |
| chr13_-_51784639 | 0.93 |
ENSRNOT00000089068
|
Ppp1r12b
|
protein phosphatase 1, regulatory subunit 12B |
| chr5_+_152606847 | 0.83 |
ENSRNOT00000089070
|
Pafah2
|
platelet-activating factor acetylhydrolase 2 |
| chr11_+_47146308 | 0.79 |
ENSRNOT00000002191
|
Cep97
|
centrosomal protein 97 |
| chr5_-_169167831 | 0.77 |
ENSRNOT00000012407
|
Phf13
|
PHD finger protein 13 |
| chr10_-_15346236 | 0.74 |
ENSRNOT00000088104
ENSRNOT00000027430 |
Capn15
|
calpain 15 |
| chr12_+_38303624 | 0.74 |
ENSRNOT00000001668
|
Zcchc8
|
zinc finger CCHC-type containing 8 |
| chr7_-_145450233 | 0.69 |
ENSRNOT00000092974
ENSRNOT00000021523 |
Calcoco1
|
calcium binding and coiled coil domain 1 |
| chr1_-_266830976 | 0.68 |
ENSRNOT00000027450
|
Pcgf6
|
polycomb group ring finger 6 |
| chr1_+_165724451 | 0.67 |
ENSRNOT00000025827
|
Fam168a
|
family with sequence similarity 168, member A |
| chr14_+_82350734 | 0.67 |
ENSRNOT00000023259
|
Tmem129
|
transmembrane protein 129 |
| chr7_-_93502571 | 0.65 |
ENSRNOT00000077033
ENSRNOT00000076080 |
Samd12
|
sterile alpha motif domain containing 12 |
| chr8_-_116531784 | 0.65 |
ENSRNOT00000024529
|
Rbm5
|
RNA binding motif protein 5 |
| chr8_+_116343096 | 0.64 |
ENSRNOT00000022092
|
Ifrd2
|
interferon-related developmental regulator 2 |
| chr3_-_143063983 | 0.62 |
ENSRNOT00000006329
|
Napb
|
NSF attachment protein beta |
| chr19_-_31942180 | 0.61 |
ENSRNOT00000024924
|
Otud4
|
OTU deubiquitinase 4 |
| chr4_+_127164453 | 0.61 |
ENSRNOT00000017889
|
Kbtbd8
|
kelch repeat and BTB domain containing 8 |
| chr5_+_142933619 | 0.60 |
ENSRNOT00000038013
|
RGD1560436
|
similar to hypothetical protein FLJ20508 |
| chr1_+_80028928 | 0.58 |
ENSRNOT00000012082
|
Fbxo46
|
F-box protein 46 |
| chr12_+_46868416 | 0.57 |
ENSRNOT00000001523
|
Sirt4
|
sirtuin 4 |
| chr2_+_184600721 | 0.56 |
ENSRNOT00000075823
|
Gatb
|
glutamyl-tRNA amidotransferase subunit B |
| chr12_-_25638797 | 0.55 |
ENSRNOT00000002033
|
Gatsl2
|
GATS protein-like 2 |
| chr11_+_84396033 | 0.54 |
ENSRNOT00000002316
|
Abcc5
|
ATP binding cassette subfamily C member 5 |
| chr1_-_89042176 | 0.54 |
ENSRNOT00000080842
|
Kmt2b
|
lysine methyltransferase 2B |
| chr1_+_265809754 | 0.54 |
ENSRNOT00000025221
|
Pprc1
|
peroxisome proliferator-activated receptor gamma, coactivator-related 1 |
| chr11_+_61748883 | 0.54 |
ENSRNOT00000093552
|
Qtrt2
|
queuine tRNA-ribosyltransferase accessory subunit 2 |
| chr13_+_96111800 | 0.54 |
ENSRNOT00000005967
|
Desi2
|
desumoylating isopeptidase 2 |
| chr5_-_57881944 | 0.52 |
ENSRNOT00000033235
|
RGD1309821
|
similar to KIAA1161 protein |
| chr8_-_116635851 | 0.51 |
ENSRNOT00000024939
|
Rbm6
|
RNA binding motif protein 6 |
| chr13_+_48644604 | 0.51 |
ENSRNOT00000084259
ENSRNOT00000073669 |
Rab29
|
RAB29, member RAS oncogene family |
| chr3_+_138597638 | 0.50 |
ENSRNOT00000031623
|
Zfp133
|
zinc finger protein 133 |
| chr10_-_104179523 | 0.49 |
ENSRNOT00000005292
|
Slc25a19
|
solute carrier family 25 member 19 |
| chr3_-_55951584 | 0.49 |
ENSRNOT00000036585
|
Fastkd1
|
FAST kinase domains 1 |
| chr9_+_16003058 | 0.49 |
ENSRNOT00000081621
ENSRNOT00000021158 |
Ubr2
|
ubiquitin protein ligase E3 component n-recognin 2 |
| chr1_+_101603222 | 0.48 |
ENSRNOT00000033278
|
Izumo1
|
izumo sperm-egg fusion 1 |
| chr11_+_71151132 | 0.48 |
ENSRNOT00000082594
ENSRNOT00000082435 |
Rubcn
|
RUN and cysteine rich domain containing beclin 1 interacting protein |
| chr4_-_62663200 | 0.48 |
ENSRNOT00000040969
|
Cnot4
|
CCR4-NOT transcription complex, subunit 4 |
| chr10_-_57638485 | 0.47 |
ENSRNOT00000009468
|
Dhx33
|
DEAH-box helicase 33 |
| chr19_+_43338166 | 0.46 |
ENSRNOT00000091720
ENSRNOT00000084739 |
Fuk
|
fucokinase |
| chr15_-_41770112 | 0.44 |
ENSRNOT00000034400
|
Kpna3
|
karyopherin subunit alpha 3 |
| chr5_+_135663371 | 0.44 |
ENSRNOT00000024375
|
Mutyh
|
mutY DNA glycosylase |
| chr7_+_58366192 | 0.44 |
ENSRNOT00000081891
|
Zfc3h1
|
zinc finger, C3H1-type containing |
| chr5_+_142731767 | 0.44 |
ENSRNOT00000067762
|
Inpp5b
|
inositol polyphosphate-5-phosphatase B |
| chr7_+_40217269 | 0.43 |
ENSRNOT00000082090
|
Cep290
|
centrosomal protein 290 |
| chr4_+_140092352 | 0.43 |
ENSRNOT00000008892
|
Setmar
|
SET domain and mariner transposase fusion gene |
| chr2_+_86996497 | 0.43 |
ENSRNOT00000042058
|
Zfp455
|
zinc finger protein 455 |
| chr17_-_20364714 | 0.43 |
ENSRNOT00000070962
|
Jarid2
|
jumonji and AT-rich interaction domain containing 2 |
| chr6_-_100011226 | 0.43 |
ENSRNOT00000083286
ENSRNOT00000041442 |
Max
|
MYC associated factor X |
| chr5_-_135561914 | 0.43 |
ENSRNOT00000023178
|
Mmachc
|
methylmalonic aciduria (cobalamin deficiency) cblC type, with homocystinuria |
| chr7_-_63728988 | 0.43 |
ENSRNOT00000009645
|
Xpot
|
exportin for tRNA |
| chr18_-_56115593 | 0.43 |
ENSRNOT00000045041
|
Tcof1
|
treacle ribosome biogenesis factor 1 |
| chr8_-_28044876 | 0.42 |
ENSRNOT00000072152
|
Acad8
|
acyl-CoA dehydrogenase family, member 8 |
| chr14_+_38192870 | 0.41 |
ENSRNOT00000077080
|
Nfxl1
|
nuclear transcription factor, X-box binding-like 1 |
| chr9_-_50884596 | 0.41 |
ENSRNOT00000016285
|
Kdelc1
|
KDEL motif containing 1 |
| chr14_-_85772762 | 0.41 |
ENSRNOT00000015627
|
Ccdc117
|
coiled-coil domain containing 117 |
| chr19_+_17115412 | 0.40 |
ENSRNOT00000015876
|
Rpgrip1l
|
Rpgrip1-like |
| chr5_+_173542358 | 0.40 |
ENSRNOT00000027347
|
RGD1311517
|
similar to RIKEN cDNA 9430015G10 |
| chr1_+_221704493 | 0.40 |
ENSRNOT00000028592
|
Men1
|
menin 1 |
| chr9_-_10801140 | 0.40 |
ENSRNOT00000072771
|
Fem1a
|
fem-1 homolog A |
| chr14_+_2613406 | 0.40 |
ENSRNOT00000000083
|
Tmed5
|
transmembrane p24 trafficking protein 5 |
| chr8_-_116532169 | 0.40 |
ENSRNOT00000085364
|
Rbm5
|
RNA binding motif protein 5 |
| chr7_+_25919867 | 0.39 |
ENSRNOT00000009625
ENSRNOT00000090153 |
Ric8b
|
RIC8 guanine nucleotide exchange factor B |
| chr7_-_83348487 | 0.39 |
ENSRNOT00000006685
|
Nudcd1
|
NudC domain containing 1 |
| chr7_-_40217056 | 0.39 |
ENSRNOT00000029045
|
Tmtc3
|
transmembrane and tetratricopeptide repeat containing 3 |
| chr19_-_22632071 | 0.39 |
ENSRNOT00000077275
|
Gpt2
|
glutamic--pyruvic transaminase 2 |
| chr10_-_13892997 | 0.39 |
ENSRNOT00000004192
|
Traf7
|
TNF receptor associated factor 7 |
| chr9_+_93607477 | 0.39 |
ENSRNOT00000025411
|
Cops7b
|
COP9 signalosome subunit 7B |
| chr4_+_49017311 | 0.39 |
ENSRNOT00000007476
|
Ing3
|
inhibitor of growth family, member 3 |
| chr2_+_58534476 | 0.38 |
ENSRNOT00000077646
|
Lmbrd2
|
LMBR1 domain containing 2 |
| chr1_-_199655147 | 0.38 |
ENSRNOT00000026979
|
LOC103691238
|
zinc finger protein 239-like |
| chr4_+_168599331 | 0.38 |
ENSRNOT00000086719
|
Crebl2
|
cAMP responsive element binding protein-like 2 |
| chr1_+_69615603 | 0.38 |
ENSRNOT00000084806
|
Zfp418
|
zinc finger protein 418 |
| chr2_+_86996798 | 0.38 |
ENSRNOT00000070821
|
Zfp455
|
zinc finger protein 455 |
| chr7_-_144322240 | 0.37 |
ENSRNOT00000089290
|
LOC100912282
|
calcium-binding and coiled-coil domain-containing protein 1-like |
| chr1_+_87697005 | 0.37 |
ENSRNOT00000028158
|
Zfp84
|
zinc finger protein 84 |
| chr7_-_34951644 | 0.36 |
ENSRNOT00000030015
|
Vezt
|
vezatin, adherens junctions transmembrane protein |
| chr4_+_60549197 | 0.36 |
ENSRNOT00000071249
ENSRNOT00000075621 |
Exoc4
|
exocyst complex component 4 |
| chr5_+_60250546 | 0.36 |
ENSRNOT00000017707
|
Zcchc7
|
zinc finger CCHC-type containing 7 |
| chr18_+_27558089 | 0.36 |
ENSRNOT00000027499
|
Fam53c
|
family with sequence similarity 53, member C |
| chr11_+_68493035 | 0.35 |
ENSRNOT00000067984
|
Pdia5
|
protein disulfide isomerase family A, member 5 |
| chr4_+_118655728 | 0.35 |
ENSRNOT00000043082
|
Aak1
|
AP2 associated kinase 1 |
| chr5_-_146787676 | 0.35 |
ENSRNOT00000008887
|
Zscan20
|
zinc finger and SCAN domain containing 20 |
| chr16_+_81587446 | 0.34 |
ENSRNOT00000092680
|
NEWGENE_1582994
|
DCN1, defective in cullin neddylation 1, domain containing 2 |
| chr17_-_10575203 | 0.34 |
ENSRNOT00000073186
|
Arl10
|
ADP-ribosylation factor like GTPase 10 |
| chr7_+_97778260 | 0.33 |
ENSRNOT00000064264
|
Tbc1d31
|
TBC1 domain family, member 31 |
| chr4_+_78024765 | 0.33 |
ENSRNOT00000043856
|
Krba1
|
KRAB-A domain containing 1 |
| chr5_-_9432343 | 0.33 |
ENSRNOT00000009482
|
Rrs1
|
ribosome biogenesis regulator homolog |
| chrX_-_68562873 | 0.33 |
ENSRNOT00000076193
|
Ophn1
|
oligophrenin 1 |
| chr6_+_86713803 | 0.33 |
ENSRNOT00000005861
|
Fam179b
|
family with sequence similarity 179, member B |
| chrX_+_14994016 | 0.32 |
ENSRNOT00000006365
|
Ftsj1
|
FtsJ RNA methyltransferase homolog 1 (E. coli) |
| chr16_-_54137660 | 0.31 |
ENSRNOT00000085435
|
Pcm1
|
pericentriolar material 1 |
| chrX_-_68563137 | 0.31 |
ENSRNOT00000034772
|
Ophn1
|
oligophrenin 1 |
| chr1_+_261753364 | 0.31 |
ENSRNOT00000076659
|
R3hcc1l
|
R3H domain and coiled-coil containing 1-like |
| chr1_+_165382690 | 0.31 |
ENSRNOT00000023802
|
C2cd3
|
C2 calcium-dependent domain containing 3 |
| chr3_+_162692185 | 0.31 |
ENSRNOT00000007768
|
Ncoa3
|
nuclear receptor coactivator 3 |
| chr11_-_31772984 | 0.31 |
ENSRNOT00000002771
|
Dnajc28
|
DnaJ heat shock protein family (Hsp40) member C28 |
| chr15_-_33752665 | 0.31 |
ENSRNOT00000034102
|
Zfhx2
|
zinc finger homeobox 2 |
| chrX_-_111325186 | 0.31 |
ENSRNOT00000086785
|
Rbm41
|
RNA binding motif protein 41 |
| chr1_+_72956026 | 0.31 |
ENSRNOT00000031462
|
Rdh13
|
retinol dehydrogenase 13 |
| chr2_-_27364906 | 0.31 |
ENSRNOT00000078639
|
Polk
|
DNA polymerase kappa |
| chr1_+_142679345 | 0.30 |
ENSRNOT00000034267
|
Zscan2
|
zinc finger and SCAN domain containing 2 |
| chr14_-_84393421 | 0.30 |
ENSRNOT00000006911
|
Ccdc157
|
coiled-coil domain containing 157 |
| chr1_+_264670841 | 0.30 |
ENSRNOT00000034814
ENSRNOT00000082412 |
Slf2
|
SMC5-SMC6 complex localization factor 2 |
| chr6_-_29975730 | 0.30 |
ENSRNOT00000075574
|
Wdcp
|
WD repeat and coiled coil containing |
| chr7_+_144121744 | 0.29 |
ENSRNOT00000064661
|
Tarbp2
|
TARBP2, RISC loading complex RNA binding subunit |
| chr20_-_19479325 | 0.29 |
ENSRNOT00000051491
|
Fam13c
|
family with sequence similarity 13, member C |
| chr15_-_4454958 | 0.29 |
ENSRNOT00000070933
|
Nudt13
|
nudix hydrolase 13 |
| chr20_-_46666830 | 0.29 |
ENSRNOT00000000331
|
Cep57l1
|
centrosomal protein 57-like 1 |
| chr7_+_34952011 | 0.29 |
ENSRNOT00000077666
|
Fgd6
|
FYVE, RhoGEF and PH domain containing 6 |
| chr13_+_50196042 | 0.28 |
ENSRNOT00000090858
|
Zc3h11a
|
zinc finger CCCH-type containing 11A |
| chr9_-_19880346 | 0.28 |
ENSRNOT00000014051
|
Cyp39a1
|
cytochrome P450, family 39, subfamily a, polypeptide 1 |
| chr10_+_43744882 | 0.28 |
ENSRNOT00000078662
|
Zfp692
|
zinc finger protein 692 |
| chr6_-_50786967 | 0.28 |
ENSRNOT00000009566
|
Cbll1
|
Cbl proto-oncogene like 1 |
| chr2_+_188495629 | 0.28 |
ENSRNOT00000027828
|
Fam189b
|
family with sequence similarity 189, member B |
| chr2_-_178389608 | 0.28 |
ENSRNOT00000013262
|
Etfdh
|
electron transfer flavoprotein dehydrogenase |
| chr2_-_213178632 | 0.28 |
ENSRNOT00000023079
|
LOC108348173
|
protein arginine N-methyltransferase 6 |
| chr14_+_84393182 | 0.27 |
ENSRNOT00000008355
|
Sf3a1
|
splicing factor 3a, subunit 1 |
| chr19_+_38598165 | 0.27 |
ENSRNOT00000027209
|
Zfp90
|
zinc finger protein 90 |
| chr8_+_53365857 | 0.27 |
ENSRNOT00000080712
|
Zw10
|
zw10 kinetochore protein |
| chr14_-_80169431 | 0.27 |
ENSRNOT00000079769
ENSRNOT00000058315 |
Ablim2
|
actin binding LIM protein family, member 2 |
| chr6_+_76675418 | 0.27 |
ENSRNOT00000076169
ENSRNOT00000010948 ENSRNOT00000082286 |
Brms1l
Brms1l
|
breast cancer metastasis-suppressor 1-like breast cancer metastasis-suppressor 1-like |
| chr10_-_5196892 | 0.27 |
ENSRNOT00000083982
|
Clec16a
|
C-type lectin domain family 16, member A |
| chr1_-_265757389 | 0.27 |
ENSRNOT00000054703
|
C1H10orf76
|
chromosome 1 open reading frame, human C10orf76 |
| chr14_+_81340041 | 0.27 |
ENSRNOT00000082612
ENSRNOT00000066391 |
Nop14
|
NOP14 nucleolar protein |
| chr4_-_116786391 | 0.27 |
ENSRNOT00000086297
ENSRNOT00000091490 |
Exoc6b
|
exocyst complex component 6B |
| chr3_+_111013856 | 0.26 |
ENSRNOT00000016854
|
Zfyve19
|
zinc finger FYVE-type containing 19 |
| chr10_-_36336628 | 0.26 |
ENSRNOT00000030035
|
Zfp879
|
zinc finger protein 879 |
| chr5_-_147846095 | 0.26 |
ENSRNOT00000072165
|
Txlna
|
taxilin alpha |
| chr9_-_95143092 | 0.26 |
ENSRNOT00000064171
ENSRNOT00000085325 |
Usp40
|
ubiquitin specific peptidase 40 |
| chr1_-_37818879 | 0.26 |
ENSRNOT00000043747
|
LOC680200
|
similar to zinc finger protein 455 |
| chr2_+_199283909 | 0.26 |
ENSRNOT00000043194
|
Acp6
|
acid phosphatase 6, lysophosphatidic |
| chr8_-_132911193 | 0.26 |
ENSRNOT00000087799
|
Fyco1
|
FYVE and coiled-coil domain containing 1 |
| chr1_-_89007041 | 0.26 |
ENSRNOT00000032363
|
Proser3
|
proline and serine rich 3 |
| chr6_+_86713604 | 0.25 |
ENSRNOT00000059271
|
Fam179b
|
family with sequence similarity 179, member B |
| chr6_+_26537707 | 0.25 |
ENSRNOT00000050102
|
Zfp513
|
zinc finger protein 513 |
| chr10_+_43744731 | 0.25 |
ENSRNOT00000038123
|
Zfp692
|
zinc finger protein 692 |
| chr1_+_278311244 | 0.25 |
ENSRNOT00000023309
|
Trub1
|
TruB pseudouridine synthase family member 1 |
| chr1_+_157403595 | 0.25 |
ENSRNOT00000012781
|
Ccdc90b
|
coiled-coil domain containing 90B |
| chr6_-_86713370 | 0.25 |
ENSRNOT00000005821
|
Klhl28
|
kelch-like family member 28 |
| chr10_-_86690815 | 0.25 |
ENSRNOT00000012537
|
Nr1d1
|
nuclear receptor subfamily 1, group D, member 1 |
| chr1_-_88428685 | 0.24 |
ENSRNOT00000074582
|
Zfp566
|
zinc finger protein 566 |
| chr7_+_11660934 | 0.24 |
ENSRNOT00000022336
|
Lmnb2
|
lamin B2 |
| chr1_+_69853553 | 0.24 |
ENSRNOT00000042086
|
Zfp954
|
zinc finger protein 954 |
| chr4_+_123118468 | 0.24 |
ENSRNOT00000010895
|
Tmem43
|
transmembrane protein 43 |
| chrX_+_71155601 | 0.23 |
ENSRNOT00000076453
ENSRNOT00000048521 |
Foxo4
|
forkhead box O4 |
| chr5_+_101526551 | 0.23 |
ENSRNOT00000015254
|
Snapc3
|
small nuclear RNA activating complex, polypeptide 3 |
| chr10_-_10881844 | 0.23 |
ENSRNOT00000087118
ENSRNOT00000004416 |
Mgrn1
|
mahogunin ring finger 1 |
| chr1_-_71399751 | 0.23 |
ENSRNOT00000020787
|
Zfp444
|
zinc finger protein 444 |
| chr13_+_99473044 | 0.23 |
ENSRNOT00000004939
|
Cnih4
|
cornichon family AMPA receptor auxiliary protein 4 |
| chr10_-_11935382 | 0.23 |
ENSRNOT00000010059
|
Zfp174
|
zinc finger protein 174 |
| chr4_+_62703779 | 0.23 |
ENSRNOT00000014832
|
Nup205
|
nucleoporin 205 |
| chr9_-_17206994 | 0.23 |
ENSRNOT00000026195
|
Gtpbp2
|
GTP binding protein 2 |
| chr4_+_99823252 | 0.23 |
ENSRNOT00000013587
|
Polr1a
|
RNA polymerase I subunit A |
| chr1_-_169513537 | 0.23 |
ENSRNOT00000078058
|
Trim30c
|
tripartite motif-containing 30C |
| chr10_-_13996565 | 0.23 |
ENSRNOT00000016221
ENSRNOT00000052138 |
Tsc2
|
tuberous sclerosis 2 |
| chr3_+_148327965 | 0.23 |
ENSRNOT00000010851
ENSRNOT00000088481 |
Tpx2
|
TPX2, microtubule nucleation factor |
| chr16_-_54137485 | 0.23 |
ENSRNOT00000014202
|
Pcm1
|
pericentriolar material 1 |
| chr8_-_36374673 | 0.23 |
ENSRNOT00000013763
|
Dcps
|
decapping enzyme, scavenger |
| chr9_+_19880473 | 0.23 |
ENSRNOT00000052068
|
Slc25a27
|
solute carrier family 25, member 27 |
| chr3_+_123754057 | 0.22 |
ENSRNOT00000034201
ENSRNOT00000084671 |
Ap5s1
|
adaptor-related protein complex 5, sigma 1 subunit |
| chr5_+_126976456 | 0.22 |
ENSRNOT00000014275
|
Ndc1
|
NDC1 transmembrane nucleoporin |
| chr2_+_44512895 | 0.22 |
ENSRNOT00000013218
|
Slc38a9
|
solute carrier family 38, member 9 |
| chr7_+_23403891 | 0.22 |
ENSRNOT00000037918
|
Syn3
|
synapsin III |
| chr12_+_25411207 | 0.22 |
ENSRNOT00000077189
ENSRNOT00000040356 |
Gtf2i
|
general transcription factor II I |
| chr12_+_19328957 | 0.22 |
ENSRNOT00000033288
|
Cnpy4
|
canopy FGF signaling regulator 4 |
| chr10_+_20591432 | 0.22 |
ENSRNOT00000059780
|
Pank3
|
pantothenate kinase 3 |
| chr8_-_61079526 | 0.22 |
ENSRNOT00000068658
|
Peak1
|
pseudopodium-enriched atypical kinase 1 |
| chr6_+_111642411 | 0.22 |
ENSRNOT00000016962
|
Adck1
|
aarF domain containing kinase 1 |
| chr1_+_282265370 | 0.22 |
ENSRNOT00000015687
|
Grk5
|
G protein-coupled receptor kinase 5 |
| chr1_-_87468288 | 0.22 |
ENSRNOT00000042207
|
Sipa1l3
|
signal-induced proliferation-associated 1 like 3 |
| chr17_+_18358712 | 0.22 |
ENSRNOT00000001979
|
Nup153
|
nucleoporin 153 |
| chr9_+_65763437 | 0.22 |
ENSRNOT00000043558
|
Stradb
|
STE20-related kinase adaptor beta |
| chr5_-_64030901 | 0.21 |
ENSRNOT00000007711
|
Erp44
|
endoplasmic reticulum protein 44 |
| chr10_+_15538872 | 0.21 |
ENSRNOT00000060078
|
Luc7l
|
LUC7-like |
| chr2_+_149899836 | 0.21 |
ENSRNOT00000086481
|
RGD1560324
|
similar to hypothetical protein C130079G13 |
| chr7_+_83348694 | 0.21 |
ENSRNOT00000006402
|
Eny2
|
ENY2, transcription and export complex 2 subunit |
| chr3_+_11795629 | 0.21 |
ENSRNOT00000030694
ENSRNOT00000067500 |
Tor2a
|
torsin family 2, member A |
| chr3_-_72128973 | 0.21 |
ENSRNOT00000009726
|
Clp1
|
cleavage and polyadenylation factor I subunit 1 |
| chr1_-_219412816 | 0.21 |
ENSRNOT00000083204
ENSRNOT00000029580 |
Rps6kb2
|
ribosomal protein S6 kinase B2 |
| chr10_-_51669297 | 0.21 |
ENSRNOT00000071595
|
Arhgap44
|
Rho GTPase activating protein 44 |
| chr10_+_11912543 | 0.20 |
ENSRNOT00000045192
|
Zfp597
|
zinc finger protein 597 |
| chr5_-_104980641 | 0.20 |
ENSRNOT00000071192
|
Haus6
|
HAUS augmin-like complex, subunit 6 |
| chr1_+_64046377 | 0.20 |
ENSRNOT00000085010
|
Tmc4
|
transmembrane channel-like 4 |
| chr4_-_117111653 | 0.20 |
ENSRNOT00000057537
|
Sfxn5
|
sideroflexin 5 |
| chr10_-_65805693 | 0.20 |
ENSRNOT00000012245
|
Tnfaip1
|
TNF alpha induced protein 1 |
| chr8_+_85413537 | 0.20 |
ENSRNOT00000078159
|
Ick
|
intestinal cell kinase |
| chr7_-_117128798 | 0.20 |
ENSRNOT00000045280
|
Scrib
|
scribbled planar cell polarity protein |
| chr15_+_46008613 | 0.20 |
ENSRNOT00000066864
ENSRNOT00000080537 |
Wdfy2
|
WD repeat and FYVE domain containing 2 |
| chr11_+_88831130 | 0.20 |
ENSRNOT00000002478
|
Dnm1l
|
dynamin 1-like |
| chr5_-_142933526 | 0.20 |
ENSRNOT00000048293
|
Cdca8
|
cell division cycle associated 8 |
| chr15_+_62406873 | 0.20 |
ENSRNOT00000047572
|
Olfm4
|
olfactomedin 4 |
| chr18_-_28495937 | 0.20 |
ENSRNOT00000027194
|
Dnajc18
|
DnaJ heat shock protein family (Hsp40) member C18 |
| chr18_+_24849545 | 0.19 |
ENSRNOT00000061011
ENSRNOT00000085516 |
Iws1
|
IWS1, SUPT6H interacting protein |
| chr11_+_88830957 | 0.19 |
ENSRNOT00000002482
ENSRNOT00000002477 |
Dnm1l
|
dynamin 1-like |
| chr17_-_54070231 | 0.19 |
ENSRNOT00000085150
|
B3galnt2
|
beta-1,3-N-acetylgalactosaminyltransferase 2 |
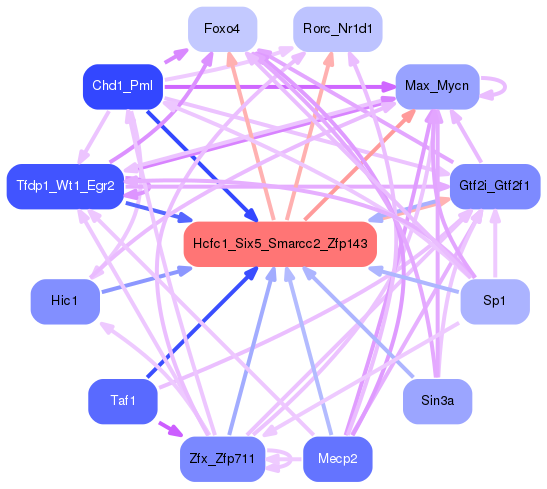
Network of associatons between targets according to the STRING database.

First level regulatory network of Hcfc1_Six5_Smarcc2_Zfp143
Gene Ontology Analysis
Gene overrepresentation in biological process category:
| Log-likelihood per target | Total log-likelihood | Term | Description |
|---|---|---|---|
| 0.2 | 0.6 | GO:0070681 | glutaminyl-tRNAGln biosynthesis via transamidation(GO:0070681) |
| 0.2 | 0.5 | GO:1901097 | negative regulation of autophagosome maturation(GO:1901097) |
| 0.2 | 0.5 | GO:0030423 | targeting of mRNA for destruction involved in RNA interference(GO:0030423) |
| 0.2 | 0.5 | GO:0071934 | thiamine transmembrane transport(GO:0071934) |
| 0.2 | 1.1 | GO:0032074 | negative regulation of nuclease activity(GO:0032074) |
| 0.2 | 0.6 | GO:0035494 | SNARE complex disassembly(GO:0035494) |
| 0.2 | 0.5 | GO:0071431 | tRNA export from nucleus(GO:0006409) tRNA-containing ribonucleoprotein complex export from nucleus(GO:0071431) |
| 0.1 | 0.4 | GO:2001034 | positive regulation of double-strand break repair via nonhomologous end joining(GO:2001034) |
| 0.1 | 0.4 | GO:0090149 | mitochondrial membrane fission(GO:0090149) |
| 0.1 | 0.3 | GO:0021997 | neural plate axis specification(GO:0021997) |
| 0.1 | 0.3 | GO:0009644 | response to high light intensity(GO:0009644) |
| 0.1 | 0.7 | GO:1901098 | positive regulation of autophagosome maturation(GO:1901098) |
| 0.1 | 0.3 | GO:1990166 | protein localization to site of double-strand break(GO:1990166) |
| 0.1 | 0.4 | GO:0060447 | bud outgrowth involved in lung branching(GO:0060447) |
| 0.1 | 0.4 | GO:0042851 | L-alanine metabolic process(GO:0042851) |
| 0.1 | 0.6 | GO:1903215 | negative regulation of protein targeting to mitochondrion(GO:1903215) |
| 0.1 | 1.0 | GO:0014029 | neural crest formation(GO:0014029) |
| 0.1 | 0.2 | GO:0060086 | circadian temperature homeostasis(GO:0060086) |
| 0.1 | 0.6 | GO:0035735 | intraciliary transport involved in cilium morphogenesis(GO:0035735) |
| 0.1 | 0.6 | GO:0046116 | queuosine biosynthetic process(GO:0008616) queuosine metabolic process(GO:0046116) |
| 0.1 | 0.2 | GO:0051562 | negative regulation of mitochondrial calcium ion concentration(GO:0051562) |
| 0.1 | 0.6 | GO:0009235 | cobalamin metabolic process(GO:0009235) |
| 0.1 | 0.3 | GO:0000389 | mRNA 3'-splice site recognition(GO:0000389) |
| 0.1 | 0.9 | GO:0051292 | nuclear pore complex assembly(GO:0051292) |
| 0.1 | 0.4 | GO:0098887 | neurotransmitter receptor transport, endosome to postsynaptic membrane(GO:0098887) |
| 0.1 | 0.4 | GO:0002051 | osteoblast fate commitment(GO:0002051) |
| 0.1 | 1.7 | GO:0030488 | tRNA methylation(GO:0030488) |
| 0.1 | 0.2 | GO:0097198 | histone H3-K36 trimethylation(GO:0097198) |
| 0.1 | 0.3 | GO:1990481 | mRNA pseudouridine synthesis(GO:1990481) |
| 0.1 | 0.8 | GO:0007076 | mitotic chromosome condensation(GO:0007076) |
| 0.1 | 0.2 | GO:0034395 | regulation of transcription from RNA polymerase II promoter in response to iron(GO:0034395) |
| 0.1 | 0.2 | GO:0001682 | tRNA 5'-leader removal(GO:0001682) |
| 0.1 | 0.1 | GO:0036507 | protein deglycosylation involved in glycoprotein catabolic process(GO:0035977) protein demannosylation(GO:0036507) protein alpha-1,2-demannosylation(GO:0036508) glycoprotein ERAD pathway(GO:0097466) mannose trimming involved in glycoprotein ERAD pathway(GO:1904382) |
| 0.1 | 0.8 | GO:1902018 | negative regulation of cilium assembly(GO:1902018) |
| 0.1 | 0.2 | GO:1904749 | regulation of protein localization to nucleolus(GO:1904749) |
| 0.1 | 0.5 | GO:1903441 | protein localization to ciliary membrane(GO:1903441) |
| 0.1 | 0.2 | GO:0036066 | protein O-linked fucosylation(GO:0036066) |
| 0.1 | 0.2 | GO:0090038 | negative regulation of protein kinase C signaling(GO:0090038) |
| 0.1 | 0.3 | GO:0090168 | Golgi reassembly(GO:0090168) |
| 0.1 | 0.5 | GO:0000055 | ribosomal large subunit export from nucleus(GO:0000055) |
| 0.1 | 0.3 | GO:0009298 | GDP-mannose biosynthetic process(GO:0009298) |
| 0.1 | 0.4 | GO:0048341 | paraxial mesoderm formation(GO:0048341) |
| 0.1 | 0.3 | GO:0043697 | thelarche(GO:0042695) dedifferentiation(GO:0043696) cell dedifferentiation(GO:0043697) mammary gland branching involved in thelarche(GO:0060744) |
| 0.1 | 1.5 | GO:0030970 | retrograde protein transport, ER to cytosol(GO:0030970) |
| 0.1 | 0.2 | GO:0050689 | negative regulation of defense response to virus by host(GO:0050689) |
| 0.0 | 0.2 | GO:0015746 | citrate transport(GO:0015746) |
| 0.0 | 0.2 | GO:0035720 | intraciliary anterograde transport(GO:0035720) |
| 0.0 | 0.1 | GO:0071929 | alpha-tubulin acetylation(GO:0071929) |
| 0.0 | 0.2 | GO:0030070 | insulin processing(GO:0030070) |
| 0.0 | 0.2 | GO:0044861 | protein transport into plasma membrane raft(GO:0044861) |
| 0.0 | 0.5 | GO:0007342 | fusion of sperm to egg plasma membrane(GO:0007342) |
| 0.0 | 0.2 | GO:0072344 | rescue of stalled ribosome(GO:0072344) |
| 0.0 | 0.4 | GO:0014022 | neural plate elongation(GO:0014022) convergent extension involved in neural plate elongation(GO:0022007) |
| 0.0 | 0.4 | GO:0051574 | positive regulation of histone H3-K9 methylation(GO:0051574) |
| 0.0 | 0.3 | GO:0006297 | nucleotide-excision repair, DNA gap filling(GO:0006297) |
| 0.0 | 0.6 | GO:0016973 | poly(A)+ mRNA export from nucleus(GO:0016973) |
| 0.0 | 0.1 | GO:0019086 | late viral transcription(GO:0019086) |
| 0.0 | 0.2 | GO:0071763 | nuclear membrane organization(GO:0071763) |
| 0.0 | 0.1 | GO:0003363 | lamellipodium assembly involved in ameboidal cell migration(GO:0003363) extension of a leading process involved in cell motility in cerebral cortex radial glia guided migration(GO:0021816) |
| 0.0 | 0.2 | GO:0000101 | sulfur amino acid transport(GO:0000101) |
| 0.0 | 0.1 | GO:0098972 | dendritic transport of mitochondrion(GO:0098939) anterograde dendritic transport of mitochondrion(GO:0098972) |
| 0.0 | 0.3 | GO:1990785 | response to water-immersion restraint stress(GO:1990785) |
| 0.0 | 0.3 | GO:0009838 | abscission(GO:0009838) |
| 0.0 | 0.5 | GO:0043568 | positive regulation of insulin-like growth factor receptor signaling pathway(GO:0043568) |
| 0.0 | 0.1 | GO:0021849 | neuroblast division in subventricular zone(GO:0021849) |
| 0.0 | 0.3 | GO:0071233 | cellular response to leucine(GO:0071233) |
| 0.0 | 0.2 | GO:0071043 | CUT catabolic process(GO:0071034) CUT metabolic process(GO:0071043) |
| 0.0 | 0.4 | GO:0000338 | protein deneddylation(GO:0000338) |
| 0.0 | 0.1 | GO:0000920 | cell separation after cytokinesis(GO:0000920) |
| 0.0 | 0.1 | GO:0016476 | regulation of embryonic cell shape(GO:0016476) glomerular visceral epithelial cell migration(GO:0090521) |
| 0.0 | 0.3 | GO:0043951 | negative regulation of cAMP-mediated signaling(GO:0043951) |
| 0.0 | 0.1 | GO:2001045 | negative regulation of integrin-mediated signaling pathway(GO:2001045) |
| 0.0 | 0.7 | GO:0080182 | histone H3-K4 trimethylation(GO:0080182) |
| 0.0 | 0.4 | GO:0021670 | lateral ventricle development(GO:0021670) |
| 0.0 | 0.1 | GO:1904158 | axonemal central apparatus assembly(GO:1904158) |
| 0.0 | 0.2 | GO:0014886 | transition between slow and fast fiber(GO:0014886) |
| 0.0 | 0.1 | GO:0061188 | negative regulation of chromatin silencing at rDNA(GO:0061188) |
| 0.0 | 0.1 | GO:0042350 | GDP-L-fucose biosynthetic process(GO:0042350) |
| 0.0 | 0.1 | GO:0060178 | regulation of exocyst localization(GO:0060178) |
| 0.0 | 0.1 | GO:0030242 | pexophagy(GO:0030242) |
| 0.0 | 0.1 | GO:0006014 | D-ribose metabolic process(GO:0006014) |
| 0.0 | 0.5 | GO:0090161 | Golgi ribbon formation(GO:0090161) |
| 0.0 | 0.1 | GO:0019262 | N-acetylneuraminate catabolic process(GO:0019262) |
| 0.0 | 0.1 | GO:1904207 | regulation of chemokine (C-C motif) ligand 2 secretion(GO:1904207) positive regulation of chemokine (C-C motif) ligand 2 secretion(GO:1904209) |
| 0.0 | 0.2 | GO:0007217 | tachykinin receptor signaling pathway(GO:0007217) |
| 0.0 | 0.1 | GO:0006999 | nuclear pore organization(GO:0006999) |
| 0.0 | 1.3 | GO:0000245 | spliceosomal complex assembly(GO:0000245) |
| 0.0 | 0.4 | GO:0033235 | positive regulation of protein sumoylation(GO:0033235) |
| 0.0 | 0.2 | GO:0045046 | peroxisomal membrane transport(GO:0015919) protein import into peroxisome membrane(GO:0045046) |
| 0.0 | 0.5 | GO:0006607 | NLS-bearing protein import into nucleus(GO:0006607) |
| 0.0 | 0.3 | GO:0033539 | fatty acid beta-oxidation using acyl-CoA dehydrogenase(GO:0033539) |
| 0.0 | 0.1 | GO:1904098 | regulation of protein O-linked glycosylation(GO:1904098) positive regulation of protein O-linked glycosylation(GO:1904100) |
| 0.0 | 0.1 | GO:0015864 | pyrimidine nucleoside transport(GO:0015864) |
| 0.0 | 0.1 | GO:0010650 | positive regulation of cell communication by electrical coupling(GO:0010650) positive regulation of membrane depolarization during cardiac muscle cell action potential(GO:1900827) |
| 0.0 | 0.1 | GO:1903385 | regulation of homophilic cell adhesion(GO:1903385) |
| 0.0 | 0.3 | GO:0043970 | histone H3-K9 acetylation(GO:0043970) |
| 0.0 | 0.2 | GO:2000389 | regulation of neutrophil extravasation(GO:2000389) |
| 0.0 | 0.1 | GO:0018343 | protein farnesylation(GO:0018343) |
| 0.0 | 0.5 | GO:0045943 | positive regulation of transcription from RNA polymerase I promoter(GO:0045943) |
| 0.0 | 0.3 | GO:0016127 | cholesterol catabolic process(GO:0006707) sterol catabolic process(GO:0016127) |
| 0.0 | 0.1 | GO:0043504 | mitochondrial DNA repair(GO:0043504) |
| 0.0 | 0.2 | GO:0060236 | regulation of mitotic spindle organization(GO:0060236) |
| 0.0 | 0.2 | GO:0048633 | positive regulation of skeletal muscle tissue growth(GO:0048633) |
| 0.0 | 0.1 | GO:1901621 | negative regulation of smoothened signaling pathway involved in dorsal/ventral neural tube patterning(GO:1901621) |
| 0.0 | 0.1 | GO:1902037 | negative regulation of hematopoietic stem cell differentiation(GO:1902037) |
| 0.0 | 0.1 | GO:0035616 | histone H2B conserved C-terminal lysine deubiquitination(GO:0035616) |
| 0.0 | 0.2 | GO:0045292 | mRNA cis splicing, via spliceosome(GO:0045292) |
| 0.0 | 0.1 | GO:1905168 | positive regulation of double-strand break repair via homologous recombination(GO:1905168) |
| 0.0 | 0.2 | GO:1901642 | nucleoside transmembrane transport(GO:1901642) |
| 0.0 | 0.1 | GO:0048254 | snoRNA localization(GO:0048254) |
| 0.0 | 0.1 | GO:0043686 | co-translational protein modification(GO:0043686) |
| 0.0 | 0.1 | GO:0046504 | ether lipid biosynthetic process(GO:0008611) glycerol ether biosynthetic process(GO:0046504) ether biosynthetic process(GO:1901503) |
| 0.0 | 0.1 | GO:1902774 | late endosome to lysosome transport(GO:1902774) |
| 0.0 | 0.1 | GO:0035627 | ceramide transport(GO:0035627) |
| 0.0 | 0.2 | GO:1903350 | response to dopamine(GO:1903350) cellular response to dopamine(GO:1903351) |
| 0.0 | 0.1 | GO:0048386 | positive regulation of retinoic acid receptor signaling pathway(GO:0048386) |
| 0.0 | 0.1 | GO:0006995 | cellular response to nitrogen starvation(GO:0006995) cellular response to nitrogen levels(GO:0043562) |
| 0.0 | 0.8 | GO:0006284 | base-excision repair(GO:0006284) |
| 0.0 | 0.1 | GO:0046959 | habituation(GO:0046959) |
| 0.0 | 0.1 | GO:0044211 | CTP salvage(GO:0044211) |
| 0.0 | 0.1 | GO:0019388 | galactose catabolic process(GO:0019388) |
| 0.0 | 0.0 | GO:0018201 | peptidyl-glycine modification(GO:0018201) |
| 0.0 | 0.5 | GO:0007080 | mitotic metaphase plate congression(GO:0007080) |
| 0.0 | 0.1 | GO:1900170 | negative regulation of glucocorticoid mediated signaling pathway(GO:1900170) |
| 0.0 | 0.1 | GO:0006546 | glycine catabolic process(GO:0006546) glycine decarboxylation via glycine cleavage system(GO:0019464) |
| 0.0 | 0.1 | GO:0010992 | ubiquitin homeostasis(GO:0010992) |
| 0.0 | 0.1 | GO:0006449 | regulation of translational termination(GO:0006449) |
| 0.0 | 0.4 | GO:0046856 | phosphatidylinositol dephosphorylation(GO:0046856) |
| 0.0 | 0.2 | GO:0000301 | retrograde transport, vesicle recycling within Golgi(GO:0000301) |
| 0.0 | 0.1 | GO:0006751 | glutathione catabolic process(GO:0006751) |
| 0.0 | 0.2 | GO:0035434 | copper ion transmembrane transport(GO:0035434) |
| 0.0 | 0.1 | GO:0099525 | positive regulation of synaptic vesicle priming(GO:0010808) presynaptic dense core granule exocytosis(GO:0099525) |
| 0.0 | 0.3 | GO:0043968 | histone H2A acetylation(GO:0043968) |
| 0.0 | 0.1 | GO:0070317 | negative regulation of G0 to G1 transition(GO:0070317) |
| 0.0 | 0.0 | GO:0010265 | SCF complex assembly(GO:0010265) |
| 0.0 | 0.1 | GO:0044336 | canonical Wnt signaling pathway involved in negative regulation of apoptotic process(GO:0044336) |
| 0.0 | 0.2 | GO:0002031 | G-protein coupled receptor internalization(GO:0002031) |
| 0.0 | 0.1 | GO:0060336 | negative regulation of response to interferon-gamma(GO:0060331) negative regulation of interferon-gamma-mediated signaling pathway(GO:0060336) |
| 0.0 | 0.0 | GO:0031053 | primary miRNA processing(GO:0031053) |
| 0.0 | 0.3 | GO:2000369 | regulation of clathrin-mediated endocytosis(GO:2000369) |
| 0.0 | 0.0 | GO:0044565 | dendritic cell proliferation(GO:0044565) |
| 0.0 | 0.0 | GO:0060154 | cellular process regulating host cell cycle in response to virus(GO:0060154) |
| 0.0 | 0.1 | GO:0018344 | protein geranylgeranylation(GO:0018344) |
| 0.0 | 0.1 | GO:0000019 | regulation of mitotic recombination(GO:0000019) |
| 0.0 | 0.1 | GO:0032914 | positive regulation of transforming growth factor beta1 production(GO:0032914) |
| 0.0 | 0.2 | GO:0015937 | coenzyme A biosynthetic process(GO:0015937) |
| 0.0 | 0.2 | GO:0071108 | protein K48-linked deubiquitination(GO:0071108) |
| 0.0 | 0.1 | GO:1903847 | regulation of aorta morphogenesis(GO:1903847) positive regulation of aorta morphogenesis(GO:1903849) |
| 0.0 | 0.1 | GO:0010724 | regulation of definitive erythrocyte differentiation(GO:0010724) |
| 0.0 | 0.1 | GO:0070125 | mitochondrial translational elongation(GO:0070125) |
| 0.0 | 0.0 | GO:0032066 | nucleolus to nucleoplasm transport(GO:0032066) |
| 0.0 | 0.1 | GO:0070459 | prolactin secretion(GO:0070459) |
| 0.0 | 0.1 | GO:0035610 | protein side chain deglutamylation(GO:0035610) |
| 0.0 | 0.1 | GO:0010961 | cellular magnesium ion homeostasis(GO:0010961) |
| 0.0 | 0.1 | GO:0008298 | intracellular mRNA localization(GO:0008298) |
| 0.0 | 0.1 | GO:0030050 | vesicle transport along actin filament(GO:0030050) |
| 0.0 | 0.1 | GO:0098789 | pre-mRNA cleavage required for polyadenylation(GO:0098789) |
| 0.0 | 0.0 | GO:0070272 | proton-transporting ATP synthase complex assembly(GO:0043461) proton-transporting ATP synthase complex biogenesis(GO:0070272) |
| 0.0 | 1.6 | GO:0042177 | negative regulation of protein catabolic process(GO:0042177) |
| 0.0 | 0.1 | GO:0051823 | regulation of synapse structural plasticity(GO:0051823) |
| 0.0 | 0.1 | GO:0006564 | L-serine biosynthetic process(GO:0006564) |
| 0.0 | 0.2 | GO:0052646 | alditol phosphate metabolic process(GO:0052646) |
| 0.0 | 0.0 | GO:1901896 | positive regulation of calcium-transporting ATPase activity(GO:1901896) |
| 0.0 | 0.6 | GO:0045600 | positive regulation of fat cell differentiation(GO:0045600) |
| 0.0 | 0.2 | GO:0035024 | negative regulation of Rho protein signal transduction(GO:0035024) |
| 0.0 | 0.1 | GO:0000012 | single strand break repair(GO:0000012) |
| 0.0 | 0.0 | GO:1903069 | regulation of ER-associated ubiquitin-dependent protein catabolic process(GO:1903069) positive regulation of ER-associated ubiquitin-dependent protein catabolic process(GO:1903071) |
| 0.0 | 0.2 | GO:0051457 | maintenance of protein location in nucleus(GO:0051457) |
| 0.0 | 0.1 | GO:0060083 | smooth muscle contraction involved in micturition(GO:0060083) membrane depolarization during atrial cardiac muscle cell action potential(GO:0098912) |
| 0.0 | 0.1 | GO:2000819 | regulation of nucleotide-excision repair(GO:2000819) |
| 0.0 | 0.2 | GO:0045948 | positive regulation of translational initiation(GO:0045948) |
| 0.0 | 0.1 | GO:0070127 | tRNA aminoacylation for mitochondrial protein translation(GO:0070127) |
| 0.0 | 0.5 | GO:0045494 | photoreceptor cell maintenance(GO:0045494) |
| 0.0 | 0.1 | GO:0007175 | negative regulation of epidermal growth factor-activated receptor activity(GO:0007175) |
| 0.0 | 0.6 | GO:0045454 | cell redox homeostasis(GO:0045454) |
| 0.0 | 0.1 | GO:0070544 | histone H3-K36 demethylation(GO:0070544) |
| 0.0 | 0.1 | GO:2000628 | regulation of miRNA metabolic process(GO:2000628) |
Gene overrepresentation in cellular component category:
| Log-likelihood per target | Total log-likelihood | Term | Description |
|---|---|---|---|
| 0.4 | 1.1 | GO:0000839 | Hrd1p ubiquitin ligase ERAD-L complex(GO:0000839) |
| 0.2 | 0.6 | GO:0030956 | glutamyl-tRNA(Gln) amidotransferase complex(GO:0030956) |
| 0.1 | 0.6 | GO:0070044 | synaptobrevin 2-SNAP-25-syntaxin-1a complex(GO:0070044) |
| 0.1 | 0.5 | GO:0020003 | symbiont-containing vacuole(GO:0020003) |
| 0.1 | 0.3 | GO:1990423 | RZZ complex(GO:1990423) |
| 0.1 | 0.4 | GO:0032777 | Piccolo NuA4 histone acetyltransferase complex(GO:0032777) |
| 0.1 | 0.5 | GO:0005879 | axonemal microtubule(GO:0005879) |
| 0.1 | 0.2 | GO:0044611 | nuclear pore inner ring(GO:0044611) |
| 0.1 | 0.2 | GO:0033596 | TSC1-TSC2 complex(GO:0033596) |
| 0.1 | 0.2 | GO:0034750 | Scrib-APC-beta-catenin complex(GO:0034750) |
| 0.1 | 0.2 | GO:0097629 | extrinsic component of omegasome membrane(GO:0097629) |
| 0.1 | 0.4 | GO:0002142 | stereocilia ankle link complex(GO:0002142) |
| 0.1 | 0.3 | GO:0030689 | Noc complex(GO:0030689) |
| 0.1 | 0.2 | GO:0000172 | ribonuclease MRP complex(GO:0000172) |
| 0.0 | 0.4 | GO:0044615 | nuclear pore nuclear basket(GO:0044615) |
| 0.0 | 0.5 | GO:0071439 | clathrin complex(GO:0071439) |
| 0.0 | 0.7 | GO:0035102 | PRC1 complex(GO:0035102) |
| 0.0 | 0.4 | GO:0032584 | growth cone membrane(GO:0032584) |
| 0.0 | 0.2 | GO:0061689 | tricellular tight junction(GO:0061689) |
| 0.0 | 0.3 | GO:0035068 | micro-ribonucleoprotein complex(GO:0035068) |
| 0.0 | 0.2 | GO:0000214 | tRNA-intron endonuclease complex(GO:0000214) |
| 0.0 | 0.6 | GO:0071004 | U2-type prespliceosome(GO:0071004) |
| 0.0 | 1.2 | GO:0034451 | centriolar satellite(GO:0034451) |
| 0.0 | 0.1 | GO:0035101 | FACT complex(GO:0035101) |
| 0.0 | 0.2 | GO:0005638 | lamin filament(GO:0005638) |
| 0.0 | 0.4 | GO:0017119 | Golgi transport complex(GO:0017119) |
| 0.0 | 0.1 | GO:0009331 | glycerol-3-phosphate dehydrogenase complex(GO:0009331) |
| 0.0 | 0.2 | GO:0043203 | axon hillock(GO:0043203) |
| 0.0 | 2.1 | GO:0035097 | histone methyltransferase complex(GO:0035097) |
| 0.0 | 0.1 | GO:0005968 | Rab-protein geranylgeranyltransferase complex(GO:0005968) |
| 0.0 | 0.3 | GO:0070652 | HAUS complex(GO:0070652) |
| 0.0 | 0.1 | GO:1990745 | EARP complex(GO:1990745) |
| 0.0 | 0.5 | GO:0030014 | CCR4-NOT complex(GO:0030014) |
| 0.0 | 1.3 | GO:0005643 | nuclear pore(GO:0005643) |
| 0.0 | 0.1 | GO:0005683 | U7 snRNP(GO:0005683) |
| 0.0 | 0.3 | GO:0097542 | ciliary tip(GO:0097542) |
| 0.0 | 0.2 | GO:1990316 | ATG1/ULK1 kinase complex(GO:1990316) |
| 0.0 | 0.5 | GO:0002080 | acrosomal membrane(GO:0002080) |
| 0.0 | 0.2 | GO:0005736 | DNA-directed RNA polymerase I complex(GO:0005736) |
| 0.0 | 0.2 | GO:0031313 | extrinsic component of endosome membrane(GO:0031313) |
| 0.0 | 1.5 | GO:0005788 | endoplasmic reticulum lumen(GO:0005788) |
| 0.0 | 0.1 | GO:0071203 | WASH complex(GO:0071203) |
| 0.0 | 0.2 | GO:0000176 | nuclear exosome (RNase complex)(GO:0000176) |
| 0.0 | 0.1 | GO:0061700 | GATOR2 complex(GO:0061700) |
| 0.0 | 0.1 | GO:0033276 | transcription factor TFTC complex(GO:0033276) |
| 0.0 | 0.1 | GO:0000127 | transcription factor TFIIIC complex(GO:0000127) |
| 0.0 | 0.0 | GO:0005827 | polar microtubule(GO:0005827) |
| 0.0 | 0.1 | GO:0034455 | t-UTP complex(GO:0034455) |
| 0.0 | 0.2 | GO:0005832 | chaperonin-containing T-complex(GO:0005832) |
| 0.0 | 0.3 | GO:0070822 | Sin3-type complex(GO:0070822) |
| 0.0 | 0.1 | GO:0031262 | Ndc80 complex(GO:0031262) |
| 0.0 | 0.2 | GO:0051286 | cell tip(GO:0051286) |
| 0.0 | 0.7 | GO:0031672 | A band(GO:0031672) |
| 0.0 | 1.0 | GO:0031463 | Cul3-RING ubiquitin ligase complex(GO:0031463) |
| 0.0 | 0.1 | GO:0044305 | calyx of Held(GO:0044305) |
| 0.0 | 0.1 | GO:0005947 | mitochondrial alpha-ketoglutarate dehydrogenase complex(GO:0005947) |
| 0.0 | 0.2 | GO:0042581 | specific granule(GO:0042581) |
| 0.0 | 0.3 | GO:0000145 | exocyst(GO:0000145) |
| 0.0 | 0.2 | GO:0010369 | chromocenter(GO:0010369) |
| 0.0 | 0.0 | GO:0043190 | ATP-binding cassette (ABC) transporter complex(GO:0043190) |
| 0.0 | 0.3 | GO:0032040 | small-subunit processome(GO:0032040) |
| 0.0 | 0.1 | GO:0014731 | spectrin-associated cytoskeleton(GO:0014731) |
| 0.0 | 0.4 | GO:0008180 | COP9 signalosome(GO:0008180) |
| 0.0 | 0.1 | GO:0035859 | Seh1-associated complex(GO:0035859) Iml1 complex(GO:1990130) |
| 0.0 | 0.1 | GO:0044327 | dendritic spine head(GO:0044327) |
Gene overrepresentation in molecular function category:
| Log-likelihood per target | Total log-likelihood | Term | Description |
|---|---|---|---|
| 0.4 | 1.2 | GO:0004809 | tRNA (guanine-N2-)-methyltransferase activity(GO:0004809) |
| 0.2 | 0.6 | GO:0005483 | soluble NSF attachment protein activity(GO:0005483) |
| 0.2 | 0.6 | GO:0047708 | biotinidase activity(GO:0047708) |
| 0.2 | 0.6 | GO:0050567 | glutaminyl-tRNA synthase (glutamine-hydrolyzing) activity(GO:0050567) |
| 0.2 | 0.5 | GO:0015234 | thiamine transmembrane transporter activity(GO:0015234) |
| 0.1 | 0.8 | GO:0003847 | 1-alkyl-2-acetylglycerophosphocholine esterase activity(GO:0003847) |
| 0.1 | 0.4 | GO:0047635 | L-alanine:2-oxoglutarate aminotransferase activity(GO:0004021) alanine-oxo-acid transaminase activity(GO:0047635) |
| 0.1 | 0.3 | GO:0030626 | U12 snRNA binding(GO:0030626) |
| 0.1 | 0.3 | GO:0008396 | oxysterol 7-alpha-hydroxylase activity(GO:0008396) |
| 0.1 | 0.4 | GO:0044547 | DNA topoisomerase binding(GO:0044547) |
| 0.1 | 0.4 | GO:0001042 | RNA polymerase I core binding(GO:0001042) |
| 0.1 | 0.8 | GO:0070016 | armadillo repeat domain binding(GO:0070016) |
| 0.1 | 0.5 | GO:0070728 | leucine binding(GO:0070728) |
| 0.1 | 0.4 | GO:0000700 | mismatch base pair DNA N-glycosylase activity(GO:0000700) |
| 0.1 | 0.6 | GO:0008479 | queuine tRNA-ribosyltransferase activity(GO:0008479) |
| 0.1 | 0.3 | GO:0061676 | importin-alpha family protein binding(GO:0061676) |
| 0.1 | 0.3 | GO:0070883 | pre-miRNA binding(GO:0070883) |
| 0.1 | 0.3 | GO:0070568 | guanylyltransferase activity(GO:0070568) |
| 0.1 | 0.3 | GO:0000403 | Y-form DNA binding(GO:0000403) |
| 0.1 | 0.2 | GO:0051733 | ATP-dependent polydeoxyribonucleotide 5'-hydroxyl-kinase activity(GO:0046404) polydeoxyribonucleotide kinase activity(GO:0051733) ATP-dependent polynucleotide kinase activity(GO:0051734) |
| 0.1 | 0.7 | GO:1904264 | ubiquitin protein ligase activity involved in ERAD pathway(GO:1904264) |
| 0.1 | 0.3 | GO:0016427 | tRNA (cytosine) methyltransferase activity(GO:0016427) |
| 0.1 | 0.2 | GO:0050733 | RS domain binding(GO:0050733) |
| 0.1 | 0.2 | GO:0004594 | pantothenate kinase activity(GO:0004594) |
| 0.1 | 0.4 | GO:0004439 | phosphatidylinositol-4,5-bisphosphate 5-phosphatase activity(GO:0004439) |
| 0.1 | 0.5 | GO:0086080 | protein binding involved in heterotypic cell-cell adhesion(GO:0086080) |
| 0.1 | 0.2 | GO:0004711 | ribosomal protein S6 kinase activity(GO:0004711) |
| 0.1 | 0.2 | GO:0000171 | ribonuclease MRP activity(GO:0000171) |
| 0.0 | 0.2 | GO:0015137 | citrate transmembrane transporter activity(GO:0015137) |
| 0.0 | 0.1 | GO:0010484 | H3 histone acetyltransferase activity(GO:0010484) |
| 0.0 | 0.3 | GO:0048039 | ubiquinone binding(GO:0048039) |
| 0.0 | 0.4 | GO:0004703 | G-protein coupled receptor kinase activity(GO:0004703) |
| 0.0 | 0.3 | GO:0004652 | polynucleotide adenylyltransferase activity(GO:0004652) |
| 0.0 | 0.5 | GO:0051011 | microtubule minus-end binding(GO:0051011) |
| 0.0 | 0.8 | GO:0016864 | protein disulfide isomerase activity(GO:0003756) intramolecular oxidoreductase activity, transposing S-S bonds(GO:0016864) |
| 0.0 | 0.1 | GO:0071208 | histone pre-mRNA DCP binding(GO:0071208) U7 snRNA binding(GO:0071209) |
| 0.0 | 0.7 | GO:0017056 | structural constituent of nuclear pore(GO:0017056) |
| 0.0 | 0.1 | GO:0005290 | L-histidine transmembrane transporter activity(GO:0005290) |
| 0.0 | 0.4 | GO:0000182 | rDNA binding(GO:0000182) |
| 0.0 | 0.2 | GO:0052629 | phosphatidylinositol-3,5-bisphosphate 3-phosphatase activity(GO:0052629) |
| 0.0 | 0.2 | GO:0051864 | histone demethylase activity (H3-K36 specific)(GO:0051864) |
| 0.0 | 0.4 | GO:0001135 | transcription factor activity, RNA polymerase II transcription factor recruiting(GO:0001135) |
| 0.0 | 0.1 | GO:0003839 | gamma-glutamylcyclotransferase activity(GO:0003839) |
| 0.0 | 0.8 | GO:0004198 | calcium-dependent cysteine-type endopeptidase activity(GO:0004198) |
| 0.0 | 0.1 | GO:0016634 | oxidoreductase activity, acting on the CH-CH group of donors, oxygen as acceptor(GO:0016634) |
| 0.0 | 0.4 | GO:0016723 | oxidoreductase activity, oxidizing metal ions, NAD or NADP as acceptor(GO:0016723) |
| 0.0 | 0.1 | GO:0015184 | L-cystine transmembrane transporter activity(GO:0015184) |
| 0.0 | 0.3 | GO:0035612 | AP-2 adaptor complex binding(GO:0035612) |
| 0.0 | 0.1 | GO:0004367 | glycerol-3-phosphate dehydrogenase [NAD+] activity(GO:0004367) |
| 0.0 | 0.8 | GO:0044183 | protein binding involved in protein folding(GO:0044183) |
| 0.0 | 0.1 | GO:0009019 | tRNA (guanine-N1-)-methyltransferase activity(GO:0009019) |
| 0.0 | 0.1 | GO:0016833 | oxo-acid-lyase activity(GO:0016833) |
| 0.0 | 0.4 | GO:0046527 | glucosyltransferase activity(GO:0046527) |
| 0.0 | 0.2 | GO:0001054 | RNA polymerase I activity(GO:0001054) |
| 0.0 | 0.4 | GO:0003995 | acyl-CoA dehydrogenase activity(GO:0003995) |
| 0.0 | 0.6 | GO:0042800 | histone methyltransferase activity (H3-K4 specific)(GO:0042800) |
| 0.0 | 0.1 | GO:0061665 | SUMO ligase activity(GO:0061665) |
| 0.0 | 0.1 | GO:0030622 | U4atac snRNA binding(GO:0030622) |
| 0.0 | 0.2 | GO:0030911 | TPR domain binding(GO:0030911) |
| 0.0 | 0.2 | GO:0031730 | CCR5 chemokine receptor binding(GO:0031730) |
| 0.0 | 0.3 | GO:0000340 | RNA 7-methylguanosine cap binding(GO:0000340) |
| 0.0 | 0.2 | GO:0031419 | cobalamin binding(GO:0031419) |
| 0.0 | 0.6 | GO:0070840 | dynein complex binding(GO:0070840) |
| 0.0 | 0.1 | GO:0019961 | interferon binding(GO:0019961) |
| 0.0 | 0.1 | GO:0016300 | tRNA (uracil) methyltransferase activity(GO:0016300) |
| 0.0 | 0.2 | GO:0005375 | copper ion transmembrane transporter activity(GO:0005375) |
| 0.0 | 0.2 | GO:0016286 | small conductance calcium-activated potassium channel activity(GO:0016286) |
| 0.0 | 0.5 | GO:0000983 | transcription factor activity, RNA polymerase II core promoter sequence-specific(GO:0000983) |
| 0.0 | 0.5 | GO:0008139 | nuclear localization sequence binding(GO:0008139) |
| 0.0 | 0.2 | GO:0015093 | ferrous iron transmembrane transporter activity(GO:0015093) |
| 0.0 | 0.4 | GO:0017160 | Ral GTPase binding(GO:0017160) |
| 0.0 | 0.2 | GO:0004385 | guanylate kinase activity(GO:0004385) |
| 0.0 | 0.1 | GO:0031544 | peptidyl-proline 3-dioxygenase activity(GO:0031544) |
| 0.0 | 0.3 | GO:0051400 | BH domain binding(GO:0051400) |
| 0.0 | 1.6 | GO:0002039 | p53 binding(GO:0002039) |
| 0.0 | 0.1 | GO:0035243 | protein-arginine omega-N symmetric methyltransferase activity(GO:0035243) |
| 0.0 | 0.1 | GO:0005078 | MAP-kinase scaffold activity(GO:0005078) |
| 0.0 | 0.1 | GO:0004307 | ethanolaminephosphotransferase activity(GO:0004307) |
| 0.0 | 0.3 | GO:0009982 | pseudouridine synthase activity(GO:0009982) |
| 0.0 | 0.2 | GO:0016868 | intramolecular transferase activity, phosphotransferases(GO:0016868) |
| 0.0 | 0.3 | GO:0004622 | lysophospholipase activity(GO:0004622) |
| 0.0 | 0.0 | GO:0016414 | carnitine O-octanoyltransferase activity(GO:0008458) O-octanoyltransferase activity(GO:0016414) |
| 0.0 | 0.1 | GO:0070699 | type II activin receptor binding(GO:0070699) |
| 0.0 | 0.1 | GO:0046624 | sphingolipid transporter activity(GO:0046624) |
| 0.0 | 0.1 | GO:0008569 | ATP-dependent microtubule motor activity, minus-end-directed(GO:0008569) |
| 0.0 | 0.1 | GO:0004169 | dolichyl-phosphate-mannose-protein mannosyltransferase activity(GO:0004169) |
| 0.0 | 0.4 | GO:1990841 | promoter-specific chromatin binding(GO:1990841) |
| 0.0 | 2.2 | GO:0001078 | transcriptional repressor activity, RNA polymerase II core promoter proximal region sequence-specific binding(GO:0001078) |
| 0.0 | 0.8 | GO:0030374 | ligand-dependent nuclear receptor transcription coactivator activity(GO:0030374) |
| 0.0 | 0.6 | GO:0035255 | ionotropic glutamate receptor binding(GO:0035255) |
| 0.0 | 0.4 | GO:0032452 | histone demethylase activity(GO:0032452) |
| 0.0 | 0.5 | GO:0015932 | nucleobase-containing compound transmembrane transporter activity(GO:0015932) |
| 0.0 | 0.0 | GO:0001847 | opsonin receptor activity(GO:0001847) |
| 0.0 | 0.2 | GO:0008484 | sulfuric ester hydrolase activity(GO:0008484) |
| 0.0 | 0.1 | GO:0004849 | uridine kinase activity(GO:0004849) |
| 0.0 | 0.2 | GO:0008417 | fucosyltransferase activity(GO:0008417) |
| 0.0 | 0.0 | GO:0032296 | ribonuclease III activity(GO:0004525) double-stranded RNA-specific ribonuclease activity(GO:0032296) |
| 0.0 | 0.2 | GO:0003993 | acid phosphatase activity(GO:0003993) |
| 0.0 | 0.1 | GO:0016004 | phospholipase activator activity(GO:0016004) |
| 0.0 | 0.1 | GO:0051880 | G-quadruplex DNA binding(GO:0051880) |
| 0.0 | 0.1 | GO:0008318 | protein prenyltransferase activity(GO:0008318) |
| 0.0 | 0.1 | GO:0004571 | mannosyl-oligosaccharide 1,2-alpha-mannosidase activity(GO:0004571) |
| 0.0 | 0.0 | GO:0004706 | JUN kinase kinase kinase activity(GO:0004706) |
| 0.0 | 0.1 | GO:0072542 | protein phosphatase activator activity(GO:0072542) |
| 0.0 | 0.1 | GO:0016857 | racemase and epimerase activity, acting on carbohydrates and derivatives(GO:0016857) |
| 0.0 | 0.3 | GO:0008376 | acetylgalactosaminyltransferase activity(GO:0008376) |
| 0.0 | 0.1 | GO:0098599 | palmitoyl-(protein) hydrolase activity(GO:0008474) palmitoyl hydrolase activity(GO:0098599) |
| 0.0 | 0.0 | GO:0043404 | corticotrophin-releasing factor receptor activity(GO:0015056) corticotropin-releasing hormone receptor activity(GO:0043404) |
| 0.0 | 0.1 | GO:0008297 | single-stranded DNA exodeoxyribonuclease activity(GO:0008297) |
| 0.0 | 0.1 | GO:0086056 | voltage-gated calcium channel activity involved in AV node cell action potential(GO:0086056) |
| 0.0 | 0.2 | GO:0017049 | GTP-Rho binding(GO:0017049) |
| 0.0 | 0.5 | GO:0004402 | histone acetyltransferase activity(GO:0004402) |
Gene overrepresentation in curated gene sets: canonical pathways category:
| Log-likelihood per target | Total log-likelihood | Term | Description |
|---|---|---|---|
| 0.0 | 0.9 | SA CASPASE CASCADE | Apoptosis is mediated by caspases, cysteine proteases arranged in a proteolytic cascade. |
| 0.0 | 0.7 | PID MYC PATHWAY | C-MYC pathway |
| 0.0 | 0.2 | PID CIRCADIAN PATHWAY | Circadian rhythm pathway |
| 0.0 | 0.2 | PID SMAD2 3PATHWAY | Regulation of cytoplasmic and nuclear SMAD2/3 signaling |
| 0.0 | 0.7 | PID LKB1 PATHWAY | LKB1 signaling events |
Gene overrepresentation in curated gene sets: REACTOME pathways category:
| Log-likelihood per target | Total log-likelihood | Term | Description |
|---|---|---|---|
| 0.2 | 0.5 | REACTOME CYCLIN E ASSOCIATED EVENTS DURING G1 S TRANSITION | Genes involved in Cyclin E associated events during G1/S transition |
| 0.1 | 0.7 | REACTOME APOPTOSIS INDUCED DNA FRAGMENTATION | Genes involved in Apoptosis induced DNA fragmentation |
| 0.1 | 1.2 | REACTOME PRE NOTCH PROCESSING IN GOLGI | Genes involved in Pre-NOTCH Processing in Golgi |
| 0.0 | 0.4 | REACTOME MRNA DECAY BY 3 TO 5 EXORIBONUCLEASE | Genes involved in mRNA Decay by 3' to 5' Exoribonuclease |
| 0.0 | 0.8 | REACTOME TRANSPORT OF RIBONUCLEOPROTEINS INTO THE HOST NUCLEUS | Genes involved in Transport of Ribonucleoproteins into the Host Nucleus |
| 0.0 | 0.5 | REACTOME HYALURONAN METABOLISM | Genes involved in Hyaluronan metabolism |
| 0.0 | 0.3 | REACTOME SYNTHESIS OF BILE ACIDS AND BILE SALTS VIA 24 HYDROXYCHOLESTEROL | Genes involved in Synthesis of bile acids and bile salts via 24-hydroxycholesterol |
| 0.0 | 0.2 | REACTOME REGULATION OF RHEB GTPASE ACTIVITY BY AMPK | Genes involved in Regulation of Rheb GTPase activity by AMPK |
| 0.0 | 0.4 | REACTOME BRANCHED CHAIN AMINO ACID CATABOLISM | Genes involved in Branched-chain amino acid catabolism |
| 0.0 | 0.4 | REACTOME AMINO ACID SYNTHESIS AND INTERCONVERSION TRANSAMINATION | Genes involved in Amino acid synthesis and interconversion (transamination) |
| 0.0 | 0.2 | REACTOME ENERGY DEPENDENT REGULATION OF MTOR BY LKB1 AMPK | Genes involved in Energy dependent regulation of mTOR by LKB1-AMPK |
| 0.0 | 0.3 | REACTOME BASE FREE SUGAR PHOSPHATE REMOVAL VIA THE SINGLE NUCLEOTIDE REPLACEMENT PATHWAY | Genes involved in Base-free sugar-phosphate removal via the single-nucleotide replacement pathway |
| 0.0 | 0.5 | REACTOME DEADENYLATION OF MRNA | Genes involved in Deadenylation of mRNA |
| 0.0 | 0.6 | REACTOME CIRCADIAN REPRESSION OF EXPRESSION BY REV ERBA | Genes involved in Circadian Repression of Expression by REV-ERBA |
| 0.0 | 0.2 | REACTOME THE ACTIVATION OF ARYLSULFATASES | Genes involved in The activation of arylsulfatases |
| 0.0 | 0.2 | REACTOME SYNTHESIS OF PIPS AT THE LATE ENDOSOME MEMBRANE | Genes involved in Synthesis of PIPs at the late endosome membrane |
| 0.0 | 0.3 | REACTOME MICRORNA MIRNA BIOGENESIS | Genes involved in MicroRNA (miRNA) Biogenesis |
| 0.0 | 0.2 | REACTOME VITAMIN B5 PANTOTHENATE METABOLISM | Genes involved in Vitamin B5 (pantothenate) metabolism |
| 0.0 | 0.4 | REACTOME PROCESSING OF INTRONLESS PRE MRNAS | Genes involved in Processing of Intronless Pre-mRNAs |
| 0.0 | 0.4 | REACTOME INSULIN SYNTHESIS AND PROCESSING | Genes involved in Insulin Synthesis and Processing |
| 0.0 | 0.1 | REACTOME RECYCLING PATHWAY OF L1 | Genes involved in Recycling pathway of L1 |
| 0.0 | 0.2 | REACTOME TRAF3 DEPENDENT IRF ACTIVATION PATHWAY | Genes involved in TRAF3-dependent IRF activation pathway |
| 0.0 | 0.1 | REACTOME PROCESSING OF CAPPED INTRONLESS PRE MRNA | Genes involved in Processing of Capped Intronless Pre-mRNA |
| 0.0 | 0.2 | REACTOME DOPAMINE NEUROTRANSMITTER RELEASE CYCLE | Genes involved in Dopamine Neurotransmitter Release Cycle |
| 0.0 | 0.1 | REACTOME CS DS DEGRADATION | Genes involved in CS/DS degradation |
| 0.0 | 0.1 | REACTOME NOTCH HLH TRANSCRIPTION PATHWAY | Genes involved in Notch-HLH transcription pathway |
| 0.0 | 0.3 | REACTOME SMAD2 SMAD3 SMAD4 HETEROTRIMER REGULATES TRANSCRIPTION | Genes involved in SMAD2/SMAD3:SMAD4 heterotrimer regulates transcription |
| 0.0 | 0.1 | REACTOME CALNEXIN CALRETICULIN CYCLE | Genes involved in Calnexin/calreticulin cycle |
| 0.0 | 0.4 | REACTOME PIP3 ACTIVATES AKT SIGNALING | Genes involved in PIP3 activates AKT signaling |
| 0.0 | 0.2 | REACTOME PRE NOTCH EXPRESSION AND PROCESSING | Genes involved in Pre-NOTCH Expression and Processing |
| 0.0 | 0.1 | REACTOME GLUTAMATE NEUROTRANSMITTER RELEASE CYCLE | Genes involved in Glutamate Neurotransmitter Release Cycle |