Project
GSE49485: Hypoxia transcriptome sequencing of rat brain.
Navigation
Downloads
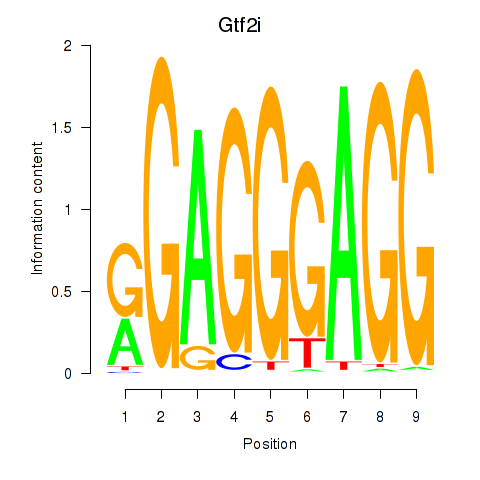
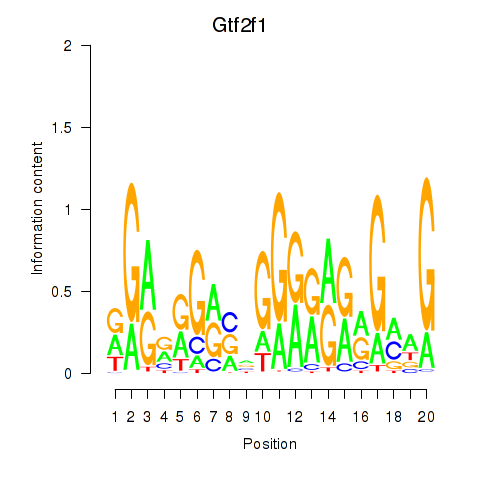
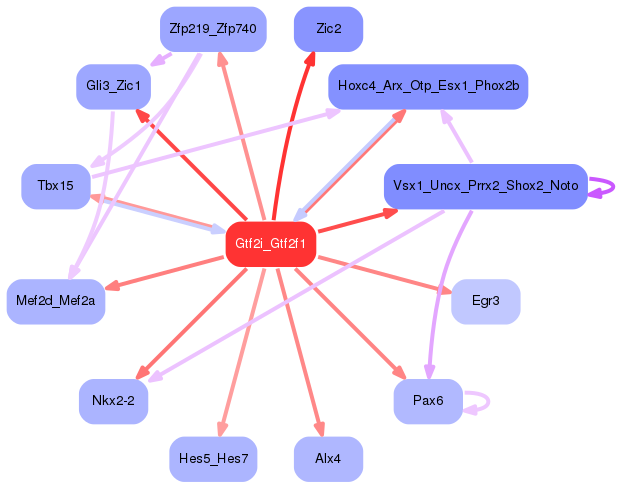
Results for Gtf2i_Gtf2f1
Z-value: 1.96
Motif logo
Transcription factors associated with Gtf2i_Gtf2f1
| Gene Symbol | Gene ID | Gene Info |
|---|---|---|
|
Gtf2i
|
ENSRNOG00000001479 | general transcription factor II I |
|
Gtf2f1
|
ENSRNOG00000047134 | general transcription factor IIF subunit 1 |
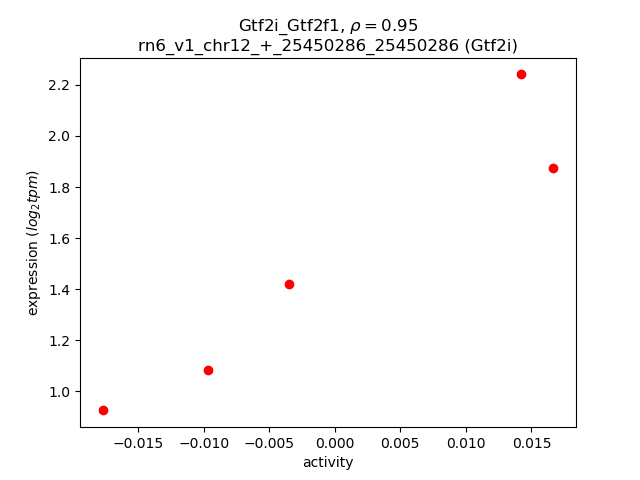
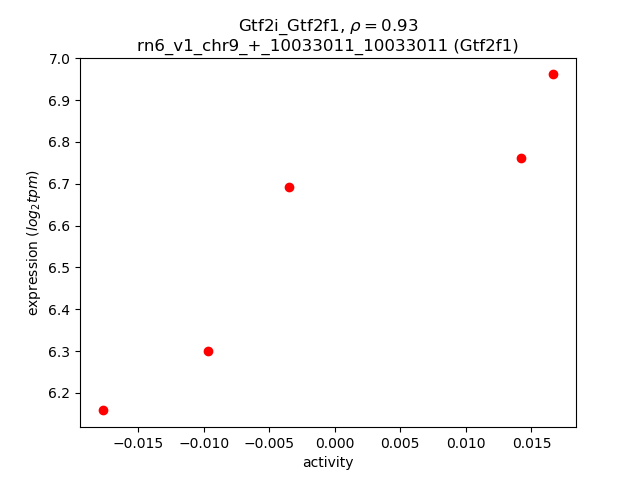
Activity-expression correlation:
| Gene | Promoter | Pearson corr. coef. | P-value | Plot |
|---|---|---|---|---|
| Gtf2i | rn6_v1_chr12_+_25450286_25450286 | 0.95 | 1.3e-02 | Click! |
| Gtf2f1 | rn6_v1_chr9_+_10033011_10033011 | 0.93 | 2.0e-02 | Click! |
Activity profile of Gtf2i_Gtf2f1 motif
Sorted Z-values of Gtf2i_Gtf2f1 motif
| Promoter | Log-likelihood | Transcript | Gene | Gene Info |
|---|---|---|---|---|
| chr14_-_6679878 | 3.17 |
ENSRNOT00000075989
ENSRNOT00000067875 |
Spp1
|
secreted phosphoprotein 1 |
| chr20_+_5535432 | 1.94 |
ENSRNOT00000040859
|
Syngap1
|
synaptic Ras GTPase activating protein 1 |
| chr15_+_108908607 | 1.77 |
ENSRNOT00000089455
|
Zic2
|
Zic family member 2 |
| chr8_-_98738446 | 1.54 |
ENSRNOT00000019860
|
Zic1
|
Zic family member 1 |
| chr20_+_5067330 | 1.48 |
ENSRNOT00000037482
|
Ly6g6e
|
lymphocyte antigen 6 complex, locus G6E |
| chr12_-_17186679 | 1.47 |
ENSRNOT00000001730
|
Uncx
|
UNC homeobox |
| chrX_-_124464963 | 1.28 |
ENSRNOT00000036472
ENSRNOT00000077697 |
Tmem255a
|
transmembrane protein 255A |
| chr1_+_226435979 | 1.24 |
ENSRNOT00000048704
ENSRNOT00000036232 ENSRNOT00000035576 ENSRNOT00000036180 ENSRNOT00000036168 ENSRNOT00000047964 ENSRNOT00000036283 ENSRNOT00000007429 |
Syt7
|
synaptotagmin 7 |
| chr12_-_38782010 | 1.16 |
ENSRNOT00000001813
|
Wdr66
|
WD repeat domain 66 |
| chr1_-_101046208 | 1.10 |
ENSRNOT00000091711
|
Prr12
|
proline rich 12 |
| chr12_-_44381289 | 1.07 |
ENSRNOT00000001493
|
Nos1
|
nitric oxide synthase 1 |
| chr12_+_27155587 | 1.07 |
ENSRNOT00000044800
|
AABR07035916.1
|
|
| chr3_-_141411170 | 1.00 |
ENSRNOT00000017364
|
Nkx2-2
|
NK2 homeobox 2 |
| chrX_+_62363953 | 0.97 |
ENSRNOT00000083362
|
Arx
|
aristaless related homeobox |
| chr17_+_6909728 | 0.96 |
ENSRNOT00000061231
|
LOC681410
|
hypothetical protein LOC681410 |
| chr20_+_3149114 | 0.96 |
ENSRNOT00000084770
|
RT1-N2
|
RT1 class Ib, locus N2 |
| chr16_-_20097287 | 0.94 |
ENSRNOT00000025162
|
Unc13a
|
unc-13 homolog A |
| chr8_+_49418965 | 0.93 |
ENSRNOT00000021819
|
Scn2b
|
sodium voltage-gated channel beta subunit 2 |
| chr1_+_100297152 | 0.93 |
ENSRNOT00000026100
|
Shank1
|
SH3 and multiple ankyrin repeat domains 1 |
| chr2_+_187512164 | 0.89 |
ENSRNOT00000051394
|
Mef2d
|
myocyte enhancer factor 2D |
| chr13_+_90723092 | 0.88 |
ENSRNOT00000010146
|
Kcnj10
|
ATP-sensitive inward rectifier potassium channel 10 |
| chr2_+_155555840 | 0.83 |
ENSRNOT00000080951
|
AABR07010944.1
|
|
| chr12_-_2592838 | 0.82 |
ENSRNOT00000079918
|
Evi5l
|
ecotropic viral integration site 5-like |
| chr3_+_95715193 | 0.82 |
ENSRNOT00000089525
|
Pax6
|
paired box 6 |
| chr15_+_51756978 | 0.81 |
ENSRNOT00000024067
|
Egr3
|
early growth response 3 |
| chr3_+_82548959 | 0.79 |
ENSRNOT00000000009
|
Alx4
|
ALX homeobox 4 |
| chrX_+_74200972 | 0.76 |
ENSRNOT00000076956
|
Chic1
|
cysteine-rich hydrophobic domain 1 |
| chr7_-_123445613 | 0.73 |
ENSRNOT00000070937
|
Shisa8
|
shisa family member 8 |
| chr3_-_143063983 | 0.73 |
ENSRNOT00000006329
|
Napb
|
NSF attachment protein beta |
| chr1_+_45923222 | 0.71 |
ENSRNOT00000092976
ENSRNOT00000084454 ENSRNOT00000022939 |
Arid1b
|
AT-rich interaction domain 1B |
| chr10_-_47724499 | 0.71 |
ENSRNOT00000085011
|
Rnf112
|
ring finger protein 112 |
| chr15_-_28406046 | 0.68 |
ENSRNOT00000015418
|
Zfp219
|
zinc finger protein 219 |
| chrX_-_152642531 | 0.68 |
ENSRNOT00000085037
|
Gabra3
|
gamma-aminobutyric acid type A receptor alpha3 subunit |
| chr1_+_198690794 | 0.67 |
ENSRNOT00000023999
|
Zfp771
|
zinc finger protein 771 |
| chr16_+_7303578 | 0.66 |
ENSRNOT00000025656
|
Sema3g
|
semaphorin 3G |
| chr7_+_70364813 | 0.66 |
ENSRNOT00000084012
ENSRNOT00000031230 |
Agap2
|
ArfGAP with GTPase domain, ankyrin repeat and PH domain 2 |
| chr18_-_18079560 | 0.65 |
ENSRNOT00000072093
|
AABR07031533.1
|
|
| chr15_-_34550850 | 0.65 |
ENSRNOT00000027794
ENSRNOT00000090228 |
Cbln3
|
cerebellin 3 precursor |
| chr7_-_139318455 | 0.65 |
ENSRNOT00000092029
|
Hdac7
|
histone deacetylase 7 |
| chr8_+_40009691 | 0.63 |
ENSRNOT00000042679
|
Vsig2
|
V-set and immunoglobulin domain containing 2 |
| chr10_-_64657089 | 0.63 |
ENSRNOT00000080703
|
Abr
|
active BCR-related |
| chr12_+_29266602 | 0.63 |
ENSRNOT00000076194
|
Wbscr17
|
Williams-Beuren syndrome chromosome region 17 |
| chr1_+_78025995 | 0.62 |
ENSRNOT00000086396
|
Slc8a2
|
solute carrier family 8 member A2 |
| chr11_+_83048636 | 0.62 |
ENSRNOT00000002408
|
RGD1562339
|
RGD1562339 |
| chr10_+_67325347 | 0.61 |
ENSRNOT00000079002
ENSRNOT00000085914 |
Suz12
|
suppressor of zeste 12 homolog (Drosophila) |
| chr2_+_201289357 | 0.60 |
ENSRNOT00000067358
|
Tbx15
|
T-box 15 |
| chr7_-_2588843 | 0.59 |
ENSRNOT00000088619
|
Rbms2
|
RNA binding motif, single stranded interacting protein 2 |
| chr2_-_177924970 | 0.58 |
ENSRNOT00000029340
|
Rapgef2
|
Rap guanine nucleotide exchange factor 2 |
| chr18_+_27558089 | 0.58 |
ENSRNOT00000027499
|
Fam53c
|
family with sequence similarity 53, member C |
| chr15_+_34520142 | 0.57 |
ENSRNOT00000074659
|
Nynrin
|
NYN domain and retroviral integrase containing |
| chr5_-_75319765 | 0.57 |
ENSRNOT00000085698
|
Svep1
|
sushi, von Willebrand factor type A, EGF and pentraxin domain containing 1 |
| chrX_+_105239840 | 0.56 |
ENSRNOT00000039864
|
Drp2
|
dystrophin related protein 2 |
| chr18_-_80865584 | 0.56 |
ENSRNOT00000021750
|
Tshz1
|
teashirt zinc finger homeobox 1 |
| chr10_+_56627411 | 0.56 |
ENSRNOT00000089108
ENSRNOT00000068493 |
Dlg4
|
discs large MAGUK scaffold protein 4 |
| chr17_-_1085885 | 0.54 |
ENSRNOT00000026287
|
Ptch1
|
patched 1 |
| chr10_+_55707164 | 0.54 |
ENSRNOT00000009757
|
Hes7
|
hes family bHLH transcription factor 7 |
| chr9_-_88086488 | 0.53 |
ENSRNOT00000019579
|
Irs1
|
insulin receptor substrate 1 |
| chr6_+_35314444 | 0.52 |
ENSRNOT00000005666
|
Osr1
|
odd-skipped related transciption factor 1 |
| chr20_+_12658065 | 0.52 |
ENSRNOT00000072951
ENSRNOT00000001679 |
Col6a1
|
collagen type VI alpha 1 chain |
| chr18_-_55916220 | 0.52 |
ENSRNOT00000025934
|
Synpo
|
synaptopodin |
| chr10_+_61685645 | 0.52 |
ENSRNOT00000003933
|
Mnt
|
MAX network transcriptional repressor |
| chr9_-_63637677 | 0.50 |
ENSRNOT00000049259
|
Satb2
|
SATB homeobox 2 |
| chr3_+_161433410 | 0.50 |
ENSRNOT00000024657
|
Slc12a5
|
solute carrier family 12 member 5 |
| chr7_-_118396728 | 0.50 |
ENSRNOT00000066431
|
Rbfox2
|
RNA binding protein, fox-1 homolog 2 |
| chr2_+_196608496 | 0.50 |
ENSRNOT00000091681
|
Arnt
|
aryl hydrocarbon receptor nuclear translocator |
| chr11_+_57207656 | 0.49 |
ENSRNOT00000038207
ENSRNOT00000085754 |
Plcxd2
|
phosphatidylinositol-specific phospholipase C, X domain containing 2 |
| chr13_-_51076852 | 0.49 |
ENSRNOT00000078993
|
Adora1
|
adenosine A1 receptor |
| chr5_-_75319189 | 0.49 |
ENSRNOT00000047200
|
Svep1
|
sushi, von Willebrand factor type A, EGF and pentraxin domain containing 1 |
| chr19_+_41482728 | 0.49 |
ENSRNOT00000022943
|
Calb2
|
calbindin 2 |
| chr10_-_86554478 | 0.49 |
ENSRNOT00000049621
|
Ormdl3
|
ORMDL sphingolipid biosynthesis regulator 3 |
| chr10_+_11786121 | 0.49 |
ENSRNOT00000033919
|
Slx4
|
SLX4 structure-specific endonuclease subunit |
| chr12_+_41073824 | 0.49 |
ENSRNOT00000001844
|
Rph3a
|
rabphilin 3A |
| chr17_-_1093873 | 0.48 |
ENSRNOT00000086130
|
Ptch1
|
patched 1 |
| chr4_+_142453013 | 0.48 |
ENSRNOT00000056573
|
AABR07061755.1
|
|
| chr17_-_10952441 | 0.48 |
ENSRNOT00000024580
|
Hrh2
|
histamine receptor H 2 |
| chr18_-_49937522 | 0.47 |
ENSRNOT00000033254
|
Zfp608
|
zinc finger protein 608 |
| chr1_-_43638161 | 0.47 |
ENSRNOT00000024460
|
Ipcef1
|
interaction protein for cytohesin exchange factors 1 |
| chr17_-_10766253 | 0.47 |
ENSRNOT00000000117
|
Cplx2
|
complexin 2 |
| chr2_-_186515135 | 0.46 |
ENSRNOT00000077375
|
Kirrel
|
kin of IRRE like (Drosophila) |
| chr4_-_159697207 | 0.46 |
ENSRNOT00000086440
|
Ccnd2
|
cyclin D2 |
| chr12_+_13353750 | 0.45 |
ENSRNOT00000052327
|
Zfp316
|
zinc finger protein 316 |
| chr3_-_119405453 | 0.45 |
ENSRNOT00000090355
|
Sppl2a
|
signal peptide peptidase-like 2A |
| chr5_-_153840178 | 0.45 |
ENSRNOT00000025075
|
Nipal3
|
NIPA-like domain containing 3 |
| chr19_-_58735173 | 0.45 |
ENSRNOT00000030077
|
Pcnx2
|
pecanex homolog 2 (Drosophila) |
| chr2_+_196334626 | 0.44 |
ENSRNOT00000050914
ENSRNOT00000028645 ENSRNOT00000090729 |
Sema6c
|
semaphorin 6C |
| chr1_+_199196059 | 0.44 |
ENSRNOT00000090428
|
Fbxl19
|
F-box and leucine-rich repeat protein 19 |
| chr7_+_25919867 | 0.44 |
ENSRNOT00000009625
ENSRNOT00000090153 |
Ric8b
|
RIC8 guanine nucleotide exchange factor B |
| chr8_+_48925604 | 0.44 |
ENSRNOT00000077445
|
Ddx6
|
DEAD-box helicase 6 |
| chr19_+_53723822 | 0.44 |
ENSRNOT00000023478
|
RGD1304884
|
similar to RIKEN cDNA 6430548M08 |
| chr15_+_15275541 | 0.43 |
ENSRNOT00000012153
|
Cadps
|
calcium dependent secretion activator |
| chr1_-_78224319 | 0.43 |
ENSRNOT00000075700
|
Ccdc9
|
coiled-coil domain containing 9 |
| chr18_-_37776453 | 0.43 |
ENSRNOT00000087876
|
Dpysl3
|
dihydropyrimidinase-like 3 |
| chr15_-_33775109 | 0.43 |
ENSRNOT00000033722
|
Jph4
|
junctophilin 4 |
| chr7_-_117587103 | 0.43 |
ENSRNOT00000035423
|
Scrt1
|
scratch family transcriptional repressor 1 |
| chr6_+_132702448 | 0.43 |
ENSRNOT00000005743
|
Yy1
|
YY1 transcription factor |
| chr9_-_28972835 | 0.42 |
ENSRNOT00000086967
ENSRNOT00000079684 |
Rims1
|
regulating synaptic membrane exocytosis 1 |
| chr6_-_146195819 | 0.42 |
ENSRNOT00000007625
|
Sp4
|
Sp4 transcription factor |
| chr1_-_31881531 | 0.42 |
ENSRNOT00000081225
|
Tppp
|
tubulin polymerization promoting protein |
| chr7_-_28040510 | 0.42 |
ENSRNOT00000005674
|
Ascl1
|
achaete-scute family bHLH transcription factor 1 |
| chr14_+_9226125 | 0.41 |
ENSRNOT00000088047
|
Wdfy3
|
WD repeat and FYVE domain containing 3 |
| chr14_-_82287108 | 0.41 |
ENSRNOT00000023144
|
Fgfr3
|
fibroblast growth factor receptor 3 |
| chr7_-_12275609 | 0.41 |
ENSRNOT00000086061
|
Apc2
|
APC2, WNT signaling pathway regulator |
| chr5_-_59085676 | 0.41 |
ENSRNOT00000068105
|
Msmp
|
microseminoprotein, prostate associated |
| chr7_-_2588686 | 0.41 |
ENSRNOT00000048848
|
Rbms2
|
RNA binding motif, single stranded interacting protein 2 |
| chr10_-_74679858 | 0.41 |
ENSRNOT00000003859
|
Ppm1e
|
protein phosphatase, Mg2+/Mn2+ dependent, 1E |
| chr13_+_71110064 | 0.40 |
ENSRNOT00000088329
|
Rgs8
|
regulator of G-protein signaling 8 |
| chr8_+_44847157 | 0.40 |
ENSRNOT00000080288
|
Clmp
|
CXADR-like membrane protein |
| chr20_+_5262946 | 0.40 |
ENSRNOT00000082900
|
Brd2
|
bromodomain containing 2 |
| chr1_-_255976425 | 0.40 |
ENSRNOT00000085303
|
Ide
|
insulin degrading enzyme |
| chr11_-_65209268 | 0.40 |
ENSRNOT00000077612
|
Gsk3b
|
glycogen synthase kinase 3 beta |
| chr10_-_85684138 | 0.40 |
ENSRNOT00000017989
|
Pip4k2b
|
phosphatidylinositol-5-phosphate 4-kinase type 2 beta |
| chr1_+_79831534 | 0.39 |
ENSRNOT00000057965
|
Nova2
|
NOVA alternative splicing regulator 2 |
| chr12_-_36398206 | 0.39 |
ENSRNOT00000090944
ENSRNOT00000058492 |
Tmem132b
|
transmembrane protein 132B |
| chr14_-_78902063 | 0.39 |
ENSRNOT00000088469
|
Ppp2r2c
|
protein phosphatase 2, regulatory subunit B, gamma |
| chr13_-_72893187 | 0.39 |
ENSRNOT00000004704
|
RGD1304622
|
similar to 6820428L09 protein |
| chr2_-_196582997 | 0.39 |
ENSRNOT00000081672
|
AABR07012475.1
|
|
| chr5_+_63781801 | 0.38 |
ENSRNOT00000008302
|
Nr4a3
|
nuclear receptor subfamily 4, group A, member 3 |
| chrX_+_128416722 | 0.38 |
ENSRNOT00000009336
ENSRNOT00000085110 |
Xiap
|
X-linked inhibitor of apoptosis |
| chr2_+_262914327 | 0.38 |
ENSRNOT00000029312
|
Negr1
|
neuronal growth regulator 1 |
| chr1_-_85300825 | 0.38 |
ENSRNOT00000057073
ENSRNOT00000026900 |
Lrfn1
|
leucine rich repeat and fibronectin type III domain containing 1 |
| chr1_+_218466289 | 0.38 |
ENSRNOT00000017948
|
Mrgprf
|
MAS related GPR family member F |
| chr3_-_152382529 | 0.38 |
ENSRNOT00000027076
|
Scand1
|
SCAN domain-containing 1 |
| chr12_+_21767606 | 0.38 |
ENSRNOT00000059602
|
LOC103691013
|
neuronal tyrosine-phosphorylated phosphoinositide-3-kinase adapter 1-like |
| chrX_-_123662350 | 0.37 |
ENSRNOT00000092624
|
Sept6
|
septin 6 |
| chr2_+_36246628 | 0.37 |
ENSRNOT00000013618
|
Htr1a
|
5-hydroxytryptamine receptor 1A |
| chr1_-_20962526 | 0.37 |
ENSRNOT00000061332
ENSRNOT00000017322 ENSRNOT00000017412 ENSRNOT00000079688 ENSRNOT00000017417 |
Epb41l2
|
erythrocyte membrane protein band 4.1-like 2 |
| chr20_+_8235607 | 0.37 |
ENSRNOT00000090298
|
Tbc1d22b
|
TBC1 domain family, member 22B |
| chr14_+_8080565 | 0.37 |
ENSRNOT00000092395
|
Mapk10
|
mitogen activated protein kinase 10 |
| chr4_-_154043850 | 0.37 |
ENSRNOT00000018902
|
Iqsec3
|
IQ motif and Sec7 domain 3 |
| chr2_-_104461863 | 0.37 |
ENSRNOT00000016953
|
Crh
|
corticotropin releasing hormone |
| chr10_+_103703404 | 0.37 |
ENSRNOT00000086469
|
Rab37
|
RAB37, member RAS oncogene family |
| chr1_-_88111293 | 0.37 |
ENSRNOT00000077195
|
Spred3
|
sprouty-related, EVH1 domain containing 3 |
| chr1_-_164307084 | 0.37 |
ENSRNOT00000086091
|
Serpinh1
|
serpin family H member 1 |
| chr4_-_18396035 | 0.36 |
ENSRNOT00000034692
|
Sema3a
|
semaphorin 3A |
| chr14_-_72380330 | 0.36 |
ENSRNOT00000082653
ENSRNOT00000081878 ENSRNOT00000006727 |
Cpeb2
|
cytoplasmic polyadenylation element binding protein 2 |
| chr20_-_5064469 | 0.36 |
ENSRNOT00000001120
|
Ly6g6d
|
lymphocyte antigen 6 complex, locus G6D |
| chr7_-_144223429 | 0.36 |
ENSRNOT00000020527
|
Atf7
|
activating transcription factor 7 |
| chr10_+_47018974 | 0.36 |
ENSRNOT00000079375
|
Smcr8
|
Smith-Magenis syndrome chromosome region, candidate 8 |
| chr2_+_230901126 | 0.36 |
ENSRNOT00000016026
ENSRNOT00000015564 ENSRNOT00000068198 |
Camk2d
|
calcium/calmodulin-dependent protein kinase II delta |
| chr8_-_45215974 | 0.36 |
ENSRNOT00000010792
|
Crtam
|
cytotoxic and regulatory T cell molecule |
| chr5_-_150484207 | 0.35 |
ENSRNOT00000090736
|
Rab42
|
RAB42, member RAS oncogene family |
| chr1_-_131454689 | 0.35 |
ENSRNOT00000014152
|
Nr2f2
|
nuclear receptor subfamily 2, group F, member 2 |
| chr8_-_116893057 | 0.35 |
ENSRNOT00000082113
|
Bsn
|
bassoon (presynaptic cytomatrix protein) |
| chr3_+_147585947 | 0.35 |
ENSRNOT00000006833
|
Scrt2
|
scratch family transcriptional repressor 2 |
| chr4_+_117371659 | 0.34 |
ENSRNOT00000045735
|
Alms1
|
ALMS1, centrosome and basal body associated protein |
| chr10_+_11206226 | 0.34 |
ENSRNOT00000006979
|
Tfap4
|
transcription factor AP-4 |
| chr8_+_16287804 | 0.34 |
ENSRNOT00000024691
|
Vkorc1l1
|
vitamin K epoxide reductase complex, subunit 1-like 1 |
| chr5_+_144160108 | 0.34 |
ENSRNOT00000064972
|
Eva1b
|
eva-1 homolog B |
| chr7_+_3133506 | 0.34 |
ENSRNOT00000049972
|
Pmel
|
premelanosome protein |
| chrX_+_71155601 | 0.34 |
ENSRNOT00000076453
ENSRNOT00000048521 |
Foxo4
|
forkhead box O4 |
| chr10_+_90731865 | 0.34 |
ENSRNOT00000064429
|
Adam11
|
ADAM metallopeptidase domain 11 |
| chr5_+_135074297 | 0.34 |
ENSRNOT00000000157
|
Pik3r3
|
phosphoinositide-3-kinase regulatory subunit 3 |
| chrX_+_62754634 | 0.34 |
ENSRNOT00000016669
|
Pcyt1b
|
phosphate cytidylyltransferase 1, choline, beta |
| chr6_-_46631983 | 0.33 |
ENSRNOT00000045963
|
Sox11
|
SRY box 11 |
| chr5_-_146973932 | 0.33 |
ENSRNOT00000007761
|
Zfp362
|
zinc finger protein 362 |
| chr7_-_126465723 | 0.33 |
ENSRNOT00000021196
|
Wnt7b
|
wingless-type MMTV integration site family, member 7B |
| chr10_-_85517683 | 0.33 |
ENSRNOT00000016070
|
Srcin1
|
SRC kinase signaling inhibitor 1 |
| chr10_+_83655460 | 0.33 |
ENSRNOT00000008011
|
Gngt2
|
G protein subunit gamma transducin 2 |
| chr10_+_86157608 | 0.33 |
ENSRNOT00000082668
ENSRNOT00000008256 |
Cdk12
|
cyclin-dependent kinase 12 |
| chr1_+_101517714 | 0.33 |
ENSRNOT00000028423
|
Plekha4
|
pleckstrin homology domain containing A4 |
| chr16_-_71319052 | 0.33 |
ENSRNOT00000050980
|
Fgfr1
|
Fibroblast growth factor receptor 1 |
| chr8_+_77107536 | 0.33 |
ENSRNOT00000083255
|
Adam10
|
ADAM metallopeptidase domain 10 |
| chr18_-_31343797 | 0.33 |
ENSRNOT00000081850
|
Pcdh1
|
protocadherin 1 |
| chr16_+_60925093 | 0.33 |
ENSRNOT00000015813
|
Tnks
|
tankyrase |
| chr10_-_89084885 | 0.33 |
ENSRNOT00000027452
|
Plekhh3
|
pleckstrin homology, MyTH4 and FERM domain containing H3 |
| chr7_+_11152038 | 0.33 |
ENSRNOT00000006168
|
Nfic
|
nuclear factor I/C |
| chr9_-_82699551 | 0.32 |
ENSRNOT00000020673
|
Obsl1
|
obscurin-like 1 |
| chr3_-_94182714 | 0.32 |
ENSRNOT00000015073
|
LOC100362814
|
hypothetical protein LOC100362814 |
| chr9_+_17841410 | 0.32 |
ENSRNOT00000031706
|
Tmem151b
|
transmembrane protein 151B |
| chr5_+_135962911 | 0.32 |
ENSRNOT00000087353
|
Ptch2
|
patched 2 |
| chr13_-_83917001 | 0.32 |
ENSRNOT00000004387
ENSRNOT00000082422 |
Rcsd1
|
RCSD domain containing 1 |
| chr10_+_23661013 | 0.32 |
ENSRNOT00000076664
|
Ebf1
|
early B-cell factor 1 |
| chr18_+_63599425 | 0.32 |
ENSRNOT00000023145
|
Cep192
|
centrosomal protein 192 |
| chrX_+_140878216 | 0.32 |
ENSRNOT00000075840
ENSRNOT00000077026 |
Zic3
|
Zic family member 3 |
| chr17_-_84488480 | 0.31 |
ENSRNOT00000000158
ENSRNOT00000075983 |
Nebl
|
nebulette |
| chr20_-_1980101 | 0.31 |
ENSRNOT00000084582
ENSRNOT00000085050 ENSRNOT00000082545 ENSRNOT00000088396 |
Gabbr1
|
gamma-aminobutyric acid type B receptor subunit 1 |
| chrX_+_62363757 | 0.31 |
ENSRNOT00000091240
|
Arx
|
aristaless related homeobox |
| chr10_-_5196892 | 0.31 |
ENSRNOT00000083982
|
Clec16a
|
C-type lectin domain family 16, member A |
| chr1_-_88112683 | 0.31 |
ENSRNOT00000090615
|
Spred3
|
sprouty-related, EVH1 domain containing 3 |
| chr18_-_12640716 | 0.31 |
ENSRNOT00000020697
|
Klhl14
|
kelch-like family member 14 |
| chr6_-_41870046 | 0.31 |
ENSRNOT00000005863
|
Lpin1
|
lipin 1 |
| chr5_+_59080765 | 0.31 |
ENSRNOT00000021888
ENSRNOT00000064419 |
Rgp1
|
RGP1 homolog, RAB6A GEF complex partner 1 |
| chr20_+_40769586 | 0.31 |
ENSRNOT00000001079
|
Fabp7
|
fatty acid binding protein 7 |
| chr8_-_6203515 | 0.31 |
ENSRNOT00000087278
ENSRNOT00000031189 ENSRNOT00000008074 ENSRNOT00000085285 ENSRNOT00000007866 |
Yap1
|
yes-associated protein 1 |
| chr1_-_72339395 | 0.31 |
ENSRNOT00000021772
|
Zfp580
|
zinc finger protein 580 |
| chr1_+_80000165 | 0.31 |
ENSRNOT00000084912
|
Six5
|
SIX homeobox 5 |
| chr7_-_3342491 | 0.31 |
ENSRNOT00000081756
|
Rdh5
|
retinol dehydrogenase 5 |
| chr10_-_108196217 | 0.31 |
ENSRNOT00000075440
|
Cbx4
|
chromobox 4 |
| chr1_+_165724451 | 0.31 |
ENSRNOT00000025827
|
Fam168a
|
family with sequence similarity 168, member A |
| chr7_-_143966863 | 0.31 |
ENSRNOT00000018828
|
Sp7
|
Sp7 transcription factor |
| chr20_-_5123073 | 0.31 |
ENSRNOT00000001126
|
Apom
|
apolipoprotein M |
| chr3_+_14889510 | 0.30 |
ENSRNOT00000080760
|
Dab2ip
|
DAB2 interacting protein |
| chr16_-_7681576 | 0.30 |
ENSRNOT00000026550
|
Colq
|
collagen like tail subunit of asymmetric acetylcholinesterase |
| chr17_-_20364714 | 0.30 |
ENSRNOT00000070962
|
Jarid2
|
jumonji and AT-rich interaction domain containing 2 |
| chr10_+_15108072 | 0.30 |
ENSRNOT00000060286
|
Mslnl
|
mesothelin-like |
| chr14_-_112946875 | 0.30 |
ENSRNOT00000081981
|
LOC103690141
|
coiled-coil domain-containing protein 85A-like |
| chr3_+_110442637 | 0.30 |
ENSRNOT00000010471
|
Pak6
|
p21 (RAC1) activated kinase 6 |
| chr14_+_19866408 | 0.30 |
ENSRNOT00000060465
|
Adamts3
|
ADAM metallopeptidase with thrombospondin type 1, motif 3 |
| chr5_-_138697641 | 0.30 |
ENSRNOT00000012062
|
Guca2b
|
guanylate cyclase activator 2B |
| chr4_+_199916 | 0.30 |
ENSRNOT00000009317
|
Htr5a
|
5-hydroxytryptamine receptor 5A |
Network of associatons between targets according to the STRING database.

First level regulatory network of Gtf2i_Gtf2f1
Gene Ontology Analysis
Gene overrepresentation in biological process category:
| Log-likelihood per target | Total log-likelihood | Term | Description |
|---|---|---|---|
| 1.0 | 3.1 | GO:0006710 | androgen catabolic process(GO:0006710) |
| 0.5 | 1.5 | GO:1990926 | short-term synaptic potentiation(GO:1990926) |
| 0.4 | 1.8 | GO:1900224 | positive regulation of nodal signaling pathway involved in determination of lateral mesoderm left/right asymmetry(GO:1900224) |
| 0.4 | 1.3 | GO:0021530 | spinal cord oligodendrocyte cell differentiation(GO:0021529) spinal cord oligodendrocyte cell fate specification(GO:0021530) |
| 0.4 | 1.1 | GO:0009957 | epidermal cell fate specification(GO:0009957) |
| 0.3 | 1.4 | GO:0070094 | positive regulation of glucagon secretion(GO:0070094) |
| 0.3 | 0.9 | GO:0051935 | amino acid neurotransmitter reuptake(GO:0051933) glutamate reuptake(GO:0051935) |
| 0.3 | 1.1 | GO:0071879 | positive regulation of adrenergic receptor signaling pathway(GO:0071879) regulation of adrenergic receptor signaling pathway involved in heart process(GO:1901204) |
| 0.3 | 2.0 | GO:0035726 | common myeloid progenitor cell proliferation(GO:0035726) |
| 0.2 | 1.4 | GO:0021759 | globus pallidus development(GO:0021759) |
| 0.2 | 0.9 | GO:0050893 | sensory processing(GO:0050893) |
| 0.2 | 0.6 | GO:0043314 | negative regulation of neutrophil degranulation(GO:0043314) |
| 0.2 | 0.6 | GO:0072186 | metanephric cap development(GO:0072185) metanephric cap morphogenesis(GO:0072186) metanephric cap mesenchymal cell proliferation involved in metanephros development(GO:0090094) |
| 0.2 | 1.4 | GO:0099525 | presynaptic dense core granule exocytosis(GO:0099525) |
| 0.2 | 0.4 | GO:1901143 | insulin catabolic process(GO:1901143) |
| 0.2 | 0.6 | GO:0021816 | lamellipodium assembly involved in ameboidal cell migration(GO:0003363) extension of a leading process involved in cell motility in cerebral cortex radial glia guided migration(GO:0021816) |
| 0.2 | 0.7 | GO:0035494 | SNARE complex disassembly(GO:0035494) |
| 0.2 | 0.5 | GO:0010808 | positive regulation of synaptic vesicle priming(GO:0010808) positive regulation of synaptic vesicle fusion to presynaptic membrane(GO:0031632) |
| 0.2 | 0.7 | GO:0097026 | dendritic cell dendrite assembly(GO:0097026) |
| 0.2 | 0.3 | GO:0003357 | noradrenergic neuron differentiation(GO:0003357) |
| 0.2 | 0.5 | GO:0032242 | regulation of nucleoside transport(GO:0032242) negative regulation of neurotrophin production(GO:0032900) |
| 0.2 | 0.5 | GO:1900060 | negative regulation of ceramide biosynthetic process(GO:1900060) |
| 0.2 | 0.5 | GO:0001698 | gastrin-induced gastric acid secretion(GO:0001698) negative regulation of icosanoid secretion(GO:0032304) |
| 0.1 | 0.4 | GO:1904339 | negative regulation of dopaminergic neuron differentiation(GO:1904339) |
| 0.1 | 0.4 | GO:0070212 | protein poly-ADP-ribosylation(GO:0070212) |
| 0.1 | 0.7 | GO:1900377 | negative regulation of melanin biosynthetic process(GO:0048022) negative regulation of secondary metabolite biosynthetic process(GO:1900377) |
| 0.1 | 0.6 | GO:1903225 | negative regulation of endodermal cell differentiation(GO:1903225) |
| 0.1 | 0.5 | GO:0071802 | negative regulation of podosome assembly(GO:0071802) |
| 0.1 | 0.4 | GO:0060849 | lymphatic endothelial cell fate commitment(GO:0060838) regulation of transcription involved in lymphatic endothelial cell fate commitment(GO:0060849) |
| 0.1 | 0.4 | GO:1900748 | positive regulation of vascular endothelial growth factor signaling pathway(GO:1900748) |
| 0.1 | 1.2 | GO:2000821 | regulation of grooming behavior(GO:2000821) |
| 0.1 | 0.5 | GO:0098886 | modification of dendritic spine(GO:0098886) |
| 0.1 | 0.3 | GO:0071386 | cellular response to corticosterone stimulus(GO:0071386) |
| 0.1 | 0.3 | GO:0021897 | forebrain astrocyte differentiation(GO:0021896) forebrain astrocyte development(GO:0021897) |
| 0.1 | 0.9 | GO:1901098 | positive regulation of autophagosome maturation(GO:1901098) |
| 0.1 | 0.3 | GO:0050883 | medulla oblongata development(GO:0021550) musculoskeletal movement, spinal reflex action(GO:0050883) |
| 0.1 | 0.4 | GO:0090271 | positive regulation of fibroblast growth factor production(GO:0090271) |
| 0.1 | 0.5 | GO:0072429 | meiotic DNA double-strand break processing(GO:0000706) response to intra-S DNA damage checkpoint signaling(GO:0072429) |
| 0.1 | 0.4 | GO:2000474 | regulation of opioid receptor signaling pathway(GO:2000474) |
| 0.1 | 0.6 | GO:0035973 | aggrephagy(GO:0035973) |
| 0.1 | 0.4 | GO:0035022 | positive regulation of Rac protein signal transduction(GO:0035022) |
| 0.1 | 0.3 | GO:0061642 | chemoattraction of axon(GO:0061642) renal outer medulla development(GO:0072054) |
| 0.1 | 0.3 | GO:0048377 | ventricular zone neuroblast division(GO:0021847) fibroblast growth factor receptor signaling pathway involved in orbitofrontal cortex development(GO:0035607) lateral mesodermal cell fate commitment(GO:0048372) lateral mesodermal cell fate specification(GO:0048377) regulation of lateral mesodermal cell fate specification(GO:0048378) |
| 0.1 | 0.4 | GO:0019072 | viral genome packaging(GO:0019072) viral RNA genome packaging(GO:0019074) |
| 0.1 | 0.3 | GO:0051088 | PMA-inducible membrane protein ectodomain proteolysis(GO:0051088) |
| 0.1 | 0.4 | GO:0034696 | response to prostaglandin F(GO:0034696) |
| 0.1 | 0.9 | GO:0060385 | axonogenesis involved in innervation(GO:0060385) |
| 0.1 | 0.3 | GO:0071691 | cardiac muscle thin filament assembly(GO:0071691) |
| 0.1 | 0.2 | GO:1902809 | regulation of skeletal muscle fiber differentiation(GO:1902809) |
| 0.1 | 0.3 | GO:0034443 | plasma lipoprotein particle oxidation(GO:0034441) negative regulation of lipoprotein oxidation(GO:0034443) |
| 0.1 | 0.6 | GO:1900747 | negative regulation of vascular endothelial growth factor signaling pathway(GO:1900747) |
| 0.1 | 0.8 | GO:0030644 | cellular chloride ion homeostasis(GO:0030644) |
| 0.1 | 0.2 | GO:0033092 | positive regulation of immature T cell proliferation in thymus(GO:0033092) |
| 0.1 | 0.3 | GO:0061357 | positive regulation of Wnt protein secretion(GO:0061357) |
| 0.1 | 0.4 | GO:0017187 | peptidyl-glutamic acid carboxylation(GO:0017187) protein carboxylation(GO:0018214) |
| 0.1 | 0.3 | GO:0090149 | mitochondrial membrane fission(GO:0090149) |
| 0.1 | 0.6 | GO:0007198 | adenylate cyclase-inhibiting serotonin receptor signaling pathway(GO:0007198) |
| 0.1 | 0.4 | GO:0051464 | positive regulation of cortisol secretion(GO:0051464) |
| 0.1 | 0.4 | GO:1902630 | regulation of membrane hyperpolarization(GO:1902630) |
| 0.1 | 0.4 | GO:0045900 | negative regulation of translational elongation(GO:0045900) |
| 0.1 | 0.3 | GO:2000820 | negative regulation of transcription from RNA polymerase II promoter involved in smooth muscle cell differentiation(GO:2000820) |
| 0.1 | 0.6 | GO:1990785 | response to water-immersion restraint stress(GO:1990785) |
| 0.1 | 0.3 | GO:0090172 | microtubule cytoskeleton organization involved in homologous chromosome segregation(GO:0090172) |
| 0.1 | 1.0 | GO:0035414 | negative regulation of catenin import into nucleus(GO:0035414) |
| 0.1 | 0.3 | GO:1902618 | cellular response to fluoride(GO:1902618) |
| 0.1 | 0.9 | GO:0046684 | response to pyrethroid(GO:0046684) |
| 0.1 | 0.3 | GO:0001880 | Mullerian duct regression(GO:0001880) |
| 0.1 | 0.2 | GO:0043324 | eye pigment metabolic process(GO:0042441) pigment metabolic process involved in developmental pigmentation(GO:0043324) pigment metabolic process involved in pigmentation(GO:0043474) rhodopsin metabolic process(GO:0046154) |
| 0.1 | 0.2 | GO:0001966 | thigmotaxis(GO:0001966) |
| 0.1 | 2.4 | GO:1905145 | acetylcholine receptor signaling pathway(GO:0095500) signal transduction involved in cellular response to ammonium ion(GO:1903831) response to acetylcholine(GO:1905144) cellular response to acetylcholine(GO:1905145) |
| 0.1 | 0.2 | GO:0033693 | neurofilament bundle assembly(GO:0033693) |
| 0.1 | 0.5 | GO:0015074 | DNA integration(GO:0015074) |
| 0.1 | 0.2 | GO:0071298 | cellular response to L-ascorbic acid(GO:0071298) |
| 0.1 | 0.7 | GO:1901223 | negative regulation of NIK/NF-kappaB signaling(GO:1901223) |
| 0.1 | 0.1 | GO:0001922 | B-1 B cell homeostasis(GO:0001922) |
| 0.1 | 0.2 | GO:1904056 | regulation of cholangiocyte proliferation(GO:1904054) positive regulation of cholangiocyte proliferation(GO:1904056) |
| 0.1 | 0.2 | GO:1902748 | positive regulation of lens fiber cell differentiation(GO:1902748) |
| 0.1 | 0.6 | GO:1990034 | calcium ion export from cell(GO:1990034) |
| 0.1 | 0.3 | GO:0099590 | neurotransmitter receptor internalization(GO:0099590) |
| 0.1 | 0.5 | GO:0060024 | rhythmic synaptic transmission(GO:0060024) |
| 0.1 | 0.3 | GO:0030210 | heparin biosynthetic process(GO:0030210) |
| 0.1 | 0.2 | GO:0070172 | positive regulation of tooth mineralization(GO:0070172) |
| 0.1 | 0.4 | GO:0060023 | soft palate development(GO:0060023) |
| 0.1 | 0.4 | GO:0061205 | paramesonephric duct development(GO:0061205) |
| 0.1 | 1.0 | GO:0045586 | regulation of gamma-delta T cell differentiation(GO:0045586) regulation of gamma-delta T cell activation(GO:0046643) |
| 0.1 | 0.2 | GO:0021586 | pons maturation(GO:0021586) |
| 0.1 | 0.2 | GO:0090164 | asymmetric Golgi ribbon formation(GO:0090164) |
| 0.1 | 0.3 | GO:1903977 | positive regulation of glial cell migration(GO:1903977) |
| 0.1 | 0.2 | GO:0080033 | cellular response to carbon monoxide(GO:0071245) cellular response to nitrite(GO:0071250) response to nitrite(GO:0080033) |
| 0.1 | 0.6 | GO:0098532 | histone H3-K27 trimethylation(GO:0098532) |
| 0.1 | 0.1 | GO:0016344 | meiotic chromosome movement towards spindle pole(GO:0016344) |
| 0.1 | 0.2 | GO:0002296 | T-helper 1 cell lineage commitment(GO:0002296) |
| 0.1 | 0.2 | GO:0098749 | cerebellar neuron development(GO:0098749) |
| 0.1 | 0.2 | GO:1900220 | semaphorin-plexin signaling pathway involved in bone trabecula morphogenesis(GO:1900220) |
| 0.1 | 0.4 | GO:0097039 | protein linear polyubiquitination(GO:0097039) |
| 0.1 | 0.2 | GO:0044027 | hypermethylation of CpG island(GO:0044027) |
| 0.1 | 0.9 | GO:0007512 | adult heart development(GO:0007512) |
| 0.1 | 0.2 | GO:1901421 | positive regulation of response to alcohol(GO:1901421) |
| 0.1 | 0.6 | GO:0014807 | regulation of somitogenesis(GO:0014807) |
| 0.1 | 0.2 | GO:0045163 | clustering of voltage-gated potassium channels(GO:0045163) |
| 0.1 | 0.2 | GO:1902303 | negative regulation of potassium ion export(GO:1902303) |
| 0.1 | 0.4 | GO:0006642 | triglyceride mobilization(GO:0006642) |
| 0.1 | 0.2 | GO:0033058 | directional locomotion(GO:0033058) |
| 0.1 | 0.3 | GO:0071376 | response to corticotropin-releasing hormone(GO:0043435) cellular response to corticotropin-releasing hormone stimulus(GO:0071376) |
| 0.1 | 0.2 | GO:0044268 | multicellular organismal protein metabolic process(GO:0044268) |
| 0.1 | 0.2 | GO:0045085 | negative regulation of interleukin-2 biosynthetic process(GO:0045085) |
| 0.1 | 0.2 | GO:1904580 | regulation of intracellular mRNA localization(GO:1904580) |
| 0.1 | 0.2 | GO:0000973 | posttranscriptional tethering of RNA polymerase II gene DNA at nuclear periphery(GO:0000973) |
| 0.1 | 0.5 | GO:0016576 | histone dephosphorylation(GO:0016576) |
| 0.1 | 0.2 | GO:0032066 | nucleolus to nucleoplasm transport(GO:0032066) |
| 0.1 | 0.3 | GO:0099526 | presynaptic signal transduction(GO:0098928) presynapse to nucleus signaling pathway(GO:0099526) |
| 0.1 | 0.7 | GO:1902018 | negative regulation of cilium assembly(GO:1902018) |
| 0.1 | 0.6 | GO:0031293 | membrane protein intracellular domain proteolysis(GO:0031293) |
| 0.1 | 0.1 | GO:0007352 | zygotic specification of dorsal/ventral axis(GO:0007352) |
| 0.1 | 0.3 | GO:0072307 | metanephric nephron tubule epithelial cell differentiation(GO:0072257) regulation of metanephric nephron tubule epithelial cell differentiation(GO:0072307) |
| 0.1 | 0.2 | GO:0097167 | circadian regulation of translation(GO:0097167) |
| 0.1 | 0.1 | GO:1905146 | regulation of protein catabolic process in the vacuole(GO:1904350) lysosomal protein catabolic process(GO:1905146) |
| 0.1 | 0.2 | GO:1902214 | regulation of interleukin-4-mediated signaling pathway(GO:1902214) |
| 0.1 | 0.2 | GO:0075509 | receptor-mediated endocytosis of virus by host cell(GO:0019065) endocytosis involved in viral entry into host cell(GO:0075509) |
| 0.1 | 0.5 | GO:0021942 | radial glia guided migration of Purkinje cell(GO:0021942) |
| 0.1 | 0.2 | GO:0014858 | positive regulation of skeletal muscle cell proliferation(GO:0014858) |
| 0.1 | 0.4 | GO:2000766 | negative regulation of cytoplasmic translation(GO:2000766) |
| 0.1 | 0.8 | GO:0070935 | 3'-UTR-mediated mRNA stabilization(GO:0070935) |
| 0.1 | 0.4 | GO:0035469 | determination of pancreatic left/right asymmetry(GO:0035469) |
| 0.1 | 2.7 | GO:0050771 | negative regulation of axonogenesis(GO:0050771) |
| 0.1 | 0.3 | GO:0060014 | granulosa cell differentiation(GO:0060014) |
| 0.1 | 0.2 | GO:2000587 | negative regulation of platelet-derived growth factor receptor-beta signaling pathway(GO:2000587) |
| 0.1 | 0.1 | GO:0043316 | cytotoxic T cell degranulation(GO:0043316) |
| 0.1 | 0.2 | GO:0072697 | protein localization to cell cortex(GO:0072697) |
| 0.1 | 0.4 | GO:0002857 | positive regulation of natural killer cell mediated immune response to tumor cell(GO:0002857) positive regulation of natural killer cell mediated cytotoxicity directed against tumor cell target(GO:0002860) |
| 0.1 | 0.2 | GO:0051611 | negative regulation of neurotransmitter uptake(GO:0051581) regulation of serotonin uptake(GO:0051611) negative regulation of serotonin uptake(GO:0051612) |
| 0.1 | 0.3 | GO:0006868 | glutamine transport(GO:0006868) |
| 0.1 | 0.3 | GO:0048597 | post-embryonic camera-type eye morphogenesis(GO:0048597) |
| 0.1 | 0.3 | GO:0071557 | histone H3-K27 demethylation(GO:0071557) |
| 0.1 | 0.6 | GO:0033601 | positive regulation of mammary gland epithelial cell proliferation(GO:0033601) |
| 0.1 | 0.7 | GO:0038063 | collagen-activated tyrosine kinase receptor signaling pathway(GO:0038063) |
| 0.0 | 0.1 | GO:1903849 | regulation of aorta morphogenesis(GO:1903847) positive regulation of aorta morphogenesis(GO:1903849) |
| 0.0 | 0.5 | GO:0097106 | postsynaptic density organization(GO:0097106) |
| 0.0 | 0.2 | GO:0035441 | cell migration involved in vasculogenesis(GO:0035441) VEGF-activated platelet-derived growth factor receptor signaling pathway(GO:0038086) positive regulation of cell proliferation by VEGF-activated platelet derived growth factor receptor signaling pathway(GO:0038091) metanephric glomerulus morphogenesis(GO:0072275) metanephric glomerulus vasculature morphogenesis(GO:0072276) metanephric glomerular capillary formation(GO:0072277) |
| 0.0 | 0.2 | GO:0042494 | detection of bacterial lipoprotein(GO:0042494) |
| 0.0 | 0.2 | GO:1903244 | positive regulation of cardiac muscle adaptation(GO:0010615) positive regulation of cardiac muscle hypertrophy in response to stress(GO:1903244) |
| 0.0 | 0.3 | GO:2001269 | positive regulation of cysteine-type endopeptidase activity involved in apoptotic signaling pathway(GO:2001269) |
| 0.0 | 0.1 | GO:1901844 | regulation of cell communication by electrical coupling involved in cardiac conduction(GO:1901844) |
| 0.0 | 1.1 | GO:0032012 | regulation of ARF protein signal transduction(GO:0032012) |
| 0.0 | 0.7 | GO:0035970 | peptidyl-threonine dephosphorylation(GO:0035970) |
| 0.0 | 0.2 | GO:0016095 | polyprenol catabolic process(GO:0016095) |
| 0.0 | 0.2 | GO:0048691 | regulation of sprouting of injured axon(GO:0048686) positive regulation of sprouting of injured axon(GO:0048687) regulation of axon extension involved in regeneration(GO:0048690) positive regulation of axon extension involved in regeneration(GO:0048691) |
| 0.0 | 0.1 | GO:0055005 | ventricular cardiac myofibril assembly(GO:0055005) |
| 0.0 | 0.2 | GO:0048021 | regulation of melanin biosynthetic process(GO:0048021) regulation of secondary metabolite biosynthetic process(GO:1900376) |
| 0.0 | 0.3 | GO:0097118 | neuroligin clustering involved in postsynaptic membrane assembly(GO:0097118) |
| 0.0 | 0.1 | GO:0042447 | hormone catabolic process(GO:0042447) |
| 0.0 | 0.2 | GO:0071313 | cellular response to caffeine(GO:0071313) |
| 0.0 | 0.2 | GO:0030576 | Cajal body organization(GO:0030576) |
| 0.0 | 0.2 | GO:1901491 | negative regulation of lymphangiogenesis(GO:1901491) |
| 0.0 | 0.2 | GO:0019520 | aldonic acid metabolic process(GO:0019520) D-gluconate metabolic process(GO:0019521) |
| 0.0 | 0.2 | GO:0009992 | cellular water homeostasis(GO:0009992) |
| 0.0 | 0.4 | GO:1904116 | response to vasopressin(GO:1904116) |
| 0.0 | 0.1 | GO:0035544 | negative regulation of SNARE complex assembly(GO:0035544) |
| 0.0 | 0.2 | GO:0080154 | regulation of fertilization(GO:0080154) positive regulation of sperm motility(GO:1902093) |
| 0.0 | 0.1 | GO:0071947 | protein deubiquitination involved in ubiquitin-dependent protein catabolic process(GO:0071947) |
| 0.0 | 0.1 | GO:0045065 | cytotoxic T cell differentiation(GO:0045065) |
| 0.0 | 0.5 | GO:0043619 | regulation of transcription from RNA polymerase II promoter in response to oxidative stress(GO:0043619) |
| 0.0 | 0.4 | GO:0031284 | positive regulation of guanylate cyclase activity(GO:0031284) |
| 0.0 | 0.0 | GO:0060369 | positive regulation of Fc receptor mediated stimulatory signaling pathway(GO:0060369) |
| 0.0 | 0.2 | GO:0034729 | histone H3-K79 methylation(GO:0034729) |
| 0.0 | 0.1 | GO:1905218 | cellular response to astaxanthin(GO:1905218) |
| 0.0 | 0.1 | GO:0007597 | blood coagulation, intrinsic pathway(GO:0007597) |
| 0.0 | 0.1 | GO:1904700 | granulosa cell apoptotic process(GO:1904700) regulation of granulosa cell apoptotic process(GO:1904708) |
| 0.0 | 0.5 | GO:2000786 | positive regulation of autophagosome assembly(GO:2000786) |
| 0.0 | 0.2 | GO:0021869 | forebrain ventricular zone progenitor cell division(GO:0021869) |
| 0.0 | 0.2 | GO:0060982 | coronary artery morphogenesis(GO:0060982) |
| 0.0 | 0.2 | GO:1903361 | protein localization to basolateral plasma membrane(GO:1903361) |
| 0.0 | 1.4 | GO:0030866 | cortical actin cytoskeleton organization(GO:0030866) |
| 0.0 | 0.2 | GO:0010968 | regulation of microtubule nucleation(GO:0010968) |
| 0.0 | 0.2 | GO:0010510 | regulation of acetyl-CoA biosynthetic process from pyruvate(GO:0010510) regulation of acyl-CoA biosynthetic process(GO:0050812) |
| 0.0 | 0.8 | GO:0000188 | inactivation of MAPK activity(GO:0000188) |
| 0.0 | 0.3 | GO:0003433 | chondrocyte development involved in endochondral bone morphogenesis(GO:0003433) |
| 0.0 | 0.1 | GO:0070666 | mast cell proliferation(GO:0070662) regulation of mast cell proliferation(GO:0070666) positive regulation of mast cell proliferation(GO:0070668) |
| 0.0 | 0.1 | GO:1900368 | regulation of RNA interference(GO:1900368) |
| 0.0 | 0.1 | GO:0002432 | granuloma formation(GO:0002432) |
| 0.0 | 0.1 | GO:0030208 | dermatan sulfate biosynthetic process(GO:0030208) |
| 0.0 | 0.7 | GO:0048172 | regulation of short-term neuronal synaptic plasticity(GO:0048172) |
| 0.0 | 0.1 | GO:0090394 | negative regulation of excitatory postsynaptic potential(GO:0090394) |
| 0.0 | 0.1 | GO:1900275 | negative regulation of phospholipase C activity(GO:1900275) regulation of phospholipase C-activating G-protein coupled receptor signaling pathway(GO:1900736) |
| 0.0 | 0.1 | GO:1905244 | regulation of modification of synaptic structure(GO:1905244) |
| 0.0 | 0.1 | GO:0060214 | endocardium formation(GO:0060214) |
| 0.0 | 0.1 | GO:0010612 | regulation of cardiac muscle adaptation(GO:0010612) |
| 0.0 | 0.2 | GO:0061484 | hematopoietic stem cell homeostasis(GO:0061484) |
| 0.0 | 0.1 | GO:0071718 | sodium-independent icosanoid transport(GO:0071718) |
| 0.0 | 0.4 | GO:0007258 | JUN phosphorylation(GO:0007258) |
| 0.0 | 0.2 | GO:0046600 | negative regulation of centriole replication(GO:0046600) |
| 0.0 | 0.1 | GO:2000173 | positive regulation of low-density lipoprotein particle receptor biosynthetic process(GO:0045716) negative regulation of branching morphogenesis of a nerve(GO:2000173) |
| 0.0 | 0.2 | GO:1904714 | regulation of chaperone-mediated autophagy(GO:1904714) |
| 0.0 | 0.3 | GO:2000812 | regulation of barbed-end actin filament capping(GO:2000812) |
| 0.0 | 0.2 | GO:0001927 | exocyst assembly(GO:0001927) entry of bacterium into host cell(GO:0035635) regulation of entry of bacterium into host cell(GO:2000535) |
| 0.0 | 0.2 | GO:0045631 | regulation of auditory receptor cell differentiation(GO:0045607) regulation of mechanoreceptor differentiation(GO:0045631) regulation of inner ear receptor cell differentiation(GO:2000980) |
| 0.0 | 0.3 | GO:0014842 | regulation of skeletal muscle satellite cell proliferation(GO:0014842) regulation of skeletal muscle cell proliferation(GO:0014857) |
| 0.0 | 0.3 | GO:0010606 | positive regulation of cytoplasmic mRNA processing body assembly(GO:0010606) |
| 0.0 | 0.1 | GO:1902498 | regulation of protein autoubiquitination(GO:1902498) |
| 0.0 | 0.1 | GO:1901219 | regulation of cardiac chamber morphogenesis(GO:1901219) negative regulation of cardiac chamber morphogenesis(GO:1901220) |
| 0.0 | 0.2 | GO:0048251 | elastic fiber assembly(GO:0048251) |
| 0.0 | 0.0 | GO:1904529 | regulation of actin filament binding(GO:1904529) regulation of actin binding(GO:1904616) |
| 0.0 | 0.1 | GO:1901420 | negative regulation of vitamin D receptor signaling pathway(GO:0070563) negative regulation of response to alcohol(GO:1901420) |
| 0.0 | 0.1 | GO:0086024 | adrenergic receptor signaling pathway involved in positive regulation of heart rate(GO:0086024) |
| 0.0 | 0.1 | GO:0097187 | dentinogenesis(GO:0097187) |
| 0.0 | 0.1 | GO:0002408 | myeloid dendritic cell chemotaxis(GO:0002408) |
| 0.0 | 0.1 | GO:0001180 | transcription initiation from RNA polymerase I promoter for nuclear large rRNA transcript(GO:0001180) |
| 0.0 | 0.1 | GO:0044691 | tooth eruption(GO:0044691) |
| 0.0 | 0.1 | GO:1903575 | cornified envelope assembly(GO:1903575) |
| 0.0 | 0.3 | GO:0071420 | cellular response to histamine(GO:0071420) |
| 0.0 | 0.0 | GO:1905075 | occluding junction disassembly(GO:1905071) regulation of occluding junction disassembly(GO:1905073) positive regulation of occluding junction disassembly(GO:1905075) |
| 0.0 | 0.1 | GO:0099566 | regulation of postsynaptic cytosolic calcium ion concentration(GO:0099566) |
| 0.0 | 0.2 | GO:0031915 | positive regulation of synaptic plasticity(GO:0031915) |
| 0.0 | 0.2 | GO:0018230 | peptidyl-L-cysteine S-palmitoylation(GO:0018230) peptidyl-S-diacylglycerol-L-cysteine biosynthetic process from peptidyl-cysteine(GO:0018231) |
| 0.0 | 0.1 | GO:1903527 | positive regulation of membrane tubulation(GO:1903527) |
| 0.0 | 0.2 | GO:0071352 | cellular response to interleukin-2(GO:0071352) |
| 0.0 | 0.1 | GO:0090367 | negative regulation of mRNA modification(GO:0090367) |
| 0.0 | 0.1 | GO:0061366 | behavioral response to chemical pain(GO:0061366) behavioral response to formalin induced pain(GO:0061368) |
| 0.0 | 0.1 | GO:2001226 | negative regulation of chloride transport(GO:2001226) |
| 0.0 | 0.1 | GO:0060011 | Sertoli cell proliferation(GO:0060011) |
| 0.0 | 0.1 | GO:0072383 | plus-end-directed vesicle transport along microtubule(GO:0072383) plus-end-directed organelle transport along microtubule(GO:0072386) |
| 0.0 | 0.1 | GO:1902608 | regulation of large conductance calcium-activated potassium channel activity(GO:1902606) positive regulation of large conductance calcium-activated potassium channel activity(GO:1902608) |
| 0.0 | 0.3 | GO:0042135 | neurotransmitter catabolic process(GO:0042135) |
| 0.0 | 0.1 | GO:0032053 | ciliary basal body organization(GO:0032053) |
| 0.0 | 0.1 | GO:0035696 | monocyte extravasation(GO:0035696) |
| 0.0 | 0.4 | GO:0032957 | inositol trisphosphate metabolic process(GO:0032957) |
| 0.0 | 0.2 | GO:0033523 | histone H2B ubiquitination(GO:0033523) |
| 0.0 | 0.3 | GO:1900118 | negative regulation of execution phase of apoptosis(GO:1900118) |
| 0.0 | 0.1 | GO:0000389 | mRNA 3'-splice site recognition(GO:0000389) |
| 0.0 | 0.1 | GO:1905077 | regulation of interleukin-17 secretion(GO:1905076) negative regulation of interleukin-17 secretion(GO:1905077) |
| 0.0 | 0.6 | GO:1903861 | positive regulation of dendrite extension(GO:1903861) |
| 0.0 | 0.1 | GO:0060355 | positive regulation of cell adhesion molecule production(GO:0060355) |
| 0.0 | 0.2 | GO:0030949 | positive regulation of vascular endothelial growth factor receptor signaling pathway(GO:0030949) |
| 0.0 | 0.2 | GO:0048149 | behavioral response to ethanol(GO:0048149) |
| 0.0 | 0.1 | GO:0070946 | neutrophil mediated killing of gram-positive bacterium(GO:0070946) |
| 0.0 | 0.1 | GO:2000286 | receptor internalization involved in canonical Wnt signaling pathway(GO:2000286) |
| 0.0 | 0.2 | GO:0010216 | maintenance of DNA methylation(GO:0010216) |
| 0.0 | 0.0 | GO:1902262 | apoptotic process involved in patterning of blood vessels(GO:1902262) |
| 0.0 | 0.2 | GO:0061734 | parkin-mediated mitophagy in response to mitochondrial depolarization(GO:0061734) |
| 0.0 | 0.2 | GO:0072675 | osteoclast fusion(GO:0072675) |
| 0.0 | 0.1 | GO:0099553 | trans-synaptic signalling, modulating synaptic transmission(GO:0099550) trans-synaptic signaling by lipid, modulating synaptic transmission(GO:0099552) trans-synaptic signaling by endocannabinoid, modulating synaptic transmission(GO:0099553) |
| 0.0 | 0.0 | GO:0001994 | norepinephrine-epinephrine vasoconstriction involved in regulation of systemic arterial blood pressure(GO:0001994) |
| 0.0 | 0.5 | GO:0070816 | phosphorylation of RNA polymerase II C-terminal domain(GO:0070816) |
| 0.0 | 0.1 | GO:1904373 | response to kainic acid(GO:1904373) |
| 0.0 | 0.2 | GO:0033133 | positive regulation of glucokinase activity(GO:0033133) |
| 0.0 | 0.1 | GO:1905050 | positive regulation of metallopeptidase activity(GO:1905050) |
| 0.0 | 0.0 | GO:0070358 | actin polymerization-dependent cell motility(GO:0070358) |
| 0.0 | 0.1 | GO:0010989 | negative regulation of low-density lipoprotein particle clearance(GO:0010989) |
| 0.0 | 0.2 | GO:2001185 | regulation of CD8-positive, alpha-beta T cell activation(GO:2001185) |
| 0.0 | 0.0 | GO:0003186 | tricuspid valve morphogenesis(GO:0003186) regulation of lung blood pressure(GO:0014916) |
| 0.0 | 0.1 | GO:0097460 | ferrous iron import into cell(GO:0097460) ferrous iron import across plasma membrane(GO:0098707) |
| 0.0 | 1.0 | GO:0002474 | antigen processing and presentation of peptide antigen via MHC class I(GO:0002474) |
| 0.0 | 0.1 | GO:1900086 | regulation of peptidyl-tyrosine autophosphorylation(GO:1900084) positive regulation of peptidyl-tyrosine autophosphorylation(GO:1900086) |
| 0.0 | 0.1 | GO:0010045 | response to nickel cation(GO:0010045) |
| 0.0 | 0.1 | GO:0006556 | S-adenosylmethionine biosynthetic process(GO:0006556) |
| 0.0 | 0.2 | GO:0098870 | neuronal action potential propagation(GO:0019227) action potential propagation(GO:0098870) |
| 0.0 | 0.1 | GO:0061343 | cell adhesion involved in heart morphogenesis(GO:0061343) |
| 0.0 | 0.5 | GO:0045737 | positive regulation of cyclin-dependent protein serine/threonine kinase activity(GO:0045737) |
| 0.0 | 0.5 | GO:0070828 | heterochromatin organization(GO:0070828) |
| 0.0 | 0.3 | GO:0051382 | kinetochore assembly(GO:0051382) |
| 0.0 | 0.1 | GO:0042989 | sequestering of actin monomers(GO:0042989) |
| 0.0 | 0.1 | GO:1902299 | pre-replicative complex assembly involved in nuclear cell cycle DNA replication(GO:0006267) pre-replicative complex assembly(GO:0036388) DNA replication preinitiation complex assembly(GO:0071163) pre-replicative complex assembly involved in cell cycle DNA replication(GO:1902299) |
| 0.0 | 0.0 | GO:0021812 | neuronal-glial interaction involved in cerebral cortex radial glia guided migration(GO:0021812) |
| 0.0 | 0.1 | GO:0090383 | phagosome acidification(GO:0090383) |
| 0.0 | 0.1 | GO:0098915 | membrane repolarization during ventricular cardiac muscle cell action potential(GO:0098915) |
| 0.0 | 0.2 | GO:0051970 | negative regulation of transmission of nerve impulse(GO:0051970) regulation of neuronal action potential(GO:0098908) |
| 0.0 | 0.1 | GO:0042984 | amyloid precursor protein biosynthetic process(GO:0042983) regulation of amyloid precursor protein biosynthetic process(GO:0042984) |
| 0.0 | 0.5 | GO:0007214 | gamma-aminobutyric acid signaling pathway(GO:0007214) |
| 0.0 | 0.2 | GO:0060134 | prepulse inhibition(GO:0060134) |
| 0.0 | 0.3 | GO:0097150 | neuronal stem cell population maintenance(GO:0097150) |
| 0.0 | 0.1 | GO:0033512 | L-lysine catabolic process to acetyl-CoA via saccharopine(GO:0033512) |
| 0.0 | 0.2 | GO:0060136 | embryonic process involved in female pregnancy(GO:0060136) |
| 0.0 | 0.9 | GO:0007628 | adult walking behavior(GO:0007628) |
| 0.0 | 0.1 | GO:0051365 | cellular response to potassium ion starvation(GO:0051365) |
| 0.0 | 0.2 | GO:0098789 | pre-mRNA cleavage required for polyadenylation(GO:0098789) |
| 0.0 | 0.1 | GO:0072656 | maintenance of protein location in mitochondrion(GO:0072656) |
| 0.0 | 0.1 | GO:0006436 | tryptophanyl-tRNA aminoacylation(GO:0006436) |
| 0.0 | 0.3 | GO:0036065 | fucosylation(GO:0036065) |
| 0.0 | 0.3 | GO:2001256 | regulation of store-operated calcium entry(GO:2001256) |
| 0.0 | 0.0 | GO:0072235 | distal convoluted tubule development(GO:0072025) metanephric distal convoluted tubule development(GO:0072221) metanephric distal tubule development(GO:0072235) |
| 0.0 | 0.2 | GO:0019695 | choline metabolic process(GO:0019695) |
| 0.0 | 0.3 | GO:0021860 | pyramidal neuron development(GO:0021860) |
| 0.0 | 0.0 | GO:1903371 | regulation of endoplasmic reticulum tubular network organization(GO:1903371) |
| 0.0 | 0.1 | GO:0008228 | opsonization(GO:0008228) |
| 0.0 | 0.1 | GO:0010603 | regulation of cytoplasmic mRNA processing body assembly(GO:0010603) |
| 0.0 | 0.5 | GO:0061099 | negative regulation of protein tyrosine kinase activity(GO:0061099) |
| 0.0 | 0.2 | GO:0001921 | positive regulation of receptor recycling(GO:0001921) |
| 0.0 | 0.1 | GO:0070315 | G1 to G0 transition involved in cell differentiation(GO:0070315) |
| 0.0 | 0.2 | GO:0032486 | Rap protein signal transduction(GO:0032486) |
| 0.0 | 0.1 | GO:0035234 | ectopic germ cell programmed cell death(GO:0035234) |
| 0.0 | 0.1 | GO:0070426 | positive regulation of nucleotide-binding oligomerization domain containing signaling pathway(GO:0070426) regulation of nucleotide-binding oligomerization domain containing 1 signaling pathway(GO:0070428) positive regulation of nucleotide-binding oligomerization domain containing 2 signaling pathway(GO:0070434) |
| 0.0 | 0.0 | GO:0007089 | traversing start control point of mitotic cell cycle(GO:0007089) |
| 0.0 | 0.1 | GO:0071579 | regulation of zinc ion transport(GO:0071579) |
| 0.0 | 0.1 | GO:0002051 | osteoblast fate commitment(GO:0002051) |
| 0.0 | 0.1 | GO:1990743 | protein sialylation(GO:1990743) |
| 0.0 | 0.1 | GO:0034227 | tRNA thio-modification(GO:0034227) |
| 0.0 | 0.0 | GO:1903377 | negative regulation of oxidative stress-induced neuron intrinsic apoptotic signaling pathway(GO:1903377) |
| 0.0 | 0.1 | GO:0051045 | negative regulation of membrane protein ectodomain proteolysis(GO:0051045) |
| 0.0 | 0.1 | GO:0090168 | Golgi reassembly(GO:0090168) |
| 0.0 | 0.1 | GO:0036022 | limb joint morphogenesis(GO:0036022) |
| 0.0 | 0.1 | GO:0070269 | pyroptosis(GO:0070269) |
| 0.0 | 0.1 | GO:0035507 | regulation of myosin-light-chain-phosphatase activity(GO:0035507) |
| 0.0 | 0.2 | GO:0031665 | negative regulation of lipopolysaccharide-mediated signaling pathway(GO:0031665) |
| 0.0 | 0.1 | GO:1904220 | regulation of serine C-palmitoyltransferase activity(GO:1904220) |
| 0.0 | 0.1 | GO:0002433 | immune response-regulating cell surface receptor signaling pathway involved in phagocytosis(GO:0002433) Fc-gamma receptor signaling pathway involved in phagocytosis(GO:0038096) |
| 0.0 | 0.1 | GO:0035887 | aortic smooth muscle cell differentiation(GO:0035887) |
| 0.0 | 0.1 | GO:1904491 | protein localization to ciliary transition zone(GO:1904491) |
| 0.0 | 0.1 | GO:0051036 | regulation of endosome size(GO:0051036) |
| 0.0 | 0.3 | GO:0002076 | osteoblast development(GO:0002076) |
| 0.0 | 0.1 | GO:0046958 | nonassociative learning(GO:0046958) |
| 0.0 | 0.1 | GO:0060988 | lipid tube assembly(GO:0060988) |
| 0.0 | 0.1 | GO:0006449 | regulation of translational termination(GO:0006449) |
| 0.0 | 0.4 | GO:0070208 | protein heterotrimerization(GO:0070208) |
| 0.0 | 0.1 | GO:0018243 | protein O-linked glycosylation via threonine(GO:0018243) |
| 0.0 | 0.1 | GO:1901386 | negative regulation of voltage-gated calcium channel activity(GO:1901386) |
| 0.0 | 0.1 | GO:0002159 | desmosome assembly(GO:0002159) |
| 0.0 | 0.1 | GO:0042078 | germ-line stem cell division(GO:0042078) male germ-line stem cell asymmetric division(GO:0048133) germline stem cell asymmetric division(GO:0098728) |
| 0.0 | 0.1 | GO:0035426 | extracellular matrix-cell signaling(GO:0035426) |
| 0.0 | 0.1 | GO:0061081 | positive regulation of macrophage cytokine production(GO:0060907) positive regulation of myeloid leukocyte cytokine production involved in immune response(GO:0061081) |
| 0.0 | 0.3 | GO:0071044 | histone mRNA catabolic process(GO:0071044) |
| 0.0 | 0.1 | GO:1903895 | negative regulation of IRE1-mediated unfolded protein response(GO:1903895) |
| 0.0 | 0.1 | GO:0045041 | protein import into mitochondrial intermembrane space(GO:0045041) |
| 0.0 | 0.1 | GO:0070309 | lens fiber cell morphogenesis(GO:0070309) |
| 0.0 | 0.2 | GO:0014049 | positive regulation of glutamate secretion(GO:0014049) |
| 0.0 | 0.2 | GO:0034375 | high-density lipoprotein particle remodeling(GO:0034375) |
| 0.0 | 0.1 | GO:0016081 | synaptic vesicle docking(GO:0016081) |
| 0.0 | 0.1 | GO:0030263 | apoptotic chromosome condensation(GO:0030263) |
| 0.0 | 0.1 | GO:0021938 | smoothened signaling pathway involved in regulation of cerebellar granule cell precursor cell proliferation(GO:0021938) |
| 0.0 | 0.2 | GO:1904262 | negative regulation of TORC1 signaling(GO:1904262) |
| 0.0 | 0.2 | GO:2000311 | regulation of alpha-amino-3-hydroxy-5-methyl-4-isoxazole propionate selective glutamate receptor activity(GO:2000311) |
| 0.0 | 0.2 | GO:2000480 | negative regulation of cAMP-dependent protein kinase activity(GO:2000480) |
| 0.0 | 0.0 | GO:1901097 | negative regulation of autophagosome maturation(GO:1901097) |
| 0.0 | 0.2 | GO:1903830 | magnesium ion transmembrane transport(GO:1903830) |
| 0.0 | 0.1 | GO:0010040 | response to iron(II) ion(GO:0010040) |
| 0.0 | 0.1 | GO:0006003 | fructose 2,6-bisphosphate metabolic process(GO:0006003) |
| 0.0 | 0.1 | GO:0070102 | interleukin-6-mediated signaling pathway(GO:0070102) |
| 0.0 | 0.5 | GO:0071158 | positive regulation of cell cycle arrest(GO:0071158) |
| 0.0 | 0.2 | GO:0015816 | glycine transport(GO:0015816) |
| 0.0 | 0.1 | GO:0000972 | transcription-dependent tethering of RNA polymerase II gene DNA at nuclear periphery(GO:0000972) |
| 0.0 | 0.1 | GO:0007220 | Notch receptor processing(GO:0007220) |
| 0.0 | 0.0 | GO:2001016 | positive regulation of skeletal muscle cell differentiation(GO:2001016) |
| 0.0 | 0.1 | GO:0043031 | negative regulation of macrophage activation(GO:0043031) |
| 0.0 | 0.0 | GO:1903147 | negative regulation of macromitophagy(GO:1901525) negative regulation of mitophagy(GO:1903147) |
| 0.0 | 0.3 | GO:0070262 | peptidyl-serine dephosphorylation(GO:0070262) |
| 0.0 | 0.1 | GO:0048703 | embryonic viscerocranium morphogenesis(GO:0048703) |
| 0.0 | 0.2 | GO:0051764 | actin crosslink formation(GO:0051764) |
| 0.0 | 0.0 | GO:0050713 | negative regulation of interleukin-1 beta secretion(GO:0050713) |
| 0.0 | 0.1 | GO:0042758 | long-chain fatty acid catabolic process(GO:0042758) |
| 0.0 | 0.0 | GO:0065001 | specification of axis polarity(GO:0065001) |
| 0.0 | 0.1 | GO:0045198 | establishment of epithelial cell apical/basal polarity(GO:0045198) |
| 0.0 | 0.0 | GO:0035093 | female meiosis sister chromatid cohesion(GO:0007066) spermatogenesis, exchange of chromosomal proteins(GO:0035093) |
| 0.0 | 0.2 | GO:0035058 | nonmotile primary cilium assembly(GO:0035058) regulation of nonmotile primary cilium assembly(GO:1902855) positive regulation of nonmotile primary cilium assembly(GO:1902857) |
| 0.0 | 0.1 | GO:0043654 | recognition of apoptotic cell(GO:0043654) |
| 0.0 | 0.4 | GO:0030199 | collagen fibril organization(GO:0030199) |
| 0.0 | 0.2 | GO:0071157 | negative regulation of cell cycle arrest(GO:0071157) |
| 0.0 | 0.0 | GO:2000298 | regulation of Rho-dependent protein serine/threonine kinase activity(GO:2000298) |
| 0.0 | 0.2 | GO:0036010 | protein localization to endosome(GO:0036010) |
| 0.0 | 0.0 | GO:0032510 | endosome to lysosome transport via multivesicular body sorting pathway(GO:0032510) |
| 0.0 | 0.1 | GO:0019563 | glycerol catabolic process(GO:0019563) |
| 0.0 | 0.2 | GO:0019430 | removal of superoxide radicals(GO:0019430) |
| 0.0 | 0.1 | GO:0034390 | smooth muscle cell apoptotic process(GO:0034390) regulation of smooth muscle cell apoptotic process(GO:0034391) |
| 0.0 | 0.3 | GO:0060218 | hematopoietic stem cell differentiation(GO:0060218) |
| 0.0 | 0.1 | GO:0097119 | postsynaptic density protein 95 clustering(GO:0097119) |
| 0.0 | 0.0 | GO:1902445 | regulation of mitochondrial membrane permeability involved in programmed necrotic cell death(GO:1902445) |
| 0.0 | 0.3 | GO:0071108 | protein K48-linked deubiquitination(GO:0071108) |
| 0.0 | 0.0 | GO:0098735 | positive regulation of the force of heart contraction(GO:0098735) |
| 0.0 | 0.1 | GO:0045821 | positive regulation of glycolytic process(GO:0045821) |
| 0.0 | 0.2 | GO:0046548 | retinal rod cell development(GO:0046548) |
| 0.0 | 0.1 | GO:1902237 | positive regulation of endoplasmic reticulum stress-induced intrinsic apoptotic signaling pathway(GO:1902237) |
| 0.0 | 0.3 | GO:0097062 | dendritic spine maintenance(GO:0097062) |
| 0.0 | 0.2 | GO:0015812 | gamma-aminobutyric acid transport(GO:0015812) |
| 0.0 | 0.0 | GO:0070681 | glutaminyl-tRNAGln biosynthesis via transamidation(GO:0070681) |
| 0.0 | 0.3 | GO:0018345 | protein palmitoylation(GO:0018345) |
| 0.0 | 0.5 | GO:0046854 | phosphatidylinositol phosphorylation(GO:0046854) |
| 0.0 | 0.3 | GO:0010614 | negative regulation of cardiac muscle hypertrophy(GO:0010614) |
| 0.0 | 0.1 | GO:0007256 | activation of JNKK activity(GO:0007256) |
| 0.0 | 0.1 | GO:0043486 | histone exchange(GO:0043486) |
| 0.0 | 0.1 | GO:2000641 | regulation of early endosome to late endosome transport(GO:2000641) |
| 0.0 | 0.3 | GO:0006891 | intra-Golgi vesicle-mediated transport(GO:0006891) |
| 0.0 | 0.0 | GO:0051958 | methotrexate transport(GO:0051958) |
| 0.0 | 0.1 | GO:0051533 | positive regulation of NFAT protein import into nucleus(GO:0051533) |
| 0.0 | 0.1 | GO:0019464 | glycine catabolic process(GO:0006546) glycine decarboxylation via glycine cleavage system(GO:0019464) |
| 0.0 | 0.1 | GO:0000303 | response to superoxide(GO:0000303) |
| 0.0 | 0.2 | GO:0030574 | collagen catabolic process(GO:0030574) |
| 0.0 | 0.0 | GO:0019896 | axonal transport of mitochondrion(GO:0019896) |
| 0.0 | 0.3 | GO:0034067 | protein localization to Golgi apparatus(GO:0034067) |
| 0.0 | 0.0 | GO:0006772 | thiamine metabolic process(GO:0006772) thiamine diphosphate metabolic process(GO:0042357) thiamine-containing compound metabolic process(GO:0042723) |
| 0.0 | 0.1 | GO:0090161 | Golgi ribbon formation(GO:0090161) |
| 0.0 | 0.1 | GO:0021891 | olfactory bulb interneuron development(GO:0021891) |
| 0.0 | 0.2 | GO:0033169 | histone H3-K9 demethylation(GO:0033169) |
| 0.0 | 0.2 | GO:0009263 | deoxyribonucleotide biosynthetic process(GO:0009263) |
| 0.0 | 0.4 | GO:0010107 | potassium ion import(GO:0010107) |
| 0.0 | 0.0 | GO:0009449 | gamma-aminobutyric acid biosynthetic process(GO:0009449) |
| 0.0 | 0.1 | GO:0001842 | neural fold formation(GO:0001842) |
| 0.0 | 0.0 | GO:0060708 | spongiotrophoblast differentiation(GO:0060708) |
| 0.0 | 0.0 | GO:0001923 | B-1 B cell differentiation(GO:0001923) |
| 0.0 | 0.1 | GO:0046085 | adenosine metabolic process(GO:0046085) |
| 0.0 | 0.1 | GO:1990440 | positive regulation of transcription from RNA polymerase II promoter in response to endoplasmic reticulum stress(GO:1990440) |
| 0.0 | 0.1 | GO:0060068 | vagina development(GO:0060068) |
| 0.0 | 0.4 | GO:0048791 | calcium ion-regulated exocytosis of neurotransmitter(GO:0048791) |
| 0.0 | 0.0 | GO:0060821 | inactivation of X chromosome by DNA methylation(GO:0060821) |
| 0.0 | 0.1 | GO:0071625 | vocalization behavior(GO:0071625) |
| 0.0 | 0.0 | GO:1903422 | negative regulation of synaptic vesicle recycling(GO:1903422) |
| 0.0 | 0.1 | GO:0006353 | DNA-templated transcription, termination(GO:0006353) |
| 0.0 | 0.0 | GO:2000973 | regulation of pro-B cell differentiation(GO:2000973) |
| 0.0 | 0.1 | GO:0072502 | cellular phosphate ion homeostasis(GO:0030643) cellular trivalent inorganic anion homeostasis(GO:0072502) |
| 0.0 | 0.0 | GO:0070940 | dephosphorylation of RNA polymerase II C-terminal domain(GO:0070940) |
| 0.0 | 0.1 | GO:0046602 | regulation of mitotic centrosome separation(GO:0046602) |
| 0.0 | 0.0 | GO:1903116 | positive regulation of actin filament-based movement(GO:1903116) |
| 0.0 | 0.0 | GO:0016480 | negative regulation of transcription from RNA polymerase III promoter(GO:0016480) |
| 0.0 | 0.0 | GO:1904742 | regulation of telomeric DNA binding(GO:1904742) |
| 0.0 | 0.0 | GO:0046726 | positive regulation by virus of viral protein levels in host cell(GO:0046726) |
| 0.0 | 0.1 | GO:0050966 | detection of mechanical stimulus involved in sensory perception of pain(GO:0050966) |
| 0.0 | 0.1 | GO:1901029 | negative regulation of mitochondrial outer membrane permeabilization involved in apoptotic signaling pathway(GO:1901029) |
Gene overrepresentation in cellular component category:
| Log-likelihood per target | Total log-likelihood | Term | Description |
|---|---|---|---|
| 0.2 | 0.5 | GO:0070033 | synaptobrevin 2-SNAP-25-syntaxin-1a-complexin II complex(GO:0070033) |
| 0.2 | 1.8 | GO:0098831 | presynaptic active zone cytoplasmic component(GO:0098831) |
| 0.2 | 0.2 | GO:0031105 | septin complex(GO:0031105) |
| 0.2 | 0.5 | GO:0005899 | insulin receptor complex(GO:0005899) |
| 0.2 | 0.5 | GO:0097444 | spine apparatus(GO:0097444) |
| 0.2 | 0.5 | GO:0033557 | Slx1-Slx4 complex(GO:0033557) |
| 0.1 | 0.6 | GO:0034274 | Atg12-Atg5-Atg16 complex(GO:0034274) |
| 0.1 | 0.9 | GO:0070044 | synaptobrevin 2-SNAP-25-syntaxin-1a complex(GO:0070044) |
| 0.1 | 2.5 | GO:0031235 | intrinsic component of the cytoplasmic side of the plasma membrane(GO:0031235) |
| 0.1 | 0.6 | GO:0005588 | collagen type V trimer(GO:0005588) |
| 0.1 | 0.5 | GO:0035339 | SPOTS complex(GO:0035339) |
| 0.1 | 0.3 | GO:0002944 | cyclin K-CDK12 complex(GO:0002944) |
| 0.1 | 0.3 | GO:0071149 | TEAD-2-YAP complex(GO:0071149) |
| 0.1 | 1.2 | GO:0032009 | early phagosome(GO:0032009) |
| 0.1 | 0.7 | GO:0001739 | sex chromatin(GO:0001739) |
| 0.1 | 0.3 | GO:0032173 | septin collar(GO:0032173) |
| 0.1 | 1.0 | GO:0044294 | dendritic growth cone(GO:0044294) |
| 0.1 | 0.5 | GO:0071556 | integral component of cytoplasmic side of endoplasmic reticulum membrane(GO:0071458) integral component of lumenal side of endoplasmic reticulum membrane(GO:0071556) lumenal side of endoplasmic reticulum membrane(GO:0098553) |
| 0.1 | 0.6 | GO:0044300 | cerebellar mossy fiber(GO:0044300) |
| 0.1 | 0.6 | GO:0090571 | RNA polymerase II transcription repressor complex(GO:0090571) |
| 0.1 | 0.5 | GO:0042584 | chromaffin granule membrane(GO:0042584) |
| 0.1 | 0.2 | GO:0098855 | HCN channel complex(GO:0098855) |
| 0.1 | 0.6 | GO:1990316 | ATG1/ULK1 kinase complex(GO:1990316) |
| 0.1 | 1.3 | GO:0017146 | NMDA selective glutamate receptor complex(GO:0017146) |
| 0.1 | 0.2 | GO:0034667 | integrin alpha3-beta1 complex(GO:0034667) |
| 0.1 | 0.1 | GO:1990257 | piccolo-bassoon transport vesicle(GO:1990257) |
| 0.1 | 0.6 | GO:0030314 | junctional membrane complex(GO:0030314) |
| 0.1 | 0.2 | GO:0098837 | postsynaptic recycling endosome(GO:0098837) |
| 0.1 | 0.2 | GO:0016533 | cyclin-dependent protein kinase 5 holoenzyme complex(GO:0016533) |
| 0.1 | 0.3 | GO:0034365 | discoidal high-density lipoprotein particle(GO:0034365) |
| 0.1 | 0.7 | GO:0044327 | dendritic spine head(GO:0044327) |
| 0.1 | 1.1 | GO:0005766 | primary lysosome(GO:0005766) azurophil granule(GO:0042582) |
| 0.1 | 0.5 | GO:0005583 | fibrillar collagen trimer(GO:0005583) banded collagen fibril(GO:0098643) |
| 0.1 | 0.2 | GO:1990682 | CSF1-CSF1R complex(GO:1990682) |
| 0.1 | 0.3 | GO:0044614 | nuclear pore cytoplasmic filaments(GO:0044614) |
| 0.1 | 0.4 | GO:0033093 | Weibel-Palade body(GO:0033093) |
| 0.1 | 0.3 | GO:1990393 | 3M complex(GO:1990393) |
| 0.1 | 0.4 | GO:0097227 | sperm annulus(GO:0097227) |
| 0.1 | 0.3 | GO:0072534 | perineuronal net(GO:0072534) |
| 0.1 | 1.2 | GO:1902711 | GABA-A receptor complex(GO:1902711) |
| 0.1 | 0.2 | GO:0005967 | mitochondrial pyruvate dehydrogenase complex(GO:0005967) |
| 0.1 | 1.1 | GO:1990124 | messenger ribonucleoprotein complex(GO:1990124) |
| 0.0 | 0.1 | GO:0044611 | nuclear pore inner ring(GO:0044611) |
| 0.0 | 0.1 | GO:0033648 | host intracellular organelle(GO:0033647) host intracellular membrane-bounded organelle(GO:0033648) |
| 0.0 | 0.3 | GO:0033268 | node of Ranvier(GO:0033268) |
| 0.0 | 0.4 | GO:0043203 | axon hillock(GO:0043203) |
| 0.0 | 0.2 | GO:0005971 | ribonucleoside-diphosphate reductase complex(GO:0005971) |
| 0.0 | 0.2 | GO:0071953 | elastic fiber(GO:0071953) |
| 0.0 | 0.4 | GO:1990909 | Wnt signalosome(GO:1990909) |
| 0.0 | 0.3 | GO:0034993 | microtubule organizing center attachment site(GO:0034992) LINC complex(GO:0034993) |
| 0.0 | 0.4 | GO:0008091 | spectrin(GO:0008091) |
| 0.0 | 0.1 | GO:0000438 | core TFIIH complex portion of holo TFIIH complex(GO:0000438) |
| 0.0 | 0.5 | GO:0016342 | catenin complex(GO:0016342) |
| 0.0 | 0.1 | GO:0048269 | methionine adenosyltransferase complex(GO:0048269) |
| 0.0 | 0.1 | GO:0031166 | integral component of vacuolar membrane(GO:0031166) intrinsic component of vacuolar membrane(GO:0031310) |
| 0.0 | 1.2 | GO:0032590 | dendrite membrane(GO:0032590) |
| 0.0 | 0.5 | GO:0030132 | clathrin coat of coated pit(GO:0030132) |
| 0.0 | 0.1 | GO:0031309 | intrinsic component of nuclear outer membrane(GO:0031308) integral component of nuclear outer membrane(GO:0031309) |
| 0.0 | 0.5 | GO:0032045 | guanyl-nucleotide exchange factor complex(GO:0032045) |
| 0.0 | 0.2 | GO:0032389 | MutLalpha complex(GO:0032389) |
| 0.0 | 0.1 | GO:0098574 | cytoplasmic side of lysosomal membrane(GO:0098574) |
| 0.0 | 0.2 | GO:0061689 | tricellular tight junction(GO:0061689) |
| 0.0 | 0.2 | GO:0035976 | AP1 complex(GO:0035976) |
| 0.0 | 0.2 | GO:0097443 | sorting endosome(GO:0097443) |
| 0.0 | 0.2 | GO:0016942 | insulin-like growth factor binding protein complex(GO:0016942) growth factor complex(GO:0036454) |
| 0.0 | 0.2 | GO:0005672 | transcription factor TFIIA complex(GO:0005672) |
| 0.0 | 0.2 | GO:0097197 | tetraspanin-enriched microdomain(GO:0097197) |
| 0.0 | 0.3 | GO:0036056 | filtration diaphragm(GO:0036056) slit diaphragm(GO:0036057) |
| 0.0 | 0.1 | GO:0097513 | myosin II filament(GO:0097513) |
| 0.0 | 0.2 | GO:0097136 | Bcl-2 family protein complex(GO:0097136) |
| 0.0 | 0.4 | GO:0031597 | cytosolic proteasome complex(GO:0031597) |
| 0.0 | 0.1 | GO:0097441 | basilar dendrite(GO:0097441) |
| 0.0 | 0.7 | GO:0032809 | neuronal cell body membrane(GO:0032809) |
| 0.0 | 0.2 | GO:0005677 | chromatin silencing complex(GO:0005677) |
| 0.0 | 0.1 | GO:0072559 | NLRP3 inflammasome complex(GO:0072559) |
| 0.0 | 0.5 | GO:0097449 | astrocyte projection(GO:0097449) |
| 0.0 | 0.5 | GO:0043194 | axon initial segment(GO:0043194) |
| 0.0 | 0.3 | GO:0012510 | trans-Golgi network transport vesicle membrane(GO:0012510) |
| 0.0 | 1.2 | GO:0031519 | PcG protein complex(GO:0031519) |
| 0.0 | 0.3 | GO:0001527 | microfibril(GO:0001527) fibril(GO:0043205) |
| 0.0 | 0.2 | GO:0071598 | neuronal ribonucleoprotein granule(GO:0071598) |
| 0.0 | 0.2 | GO:0071821 | FANCM-MHF complex(GO:0071821) |
| 0.0 | 0.1 | GO:0055087 | Ski complex(GO:0055087) |
| 0.0 | 0.2 | GO:0097470 | ribbon synapse(GO:0097470) |
| 0.0 | 0.1 | GO:0008622 | epsilon DNA polymerase complex(GO:0008622) |
| 0.0 | 0.1 | GO:0097169 | AIM2 inflammasome complex(GO:0097169) |
| 0.0 | 0.3 | GO:0031932 | TORC2 complex(GO:0031932) |
| 0.0 | 0.1 | GO:0036387 | nuclear pre-replicative complex(GO:0005656) pre-replicative complex(GO:0036387) |
| 0.0 | 0.1 | GO:0097543 | ciliary inversin compartment(GO:0097543) |
| 0.0 | 0.1 | GO:0030015 | CCR4-NOT core complex(GO:0030015) |
| 0.0 | 0.3 | GO:0016514 | SWI/SNF complex(GO:0016514) |
| 0.0 | 0.3 | GO:0032279 | asymmetric synapse(GO:0032279) |
| 0.0 | 0.1 | GO:0016602 | CCAAT-binding factor complex(GO:0016602) |
| 0.0 | 1.7 | GO:0000118 | histone deacetylase complex(GO:0000118) |
| 0.0 | 0.5 | GO:0001518 | voltage-gated sodium channel complex(GO:0001518) |
| 0.0 | 0.9 | GO:0005891 | voltage-gated calcium channel complex(GO:0005891) |
| 0.0 | 0.1 | GO:0061574 | ASAP complex(GO:0061574) |
| 0.0 | 0.1 | GO:0005668 | RNA polymerase transcription factor SL1 complex(GO:0005668) |
| 0.0 | 0.1 | GO:0002947 | tumor necrosis factor receptor superfamily complex(GO:0002947) |
| 0.0 | 0.3 | GO:0031045 | dense core granule(GO:0031045) |
| 0.0 | 0.3 | GO:0005883 | neurofilament(GO:0005883) |
| 0.0 | 0.0 | GO:0034666 | integrin alpha2-beta1 complex(GO:0034666) |
| 0.0 | 0.1 | GO:0002193 | MAML1-RBP-Jkappa- ICN1 complex(GO:0002193) |
| 0.0 | 0.6 | GO:0032281 | AMPA glutamate receptor complex(GO:0032281) |
| 0.0 | 0.1 | GO:1990357 | terminal web(GO:1990357) |
| 0.0 | 1.0 | GO:0002102 | podosome(GO:0002102) |
| 0.0 | 0.2 | GO:0043202 | lysosomal lumen(GO:0043202) |
| 0.0 | 0.3 | GO:0044666 | MLL3/4 complex(GO:0044666) |
| 0.0 | 0.2 | GO:0070776 | H3 histone acetyltransferase complex(GO:0070775) MOZ/MORF histone acetyltransferase complex(GO:0070776) |
| 0.0 | 0.1 | GO:0034363 | intermediate-density lipoprotein particle(GO:0034363) |
| 0.0 | 0.1 | GO:0031074 | nucleocytoplasmic shuttling complex(GO:0031074) |
| 0.0 | 0.5 | GO:0000159 | protein phosphatase type 2A complex(GO:0000159) |
| 0.0 | 0.1 | GO:0071203 | WASH complex(GO:0071203) |
| 0.0 | 0.2 | GO:0005796 | Golgi lumen(GO:0005796) |
| 0.0 | 0.1 | GO:0042825 | TAP complex(GO:0042825) |
| 0.0 | 0.2 | GO:0008290 | F-actin capping protein complex(GO:0008290) |
| 0.0 | 0.3 | GO:0098563 | integral component of synaptic vesicle membrane(GO:0030285) intrinsic component of synaptic vesicle membrane(GO:0098563) |
| 0.0 | 0.2 | GO:0000974 | Prp19 complex(GO:0000974) |
| 0.0 | 0.2 | GO:0044232 | organelle membrane contact site(GO:0044232) |
| 0.0 | 0.1 | GO:0097512 | cardiac myofibril(GO:0097512) |
| 0.0 | 0.1 | GO:0070937 | CRD-mediated mRNA stability complex(GO:0070937) |
| 0.0 | 0.2 | GO:0071437 | invadopodium(GO:0071437) |
| 0.0 | 0.2 | GO:0031588 | nucleotide-activated protein kinase complex(GO:0031588) |
| 0.0 | 0.1 | GO:0005927 | muscle tendon junction(GO:0005927) |
| 0.0 | 0.1 | GO:1990745 | GARP complex(GO:0000938) EARP complex(GO:1990745) |
| 0.0 | 0.0 | GO:0000802 | transverse filament(GO:0000802) |
| 0.0 | 0.1 | GO:0090544 | BAF-type complex(GO:0090544) |
| 0.0 | 0.1 | GO:0009331 | glycerol-3-phosphate dehydrogenase complex(GO:0009331) |
| 0.0 | 0.3 | GO:0005942 | phosphatidylinositol 3-kinase complex(GO:0005942) |
| 0.0 | 0.5 | GO:0008180 | COP9 signalosome(GO:0008180) |
| 0.0 | 2.4 | GO:0030027 | lamellipodium(GO:0030027) |
| 0.0 | 0.1 | GO:0005968 | Rab-protein geranylgeranyltransferase complex(GO:0005968) |
| 0.0 | 0.2 | GO:0001891 | phagocytic cup(GO:0001891) |
| 0.0 | 0.2 | GO:0031464 | Cul4A-RING E3 ubiquitin ligase complex(GO:0031464) |
| 0.0 | 0.3 | GO:0000145 | exocyst(GO:0000145) |
| 0.0 | 0.0 | GO:0030956 | glutamyl-tRNA(Gln) amidotransferase complex(GO:0030956) |
| 0.0 | 0.7 | GO:0030315 | T-tubule(GO:0030315) |
| 0.0 | 0.1 | GO:0045252 | oxoglutarate dehydrogenase complex(GO:0045252) |
| 0.0 | 0.1 | GO:0032541 | cortical endoplasmic reticulum(GO:0032541) |
| 0.0 | 0.1 | GO:0044292 | dendrite terminus(GO:0044292) |
| 0.0 | 0.0 | GO:1990907 | beta-catenin-TCF complex(GO:1990907) |
| 0.0 | 0.2 | GO:0005845 | mRNA cap binding complex(GO:0005845) |
| 0.0 | 0.7 | GO:0019005 | SCF ubiquitin ligase complex(GO:0019005) |
| 0.0 | 0.1 | GO:0000801 | central element(GO:0000801) |
| 0.0 | 0.5 | GO:0000307 | cyclin-dependent protein kinase holoenzyme complex(GO:0000307) |
| 0.0 | 0.1 | GO:0042382 | paraspeckles(GO:0042382) |
| 0.0 | 0.4 | GO:0055038 | recycling endosome membrane(GO:0055038) |
| 0.0 | 0.1 | GO:0033179 | proton-transporting V-type ATPase, V0 domain(GO:0033179) |
| 0.0 | 0.6 | GO:0030672 | synaptic vesicle membrane(GO:0030672) exocytic vesicle membrane(GO:0099501) |
| 0.0 | 0.1 | GO:0000124 | SAGA complex(GO:0000124) |
| 0.0 | 0.1 | GO:0000836 | ER ubiquitin ligase complex(GO:0000835) Hrd1p ubiquitin ligase complex(GO:0000836) |
| 0.0 | 0.1 | GO:0000798 | nuclear cohesin complex(GO:0000798) |
| 0.0 | 0.2 | GO:0042629 | mast cell granule(GO:0042629) |
Gene overrepresentation in molecular function category:
| Log-likelihood per target | Total log-likelihood | Term | Description |
|---|---|---|---|
| 0.3 | 1.0 | GO:0005119 | smoothened binding(GO:0005119) |
| 0.3 | 1.5 | GO:0031697 | beta-1 adrenergic receptor binding(GO:0031697) |
| 0.2 | 0.7 | GO:0005483 | soluble NSF attachment protein activity(GO:0005483) |
| 0.2 | 1.1 | GO:0004517 | nitric-oxide synthase activity(GO:0004517) |
| 0.2 | 1.3 | GO:0030160 | GKAP/Homer scaffold activity(GO:0030160) |
| 0.2 | 0.7 | GO:0015272 | ATP-activated inward rectifier potassium channel activity(GO:0015272) |
| 0.2 | 0.5 | GO:0004874 | aryl hydrocarbon receptor activity(GO:0004874) |
| 0.1 | 0.4 | GO:0016309 | 1-phosphatidylinositol-5-phosphate 4-kinase activity(GO:0016309) |
| 0.1 | 0.4 | GO:0016900 | oxidoreductase activity, acting on the CH-OH group of donors, disulfide as acceptor(GO:0016900) vitamin-K-epoxide reductase (warfarin-sensitive) activity(GO:0047057) |
| 0.1 | 0.4 | GO:0043533 | inositol 1,3,4,5 tetrakisphosphate binding(GO:0043533) |
| 0.1 | 0.5 | GO:0000822 | inositol hexakisphosphate binding(GO:0000822) |
| 0.1 | 0.5 | GO:0004969 | histamine receptor activity(GO:0004969) |
| 0.1 | 0.9 | GO:0005007 | fibroblast growth factor-activated receptor activity(GO:0005007) |
| 0.1 | 1.5 | GO:0001206 | transcriptional repressor activity, RNA polymerase II distal enhancer sequence-specific binding(GO:0001206) |
| 0.1 | 0.3 | GO:1902379 | chemoattractant activity involved in axon guidance(GO:1902379) |
| 0.1 | 0.8 | GO:0005173 | stem cell factor receptor binding(GO:0005173) |
| 0.1 | 0.4 | GO:0003831 | beta-N-acetylglucosaminylglycopeptide beta-1,4-galactosyltransferase activity(GO:0003831) |
| 0.1 | 0.9 | GO:0019992 | diacylglycerol binding(GO:0019992) |
| 0.1 | 0.5 | GO:0032795 | heterotrimeric G-protein binding(GO:0032795) |
| 0.1 | 0.3 | GO:0043812 | phosphatidylinositol-4-phosphate phosphatase activity(GO:0043812) |
| 0.1 | 0.3 | GO:0031852 | mu-type opioid receptor binding(GO:0031852) |
| 0.1 | 0.8 | GO:0003680 | AT DNA binding(GO:0003680) |
| 0.1 | 0.3 | GO:0035939 | microsatellite binding(GO:0035939) |
| 0.1 | 1.3 | GO:0048407 | platelet-derived growth factor binding(GO:0048407) |
| 0.1 | 0.6 | GO:0005432 | calcium:sodium antiporter activity(GO:0005432) |
| 0.1 | 0.5 | GO:0042500 | aspartic endopeptidase activity, intramembrane cleaving(GO:0042500) |
| 0.1 | 1.7 | GO:0030548 | acetylcholine receptor regulator activity(GO:0030548) neurotransmitter receptor regulator activity(GO:0099602) |
| 0.1 | 0.2 | GO:0005157 | macrophage colony-stimulating factor receptor binding(GO:0005157) |
| 0.1 | 0.3 | GO:0051431 | corticotropin-releasing hormone receptor 2 binding(GO:0051431) |
| 0.1 | 0.3 | GO:0015186 | L-glutamine transmembrane transporter activity(GO:0015186) |
| 0.1 | 0.4 | GO:0042731 | PH domain binding(GO:0042731) |
| 0.1 | 0.5 | GO:0017108 | 5'-flap endonuclease activity(GO:0017108) |
| 0.1 | 0.2 | GO:0008401 | retinoic acid 4-hydroxylase activity(GO:0008401) |
| 0.1 | 0.3 | GO:0097016 | L27 domain binding(GO:0097016) |
| 0.1 | 0.3 | GO:0004105 | choline-phosphate cytidylyltransferase activity(GO:0004105) |
| 0.1 | 0.4 | GO:0019871 | sodium channel inhibitor activity(GO:0019871) |
| 0.1 | 0.4 | GO:0015016 | [heparan sulfate]-glucosamine N-sulfotransferase activity(GO:0015016) |
| 0.1 | 0.4 | GO:0035374 | chondroitin sulfate binding(GO:0035374) |
| 0.1 | 0.4 | GO:0038062 | protein tyrosine kinase collagen receptor activity(GO:0038062) |
| 0.1 | 4.1 | GO:0050840 | extracellular matrix binding(GO:0050840) |
| 0.1 | 0.5 | GO:0005068 | transmembrane receptor protein tyrosine kinase adaptor activity(GO:0005068) |
| 0.1 | 0.8 | GO:0030215 | semaphorin receptor binding(GO:0030215) |
| 0.1 | 0.5 | GO:0008430 | selenium binding(GO:0008430) |
| 0.1 | 0.4 | GO:0045503 | dynein light chain binding(GO:0045503) |
| 0.1 | 0.4 | GO:0030250 | cyclase activator activity(GO:0010853) guanylate cyclase activator activity(GO:0030250) |
| 0.1 | 0.3 | GO:0047696 | beta-adrenergic receptor kinase activity(GO:0047696) |
| 0.1 | 0.2 | GO:0003989 | acetyl-CoA carboxylase activity(GO:0003989) |
| 0.1 | 0.3 | GO:0005332 | gamma-aminobutyric acid:sodium symporter activity(GO:0005332) |
| 0.1 | 1.4 | GO:0017091 | AU-rich element binding(GO:0017091) |
| 0.1 | 0.2 | GO:0030977 | taurine binding(GO:0030977) |
| 0.1 | 0.4 | GO:0086006 | voltage-gated sodium channel activity involved in cardiac muscle cell action potential(GO:0086006) |
| 0.1 | 0.8 | GO:0051400 | BH domain binding(GO:0051400) |
| 0.1 | 0.2 | GO:0072590 | N-acetyl-L-aspartate-L-glutamate ligase activity(GO:0072590) |
| 0.1 | 0.3 | GO:0035662 | Toll-like receptor 4 binding(GO:0035662) |
| 0.0 | 1.2 | GO:0004890 | GABA-A receptor activity(GO:0004890) |
| 0.0 | 0.1 | GO:0031871 | proteinase activated receptor binding(GO:0031871) |
| 0.0 | 0.2 | GO:0042289 | MHC class II protein binding(GO:0042289) |
| 0.0 | 0.5 | GO:0000900 | translation repressor activity, nucleic acid binding(GO:0000900) |
| 0.0 | 0.1 | GO:0035651 | AP-3 adaptor complex binding(GO:0035651) |
| 0.0 | 0.9 | GO:0005242 | inward rectifier potassium channel activity(GO:0005242) |
| 0.0 | 0.6 | GO:0031078 | histone deacetylase activity (H3-K14 specific)(GO:0031078) NAD-dependent histone deacetylase activity (H3-K14 specific)(GO:0032041) |
| 0.0 | 0.2 | GO:0004720 | protein-lysine 6-oxidase activity(GO:0004720) |
| 0.0 | 0.2 | GO:0019776 | Atg8 ligase activity(GO:0019776) |
| 0.0 | 0.2 | GO:0003886 | DNA (cytosine-5-)-methyltransferase activity(GO:0003886) |
| 0.0 | 0.3 | GO:0097109 | neuroligin family protein binding(GO:0097109) |
| 0.0 | 0.2 | GO:0051033 | nucleic acid transmembrane transporter activity(GO:0051032) RNA transmembrane transporter activity(GO:0051033) |
| 0.0 | 1.1 | GO:0005086 | ARF guanyl-nucleotide exchange factor activity(GO:0005086) |
| 0.0 | 0.2 | GO:0005030 | neurotrophin receptor activity(GO:0005030) |
| 0.0 | 0.3 | GO:0008889 | glycerophosphodiester phosphodiesterase activity(GO:0008889) |
| 0.0 | 0.5 | GO:0050321 | tau-protein kinase activity(GO:0050321) |
| 0.0 | 0.2 | GO:0000403 | Y-form DNA binding(GO:0000403) |
| 0.0 | 0.3 | GO:0046935 | 1-phosphatidylinositol-3-kinase regulator activity(GO:0046935) |
| 0.0 | 0.2 | GO:0004558 | alpha-1,4-glucosidase activity(GO:0004558) |
| 0.0 | 0.0 | GO:0099510 | calcium ion binding involved in regulation of cytosolic calcium ion concentration(GO:0099510) |
| 0.0 | 0.2 | GO:0005006 | epidermal growth factor-activated receptor activity(GO:0005006) |
| 0.0 | 0.2 | GO:0005136 | interleukin-4 receptor binding(GO:0005136) |
| 0.0 | 0.4 | GO:0098879 | structural constituent of postsynaptic specialization(GO:0098879) structural constituent of postsynaptic density(GO:0098919) |
| 0.0 | 0.2 | GO:1904315 | transmitter-gated ion channel activity involved in regulation of postsynaptic membrane potential(GO:1904315) |
| 0.0 | 0.1 | GO:0004478 | methionine adenosyltransferase activity(GO:0004478) |
| 0.0 | 0.1 | GO:0004768 | stearoyl-CoA 9-desaturase activity(GO:0004768) |
| 0.0 | 0.1 | GO:0000827 | inositol-1,3,4,5,6-pentakisphosphate kinase activity(GO:0000827) |
| 0.0 | 0.2 | GO:0004740 | pyruvate dehydrogenase (acetyl-transferring) kinase activity(GO:0004740) |
| 0.0 | 0.3 | GO:0001972 | retinoic acid binding(GO:0001972) |
| 0.0 | 0.2 | GO:0031544 | peptidyl-proline 3-dioxygenase activity(GO:0031544) |
| 0.0 | 0.2 | GO:0001156 | TFIIIC-class transcription factor binding(GO:0001156) |
| 0.0 | 1.1 | GO:0017075 | syntaxin-1 binding(GO:0017075) |
| 0.0 | 0.2 | GO:0004616 | phosphogluconate dehydrogenase (decarboxylating) activity(GO:0004616) |
| 0.0 | 0.1 | GO:0030626 | U12 snRNA binding(GO:0030626) |
| 0.0 | 0.1 | GO:0047751 | 3-oxo-5-alpha-steroid 4-dehydrogenase activity(GO:0003865) cholestenone 5-alpha-reductase activity(GO:0047751) |
| 0.0 | 0.3 | GO:0043559 | insulin binding(GO:0043559) |
| 0.0 | 0.4 | GO:0004705 | JUN kinase activity(GO:0004705) SAP kinase activity(GO:0016909) |
| 0.0 | 0.3 | GO:0016176 | superoxide-generating NADPH oxidase activator activity(GO:0016176) |
| 0.0 | 0.2 | GO:0008332 | low voltage-gated calcium channel activity(GO:0008332) |
| 0.0 | 0.1 | GO:0010314 | phosphatidylinositol-5-phosphate binding(GO:0010314) |
| 0.0 | 0.4 | GO:0042809 | vitamin D receptor binding(GO:0042809) |
| 0.0 | 0.1 | GO:0000386 | second spliceosomal transesterification activity(GO:0000386) |
| 0.0 | 0.8 | GO:0030676 | Rac guanyl-nucleotide exchange factor activity(GO:0030676) |
| 0.0 | 0.5 | GO:0000400 | four-way junction DNA binding(GO:0000400) |
| 0.0 | 0.3 | GO:1990380 | Lys48-specific deubiquitinase activity(GO:1990380) |
| 0.0 | 0.2 | GO:0005005 | transmembrane-ephrin receptor activity(GO:0005005) |
| 0.0 | 0.1 | GO:0035403 | histone kinase activity (H3-T6 specific)(GO:0035403) |
| 0.0 | 0.4 | GO:0070742 | C2H2 zinc finger domain binding(GO:0070742) |
| 0.0 | 0.2 | GO:0042030 | ATPase inhibitor activity(GO:0042030) |
| 0.0 | 0.3 | GO:0043208 | glycosphingolipid binding(GO:0043208) |
| 0.0 | 0.0 | GO:0035671 | steroid dehydrogenase activity, acting on the CH-CH group of donors(GO:0033765) enone reductase activity(GO:0035671) |
| 0.0 | 0.6 | GO:0031005 | filamin binding(GO:0031005) |
| 0.0 | 0.2 | GO:0001155 | TFIIIA-class transcription factor binding(GO:0001155) |
| 0.0 | 0.5 | GO:0051378 | serotonin binding(GO:0051378) |
| 0.0 | 0.2 | GO:0016721 | superoxide dismutase activity(GO:0004784) oxidoreductase activity, acting on superoxide radicals as acceptor(GO:0016721) |
| 0.0 | 0.3 | GO:0004972 | NMDA glutamate receptor activity(GO:0004972) |
| 0.0 | 0.2 | GO:0061731 | ribonucleoside-diphosphate reductase activity, thioredoxin disulfide as acceptor(GO:0004748) oxidoreductase activity, acting on CH or CH2 groups, disulfide as acceptor(GO:0016728) ribonucleoside-diphosphate reductase activity(GO:0061731) |
| 0.0 | 0.1 | GO:0004040 | amidase activity(GO:0004040) |
| 0.0 | 0.2 | GO:0001602 | pancreatic polypeptide receptor activity(GO:0001602) |
| 0.0 | 0.1 | GO:0004711 | ribosomal protein S6 kinase activity(GO:0004711) |
| 0.0 | 0.2 | GO:0031995 | insulin-like growth factor II binding(GO:0031995) |
| 0.0 | 0.3 | GO:0051766 | inositol trisphosphate kinase activity(GO:0051766) |
| 0.0 | 0.1 | GO:0030350 | iron-responsive element binding(GO:0030350) |
| 0.0 | 0.7 | GO:0035259 | glucocorticoid receptor binding(GO:0035259) |
| 0.0 | 0.1 | GO:0031127 | galactoside 2-alpha-L-fucosyltransferase activity(GO:0008107) alpha-(1,2)-fucosyltransferase activity(GO:0031127) |
| 0.0 | 0.1 | GO:0043426 | MRF binding(GO:0043426) |
| 0.0 | 0.1 | GO:1902282 | voltage-gated potassium channel activity involved in ventricular cardiac muscle cell action potential repolarization(GO:1902282) |
| 0.0 | 0.2 | GO:0015349 | thyroid hormone transmembrane transporter activity(GO:0015349) |
| 0.0 | 0.5 | GO:0032794 | GTPase activating protein binding(GO:0032794) |
| 0.0 | 0.3 | GO:0008140 | cAMP response element binding protein binding(GO:0008140) |
| 0.0 | 0.3 | GO:0017151 | DEAD/H-box RNA helicase binding(GO:0017151) |
| 0.0 | 0.1 | GO:1990829 | C-rich single-stranded DNA binding(GO:1990829) |
| 0.0 | 0.1 | GO:0038085 | vascular endothelial growth factor binding(GO:0038085) |
| 0.0 | 0.2 | GO:0004445 | inositol-polyphosphate 5-phosphatase activity(GO:0004445) |
| 0.0 | 0.3 | GO:0015245 | fatty acid transporter activity(GO:0015245) |
| 0.0 | 0.8 | GO:0001965 | G-protein alpha-subunit binding(GO:0001965) |
| 0.0 | 0.1 | GO:0017077 | oxidative phosphorylation uncoupler activity(GO:0017077) |
| 0.0 | 0.3 | GO:0008432 | JUN kinase binding(GO:0008432) |
| 0.0 | 0.5 | GO:0071837 | HMG box domain binding(GO:0071837) |
| 0.0 | 0.5 | GO:0032183 | SUMO binding(GO:0032183) |
| 0.0 | 0.3 | GO:0003873 | 6-phosphofructo-2-kinase activity(GO:0003873) fructose-2,6-bisphosphate 2-phosphatase activity(GO:0004331) |
| 0.0 | 0.1 | GO:0052591 | sn-glycerol-3-phosphate:ubiquinone oxidoreductase activity(GO:0052590) sn-glycerol-3-phosphate:ubiquinone-8 oxidoreductase activity(GO:0052591) |
| 0.0 | 0.4 | GO:0008195 | phosphatidate phosphatase activity(GO:0008195) |
| 0.0 | 0.1 | GO:0005219 | ryanodine-sensitive calcium-release channel activity(GO:0005219) |
| 0.0 | 2.0 | GO:1902936 | phosphatidylinositol bisphosphate binding(GO:1902936) |
| 0.0 | 0.1 | GO:0047756 | chondroitin 4-sulfotransferase activity(GO:0047756) N-acetylgalactosamine 4-sulfate 6-O-sulfotransferase activity(GO:0050659) |
| 0.0 | 0.1 | GO:0004920 | interleukin-10 receptor activity(GO:0004920) |
| 0.0 | 0.3 | GO:0015379 | potassium:chloride symporter activity(GO:0015379) potassium ion symporter activity(GO:0022820) |
| 0.0 | 0.2 | GO:0008429 | phosphatidylethanolamine binding(GO:0008429) |
| 0.0 | 0.1 | GO:0016748 | succinyltransferase activity(GO:0016748) |
| 0.0 | 0.1 | GO:0046920 | alpha-(1->3)-fucosyltransferase activity(GO:0046920) |
| 0.0 | 0.2 | GO:0070016 | armadillo repeat domain binding(GO:0070016) |
| 0.0 | 0.1 | GO:0033906 | hyaluronoglucuronidase activity(GO:0033906) |
| 0.0 | 0.1 | GO:0015440 | peptide-transporting ATPase activity(GO:0015440) |
| 0.0 | 0.1 | GO:0004830 | tryptophan-tRNA ligase activity(GO:0004830) |
| 0.0 | 0.2 | GO:0001055 | RNA polymerase II activity(GO:0001055) |
| 0.0 | 0.1 | GO:0001733 | galactosylceramide sulfotransferase activity(GO:0001733) |
| 0.0 | 0.7 | GO:0042605 | peptide antigen binding(GO:0042605) |
| 0.0 | 0.1 | GO:0003828 | alpha-N-acetylneuraminate alpha-2,8-sialyltransferase activity(GO:0003828) |
| 0.0 | 0.1 | GO:0008417 | fucosyltransferase activity(GO:0008417) |
| 0.0 | 4.7 | GO:0005096 | GTPase activator activity(GO:0005096) |
| 0.0 | 0.1 | GO:0004020 | adenylylsulfate kinase activity(GO:0004020) sulfate adenylyltransferase activity(GO:0004779) sulfate adenylyltransferase (ATP) activity(GO:0004781) |
| 0.0 | 0.0 | GO:0048408 | epidermal growth factor binding(GO:0048408) |
| 0.0 | 0.1 | GO:0004949 | cannabinoid receptor activity(GO:0004949) |
| 0.0 | 0.4 | GO:0008353 | RNA polymerase II carboxy-terminal domain kinase activity(GO:0008353) |
| 0.0 | 0.1 | GO:0031493 | nucleosomal histone binding(GO:0031493) |
| 0.0 | 0.3 | GO:0017056 | structural constituent of nuclear pore(GO:0017056) |
| 0.0 | 0.3 | GO:0017160 | Ral GTPase binding(GO:0017160) |
| 0.0 | 0.1 | GO:0070653 | high-density lipoprotein particle receptor binding(GO:0070653) |
| 0.0 | 0.1 | GO:0050265 | RNA uridylyltransferase activity(GO:0050265) |
| 0.0 | 0.6 | GO:1990841 | promoter-specific chromatin binding(GO:1990841) |
| 0.0 | 0.2 | GO:0008656 | cysteine-type endopeptidase activator activity involved in apoptotic process(GO:0008656) |
| 0.0 | 0.3 | GO:0071889 | 14-3-3 protein binding(GO:0071889) |
| 0.0 | 0.1 | GO:0070883 | pre-miRNA binding(GO:0070883) |
| 0.0 | 0.3 | GO:0017017 | MAP kinase tyrosine/serine/threonine phosphatase activity(GO:0017017) |
| 0.0 | 0.1 | GO:0031698 | beta-2 adrenergic receptor binding(GO:0031698) |
| 0.0 | 0.4 | GO:0043027 | cysteine-type endopeptidase inhibitor activity involved in apoptotic process(GO:0043027) |
| 0.0 | 0.2 | GO:0015125 | bile acid transmembrane transporter activity(GO:0015125) |
| 0.0 | 0.2 | GO:0005149 | interleukin-1 receptor binding(GO:0005149) |
| 0.0 | 0.1 | GO:0043120 | tumor necrosis factor binding(GO:0043120) |
| 0.0 | 0.3 | GO:0034236 | protein kinase A catalytic subunit binding(GO:0034236) |
| 0.0 | 0.1 | GO:0016308 | 1-phosphatidylinositol-4-phosphate 5-kinase activity(GO:0016308) |
| 0.0 | 0.2 | GO:0015187 | glycine transmembrane transporter activity(GO:0015187) |
| 0.0 | 0.1 | GO:0089720 | caspase binding(GO:0089720) |
| 0.0 | 0.2 | GO:0042043 | neurexin family protein binding(GO:0042043) |
| 0.0 | 0.1 | GO:0034186 | apolipoprotein A-I binding(GO:0034186) |
| 0.0 | 0.0 | GO:0008481 | sphinganine kinase activity(GO:0008481) |
| 0.0 | 0.6 | GO:0017112 | Rab guanyl-nucleotide exchange factor activity(GO:0017112) |
| 0.0 | 0.3 | GO:0004535 | poly(A)-specific ribonuclease activity(GO:0004535) |
| 0.0 | 0.2 | GO:0031432 | titin binding(GO:0031432) |
| 0.0 | 0.3 | GO:0004198 | calcium-dependent cysteine-type endopeptidase activity(GO:0004198) |
| 0.0 | 0.3 | GO:0015279 | store-operated calcium channel activity(GO:0015279) |
| 0.0 | 0.4 | GO:0070064 | proline-rich region binding(GO:0070064) |
| 0.0 | 0.2 | GO:0015095 | magnesium ion transmembrane transporter activity(GO:0015095) |
| 0.0 | 0.1 | GO:0004427 | inorganic diphosphatase activity(GO:0004427) |
| 0.0 | 0.3 | GO:0070412 | R-SMAD binding(GO:0070412) |
| 0.0 | 0.2 | GO:0004089 | carbonate dehydratase activity(GO:0004089) |
| 0.0 | 0.1 | GO:0004095 | carnitine O-palmitoyltransferase activity(GO:0004095) O-palmitoyltransferase activity(GO:0016416) |
| 0.0 | 0.4 | GO:0001106 | RNA polymerase II transcription corepressor activity(GO:0001106) |
| 0.0 | 0.2 | GO:0017154 | semaphorin receptor activity(GO:0017154) |
| 0.0 | 0.1 | GO:0008865 | glucokinase activity(GO:0004340) hexokinase activity(GO:0004396) fructokinase activity(GO:0008865) mannokinase activity(GO:0019158) |
| 0.0 | 0.2 | GO:0031434 | mitogen-activated protein kinase kinase binding(GO:0031434) |
| 0.0 | 0.3 | GO:0070577 | lysine-acetylated histone binding(GO:0070577) |
| 0.0 | 0.3 | GO:0003950 | NAD+ ADP-ribosyltransferase activity(GO:0003950) |
| 0.0 | 0.6 | GO:0005245 | voltage-gated calcium channel activity(GO:0005245) |
| 0.0 | 0.1 | GO:0004563 | beta-N-acetylhexosaminidase activity(GO:0004563) |
| 0.0 | 0.8 | GO:0005089 | Rho guanyl-nucleotide exchange factor activity(GO:0005089) |
| 0.0 | 0.1 | GO:0016175 | superoxide-generating NADPH oxidase activity(GO:0016175) |
| 0.0 | 0.3 | GO:0032452 | histone demethylase activity(GO:0032452) |
| 0.0 | 0.1 | GO:0004065 | arylsulfatase activity(GO:0004065) |
| 0.0 | 0.1 | GO:0001054 | RNA polymerase I activity(GO:0001054) |
| 0.0 | 0.1 | GO:0000293 | ferric-chelate reductase activity(GO:0000293) |
| 0.0 | 0.6 | GO:0030507 | spectrin binding(GO:0030507) |
| 0.0 | 0.1 | GO:0015189 | L-lysine transmembrane transporter activity(GO:0015189) |
| 0.0 | 0.0 | GO:0015350 | methotrexate transporter activity(GO:0015350) |
| 0.0 | 0.1 | GO:0071532 | ankyrin repeat binding(GO:0071532) |
| 0.0 | 0.1 | GO:0003917 | DNA topoisomerase type I activity(GO:0003917) |
| 0.0 | 0.0 | GO:0060072 | large conductance calcium-activated potassium channel activity(GO:0060072) |
| 0.0 | 0.2 | GO:0004629 | phosphatidylinositol phospholipase C activity(GO:0004435) phospholipase C activity(GO:0004629) |
| 0.0 | 0.2 | GO:0030247 | pattern binding(GO:0001871) polysaccharide binding(GO:0030247) |
| 0.0 | 0.1 | GO:0015252 | hydrogen ion channel activity(GO:0015252) |
| 0.0 | 0.0 | GO:0004351 | glutamate decarboxylase activity(GO:0004351) |
| 0.0 | 1.1 | GO:0031490 | chromatin DNA binding(GO:0031490) |
| 0.0 | 0.0 | GO:0071936 | coreceptor activity involved in Wnt signaling pathway(GO:0071936) |
| 0.0 | 0.1 | GO:0050692 | DBD domain binding(GO:0050692) |
| 0.0 | 0.1 | GO:0004862 | cAMP-dependent protein kinase inhibitor activity(GO:0004862) |
| 0.0 | 0.1 | GO:0001013 | RNA polymerase I regulatory region DNA binding(GO:0001013) RNA polymerase I regulatory region sequence-specific DNA binding(GO:0001163) RNA polymerase I CORE element sequence-specific DNA binding(GO:0001164) |
| 0.0 | 0.0 | GO:0001875 | lipopolysaccharide receptor activity(GO:0001875) |
| 0.0 | 0.1 | GO:0097322 | 7SK snRNA binding(GO:0097322) |
| 0.0 | 0.3 | GO:0019706 | protein-cysteine S-palmitoyltransferase activity(GO:0019706) protein-cysteine S-acyltransferase activity(GO:0019707) |
| 0.0 | 0.5 | GO:0005201 | extracellular matrix structural constituent(GO:0005201) |
| 0.0 | 0.1 | GO:0008484 | sulfuric ester hydrolase activity(GO:0008484) |
| 0.0 | 0.1 | GO:0016726 | xanthine dehydrogenase activity(GO:0004854) oxidoreductase activity, acting on CH or CH2 groups, NAD or NADP as acceptor(GO:0016726) |
| 0.0 | 0.2 | GO:0030169 | low-density lipoprotein particle binding(GO:0030169) |
| 0.0 | 0.1 | GO:0005003 | ephrin receptor activity(GO:0005003) |
Gene overrepresentation in curated gene sets: canonical pathways category:
| Log-likelihood per target | Total log-likelihood | Term | Description |
|---|---|---|---|
| 0.1 | 0.5 | SA PTEN PATHWAY | PTEN is a tumor suppressor that dephosphorylates the lipid messenger phosphatidylinositol triphosphate. |
| 0.1 | 3.5 | PID INTEGRIN A4B1 PATHWAY | Alpha4 beta1 integrin signaling events |
| 0.1 | 2.6 | PID RAS PATHWAY | Regulation of Ras family activation |
| 0.1 | 1.2 | PID HEDGEHOG 2PATHWAY | Signaling events mediated by the Hedgehog family |
| 0.0 | 1.4 | PID HDAC CLASSIII PATHWAY | Signaling events mediated by HDAC Class III |
| 0.0 | 1.1 | ST GA12 PATHWAY | G alpha 12 Pathway |
| 0.0 | 1.1 | PID NEPHRIN NEPH1 PATHWAY | Nephrin/Neph1 signaling in the kidney podocyte |
| 0.0 | 0.5 | PID ANTHRAX PATHWAY | Cellular roles of Anthrax toxin |
| 0.0 | 1.1 | SIG IL4RECEPTOR IN B LYPHOCYTES | Genes related to IL4 rceptor signaling in B lymphocytes |
| 0.0 | 0.1 | PID P38 ALPHA BETA PATHWAY | Regulation of p38-alpha and p38-beta |
| 0.0 | 0.1 | PID SMAD2 3PATHWAY | Regulation of cytoplasmic and nuclear SMAD2/3 signaling |
| 0.0 | 0.7 | ST WNT CA2 CYCLIC GMP PATHWAY | Wnt/Ca2+/cyclic GMP signaling. |
| 0.0 | 0.7 | PID CONE PATHWAY | Visual signal transduction: Cones |
| 0.0 | 0.2 | ST TYPE I INTERFERON PATHWAY | Type I Interferon (alpha/beta IFN) Pathway |
| 0.0 | 1.4 | PID RAC1 REG PATHWAY | Regulation of RAC1 activity |
| 0.0 | 0.6 | PID EPHB FWD PATHWAY | EPHB forward signaling |
| 0.0 | 0.2 | ST STAT3 PATHWAY | STAT3 Pathway |
| 0.0 | 1.4 | NABA COLLAGENS | Genes encoding collagen proteins |
| 0.0 | 0.5 | PID NETRIN PATHWAY | Netrin-mediated signaling events |
| 0.0 | 0.4 | PID HIF1A PATHWAY | Hypoxic and oxygen homeostasis regulation of HIF-1-alpha |
| 0.0 | 1.5 | PID RB 1PATHWAY | Regulation of retinoblastoma protein |
| 0.0 | 1.0 | PID NFAT TFPATHWAY | Calcineurin-regulated NFAT-dependent transcription in lymphocytes |
| 0.0 | 0.4 | PID RET PATHWAY | Signaling events regulated by Ret tyrosine kinase |
| 0.0 | 0.6 | PID P38 MKK3 6PATHWAY | p38 MAPK signaling pathway |
| 0.0 | 0.4 | PID S1P S1P1 PATHWAY | S1P1 pathway |
| 0.0 | 0.9 | PID CDC42 PATHWAY | CDC42 signaling events |
| 0.0 | 1.3 | PID NOTCH PATHWAY | Notch signaling pathway |
| 0.0 | 1.0 | PID FGF PATHWAY | FGF signaling pathway |
| 0.0 | 0.3 | ST B CELL ANTIGEN RECEPTOR | B Cell Antigen Receptor |
| 0.0 | 0.1 | PID EPHA2 FWD PATHWAY | EPHA2 forward signaling |
| 0.0 | 0.2 | SA PROGRAMMED CELL DEATH | Programmed cell death, or apoptosis, eliminates damaged or unneeded cells. |
| 0.0 | 0.2 | ST G ALPHA I PATHWAY | G alpha i Pathway |
| 0.0 | 0.1 | PID PRL SIGNALING EVENTS PATHWAY | Signaling events mediated by PRL |
| 0.0 | 0.0 | SA G1 AND S PHASES | Cdk2, 4, and 6 bind cyclin D in G1, while cdk2/cyclin E promotes the G1/S transition. |
| 0.0 | 1.9 | NABA ECM AFFILIATED | Genes encoding proteins affiliated structurally or functionally to extracellular matrix proteins |
| 0.0 | 0.5 | NABA BASEMENT MEMBRANES | Genes encoding structural components of basement membranes |
| 0.0 | 0.2 | PID ALK2 PATHWAY | ALK2 signaling events |
| 0.0 | 0.5 | PID ARF6 TRAFFICKING PATHWAY | Arf6 trafficking events |
| 0.0 | 0.1 | PID ECADHERIN NASCENT AJ PATHWAY | E-cadherin signaling in the nascent adherens junction |
| 0.0 | 0.2 | SA CASPASE CASCADE | Apoptosis is mediated by caspases, cysteine proteases arranged in a proteolytic cascade. |
| 0.0 | 0.3 | PID KIT PATHWAY | Signaling events mediated by Stem cell factor receptor (c-Kit) |
| 0.0 | 0.1 | PID WNT NONCANONICAL PATHWAY | Noncanonical Wnt signaling pathway |
| 0.0 | 0.0 | SA B CELL RECEPTOR COMPLEXES | Antigen binding to B cell receptors activates protein tyrosine kinases, such as the Src family, which ultimate activate MAP kinases. |
| 0.0 | 0.5 | NABA PROTEOGLYCANS | Genes encoding proteoglycans |
| 0.0 | 0.1 | PID BETA CATENIN DEG PATHWAY | Degradation of beta catenin |
| 0.0 | 0.2 | PID ERBB1 INTERNALIZATION PATHWAY | Internalization of ErbB1 |
| 0.0 | 0.6 | PID HDAC CLASSI PATHWAY | Signaling events mediated by HDAC Class I |
Gene overrepresentation in curated gene sets: REACTOME pathways category:
| Log-likelihood per target | Total log-likelihood | Term | Description |
|---|---|---|---|
| 0.2 | 0.3 | REACTOME SIGNALING BY ACTIVATED POINT MUTANTS OF FGFR1 | Genes involved in Signaling by activated point mutants of FGFR1 |
| 0.1 | 1.2 | REACTOME GABA A RECEPTOR ACTIVATION | Genes involved in GABA A receptor activation |
| 0.1 | 0.8 | REACTOME SIGNALING BY FGFR3 MUTANTS | Genes involved in Signaling by FGFR3 mutants |
| 0.1 | 1.1 | REACTOME CRMPS IN SEMA3A SIGNALING | Genes involved in CRMPs in Sema3A signaling |
| 0.1 | 1.3 | REACTOME REGULATION OF GENE EXPRESSION IN BETA CELLS | Genes involved in Regulation of gene expression in beta cells |
| 0.1 | 0.8 | REACTOME ACETYLCHOLINE NEUROTRANSMITTER RELEASE CYCLE | Genes involved in Acetylcholine Neurotransmitter Release Cycle |
| 0.0 | 2.0 | REACTOME PI3K AKT ACTIVATION | Genes involved in PI3K/AKT activation |
| 0.0 | 5.1 | REACTOME SIGNALING BY PDGF | Genes involved in Signaling by PDGF |
| 0.0 | 0.5 | REACTOME REGULATION OF SIGNALING BY CBL | Genes involved in Regulation of signaling by CBL |
| 0.0 | 0.6 | REACTOME SIGNALING BY NOTCH3 | Genes involved in Signaling by NOTCH3 |
| 0.0 | 0.6 | REACTOME CREB PHOSPHORYLATION THROUGH THE ACTIVATION OF CAMKII | Genes involved in CREB phosphorylation through the activation of CaMKII |
| 0.0 | 0.2 | REACTOME VEGF LIGAND RECEPTOR INTERACTIONS | Genes involved in VEGF ligand-receptor interactions |
| 0.0 | 1.3 | REACTOME INHIBITION OF VOLTAGE GATED CA2 CHANNELS VIA GBETA GAMMA SUBUNITS | Genes involved in Inhibition of voltage gated Ca2+ channels via Gbeta/gamma subunits |
| 0.0 | 1.0 | REACTOME PLATELET CALCIUM HOMEOSTASIS | Genes involved in Platelet calcium homeostasis |
| 0.0 | 0.6 | REACTOME SEROTONIN RECEPTORS | Genes involved in Serotonin receptors |
| 0.0 | 0.3 | REACTOME NEPHRIN INTERACTIONS | Genes involved in Nephrin interactions |
| 0.0 | 1.7 | REACTOME NRAGE SIGNALS DEATH THROUGH JNK | Genes involved in NRAGE signals death through JNK |
| 0.0 | 1.0 | REACTOME MYOGENESIS | Genes involved in Myogenesis |
| 0.0 | 0.3 | REACTOME ACTIVATION OF THE AP1 FAMILY OF TRANSCRIPTION FACTORS | Genes involved in Activation of the AP-1 family of transcription factors |
| 0.0 | 1.6 | REACTOME NOTCH1 INTRACELLULAR DOMAIN REGULATES TRANSCRIPTION | Genes involved in NOTCH1 Intracellular Domain Regulates Transcription |
| 0.0 | 0.5 | REACTOME NUCLEOTIDE LIKE PURINERGIC RECEPTORS | Genes involved in Nucleotide-like (purinergic) receptors |
| 0.0 | 0.8 | REACTOME NITRIC OXIDE STIMULATES GUANYLATE CYCLASE | Genes involved in Nitric oxide stimulates guanylate cyclase |
| 0.0 | 0.3 | REACTOME DCC MEDIATED ATTRACTIVE SIGNALING | Genes involved in DCC mediated attractive signaling |
| 0.0 | 0.8 | REACTOME SYNTHESIS OF PIPS AT THE PLASMA MEMBRANE | Genes involved in Synthesis of PIPs at the plasma membrane |
| 0.0 | 0.6 | REACTOME SYNTHESIS OF PC | Genes involved in Synthesis of PC |
| 0.0 | 1.0 | REACTOME SIGNALING BY ROBO RECEPTOR | Genes involved in Signaling by Robo receptor |
| 0.0 | 0.1 | REACTOME G BETA GAMMA SIGNALLING THROUGH PI3KGAMMA | Genes involved in G beta:gamma signalling through PI3Kgamma |
| 0.0 | 1.0 | REACTOME COLLAGEN FORMATION | Genes involved in Collagen formation |
| 0.0 | 0.1 | REACTOME DSCAM INTERACTIONS | Genes involved in DSCAM interactions |
| 0.0 | 0.8 | REACTOME INTERACTION BETWEEN L1 AND ANKYRINS | Genes involved in Interaction between L1 and Ankyrins |
| 0.0 | 0.8 | REACTOME AMINO ACID TRANSPORT ACROSS THE PLASMA MEMBRANE | Genes involved in Amino acid transport across the plasma membrane |
| 0.0 | 0.2 | REACTOME IRAK2 MEDIATED ACTIVATION OF TAK1 COMPLEX UPON TLR7 8 OR 9 STIMULATION | Genes involved in IRAK2 mediated activation of TAK1 complex upon TLR7/8 or 9 stimulation |
| 0.0 | 0.1 | REACTOME CELL DEATH SIGNALLING VIA NRAGE NRIF AND NADE | Genes involved in Cell death signalling via NRAGE, NRIF and NADE |
| 0.0 | 0.4 | REACTOME SIGNALING BY HIPPO | Genes involved in Signaling by Hippo |
| 0.0 | 0.2 | REACTOME ALPHA LINOLENIC ACID ALA METABOLISM | Genes involved in alpha-linolenic acid (ALA) metabolism |
| 0.0 | 0.0 | REACTOME SHC1 EVENTS IN EGFR SIGNALING | Genes involved in SHC1 events in EGFR signaling |
| 0.0 | 1.4 | REACTOME CLASS B 2 SECRETIN FAMILY RECEPTORS | Genes involved in Class B/2 (Secretin family receptors) |
| 0.0 | 0.1 | REACTOME REGULATION OF KIT SIGNALING | Genes involved in Regulation of KIT signaling |
| 0.0 | 0.3 | REACTOME MRNA DECAY BY 5 TO 3 EXORIBONUCLEASE | Genes involved in mRNA Decay by 5' to 3' Exoribonuclease |
| 0.0 | 0.4 | REACTOME INSULIN SYNTHESIS AND PROCESSING | Genes involved in Insulin Synthesis and Processing |
| 0.0 | 0.2 | REACTOME PURINE CATABOLISM | Genes involved in Purine catabolism |
| 0.0 | 0.2 | REACTOME SIGNALING BY FGFR1 FUSION MUTANTS | Genes involved in Signaling by FGFR1 fusion mutants |
| 0.0 | 0.2 | REACTOME TRANSPORT OF ORGANIC ANIONS | Genes involved in Transport of organic anions |
| 0.0 | 0.0 | REACTOME ADP SIGNALLING THROUGH P2RY12 | Genes involved in ADP signalling through P2Y purinoceptor 12 |
| 0.0 | 0.3 | REACTOME ADHERENS JUNCTIONS INTERACTIONS | Genes involved in Adherens junctions interactions |
| 0.0 | 0.0 | REACTOME NEP NS2 INTERACTS WITH THE CELLULAR EXPORT MACHINERY | Genes involved in NEP/NS2 Interacts with the Cellular Export Machinery |
| 0.0 | 0.1 | REACTOME ANDROGEN BIOSYNTHESIS | Genes involved in Androgen biosynthesis |
| 0.0 | 0.3 | REACTOME INFLAMMASOMES | Genes involved in Inflammasomes |
| 0.0 | 0.5 | REACTOME G ALPHA S SIGNALLING EVENTS | Genes involved in G alpha (s) signalling events |
| 0.0 | 0.1 | REACTOME GAB1 SIGNALOSOME | Genes involved in GAB1 signalosome |
| 0.0 | 0.1 | REACTOME THE ACTIVATION OF ARYLSULFATASES | Genes involved in The activation of arylsulfatases |
| 0.0 | 0.1 | REACTOME CTNNB1 PHOSPHORYLATION CASCADE | Genes involved in Beta-catenin phosphorylation cascade |
| 0.0 | 0.2 | REACTOME EGFR DOWNREGULATION | Genes involved in EGFR downregulation |
| 0.0 | 0.4 | REACTOME G1 PHASE | Genes involved in G1 Phase |
| 0.0 | 0.2 | REACTOME MICRORNA MIRNA BIOGENESIS | Genes involved in MicroRNA (miRNA) Biogenesis |
| 0.0 | 0.2 | REACTOME N GLYCAN ANTENNAE ELONGATION | Genes involved in N-Glycan antennae elongation |
| 0.0 | 0.3 | REACTOME INTRINSIC PATHWAY FOR APOPTOSIS | Genes involved in Intrinsic Pathway for Apoptosis |
| 0.0 | 0.1 | REACTOME ACTIVATION OF CHAPERONE GENES BY ATF6 ALPHA | Genes involved in Activation of Chaperone Genes by ATF6-alpha |
| 0.0 | 0.2 | REACTOME RNA POL I TRANSCRIPTION TERMINATION | Genes involved in RNA Polymerase I Transcription Termination |
| 0.0 | 0.2 | REACTOME TRAFFICKING OF AMPA RECEPTORS | Genes involved in Trafficking of AMPA receptors |
| 0.0 | 0.1 | REACTOME REGULATION OF RHEB GTPASE ACTIVITY BY AMPK | Genes involved in Regulation of Rheb GTPase activity by AMPK |
| 0.0 | 0.1 | REACTOME CREB PHOSPHORYLATION THROUGH THE ACTIVATION OF RAS | Genes involved in CREB phosphorylation through the activation of Ras |
| 0.0 | 0.2 | REACTOME SEMA4D INDUCED CELL MIGRATION AND GROWTH CONE COLLAPSE | Genes involved in Sema4D induced cell migration and growth-cone collapse |