Project
GSE49485: Hypoxia transcriptome sequencing of rat brain.
Navigation
Downloads
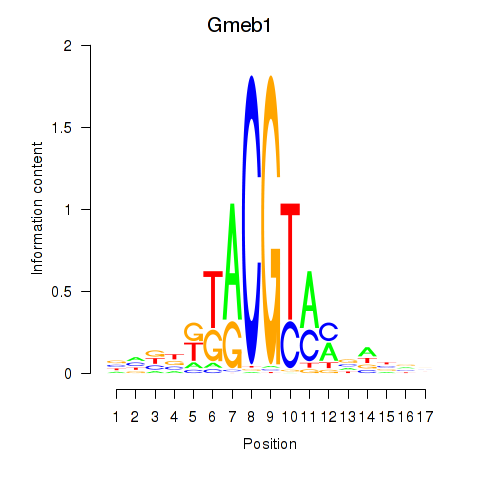
Results for Gmeb1
Z-value: 0.34
Motif logo
Transcription factors associated with Gmeb1
| Gene Symbol | Gene ID | Gene Info |
|---|---|---|
|
Gmeb1
|
ENSRNOG00000010910 | glucocorticoid modulatory element binding protein 1 |
Activity-expression correlation:
| Gene | Promoter | Pearson corr. coef. | P-value | Plot |
|---|---|---|---|---|
| Gmeb1 | rn6_v1_chr5_-_150439959_150439959 | 0.16 | 8.0e-01 | Click! |
Activity profile of Gmeb1 motif
Sorted Z-values of Gmeb1 motif
| Promoter | Log-likelihood | Transcript | Gene | Gene Info |
|---|---|---|---|---|
| chr1_+_90948976 | 0.25 |
ENSRNOT00000056877
|
LOC108348111
|
succinate dehydrogenase assembly factor 1, mitochondrial |
| chr1_-_190370499 | 0.15 |
ENSRNOT00000084389
|
AABR07005618.1
|
|
| chr5_-_151397603 | 0.10 |
ENSRNOT00000076866
|
Gpr3
|
G protein-coupled receptor 3 |
| chr9_+_102862890 | 0.09 |
ENSRNOT00000050494
ENSRNOT00000080129 |
Fam174a
|
family with sequence similarity 174, member A |
| chr1_-_80221710 | 0.09 |
ENSRNOT00000091687
|
Fosb
|
FosB proto-oncogene, AP-1 transcription factor subunit |
| chr8_+_52829085 | 0.08 |
ENSRNOT00000007754
|
RGD1563941
|
similar to hypothetical protein FLJ20010 |
| chr1_-_80221417 | 0.07 |
ENSRNOT00000072149
|
Fosb
|
FosB proto-oncogene, AP-1 transcription factor subunit |
| chr15_-_4035064 | 0.07 |
ENSRNOT00000012300
|
Fut11
|
fucosyltransferase 11 |
| chr16_-_74864816 | 0.06 |
ENSRNOT00000017164
|
Alg11
|
ALG11, alpha-1,2-mannosyltransferase |
| chr19_-_56731372 | 0.06 |
ENSRNOT00000024182
|
Nup133
|
nucleoporin 133 |
| chr1_-_222468896 | 0.06 |
ENSRNOT00000028754
|
Cox8a
|
cytochrome c oxidase subunit 8A |
| chr1_-_242441247 | 0.05 |
ENSRNOT00000068645
|
Pip5k1b
|
phosphatidylinositol-4-phosphate 5-kinase type 1 beta |
| chr9_+_15166118 | 0.04 |
ENSRNOT00000020432
|
Mdfi
|
MyoD family inhibitor |
| chr9_-_66019065 | 0.04 |
ENSRNOT00000088729
|
Als2
|
ALS2, alsin Rho guanine nucleotide exchange factor |
| chr1_-_80544825 | 0.04 |
ENSRNOT00000057802
ENSRNOT00000040060 ENSRNOT00000067049 ENSRNOT00000052387 ENSRNOT00000073352 |
Relb
|
RELB proto-oncogene, NF-kB subunit |
| chr6_+_8346704 | 0.04 |
ENSRNOT00000092218
|
AC111831.2
|
|
| chr7_-_117364697 | 0.03 |
ENSRNOT00000077314
|
Oplah
|
5-oxoprolinase (ATP-hydrolysing) |
| chr10_+_63829807 | 0.03 |
ENSRNOT00000006407
|
Crk
|
CRK proto-oncogene, adaptor protein |
| chrX_-_15347591 | 0.03 |
ENSRNOT00000037066
|
Timm17b
|
translocase of inner mitochondrial membrane 17b |
| chr8_-_108880879 | 0.03 |
ENSRNOT00000020610
|
Slc35g2
|
solute carrier family 35, member G2 |
| chr7_-_120780641 | 0.03 |
ENSRNOT00000076164
|
Ddx17
|
DEAD-box helicase 17 |
| chr1_-_88780425 | 0.03 |
ENSRNOT00000074494
|
Sdhaf1
|
succinate dehydrogenase complex assembly factor 1 |
| chr3_-_94657377 | 0.03 |
ENSRNOT00000077484
|
Tcp11l1
|
t-complex 11 like 1 |
| chr17_+_11683862 | 0.03 |
ENSRNOT00000024766
|
Msx2
|
msh homeobox 2 |
| chr10_+_83201311 | 0.03 |
ENSRNOT00000006179
|
Slc35b1
|
solute carrier family 35, member B1 |
| chr13_-_73460912 | 0.03 |
ENSRNOT00000005052
ENSRNOT00000068044 |
Qsox1
|
quiescin sulfhydryl oxidase 1 |
| chr7_-_120780108 | 0.02 |
ENSRNOT00000018185
|
Ddx17
|
DEAD-box helicase 17 |
| chr10_+_17327275 | 0.02 |
ENSRNOT00000005486
|
Ubtd2
|
ubiquitin domain containing 2 |
| chr5_+_173052063 | 0.02 |
ENSRNOT00000023274
|
Cdk11b
|
cyclin-dependent kinase 11B |
| chr3_+_55960327 | 0.02 |
ENSRNOT00000086584
|
Ppig
|
peptidylprolyl isomerase G |
| chr1_+_100845563 | 0.02 |
ENSRNOT00000027478
|
Akt1s1
|
AKT1 substrate 1 |
| chr14_+_16341536 | 0.02 |
ENSRNOT00000002924
|
Ccni
|
cyclin I |
| chrX_+_15348138 | 0.02 |
ENSRNOT00000010536
|
Pqbp1
|
polyglutamine binding protein 1 |
| chr7_-_140245723 | 0.02 |
ENSRNOT00000088999
|
Ccnt1
|
cyclin T1 |
| chr3_+_55960067 | 0.01 |
ENSRNOT00000010216
|
Ppig
|
peptidylprolyl isomerase G |
| chr1_+_261158261 | 0.01 |
ENSRNOT00000071965
|
Pgam1
|
phosphoglycerate mutase 1 |
| chr9_-_98597359 | 0.01 |
ENSRNOT00000027506
|
Per2
|
period circadian clock 2 |
| chr1_+_261337594 | 0.01 |
ENSRNOT00000019874
|
Pi4k2a
|
phosphatidylinositol 4-kinase type 2 alpha |
| chr14_+_107767392 | 0.01 |
ENSRNOT00000012847
|
Cct4
|
chaperonin containing TCP1 subunit 4 |
| chr17_+_36451058 | 0.01 |
ENSRNOT00000071408
|
Cdkal1
|
CDK5 regulatory subunit associated protein 1-like 1 |
| chr1_-_259089632 | 0.01 |
ENSRNOT00000020940
ENSRNOT00000091297 |
Aldh18a1
|
aldehyde dehydrogenase 18 family, member A1 |
| chr18_+_31444472 | 0.01 |
ENSRNOT00000075159
|
Rnf14
|
ring finger protein 14 |
| chr16_-_7290561 | 0.01 |
ENSRNOT00000036910
|
Nisch
|
nischarin |
| chr2_+_28370373 | 0.01 |
ENSRNOT00000073183
|
LOC100910438
|
ankyrin repeat family A protein 2-like |
| chr3_-_154490851 | 0.01 |
ENSRNOT00000017213
|
Tti1
|
TELO2 interacting protein 1 |
| chr1_-_259674425 | 0.01 |
ENSRNOT00000091116
|
LOC108348083
|
delta-1-pyrroline-5-carboxylate synthase |
| chr6_-_8346197 | 0.01 |
ENSRNOT00000061826
|
Prepl
|
prolyl endopeptidase-like |
| chr1_+_212281237 | 0.01 |
ENSRNOT00000075049
|
Utf1
|
undifferentiated embryonic cell transcription factor 1 |
| chr11_+_33845463 | 0.01 |
ENSRNOT00000041838
|
Cbr1
|
carbonyl reductase 1 |
| chr20_-_5155293 | 0.01 |
ENSRNOT00000092322
|
Prrc2a
|
proline-rich coiled-coil 2A |
| chr12_+_21981755 | 0.01 |
ENSRNOT00000001871
|
LOC100910540
|
7SK snRNA methylphosphate capping enzyme-like |
| chr7_+_11201690 | 0.01 |
ENSRNOT00000005624
|
Fzr1
|
fizzy/cell division cycle 20 related 1 |
| chr10_-_50402616 | 0.01 |
ENSRNOT00000004546
|
Hs3st3b1
|
heparan sulfate-glucosamine 3-sulfotransferase 3B1 |
| chr10_-_38642397 | 0.01 |
ENSRNOT00000023628
|
Hspa4
|
heat shock protein family A member 4 |
| chr15_-_37325178 | 0.01 |
ENSRNOT00000011699
|
Gja3
|
gap junction protein, alpha 3 |
| chr9_+_1313209 | 0.01 |
ENSRNOT00000083387
|
Tbc1d5
|
TBC1 domain family, member 5 |
| chr7_-_122635731 | 0.01 |
ENSRNOT00000025925
|
St13
|
suppression of tumorigenicity 13 |
| chr14_+_84211600 | 0.00 |
ENSRNOT00000005996
|
Pes1
|
pescadillo ribosomal biogenesis factor 1 |
| chr10_-_107281235 | 0.00 |
ENSRNOT00000004196
|
Cyth1
|
cytohesin 1 |
| chr1_-_222167447 | 0.00 |
ENSRNOT00000028687
|
Prdx5
|
peroxiredoxin 5 |
| chr7_+_63922879 | 0.00 |
ENSRNOT00000043581
|
RGD1565498
|
similar to Hypothetical protein LOC270802 |
| chr9_+_88110731 | 0.00 |
ENSRNOT00000088677
|
Rhbdd1
|
rhomboid domain containing 1 |
| chr2_-_231881939 | 0.00 |
ENSRNOT00000074644
|
Larp7
|
La ribonucleoprotein domain family, member 7 |
| chr10_-_36716601 | 0.00 |
ENSRNOT00000038838
|
LOC497899
|
similar to hypothetical protein 4930503F14 |
| chr10_+_38918748 | 0.00 |
ENSRNOT00000009999
|
Kif3a
|
kinesin family member 3a |
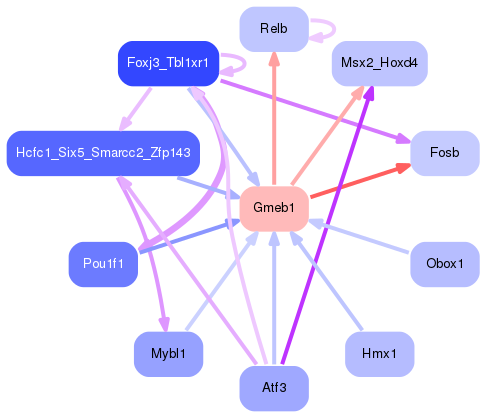
Network of associatons between targets according to the STRING database.

First level regulatory network of Gmeb1
Gene Ontology Analysis
Gene overrepresentation in biological process category:
| Log-likelihood per target | Total log-likelihood | Term | Description |
|---|---|---|---|
| 0.1 | 0.3 | GO:0034552 | respiratory chain complex II assembly(GO:0034552) mitochondrial respiratory chain complex II assembly(GO:0034553) mitochondrial respiratory chain complex II biogenesis(GO:0097032) |
Gene overrepresentation in molecular function category:
| Log-likelihood per target | Total log-likelihood | Term | Description |
|---|---|---|---|
| 0.0 | 0.1 | GO:0000026 | alpha-1,2-mannosyltransferase activity(GO:0000026) |
| 0.0 | 0.1 | GO:0046920 | alpha-(1->3)-fucosyltransferase activity(GO:0046920) |
| 0.0 | 0.0 | GO:0017168 | 5-oxoprolinase (ATP-hydrolyzing) activity(GO:0017168) |