Project
GSE49485: Hypoxia transcriptome sequencing of rat brain.
Navigation
Downloads
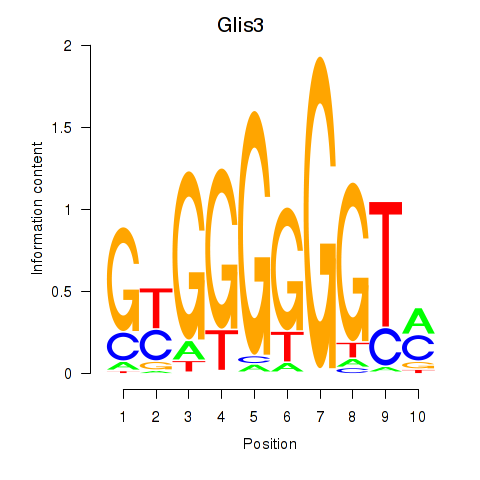
Results for Glis3
Z-value: 0.09
Motif logo
Transcription factors associated with Glis3
| Gene Symbol | Gene ID | Gene Info |
|---|---|---|
|
Glis3
|
ENSRNOG00000014768 | GLIS family zinc finger 3 |
Activity-expression correlation:
| Gene | Promoter | Pearson corr. coef. | P-value | Plot |
|---|---|---|---|---|
| Glis3 | rn6_v1_chr1_-_246785360_246785360 | 0.30 | 6.2e-01 | Click! |
Activity profile of Glis3 motif
Sorted Z-values of Glis3 motif
| Promoter | Log-likelihood | Transcript | Gene | Gene Info |
|---|---|---|---|---|
| chr17_-_1093873 | 0.04 |
ENSRNOT00000086130
|
Ptch1
|
patched 1 |
| chr3_+_61658245 | 0.02 |
ENSRNOT00000033511
|
Hoxd3
|
homeo box D3 |
| chr1_+_198214797 | 0.02 |
ENSRNOT00000068543
|
Tbx6
|
T-box 6 |
| chr1_+_72636959 | 0.02 |
ENSRNOT00000023489
|
Il11
|
interleukin 11 |
| chr1_-_216080287 | 0.02 |
ENSRNOT00000027682
|
Th
|
tyrosine hydroxylase |
| chr17_-_27112820 | 0.01 |
ENSRNOT00000018359
|
Bmp6
|
bone morphogenetic protein 6 |
| chrX_-_63204530 | 0.01 |
ENSRNOT00000076175
|
Zfx
|
zinc finger protein X-linked |
| chr7_-_119352605 | 0.01 |
ENSRNOT00000008414
|
Cacng2
|
calcium voltage-gated channel auxiliary subunit gamma 2 |
| chrX_-_13116743 | 0.01 |
ENSRNOT00000004305
|
Mid1ip1
|
MID1 interacting protein 1 |
| chr5_-_58078545 | 0.01 |
ENSRNOT00000075777
|
Cntfr
|
ciliary neurotrophic factor receptor |
| chr5_-_152247332 | 0.01 |
ENSRNOT00000077165
|
Lin28a
|
lin-28 homolog A |
| chr10_-_56409017 | 0.01 |
ENSRNOT00000020152
|
Fgf11
|
fibroblast growth factor 11 |
| chr11_-_30428073 | 0.01 |
ENSRNOT00000047741
|
Scaf4
|
SR-related CTD-associated factor 4 |
| chr10_-_85636902 | 0.00 |
ENSRNOT00000017241
|
Pcgf2
|
polycomb group ring finger 2 |
| chr7_+_144014173 | 0.00 |
ENSRNOT00000019403
|
Sp1
|
Sp1 transcription factor |
| chr10_+_93415399 | 0.00 |
ENSRNOT00000066484
|
Tlk2
|
tousled-like kinase 2 |
| chr10_-_59049482 | 0.00 |
ENSRNOT00000078272
|
Spns2
|
spinster homolog 2 |
| chr12_-_21760292 | 0.00 |
ENSRNOT00000059592
|
LOC102550456
|
TSC22 domain family protein 4-like |
| chr1_-_80689171 | 0.00 |
ENSRNOT00000045574
|
Bcam
|
basal cell adhesion molecule (Lutheran blood group) |
| chr3_-_151658417 | 0.00 |
ENSRNOT00000047246
|
LOC100910990
|
copine-1-like |
| chr7_-_140546908 | 0.00 |
ENSRNOT00000077502
|
Kmt2d
|
lysine methyltransferase 2D |
| chr1_+_78354934 | 0.00 |
ENSRNOT00000020509
|
Zc3h4
|
zinc finger CCCH-type containing 4 |
| chr10_-_83888823 | 0.00 |
ENSRNOT00000055500
|
Ube2z
|
ubiquitin-conjugating enzyme E2Z |
| chr16_-_36373546 | 0.00 |
ENSRNOT00000079552
|
Hand2
|
heart and neural crest derivatives expressed transcript 2 |
| chr11_-_83867203 | 0.00 |
ENSRNOT00000002394
|
Chrd
|
chordin |
| chr1_+_225140863 | 0.00 |
ENSRNOT00000027141
|
Mta2
|
metastasis associated 1 family, member 2 |
| chr1_-_156296161 | 0.00 |
ENSRNOT00000025653
|
Crebzf
|
CREB/ATF bZIP transcription factor |
| chrX_+_71324365 | 0.00 |
ENSRNOT00000004911
|
Nono
|
non-POU domain containing, octamer-binding |
| chr10_+_89376530 | 0.00 |
ENSRNOT00000028089
|
Rnd2
|
Rho family GTPase 2 |
| chr3_+_11679530 | 0.00 |
ENSRNOT00000074562
ENSRNOT00000071801 |
Eng
|
endoglin |
| chr5_+_104362971 | 0.00 |
ENSRNOT00000058520
|
Adamtsl1
|
ADAMTS-like 1 |
| chr8_+_61080103 | 0.00 |
ENSRNOT00000022976
|
Hmg20a
|
high mobility group 20A |
| chr12_+_21721837 | 0.00 |
ENSRNOT00000073353
|
Mepce
|
methylphosphate capping enzyme |
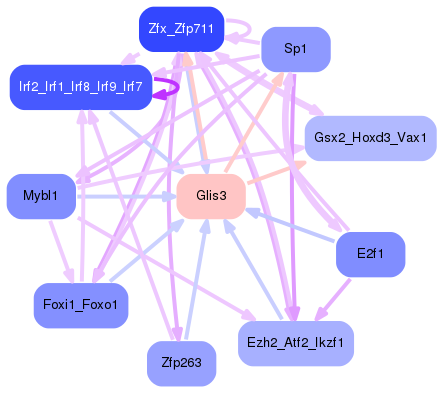
Network of associatons between targets according to the STRING database.

First level regulatory network of Glis3
Gene Ontology Analysis
Gene overrepresentation in biological process category:
| Log-likelihood per target | Total log-likelihood | Term | Description |
|---|---|---|---|
| 0.0 | 0.0 | GO:0009957 | epidermal cell fate specification(GO:0009957) response to chlorate(GO:0010157) neural plate axis specification(GO:0021997) |
Gene overrepresentation in molecular function category:
| Log-likelihood per target | Total log-likelihood | Term | Description |
|---|---|---|---|
| 0.0 | 0.0 | GO:0005119 | smoothened binding(GO:0005119) |