Project
GSE49485: Hypoxia transcriptome sequencing of rat brain.
Navigation
Downloads
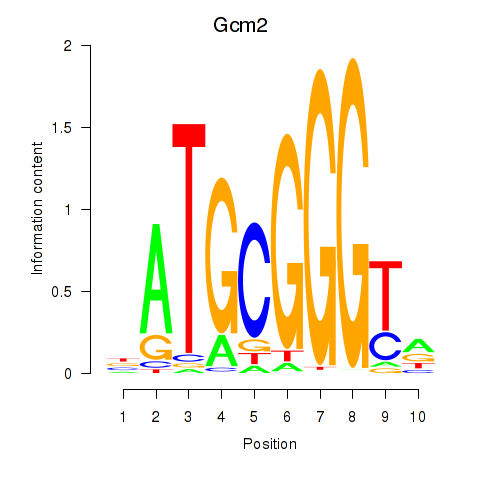
Results for Gcm2
Z-value: 0.86
Motif logo
Transcription factors associated with Gcm2
| Gene Symbol | Gene ID | Gene Info |
|---|---|---|
|
Gcm2
|
ENSRNOG00000015008 | glial cells missing homolog 2 |
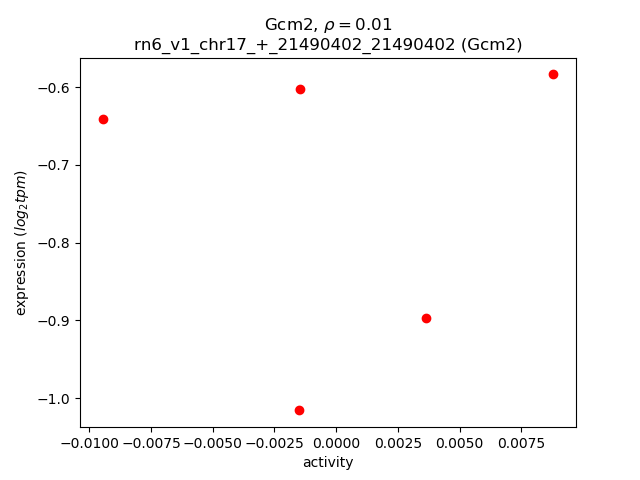
Activity-expression correlation:
| Gene | Promoter | Pearson corr. coef. | P-value | Plot |
|---|---|---|---|---|
| Gcm2 | rn6_v1_chr17_+_21490402_21490402 | 0.01 | 9.8e-01 | Click! |
Activity profile of Gcm2 motif
Sorted Z-values of Gcm2 motif
| Promoter | Log-likelihood | Transcript | Gene | Gene Info |
|---|---|---|---|---|
| chr12_+_47551935 | 0.79 |
ENSRNOT00000056932
|
RGD1560398
|
RGD1560398 |
| chr4_+_438668 | 0.75 |
ENSRNOT00000008951
|
En2
|
engrailed homeobox 2 |
| chr14_-_78707861 | 0.66 |
ENSRNOT00000091927
|
Ppp2r2c
|
protein phosphatase 2, regulatory subunit B, gamma |
| chr1_+_274245184 | 0.57 |
ENSRNOT00000018889
|
Dusp5
|
dual specificity phosphatase 5 |
| chr9_+_10305470 | 0.53 |
ENSRNOT00000072592
|
Nrtn
|
neurturin |
| chr10_-_63952726 | 0.53 |
ENSRNOT00000090461
|
Doc2b
|
double C2 domain beta |
| chr7_+_11152038 | 0.52 |
ENSRNOT00000006168
|
Nfic
|
nuclear factor I/C |
| chr6_-_99783047 | 0.52 |
ENSRNOT00000009028
|
Sptb
|
spectrin, beta, erythrocytic |
| chr10_-_15166457 | 0.50 |
ENSRNOT00000026676
|
Metrn
|
meteorin, glial cell differentiation regulator |
| chr7_+_11215328 | 0.47 |
ENSRNOT00000061194
|
LOC690617
|
hypothetical protein LOC690617 |
| chr19_+_41482728 | 0.43 |
ENSRNOT00000022943
|
Calb2
|
calbindin 2 |
| chr4_+_78263866 | 0.41 |
ENSRNOT00000033807
|
AI854703
|
expressed sequence AI854703 |
| chr8_-_6203515 | 0.39 |
ENSRNOT00000087278
ENSRNOT00000031189 ENSRNOT00000008074 ENSRNOT00000085285 ENSRNOT00000007866 |
Yap1
|
yes-associated protein 1 |
| chr16_+_73755539 | 0.38 |
ENSRNOT00000088219
|
LOC100910418
|
tissue-type plasminogen activator-like |
| chr6_+_33885495 | 0.37 |
ENSRNOT00000086633
|
Sdc1
|
syndecan 1 |
| chr7_-_123088819 | 0.35 |
ENSRNOT00000056077
|
AC096601.1
|
|
| chr10_-_85574889 | 0.35 |
ENSRNOT00000072274
|
LOC691153
|
hypothetical protein LOC691153 |
| chr9_+_17841410 | 0.33 |
ENSRNOT00000031706
|
Tmem151b
|
transmembrane protein 151B |
| chr10_-_88551056 | 0.33 |
ENSRNOT00000032737
|
Zfp385c
|
zinc finger protein 385C |
| chr5_+_120250616 | 0.32 |
ENSRNOT00000070967
|
Ak4
|
adenylate kinase 4 |
| chr16_-_71319449 | 0.32 |
ENSRNOT00000029284
|
Fgfr1
|
Fibroblast growth factor receptor 1 |
| chr7_-_107634287 | 0.30 |
ENSRNOT00000093672
ENSRNOT00000087116 |
Sla
|
src-like adaptor |
| chr10_-_61361250 | 0.30 |
ENSRNOT00000092203
|
Rap1gap2
|
RAP1 GTPase activating protein 2 |
| chr14_-_82055290 | 0.29 |
ENSRNOT00000058062
|
RGD1560394
|
RGD1560394 |
| chr7_-_13751271 | 0.29 |
ENSRNOT00000009931
|
Slc1a6
|
solute carrier family 1 member 6 |
| chr3_+_175144495 | 0.29 |
ENSRNOT00000082601
ENSRNOT00000088026 |
Cdh4
|
cadherin 4 |
| chr5_-_21345805 | 0.28 |
ENSRNOT00000081296
ENSRNOT00000007802 |
Car8
|
carbonic anhydrase 8 |
| chr3_-_114307250 | 0.28 |
ENSRNOT00000064592
|
Shf
|
Src homology 2 domain containing F |
| chr8_-_98738446 | 0.28 |
ENSRNOT00000019860
|
Zic1
|
Zic family member 1 |
| chr8_-_45215974 | 0.27 |
ENSRNOT00000010792
|
Crtam
|
cytotoxic and regulatory T cell molecule |
| chr3_-_11382004 | 0.27 |
ENSRNOT00000047921
ENSRNOT00000064039 |
Dnm1
|
dynamin 1 |
| chr10_+_109446444 | 0.25 |
ENSRNOT00000066736
|
Bahcc1
|
BAH domain and coiled-coil containing 1 |
| chrX_-_39956841 | 0.25 |
ENSRNOT00000050708
|
Klhl34
|
kelch-like family member 34 |
| chr10_+_55940533 | 0.24 |
ENSRNOT00000012061
|
RGD1563441
|
similar to RIKEN cDNA A030009H04 |
| chr5_-_138697641 | 0.24 |
ENSRNOT00000012062
|
Guca2b
|
guanylate cyclase activator 2B |
| chr1_+_87650207 | 0.24 |
ENSRNOT00000077161
|
Zfp84
|
zinc finger protein 84 |
| chr5_-_153625869 | 0.24 |
ENSRNOT00000024464
|
Clic4
|
chloride intracellular channel 4 |
| chr8_+_62723788 | 0.24 |
ENSRNOT00000010620
|
Sema7a
|
semaphorin 7A (John Milton Hagen blood group) |
| chr10_-_53037816 | 0.23 |
ENSRNOT00000057509
|
Shisa6
|
shisa family member 6 |
| chr7_+_121311024 | 0.23 |
ENSRNOT00000092260
ENSRNOT00000023066 ENSRNOT00000081377 |
Syngr1
|
synaptogyrin 1 |
| chr15_-_4035064 | 0.22 |
ENSRNOT00000012300
|
Fut11
|
fucosyltransferase 11 |
| chr15_+_37790141 | 0.22 |
ENSRNOT00000076392
ENSRNOT00000091953 |
Il17d
|
interleukin 17D |
| chr4_-_66336901 | 0.22 |
ENSRNOT00000035326
|
AABR07060293.1
|
|
| chr2_-_77632628 | 0.22 |
ENSRNOT00000073915
|
Basp1
|
brain abundant, membrane attached signal protein 1 |
| chr10_+_86399827 | 0.22 |
ENSRNOT00000009299
|
Grb7
|
growth factor receptor bound protein 7 |
| chr12_-_38782010 | 0.22 |
ENSRNOT00000001813
|
Wdr66
|
WD repeat domain 66 |
| chr15_-_56970365 | 0.22 |
ENSRNOT00000047192
|
Lrch1
|
leucine rich repeats and calponin homology domain containing 1 |
| chr8_-_116893057 | 0.22 |
ENSRNOT00000082113
|
Bsn
|
bassoon (presynaptic cytomatrix protein) |
| chr12_-_40227297 | 0.21 |
ENSRNOT00000030600
|
Fam109a
|
family with sequence similarity 109, member A |
| chr3_+_161121697 | 0.21 |
ENSRNOT00000036020
|
Wfdc10a
|
WAP four-disulfide core domain 10A |
| chr10_+_40553180 | 0.21 |
ENSRNOT00000087763
|
Slc36a1
|
solute carrier family 36 member 1 |
| chr6_+_132219088 | 0.21 |
ENSRNOT00000034883
|
Hhipl1
|
HHIP-like 1 |
| chr5_-_82168347 | 0.20 |
ENSRNOT00000084959
ENSRNOT00000084147 |
Astn2
|
astrotactin 2 |
| chr10_-_40953651 | 0.20 |
ENSRNOT00000063889
|
Glra1
|
glycine receptor, alpha 1 |
| chr9_-_38495126 | 0.20 |
ENSRNOT00000016933
ENSRNOT00000090385 |
Rab23
|
RAB23, member RAS oncogene family |
| chr14_-_80680738 | 0.20 |
ENSRNOT00000077706
|
LOC103690128
|
smoothelin-like |
| chr4_+_148139528 | 0.20 |
ENSRNOT00000092594
ENSRNOT00000015620 ENSRNOT00000092613 |
Washc2c
|
WASH complex subunit 2C |
| chr18_-_80865584 | 0.20 |
ENSRNOT00000021750
|
Tshz1
|
teashirt zinc finger homeobox 1 |
| chr8_+_12160067 | 0.20 |
ENSRNOT00000036338
|
Maml2
|
mastermind-like transcriptional coactivator 2 |
| chr3_-_153188915 | 0.20 |
ENSRNOT00000079893
|
Soga1
|
suppressor of glucose, autophagy associated 1 |
| chr10_+_36098051 | 0.19 |
ENSRNOT00000083971
|
Adamts2
|
ADAM metallopeptidase with thrombospondin type 1 motif, 2 |
| chr3_+_147358858 | 0.19 |
ENSRNOT00000012951
|
Rspo4
|
R-spondin 4 |
| chr4_-_123713319 | 0.19 |
ENSRNOT00000012875
ENSRNOT00000086982 |
Slc6a6
|
solute carrier family 6 member 6 |
| chr5_+_59080765 | 0.19 |
ENSRNOT00000021888
ENSRNOT00000064419 |
Rgp1
|
RGP1 homolog, RAB6A GEF complex partner 1 |
| chr10_+_92191718 | 0.19 |
ENSRNOT00000006764
ENSRNOT00000032941 |
Crhr1
|
corticotropin releasing hormone receptor 1 |
| chr16_-_59366824 | 0.19 |
ENSRNOT00000015062
|
RGD1304810
|
similar to 6430573F11Rik protein |
| chr18_-_31343797 | 0.19 |
ENSRNOT00000081850
|
Pcdh1
|
protocadherin 1 |
| chr10_-_103848035 | 0.18 |
ENSRNOT00000029001
|
Fads6
|
fatty acid desaturase 6 |
| chr4_-_147163467 | 0.18 |
ENSRNOT00000010748
|
Timp4
|
tissue inhibitor of metalloproteinase 4 |
| chr8_+_130762674 | 0.18 |
ENSRNOT00000005422
|
Snrk
|
SNF related kinase |
| chr19_-_25288335 | 0.18 |
ENSRNOT00000050214
|
Nanos3
|
nanos C2HC-type zinc finger 3 |
| chrX_-_73778595 | 0.18 |
ENSRNOT00000076081
ENSRNOT00000075926 ENSRNOT00000003782 |
Rlim
|
ring finger protein, LIM domain interacting |
| chr14_+_16491573 | 0.18 |
ENSRNOT00000002995
|
Sowahb
|
sosondowah ankyrin repeat domain family member B |
| chrX_+_18998532 | 0.18 |
ENSRNOT00000004213
|
AABR07037343.1
|
|
| chr19_+_24800072 | 0.18 |
ENSRNOT00000005470
|
Ptger1
|
prostaglandin E receptor 1 |
| chr3_-_72289310 | 0.18 |
ENSRNOT00000038250
|
Rtn4rl2
|
reticulon 4 receptor-like 2 |
| chr6_-_102196138 | 0.18 |
ENSRNOT00000014132
|
Tmem229b
|
transmembrane protein 229B |
| chr19_-_59502161 | 0.17 |
ENSRNOT00000075292
|
Irf2bp2
|
interferon regulatory factor 2 binding protein 2 |
| chr1_-_78212350 | 0.17 |
ENSRNOT00000071098
|
Inafm1
|
InaF-motif containing 1 |
| chr1_+_214927172 | 0.17 |
ENSRNOT00000027134
|
Brsk2
|
BR serine/threonine kinase 2 |
| chr3_+_56766475 | 0.17 |
ENSRNOT00000078819
|
Sp5
|
Sp5 transcription factor |
| chr7_-_117151256 | 0.17 |
ENSRNOT00000078846
|
Nrbp2
|
nuclear receptor binding protein 2 |
| chrX_+_33895769 | 0.17 |
ENSRNOT00000085993
ENSRNOT00000079365 |
Reps2
|
RALBP1 associated Eps domain containing protein 2 |
| chr1_-_201906286 | 0.17 |
ENSRNOT00000064511
ENSRNOT00000036625 |
RGD1560958
|
similar to RIKEN cDNA 1700063I17 |
| chr1_-_101388125 | 0.17 |
ENSRNOT00000028176
ENSRNOT00000049957 |
Snrnp70
|
small nuclear ribonucleoprotein U1 subunit 70 |
| chr10_-_70172739 | 0.17 |
ENSRNOT00000010015
|
Rffl
|
ring finger and FYVE-like domain containing E3 ubiquitin protein ligase |
| chr4_-_145147397 | 0.16 |
ENSRNOT00000010347
|
Lhfpl4
|
lipoma HMGIC fusion partner-like 4 |
| chr12_-_2555164 | 0.16 |
ENSRNOT00000084460
ENSRNOT00000061821 |
Map2k7
|
mitogen activated protein kinase kinase 7 |
| chr17_+_70684134 | 0.16 |
ENSRNOT00000025731
ENSRNOT00000068354 |
Pfkfb3
|
6-phosphofructo-2-kinase/fructose-2,6-biphosphatase 3 |
| chr1_-_89539210 | 0.16 |
ENSRNOT00000077462
ENSRNOT00000028644 |
Hpn
|
hepsin |
| chr6_-_125853461 | 0.16 |
ENSRNOT00000007505
|
Atxn3
|
ataxin 3 |
| chr6_+_137824213 | 0.16 |
ENSRNOT00000056880
|
Pacs2
|
phosphofurin acidic cluster sorting protein 2 |
| chr7_-_141307233 | 0.16 |
ENSRNOT00000071885
|
Racgap1
|
Rac GTPase-activating protein 1 |
| chr12_-_45801842 | 0.16 |
ENSRNOT00000078837
|
AABR07036513.1
|
|
| chr9_+_40972089 | 0.16 |
ENSRNOT00000067928
|
Ptpn18
|
protein tyrosine phosphatase, non-receptor type 18 |
| chr7_+_130498199 | 0.16 |
ENSRNOT00000092684
ENSRNOT00000092431 |
Shank3
|
SH3 and multiple ankyrin repeat domains 3 |
| chr10_-_76166251 | 0.16 |
ENSRNOT00000003251
ENSRNOT00000055683 |
Akap1
|
A-kinase anchoring protein 1 |
| chr7_-_101140308 | 0.16 |
ENSRNOT00000006279
|
Fam84b
|
family with sequence similarity 84, member B |
| chr4_-_150244372 | 0.16 |
ENSRNOT00000047685
|
Ret
|
ret proto-oncogene |
| chr11_+_57207656 | 0.15 |
ENSRNOT00000038207
ENSRNOT00000085754 |
Plcxd2
|
phosphatidylinositol-specific phospholipase C, X domain containing 2 |
| chr6_-_126582034 | 0.15 |
ENSRNOT00000010656
ENSRNOT00000080829 |
Itpk1
|
inositol-tetrakisphosphate 1-kinase |
| chr17_-_89881919 | 0.15 |
ENSRNOT00000090982
|
LOC100910957
|
acyl-CoA-binding domain-containing protein 5-like |
| chr4_+_153774486 | 0.15 |
ENSRNOT00000074096
|
Tuba8
|
tubulin, alpha 8 |
| chr5_-_150163395 | 0.15 |
ENSRNOT00000079935
|
Epb41
|
erythrocyte membrane protein band 4.1 |
| chr3_-_176926722 | 0.15 |
ENSRNOT00000020168
|
Zbtb46
|
zinc finger and BTB domain containing 46 |
| chr7_-_142210738 | 0.15 |
ENSRNOT00000006095
|
Pou6f1
|
POU class 6 homeobox 1 |
| chr1_-_261090437 | 0.15 |
ENSRNOT00000072055
|
Frat2
|
FRAT2, WNT signaling pathway regulator |
| chr3_+_177226417 | 0.15 |
ENSRNOT00000031328
|
Oprl1
|
opioid related nociceptin receptor 1 |
| chr12_-_35979193 | 0.15 |
ENSRNOT00000071104
|
Tmem132b
|
transmembrane protein 132B |
| chr1_+_185356975 | 0.15 |
ENSRNOT00000086681
|
Plekha7
|
pleckstrin homology domain containing A7 |
| chr14_-_82658891 | 0.15 |
ENSRNOT00000006841
|
Uvssa
|
UV-stimulated scaffold protein A |
| chr17_+_13516456 | 0.15 |
ENSRNOT00000018378
|
Sema4d
|
semaphorin 4D |
| chr14_-_112946875 | 0.15 |
ENSRNOT00000081981
|
LOC103690141
|
coiled-coil domain-containing protein 85A-like |
| chr9_-_121931564 | 0.15 |
ENSRNOT00000056243
|
Tyms
|
thymidylate synthetase |
| chr20_-_1980101 | 0.15 |
ENSRNOT00000084582
ENSRNOT00000085050 ENSRNOT00000082545 ENSRNOT00000088396 |
Gabbr1
|
gamma-aminobutyric acid type B receptor subunit 1 |
| chr3_+_175408629 | 0.15 |
ENSRNOT00000081344
|
Lsm14b
|
LSM family member 14B |
| chr3_-_9936352 | 0.14 |
ENSRNOT00000011224
ENSRNOT00000042798 |
Fnbp1
|
formin binding protein 1 |
| chr7_+_11660934 | 0.14 |
ENSRNOT00000022336
|
Lmnb2
|
lamin B2 |
| chr6_+_104291071 | 0.14 |
ENSRNOT00000006798
|
Slc39a9
|
solute carrier family 39, member 9 |
| chr5_+_152613255 | 0.14 |
ENSRNOT00000037097
|
Pafah2
|
platelet-activating factor acetylhydrolase 2 |
| chr4_-_68597586 | 0.14 |
ENSRNOT00000015921
|
RGD1563986
|
similar to RIKEN cDNA E330009J07 gene |
| chr10_-_90940118 | 0.14 |
ENSRNOT00000093143
|
Eftud2
|
elongation factor Tu GTP binding domain containing 2 |
| chr17_-_13393243 | 0.14 |
ENSRNOT00000018252
|
Gadd45g
|
growth arrest and DNA-damage-inducible, gamma |
| chr10_-_40953467 | 0.14 |
ENSRNOT00000092189
|
Glra1
|
glycine receptor, alpha 1 |
| chr1_+_266953139 | 0.14 |
ENSRNOT00000054696
|
Neurl1
|
neuralized E3 ubiquitin protein ligase 1 |
| chr5_-_137014375 | 0.14 |
ENSRNOT00000066165
ENSRNOT00000091866 |
Kdm4a
|
lysine demethylase 4A |
| chr12_-_22245100 | 0.14 |
ENSRNOT00000001912
|
Gigyf1
|
GRB10 interacting GYF protein 1 |
| chr16_+_67350539 | 0.14 |
ENSRNOT00000085659
ENSRNOT00000015879 |
Unc5d
|
unc-5 netrin receptor D |
| chr12_+_28381982 | 0.14 |
ENSRNOT00000076101
|
Wbscr17
|
Williams-Beuren syndrome chromosome region 17 |
| chr5_-_150994913 | 0.14 |
ENSRNOT00000075506
|
RGD1561465
|
similar to RIKEN cDNA 2900010J23 |
| chr3_-_156777999 | 0.14 |
ENSRNOT00000032588
ENSRNOT00000091208 |
Zhx3
|
zinc fingers and homeoboxes 3 |
| chr6_+_135610743 | 0.14 |
ENSRNOT00000010906
|
Traf3
|
Tnf receptor-associated factor 3 |
| chr5_-_60871705 | 0.14 |
ENSRNOT00000016582
|
Exosc3
|
exosome component 3 |
| chr1_+_40891597 | 0.14 |
ENSRNOT00000026482
|
Akap12
|
A-kinase anchoring protein 12 |
| chr10_+_14035149 | 0.14 |
ENSRNOT00000065827
|
Zfp598
|
zinc finger protein 598 |
| chr20_+_7431355 | 0.13 |
ENSRNOT00000049592
|
Uhrf1bp1
|
UHRF1 binding protein 1 |
| chr2_+_123734199 | 0.13 |
ENSRNOT00000038729
|
RGD1307100
|
similar to RIKEN cDNA D630029K19 |
| chr9_-_81400987 | 0.13 |
ENSRNOT00000035277
|
Tns1
|
tensin 1 |
| chr7_-_127081704 | 0.13 |
ENSRNOT00000055893
|
LOC108351584
|
uncharacterized LOC108351584 |
| chr12_-_10391270 | 0.13 |
ENSRNOT00000092340
|
Wasf3
|
WAS protein family, member 3 |
| chr15_+_47470863 | 0.13 |
ENSRNOT00000072438
|
LOC683422
|
similar to Plasma kallikrein precursor (Plasma prekallikrein) (Kininogenin) (Fletcher factor) |
| chr3_-_110492398 | 0.13 |
ENSRNOT00000056450
|
Ankrd63
|
ankyrin repeat domain 63 |
| chr10_+_15241590 | 0.13 |
ENSRNOT00000037372
ENSRNOT00000037381 |
Mettl26
|
methyltransferase like 26 |
| chr4_-_156427755 | 0.13 |
ENSRNOT00000085675
ENSRNOT00000014030 |
LOC103690024
|
peroxisomal targeting signal 1 receptor-like |
| chr16_+_20740826 | 0.13 |
ENSRNOT00000038057
|
Crtc1
|
CREB regulated transcription coactivator 1 |
| chr17_-_48562838 | 0.13 |
ENSRNOT00000017102
ENSRNOT00000084702 |
Amph
|
amphiphysin |
| chr9_+_15166118 | 0.13 |
ENSRNOT00000020432
|
Mdfi
|
MyoD family inhibitor |
| chr7_-_2353875 | 0.13 |
ENSRNOT00000074873
|
LOC100911319
|
zinc finger protein 36, C3H1 type-like 2-like |
| chr18_+_73564247 | 0.13 |
ENSRNOT00000077679
ENSRNOT00000035317 |
St8sia5
|
ST8 alpha-N-acetyl-neuraminide alpha-2,8-sialyltransferase 5 |
| chr2_+_144646308 | 0.13 |
ENSRNOT00000078337
ENSRNOT00000093407 |
Dclk1
|
doublecortin-like kinase 1 |
| chr4_+_77592016 | 0.13 |
ENSRNOT00000009054
|
Zfp212
|
Zinc finger protein 212 |
| chr7_-_71048383 | 0.13 |
ENSRNOT00000005693
|
Gpr182
|
G protein-coupled receptor 182 |
| chr2_-_113345577 | 0.13 |
ENSRNOT00000034096
|
Fndc3b
|
fibronectin type III domain containing 3B |
| chr4_-_157008947 | 0.13 |
ENSRNOT00000073341
|
Pex5
|
peroxisomal biogenesis factor 5 |
| chr7_-_11003785 | 0.13 |
ENSRNOT00000061279
|
Tle2
|
transducin-like enhancer of split 2 |
| chr3_+_175426752 | 0.13 |
ENSRNOT00000085718
|
Ss18l1
|
SS18L1, nBAF chromatin remodeling complex subunit |
| chr1_-_261446570 | 0.13 |
ENSRNOT00000020182
|
Sfrp5
|
secreted frizzled-related protein 5 |
| chr3_-_11410732 | 0.13 |
ENSRNOT00000034930
|
RGD1561113
|
similar to Hypothetical UPF0184 protein C9orf16 homolog |
| chr17_+_77185053 | 0.13 |
ENSRNOT00000091561
|
Optn
|
optineurin |
| chr10_+_36741434 | 0.12 |
ENSRNOT00000064078
|
Col23a1
|
collagen type XXIII alpha 1 chain |
| chr19_-_15840990 | 0.12 |
ENSRNOT00000015583
|
Irx3
|
iroquois homeobox 3 |
| chr13_-_70922245 | 0.12 |
ENSRNOT00000064860
|
Dhx9
|
DExH-box helicase 9 |
| chr10_-_108473377 | 0.12 |
ENSRNOT00000070934
|
Sgsh
|
N-sulfoglucosamine sulfohydrolase |
| chr8_+_116094851 | 0.12 |
ENSRNOT00000084120
|
RGD1307461
|
similar to RIKEN cDNA 6430571L13 gene; similar to g20 protein |
| chr1_+_33910912 | 0.12 |
ENSRNOT00000044690
|
Irx1
|
iroquois homeobox 1 |
| chr1_-_87777668 | 0.12 |
ENSRNOT00000037288
|
AABR07002870.1
|
|
| chr8_+_64489942 | 0.12 |
ENSRNOT00000083666
|
Pkm
|
pyruvate kinase, muscle |
| chr9_-_82699551 | 0.12 |
ENSRNOT00000020673
|
Obsl1
|
obscurin-like 1 |
| chr4_+_170149029 | 0.12 |
ENSRNOT00000073287
|
LOC103690002
|
histone H2A.J |
| chr18_-_77317969 | 0.12 |
ENSRNOT00000090369
|
Nfatc1
|
nuclear factor of activated T-cells 1 |
| chr7_+_70364813 | 0.12 |
ENSRNOT00000084012
ENSRNOT00000031230 |
Agap2
|
ArfGAP with GTPase domain, ankyrin repeat and PH domain 2 |
| chr3_-_79282493 | 0.12 |
ENSRNOT00000049832
|
Ptprj
|
protein tyrosine phosphatase, receptor type, J |
| chr1_+_78029555 | 0.12 |
ENSRNOT00000047289
|
Slc8a2
|
solute carrier family 8 member A2 |
| chr1_+_81372650 | 0.12 |
ENSRNOT00000088829
|
Zfp428
|
zinc finger protein 428 |
| chr15_+_23665202 | 0.12 |
ENSRNOT00000089226
|
Samd4a
|
sterile alpha motif domain containing 4A |
| chr4_-_126644895 | 0.12 |
ENSRNOT00000017384
ENSRNOT00000072624 |
Lrig1
|
leucine-rich repeats and immunoglobulin-like domains 1 |
| chr4_-_117126822 | 0.12 |
ENSRNOT00000086720
|
Rab11fip5
|
RAB11 family interacting protein 5 |
| chr10_-_64642292 | 0.12 |
ENSRNOT00000084670
|
Abr
|
active BCR-related |
| chr10_-_29450644 | 0.12 |
ENSRNOT00000087937
|
Adra1b
|
adrenoceptor alpha 1B |
| chr6_+_35314444 | 0.12 |
ENSRNOT00000005666
|
Osr1
|
odd-skipped related transciption factor 1 |
| chr12_+_40244081 | 0.12 |
ENSRNOT00000030583
|
Sh2b3
|
SH2B adaptor protein 3 |
| chr14_-_35149608 | 0.12 |
ENSRNOT00000003050
ENSRNOT00000090654 |
Kit
|
KIT proto-oncogene receptor tyrosine kinase |
| chr1_-_262013619 | 0.12 |
ENSRNOT00000021278
|
Hps1
|
HPS1, biogenesis of lysosomal organelles complex 3 subunit 1 |
| chr4_-_180505916 | 0.12 |
ENSRNOT00000086465
|
AABR07062512.1
|
|
| chr1_-_88112683 | 0.11 |
ENSRNOT00000090615
|
Spred3
|
sprouty-related, EVH1 domain containing 3 |
| chr8_-_21968415 | 0.11 |
ENSRNOT00000067325
ENSRNOT00000064932 |
Dnmt1
|
DNA methyltransferase 1 |
| chr2_-_88314254 | 0.11 |
ENSRNOT00000038546
|
Car13
|
carbonic anhydrase 13 |
| chr1_-_163129641 | 0.11 |
ENSRNOT00000083055
|
Capn5
|
calpain 5 |
| chr9_-_10054359 | 0.11 |
ENSRNOT00000072001
|
Clpp
|
caseinolytic mitochondrial matrix peptidase proteolytic subunit |
| chr19_+_41932221 | 0.11 |
ENSRNOT00000059225
|
LOC103694328
|
alanine and glycine-rich protein-like |
| chr2_-_261402880 | 0.11 |
ENSRNOT00000052396
ENSRNOT00000077839 ENSRNOT00000088561 |
Fpgt
|
fucose-1-phosphate guanylyltransferase |
| chr13_+_52667969 | 0.11 |
ENSRNOT00000084986
ENSRNOT00000050284 |
Tnnt2
|
troponin T2, cardiac type |
| chr12_+_37878653 | 0.11 |
ENSRNOT00000091084
|
Pitpnm2
|
phosphatidylinositol transfer protein, membrane-associated 2 |
| chrX_-_19386541 | 0.11 |
ENSRNOT00000072722
|
AABR07037356.1
|
|
| chr13_-_51076852 | 0.11 |
ENSRNOT00000078993
|
Adora1
|
adenosine A1 receptor |
| chr1_-_125967756 | 0.11 |
ENSRNOT00000031488
|
Fam189a1
|
family with sequence similarity 189, member A1 |
| chr4_+_13405136 | 0.11 |
ENSRNOT00000091004
|
Gnai1
|
G protein subunit alpha i1 |
| chr7_-_117364322 | 0.11 |
ENSRNOT00000080724
|
Oplah
|
5-oxoprolinase (ATP-hydrolysing) |
| chr3_+_148541909 | 0.11 |
ENSRNOT00000012187
|
Ccm2l
|
CCM2 like scaffolding protein |
| chr1_+_190666149 | 0.11 |
ENSRNOT00000089361
|
LOC102547219
|
uncharacterized LOC102547219 |
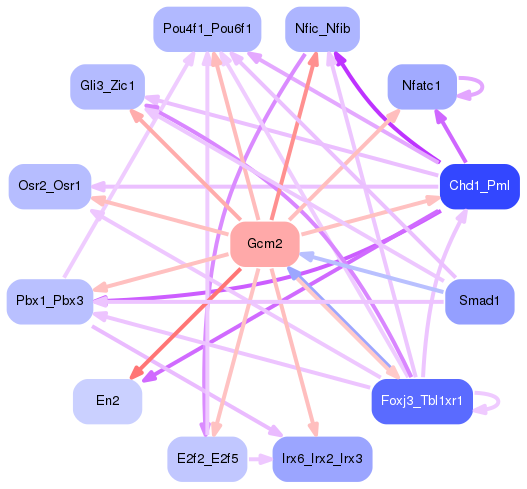
Network of associatons between targets according to the STRING database.

First level regulatory network of Gcm2
Gene Ontology Analysis
Gene overrepresentation in biological process category:
| Log-likelihood per target | Total log-likelihood | Term | Description |
|---|---|---|---|
| 0.1 | 0.4 | GO:0048372 | ventricular zone neuroblast division(GO:0021847) fibroblast growth factor receptor signaling pathway involved in orbitofrontal cortex development(GO:0035607) lateral mesodermal cell fate commitment(GO:0048372) lateral mesodermal cell fate specification(GO:0048377) regulation of lateral mesodermal cell fate specification(GO:0048378) |
| 0.1 | 0.3 | GO:1903553 | positive regulation of extracellular exosome assembly(GO:1903553) |
| 0.1 | 0.1 | GO:1902462 | regulation of mesenchymal stem cell proliferation(GO:1902460) positive regulation of mesenchymal stem cell proliferation(GO:1902462) |
| 0.1 | 0.4 | GO:0072081 | proximal/distal pattern formation involved in nephron development(GO:0072047) specification of nephron tubule identity(GO:0072081) |
| 0.1 | 0.2 | GO:0044837 | assembly of actomyosin apparatus involved in cytokinesis(GO:0000912) actomyosin contractile ring assembly(GO:0000915) actomyosin contractile ring organization(GO:0044837) |
| 0.1 | 0.2 | GO:0001982 | baroreceptor response to decreased systemic arterial blood pressure(GO:0001982) |
| 0.1 | 0.2 | GO:0051867 | general adaptation syndrome, behavioral process(GO:0051867) |
| 0.1 | 0.2 | GO:0002589 | regulation of antigen processing and presentation of peptide antigen via MHC class I(GO:0002589) |
| 0.1 | 0.4 | GO:0060449 | bud elongation involved in lung branching(GO:0060449) |
| 0.1 | 0.2 | GO:0060816 | random inactivation of X chromosome(GO:0060816) regulation of dosage compensation by inactivation of X chromosome(GO:1900095) |
| 0.1 | 0.2 | GO:2000041 | regulation of planar cell polarity pathway involved in axis elongation(GO:2000040) negative regulation of planar cell polarity pathway involved in axis elongation(GO:2000041) |
| 0.1 | 0.2 | GO:0034769 | basement membrane disassembly(GO:0034769) |
| 0.1 | 0.7 | GO:1990403 | embryonic brain development(GO:1990403) |
| 0.1 | 0.4 | GO:0051970 | negative regulation of transmission of nerve impulse(GO:0051970) |
| 0.1 | 0.2 | GO:0061146 | Peyer's patch morphogenesis(GO:0061146) |
| 0.0 | 0.1 | GO:0030997 | regulation of centriole-centriole cohesion(GO:0030997) |
| 0.0 | 0.2 | GO:2000813 | negative regulation of barbed-end actin filament capping(GO:2000813) |
| 0.0 | 0.1 | GO:0042998 | positive regulation of Golgi to plasma membrane protein transport(GO:0042998) |
| 0.0 | 0.1 | GO:1900220 | semaphorin-plexin signaling pathway involved in bone trabecula morphogenesis(GO:1900220) |
| 0.0 | 0.1 | GO:0046078 | pyrimidine deoxyribonucleoside monophosphate biosynthetic process(GO:0009177) dUMP metabolic process(GO:0046078) |
| 0.0 | 0.2 | GO:1904717 | regulation of AMPA glutamate receptor clustering(GO:1904717) |
| 0.0 | 0.0 | GO:1905072 | cardiac jelly development(GO:1905072) |
| 0.0 | 0.1 | GO:0071031 | nuclear mRNA surveillance of mRNA 3'-end processing(GO:0071031) nuclear polyadenylation-dependent tRNA catabolic process(GO:0071038) nuclear retention of pre-mRNA with aberrant 3'-ends at the site of transcription(GO:0071049) |
| 0.0 | 0.3 | GO:0016185 | synaptic vesicle budding from presynaptic endocytic zone membrane(GO:0016185) |
| 0.0 | 0.1 | GO:0016078 | tRNA catabolic process(GO:0016078) |
| 0.0 | 0.3 | GO:0015808 | L-alanine transport(GO:0015808) |
| 0.0 | 0.1 | GO:1901094 | regulation of protein tetramerization(GO:1901090) negative regulation of protein tetramerization(GO:1901091) regulation of protein homotetramerization(GO:1901093) negative regulation of protein homotetramerization(GO:1901094) |
| 0.0 | 0.1 | GO:0003273 | cell migration involved in endocardial cushion formation(GO:0003273) |
| 0.0 | 0.3 | GO:0002857 | positive regulation of natural killer cell mediated immune response to tumor cell(GO:0002857) positive regulation of natural killer cell mediated cytotoxicity directed against tumor cell target(GO:0002860) |
| 0.0 | 0.1 | GO:0030200 | heparan sulfate proteoglycan catabolic process(GO:0030200) |
| 0.0 | 0.2 | GO:0072709 | cellular response to sorbitol(GO:0072709) |
| 0.0 | 0.2 | GO:1901621 | negative regulation of smoothened signaling pathway involved in dorsal/ventral neural tube patterning(GO:1901621) |
| 0.0 | 0.2 | GO:0014022 | neural plate elongation(GO:0014022) convergent extension involved in neural plate elongation(GO:0022007) |
| 0.0 | 0.2 | GO:0007221 | positive regulation of transcription of Notch receptor target(GO:0007221) |
| 0.0 | 0.1 | GO:0032474 | otolith morphogenesis(GO:0032474) |
| 0.0 | 0.1 | GO:0043314 | negative regulation of neutrophil degranulation(GO:0043314) |
| 0.0 | 0.1 | GO:1905065 | positive regulation of vascular smooth muscle cell differentiation(GO:1905065) |
| 0.0 | 0.2 | GO:2001199 | negative regulation of dendritic cell differentiation(GO:2001199) |
| 0.0 | 0.6 | GO:0035970 | peptidyl-threonine dephosphorylation(GO:0035970) |
| 0.0 | 0.1 | GO:0070256 | regulation of nucleoside transport(GO:0032242) negative regulation of neurotrophin production(GO:0032900) negative regulation of circadian sleep/wake cycle, non-REM sleep(GO:0042323) negative regulation of mucus secretion(GO:0070256) |
| 0.0 | 0.6 | GO:0070262 | peptidyl-serine dephosphorylation(GO:0070262) |
| 0.0 | 0.2 | GO:0098887 | neurotransmitter receptor transport, endosome to postsynaptic membrane(GO:0098887) |
| 0.0 | 0.2 | GO:0060023 | soft palate development(GO:0060023) |
| 0.0 | 0.1 | GO:1903173 | phytol metabolic process(GO:0033306) fatty alcohol metabolic process(GO:1903173) |
| 0.0 | 0.5 | GO:0031340 | positive regulation of vesicle fusion(GO:0031340) |
| 0.0 | 0.2 | GO:2001271 | negative regulation of cysteine-type endopeptidase activity involved in execution phase of apoptosis(GO:2001271) |
| 0.0 | 0.1 | GO:0072218 | ascending thin limb development(GO:0072021) metanephric ascending thin limb development(GO:0072218) |
| 0.0 | 0.2 | GO:0099526 | presynaptic signal transduction(GO:0098928) presynapse to nucleus signaling pathway(GO:0099526) |
| 0.0 | 0.1 | GO:0010909 | regulation of heparan sulfate proteoglycan biosynthetic process(GO:0010908) positive regulation of heparan sulfate proteoglycan biosynthetic process(GO:0010909) |
| 0.0 | 0.1 | GO:1902630 | regulation of membrane hyperpolarization(GO:1902630) |
| 0.0 | 0.1 | GO:0001880 | Mullerian duct regression(GO:0001880) |
| 0.0 | 0.1 | GO:0097394 | post-embryonic appendage morphogenesis(GO:0035120) post-embryonic limb morphogenesis(GO:0035127) post-embryonic forelimb morphogenesis(GO:0035128) telomeric repeat-containing RNA transcription(GO:0097393) telomeric repeat-containing RNA transcription from RNA pol II promoter(GO:0097394) regulation of telomeric RNA transcription from RNA pol II promoter(GO:1901580) negative regulation of telomeric RNA transcription from RNA pol II promoter(GO:1901581) positive regulation of telomeric RNA transcription from RNA pol II promoter(GO:1901582) |
| 0.0 | 0.2 | GO:0035878 | nail development(GO:0035878) |
| 0.0 | 0.1 | GO:0043316 | cytotoxic T cell degranulation(GO:0043316) |
| 0.0 | 0.1 | GO:1904059 | regulation of locomotor rhythm(GO:1904059) |
| 0.0 | 0.1 | GO:0016560 | protein import into peroxisome matrix, docking(GO:0016560) |
| 0.0 | 0.1 | GO:1902044 | regulation of Fas signaling pathway(GO:1902044) |
| 0.0 | 0.1 | GO:1903281 | positive regulation of calcium:sodium antiporter activity(GO:1903281) |
| 0.0 | 0.2 | GO:0048105 | establishment of body hair or bristle planar orientation(GO:0048104) establishment of body hair planar orientation(GO:0048105) |
| 0.0 | 0.1 | GO:0002337 | B-1a B cell differentiation(GO:0002337) |
| 0.0 | 0.1 | GO:0045218 | zonula adherens maintenance(GO:0045218) |
| 0.0 | 0.1 | GO:0098735 | positive regulation of the force of heart contraction(GO:0098735) |
| 0.0 | 0.1 | GO:1905218 | cellular response to astaxanthin(GO:1905218) |
| 0.0 | 0.1 | GO:0090309 | positive regulation of methylation-dependent chromatin silencing(GO:0090309) |
| 0.0 | 0.1 | GO:0032902 | nerve growth factor production(GO:0032902) |
| 0.0 | 0.1 | GO:0072344 | rescue of stalled ribosome(GO:0072344) |
| 0.0 | 0.1 | GO:0006667 | sphinganine metabolic process(GO:0006667) |
| 0.0 | 0.2 | GO:0051045 | negative regulation of membrane protein ectodomain proteolysis(GO:0051045) |
| 0.0 | 0.2 | GO:0042866 | pyruvate biosynthetic process(GO:0042866) |
| 0.0 | 0.3 | GO:0031284 | positive regulation of guanylate cyclase activity(GO:0031284) |
| 0.0 | 0.1 | GO:0001560 | regulation of cell growth by extracellular stimulus(GO:0001560) |
| 0.0 | 0.2 | GO:0048170 | positive regulation of long-term neuronal synaptic plasticity(GO:0048170) |
| 0.0 | 0.0 | GO:0060369 | positive regulation of Fc receptor mediated stimulatory signaling pathway(GO:0060369) |
| 0.0 | 0.1 | GO:1990859 | response to endothelin(GO:1990839) cellular response to endothelin(GO:1990859) |
| 0.0 | 0.1 | GO:1900158 | regulation of chondrocyte development(GO:0061181) negative regulation of bone mineralization involved in bone maturation(GO:1900158) |
| 0.0 | 0.0 | GO:0090427 | activation of meiosis(GO:0090427) |
| 0.0 | 0.1 | GO:0090271 | positive regulation of fibroblast growth factor production(GO:0090271) |
| 0.0 | 0.1 | GO:0050713 | PML body organization(GO:0030578) negative regulation of interleukin-1 beta secretion(GO:0050713) |
| 0.0 | 0.3 | GO:0032957 | inositol trisphosphate metabolic process(GO:0032957) |
| 0.0 | 0.3 | GO:0036065 | fucosylation(GO:0036065) |
| 0.0 | 0.1 | GO:0070164 | negative regulation of adiponectin secretion(GO:0070164) |
| 0.0 | 0.2 | GO:1903232 | melanosome assembly(GO:1903232) |
| 0.0 | 0.1 | GO:0006419 | alanyl-tRNA aminoacylation(GO:0006419) |
| 0.0 | 0.3 | GO:0006968 | cellular defense response(GO:0006968) |
| 0.0 | 0.1 | GO:0042350 | GDP-L-fucose biosynthetic process(GO:0042350) GDP-L-fucose metabolic process(GO:0046368) |
| 0.0 | 0.1 | GO:0061744 | motor behavior(GO:0061744) |
| 0.0 | 0.2 | GO:0045719 | negative regulation of glycogen biosynthetic process(GO:0045719) |
| 0.0 | 0.0 | GO:0072268 | pattern specification involved in metanephros development(GO:0072268) |
| 0.0 | 0.1 | GO:0006382 | adenosine to inosine editing(GO:0006382) regulation of RNA interference(GO:1900368) |
| 0.0 | 0.0 | GO:1903334 | positive regulation of protein folding(GO:1903334) |
| 0.0 | 0.1 | GO:1903972 | regulation of macrophage colony-stimulating factor signaling pathway(GO:1902226) regulation of response to macrophage colony-stimulating factor(GO:1903969) regulation of cellular response to macrophage colony-stimulating factor stimulus(GO:1903972) microglial cell migration(GO:1904124) regulation of microglial cell migration(GO:1904139) |
| 0.0 | 0.1 | GO:0048210 | Golgi vesicle fusion to target membrane(GO:0048210) |
| 0.0 | 0.3 | GO:0060124 | positive regulation of growth hormone secretion(GO:0060124) |
| 0.0 | 0.1 | GO:0003050 | regulation of systemic arterial blood pressure by atrial natriuretic peptide(GO:0003050) |
| 0.0 | 0.2 | GO:0008063 | Toll signaling pathway(GO:0008063) |
| 0.0 | 0.1 | GO:0000393 | spliceosomal conformational changes to generate catalytic conformation(GO:0000393) |
| 0.0 | 0.1 | GO:0030208 | dermatan sulfate biosynthetic process(GO:0030208) |
| 0.0 | 0.1 | GO:0071896 | protein localization to adherens junction(GO:0071896) |
| 0.0 | 0.1 | GO:0030210 | heparin biosynthetic process(GO:0030210) |
| 0.0 | 0.0 | GO:0090118 | receptor-mediated endocytosis of low-density lipoprotein particle involved in cholesterol transport(GO:0090118) |
| 0.0 | 0.2 | GO:0002098 | tRNA wobble uridine modification(GO:0002098) |
| 0.0 | 0.5 | GO:0048172 | regulation of short-term neuronal synaptic plasticity(GO:0048172) |
| 0.0 | 0.2 | GO:0034063 | stress granule assembly(GO:0034063) |
| 0.0 | 0.1 | GO:0048702 | embryonic neurocranium morphogenesis(GO:0048702) |
| 0.0 | 0.1 | GO:2000672 | negative regulation of motor neuron apoptotic process(GO:2000672) |
| 0.0 | 0.1 | GO:1903215 | negative regulation of protein targeting to mitochondrion(GO:1903215) |
| 0.0 | 0.3 | GO:0089711 | L-glutamate transmembrane transport(GO:0089711) |
| 0.0 | 0.2 | GO:0031507 | heterochromatin assembly(GO:0031507) |
| 0.0 | 0.1 | GO:0070934 | CRD-mediated mRNA stabilization(GO:0070934) protein localization to cytoplasmic stress granule(GO:1903608) |
| 0.0 | 0.0 | GO:0009223 | pyrimidine deoxyribonucleotide catabolic process(GO:0009223) |
| 0.0 | 0.2 | GO:0010739 | positive regulation of protein kinase A signaling(GO:0010739) |
| 0.0 | 0.1 | GO:0002439 | chronic inflammatory response to antigenic stimulus(GO:0002439) |
| 0.0 | 0.0 | GO:1901423 | response to benzene(GO:1901423) |
| 0.0 | 0.1 | GO:0010159 | specification of organ position(GO:0010159) |
| 0.0 | 0.2 | GO:0006283 | transcription-coupled nucleotide-excision repair(GO:0006283) |
| 0.0 | 0.1 | GO:0060478 | acrosomal vesicle exocytosis(GO:0060478) |
| 0.0 | 0.0 | GO:1901668 | regulation of superoxide dismutase activity(GO:1901668) |
| 0.0 | 0.1 | GO:0016191 | synaptic vesicle uncoating(GO:0016191) |
| 0.0 | 0.1 | GO:0072642 | negative regulation of B cell differentiation(GO:0045578) type I interferon secretion(GO:0072641) interferon-alpha secretion(GO:0072642) regulation of interferon-alpha secretion(GO:1902739) positive regulation of interferon-alpha secretion(GO:1902741) |
| 0.0 | 0.0 | GO:0006438 | valyl-tRNA aminoacylation(GO:0006438) |
| 0.0 | 0.1 | GO:1900113 | negative regulation of histone H3-K9 trimethylation(GO:1900113) |
| 0.0 | 0.2 | GO:0000185 | activation of MAPKKK activity(GO:0000185) |
| 0.0 | 0.1 | GO:0070315 | G1 to G0 transition involved in cell differentiation(GO:0070315) |
| 0.0 | 0.1 | GO:1902951 | negative regulation of dendritic spine maintenance(GO:1902951) |
| 0.0 | 0.1 | GO:0060014 | granulosa cell differentiation(GO:0060014) |
| 0.0 | 0.2 | GO:0035520 | monoubiquitinated protein deubiquitination(GO:0035520) |
| 0.0 | 0.1 | GO:0006868 | glutamine transport(GO:0006868) |
| 0.0 | 0.1 | GO:0030035 | microspike assembly(GO:0030035) |
| 0.0 | 0.0 | GO:0071348 | cellular response to interleukin-11(GO:0071348) |
| 0.0 | 0.0 | GO:2001280 | positive regulation of prostaglandin biosynthetic process(GO:0031394) positive regulation of unsaturated fatty acid biosynthetic process(GO:2001280) |
| 0.0 | 0.1 | GO:0050915 | sensory perception of sour taste(GO:0050915) |
| 0.0 | 0.0 | GO:0019389 | glucuronoside metabolic process(GO:0019389) |
| 0.0 | 0.1 | GO:0097039 | protein linear polyubiquitination(GO:0097039) |
| 0.0 | 0.2 | GO:0070935 | 3'-UTR-mediated mRNA stabilization(GO:0070935) |
| 0.0 | 0.4 | GO:0034067 | protein localization to Golgi apparatus(GO:0034067) |
| 0.0 | 0.1 | GO:0006686 | sphingomyelin biosynthetic process(GO:0006686) |
| 0.0 | 0.2 | GO:0060907 | positive regulation of macrophage cytokine production(GO:0060907) |
| 0.0 | 0.2 | GO:0048026 | positive regulation of mRNA splicing, via spliceosome(GO:0048026) |
| 0.0 | 0.0 | GO:0071847 | circadian temperature homeostasis(GO:0060086) TNFSF11-mediated signaling pathway(GO:0071847) |
| 0.0 | 0.1 | GO:0021747 | cochlear nucleus development(GO:0021747) |
| 0.0 | 0.1 | GO:0010572 | positive regulation of platelet activation(GO:0010572) |
| 0.0 | 0.1 | GO:1904469 | positive regulation of tumor necrosis factor secretion(GO:1904469) |
| 0.0 | 0.4 | GO:0006779 | porphyrin-containing compound biosynthetic process(GO:0006779) |
| 0.0 | 0.0 | GO:0032066 | nucleolus to nucleoplasm transport(GO:0032066) |
| 0.0 | 0.1 | GO:0031293 | membrane protein intracellular domain proteolysis(GO:0031293) |
| 0.0 | 0.1 | GO:0033234 | negative regulation of protein sumoylation(GO:0033234) |
| 0.0 | 0.0 | GO:0071579 | regulation of zinc ion transport(GO:0071579) |
| 0.0 | 0.0 | GO:0097089 | methyl-branched fatty acid metabolic process(GO:0097089) |
| 0.0 | 0.0 | GO:0072248 | metanephric glomerular visceral epithelial cell differentiation(GO:0072248) metanephric glomerular visceral epithelial cell development(GO:0072249) metanephric glomerular epithelial cell differentiation(GO:0072312) metanephric glomerular epithelial cell development(GO:0072313) |
| 0.0 | 0.0 | GO:1905075 | occluding junction disassembly(GO:1905071) regulation of occluding junction disassembly(GO:1905073) positive regulation of occluding junction disassembly(GO:1905075) |
| 0.0 | 0.1 | GO:0055009 | atrial cardiac muscle tissue development(GO:0003228) atrial cardiac muscle tissue morphogenesis(GO:0055009) |
| 0.0 | 0.0 | GO:0072054 | renal outer medulla development(GO:0072054) |
| 0.0 | 0.0 | GO:0045347 | negative regulation of MHC class II biosynthetic process(GO:0045347) |
| 0.0 | 0.2 | GO:0061299 | retina vasculature morphogenesis in camera-type eye(GO:0061299) |
| 0.0 | 0.0 | GO:1903626 | positive regulation of apoptotic DNA fragmentation(GO:1902512) positive regulation of DNA catabolic process(GO:1903626) |
| 0.0 | 0.1 | GO:2000051 | negative regulation of non-canonical Wnt signaling pathway(GO:2000051) |
| 0.0 | 0.1 | GO:0043097 | pyrimidine-containing compound salvage(GO:0008655) pyrimidine nucleoside salvage(GO:0043097) |
| 0.0 | 0.1 | GO:0006670 | sphingosine metabolic process(GO:0006670) |
| 0.0 | 0.0 | GO:0050893 | sensory processing(GO:0050893) |
| 0.0 | 0.0 | GO:0097155 | fasciculation of sensory neuron axon(GO:0097155) |
| 0.0 | 0.1 | GO:0019520 | aldonic acid metabolic process(GO:0019520) D-gluconate metabolic process(GO:0019521) |
| 0.0 | 0.0 | GO:1904721 | negative regulation of mRNA cleavage(GO:0031438) negative regulation of mRNA endonucleolytic cleavage involved in unfolded protein response(GO:1904721) |
| 0.0 | 0.0 | GO:0070213 | protein auto-ADP-ribosylation(GO:0070213) |
| 0.0 | 0.1 | GO:0042908 | xenobiotic transport(GO:0042908) |
| 0.0 | 0.1 | GO:0071104 | response to interleukin-9(GO:0071104) |
| 0.0 | 0.0 | GO:0042335 | cuticle development(GO:0042335) |
| 0.0 | 0.1 | GO:0002347 | response to tumor cell(GO:0002347) |
| 0.0 | 0.0 | GO:1990743 | protein sialylation(GO:1990743) |
| 0.0 | 0.1 | GO:0034497 | protein localization to pre-autophagosomal structure(GO:0034497) |
| 0.0 | 0.0 | GO:0070966 | nuclear-transcribed mRNA catabolic process, no-go decay(GO:0070966) |
| 0.0 | 0.2 | GO:0038065 | collagen-activated signaling pathway(GO:0038065) |
| 0.0 | 0.0 | GO:0034224 | cellular response to zinc ion starvation(GO:0034224) |
| 0.0 | 0.2 | GO:0010839 | negative regulation of keratinocyte proliferation(GO:0010839) |
| 0.0 | 0.1 | GO:1902410 | mitotic cytokinetic process(GO:1902410) |
| 0.0 | 0.1 | GO:0060717 | chorion development(GO:0060717) |
| 0.0 | 0.1 | GO:0046710 | GDP metabolic process(GO:0046710) |
| 0.0 | 0.0 | GO:2000124 | regulation of endocannabinoid signaling pathway(GO:2000124) |
| 0.0 | 0.1 | GO:0070862 | negative regulation of protein exit from endoplasmic reticulum(GO:0070862) negative regulation of retrograde protein transport, ER to cytosol(GO:1904153) |
| 0.0 | 0.1 | GO:0018243 | protein O-linked glycosylation via threonine(GO:0018243) Notch signaling involved in heart development(GO:0061314) |
| 0.0 | 0.3 | GO:0032011 | ARF protein signal transduction(GO:0032011) |
| 0.0 | 0.1 | GO:0060363 | cranial suture morphogenesis(GO:0060363) |
| 0.0 | 0.1 | GO:0007182 | common-partner SMAD protein phosphorylation(GO:0007182) |
| 0.0 | 0.0 | GO:0090230 | regulation of centromere complex assembly(GO:0090230) regulation of kinetochore assembly(GO:0090234) |
| 0.0 | 0.2 | GO:0061318 | renal filtration cell differentiation(GO:0061318) glomerular visceral epithelial cell differentiation(GO:0072112) glomerular epithelial cell differentiation(GO:0072311) |
| 0.0 | 0.1 | GO:0042796 | snRNA transcription from RNA polymerase III promoter(GO:0042796) |
| 0.0 | 0.1 | GO:0000454 | snoRNA guided rRNA pseudouridine synthesis(GO:0000454) |
| 0.0 | 0.1 | GO:0060158 | phospholipase C-activating dopamine receptor signaling pathway(GO:0060158) |
Gene overrepresentation in cellular component category:
| Log-likelihood per target | Total log-likelihood | Term | Description |
|---|---|---|---|
| 0.1 | 0.4 | GO:0071148 | TEAD-1-YAP complex(GO:0071148) |
| 0.1 | 0.2 | GO:0060187 | cell pole(GO:0060187) |
| 0.1 | 0.6 | GO:0008091 | spectrin(GO:0008091) |
| 0.1 | 0.2 | GO:1990257 | piccolo-bassoon transport vesicle(GO:1990257) |
| 0.1 | 0.2 | GO:0002947 | tumor necrosis factor receptor superfamily complex(GO:0002947) |
| 0.0 | 0.1 | GO:0038039 | G-protein coupled receptor heterodimeric complex(GO:0038039) |
| 0.0 | 0.2 | GO:0031085 | BLOC-3 complex(GO:0031085) |
| 0.0 | 0.2 | GO:0042406 | extrinsic component of endoplasmic reticulum membrane(GO:0042406) |
| 0.0 | 0.1 | GO:1990421 | subtelomeric heterochromatin(GO:1990421) nuclear subtelomeric heterochromatin(GO:1990707) |
| 0.0 | 0.1 | GO:0097149 | centralspindlin complex(GO:0097149) |
| 0.0 | 0.1 | GO:0000172 | ribonuclease MRP complex(GO:0000172) |
| 0.0 | 0.2 | GO:0071203 | WASH complex(GO:0071203) |
| 0.0 | 0.2 | GO:0005677 | chromatin silencing complex(GO:0005677) |
| 0.0 | 0.1 | GO:0030121 | AP-1 adaptor complex(GO:0030121) |
| 0.0 | 0.1 | GO:0070695 | FHF complex(GO:0070695) |
| 0.0 | 0.2 | GO:0005785 | signal recognition particle receptor complex(GO:0005785) |
| 0.0 | 0.1 | GO:0043293 | apoptosome(GO:0043293) |
| 0.0 | 0.1 | GO:0032937 | SREBP-SCAP-Insig complex(GO:0032937) |
| 0.0 | 0.1 | GO:0097165 | nuclear stress granule(GO:0097165) |
| 0.0 | 0.1 | GO:0044393 | microspike(GO:0044393) |
| 0.0 | 0.6 | GO:0000159 | protein phosphatase type 2A complex(GO:0000159) |
| 0.0 | 0.2 | GO:0000243 | commitment complex(GO:0000243) |
| 0.0 | 0.1 | GO:1990682 | CSF1-CSF1R complex(GO:1990682) |
| 0.0 | 0.2 | GO:0005638 | lamin filament(GO:0005638) |
| 0.0 | 0.1 | GO:0014701 | junctional sarcoplasmic reticulum membrane(GO:0014701) |
| 0.0 | 0.1 | GO:0098553 | integral component of cytoplasmic side of endoplasmic reticulum membrane(GO:0071458) integral component of lumenal side of endoplasmic reticulum membrane(GO:0071556) lumenal side of endoplasmic reticulum membrane(GO:0098553) |
| 0.0 | 0.1 | GO:0071012 | catalytic step 1 spliceosome(GO:0071012) |
| 0.0 | 0.1 | GO:0070436 | Grb2-EGFR complex(GO:0070436) |
| 0.0 | 0.1 | GO:0005927 | muscle tendon junction(GO:0005927) |
| 0.0 | 0.1 | GO:0097598 | sperm cytoplasmic droplet(GO:0097598) |
| 0.0 | 0.1 | GO:0098845 | postsynaptic endosome(GO:0098845) |
| 0.0 | 0.1 | GO:1990393 | 3M complex(GO:1990393) |
| 0.0 | 0.1 | GO:0097441 | basilar dendrite(GO:0097441) |
| 0.0 | 0.2 | GO:0042405 | nuclear inclusion body(GO:0042405) |
| 0.0 | 0.1 | GO:0097512 | cardiac myofibril(GO:0097512) |
| 0.0 | 0.3 | GO:0043196 | varicosity(GO:0043196) |
| 0.0 | 0.1 | GO:0042825 | TAP complex(GO:0042825) |
| 0.0 | 0.0 | GO:0034750 | Scrib-APC-beta-catenin complex(GO:0034750) |
| 0.0 | 0.1 | GO:0031211 | serine C-palmitoyltransferase complex(GO:0017059) endoplasmic reticulum palmitoyltransferase complex(GO:0031211) |
| 0.0 | 0.1 | GO:0044615 | nuclear pore nuclear basket(GO:0044615) |
| 0.0 | 0.1 | GO:0097025 | MPP7-DLG1-LIN7 complex(GO:0097025) |
| 0.0 | 0.1 | GO:0090571 | RNA polymerase II transcription repressor complex(GO:0090571) |
| 0.0 | 0.0 | GO:0035577 | azurophil granule membrane(GO:0035577) |
| 0.0 | 0.0 | GO:0002193 | MAML1-RBP-Jkappa- ICN1 complex(GO:0002193) |
| 0.0 | 0.1 | GO:0030991 | intraciliary transport particle A(GO:0030991) |
| 0.0 | 0.0 | GO:0030690 | Noc1p-Noc2p complex(GO:0030690) |
| 0.0 | 0.1 | GO:0035631 | CD40 receptor complex(GO:0035631) |
| 0.0 | 0.1 | GO:0034388 | Pwp2p-containing subcomplex of 90S preribosome(GO:0034388) |
| 0.0 | 0.1 | GO:0000176 | nuclear exosome (RNase complex)(GO:0000176) |
| 0.0 | 0.2 | GO:0005782 | peroxisomal matrix(GO:0005782) microbody lumen(GO:0031907) |
| 0.0 | 0.1 | GO:0044530 | supraspliceosomal complex(GO:0044530) |
| 0.0 | 0.2 | GO:0032045 | guanyl-nucleotide exchange factor complex(GO:0032045) |
| 0.0 | 0.0 | GO:0005668 | RNA polymerase transcription factor SL1 complex(GO:0005668) |
| 0.0 | 0.4 | GO:0005921 | gap junction(GO:0005921) |
| 0.0 | 0.0 | GO:0010009 | cytoplasmic side of endosome membrane(GO:0010009) |
| 0.0 | 0.1 | GO:0005890 | sodium:potassium-exchanging ATPase complex(GO:0005890) |
| 0.0 | 0.1 | GO:0044194 | cytolytic granule(GO:0044194) tertiary granule(GO:0070820) |
| 0.0 | 0.3 | GO:0005721 | pericentric heterochromatin(GO:0005721) |
| 0.0 | 0.1 | GO:0008290 | F-actin capping protein complex(GO:0008290) |
| 0.0 | 0.0 | GO:1990423 | RZZ complex(GO:1990423) |
| 0.0 | 0.0 | GO:0097196 | Shu complex(GO:0097196) |
| 0.0 | 0.0 | GO:0035363 | histone locus body(GO:0035363) |
| 0.0 | 0.1 | GO:0090661 | box H/ACA telomerase RNP complex(GO:0090661) |
| 0.0 | 0.1 | GO:0005952 | cAMP-dependent protein kinase complex(GO:0005952) |
| 0.0 | 0.2 | GO:0005883 | neurofilament(GO:0005883) |
Gene overrepresentation in molecular function category:
| Log-likelihood per target | Total log-likelihood | Term | Description |
|---|---|---|---|
| 0.2 | 0.5 | GO:0030977 | taurine binding(GO:0030977) |
| 0.1 | 0.2 | GO:0017168 | 5-oxoprolinase (ATP-hydrolyzing) activity(GO:0017168) |
| 0.1 | 0.2 | GO:0005302 | L-tyrosine transmembrane transporter activity(GO:0005302) |
| 0.1 | 0.2 | GO:0004743 | pyruvate kinase activity(GO:0004743) |
| 0.1 | 0.3 | GO:0046920 | alpha-(1->3)-fucosyltransferase activity(GO:0046920) |
| 0.1 | 0.3 | GO:0005052 | peroxisome matrix targeting signal-1 binding(GO:0005052) |
| 0.1 | 0.2 | GO:0043533 | inositol 1,3,4,5 tetrakisphosphate binding(GO:0043533) |
| 0.0 | 0.2 | GO:0016300 | tRNA (uracil) methyltransferase activity(GO:0016300) |
| 0.0 | 0.3 | GO:0031749 | D2 dopamine receptor binding(GO:0031749) |
| 0.0 | 0.3 | GO:0005007 | fibroblast growth factor-activated receptor activity(GO:0005007) |
| 0.0 | 0.1 | GO:0003828 | alpha-N-acetylneuraminate alpha-2,8-sialyltransferase activity(GO:0003828) |
| 0.0 | 0.1 | GO:0001605 | adrenomedullin receptor activity(GO:0001605) |
| 0.0 | 0.1 | GO:0004937 | alpha1-adrenergic receptor activity(GO:0004937) |
| 0.0 | 0.3 | GO:0030160 | GKAP/Homer scaffold activity(GO:0030160) |
| 0.0 | 0.1 | GO:0004965 | G-protein coupled GABA receptor activity(GO:0004965) |
| 0.0 | 0.1 | GO:1901375 | acetylcholine transmembrane transporter activity(GO:0005277) acetate ester transmembrane transporter activity(GO:1901375) |
| 0.0 | 0.1 | GO:0015186 | L-glutamine transmembrane transporter activity(GO:0015186) |
| 0.0 | 0.1 | GO:0015433 | peptide antigen-transporting ATPase activity(GO:0015433) tapasin binding(GO:0046980) |
| 0.0 | 0.1 | GO:0042392 | sphingosine-1-phosphate phosphatase activity(GO:0042392) |
| 0.0 | 0.2 | GO:0030250 | cyclase activator activity(GO:0010853) guanylate cyclase activator activity(GO:0030250) |
| 0.0 | 0.5 | GO:0017017 | MAP kinase tyrosine/serine/threonine phosphatase activity(GO:0017017) |
| 0.0 | 0.1 | GO:0008281 | sulfonylurea receptor activity(GO:0008281) |
| 0.0 | 0.1 | GO:0000171 | ribonuclease MRP activity(GO:0000171) |
| 0.0 | 0.1 | GO:0001225 | RNA polymerase II transcription coactivator binding(GO:0001225) |
| 0.0 | 0.1 | GO:0030156 | benzodiazepine receptor binding(GO:0030156) |
| 0.0 | 0.2 | GO:0016901 | oxidoreductase activity, acting on the CH-OH group of donors, quinone or similar compound as acceptor(GO:0016901) |
| 0.0 | 0.1 | GO:0015056 | corticotrophin-releasing factor receptor activity(GO:0015056) corticotropin-releasing hormone receptor activity(GO:0043404) |
| 0.0 | 0.1 | GO:0030172 | troponin C binding(GO:0030172) |
| 0.0 | 0.1 | GO:0051864 | histone demethylase activity (H3-K36 specific)(GO:0051864) |
| 0.0 | 0.1 | GO:0044736 | acid-sensing ion channel activity(GO:0044736) |
| 0.0 | 0.2 | GO:0004957 | prostaglandin E receptor activity(GO:0004957) |
| 0.0 | 0.2 | GO:0061578 | Lys63-specific deubiquitinase activity(GO:0061578) |
| 0.0 | 0.1 | GO:0001069 | regulatory region RNA binding(GO:0001069) |
| 0.0 | 0.1 | GO:0016899 | oxidoreductase activity, acting on the CH-OH group of donors, oxygen as acceptor(GO:0016899) |
| 0.0 | 0.2 | GO:0005173 | stem cell factor receptor binding(GO:0005173) |
| 0.0 | 0.1 | GO:0015180 | L-alanine transmembrane transporter activity(GO:0015180) alanine transmembrane transporter activity(GO:0022858) |
| 0.0 | 0.2 | GO:0031821 | G-protein coupled serotonin receptor binding(GO:0031821) |
| 0.0 | 0.2 | GO:0005432 | calcium:sodium antiporter activity(GO:0005432) |
| 0.0 | 0.1 | GO:0001155 | TFIIIA-class transcription factor binding(GO:0001155) |
| 0.0 | 0.1 | GO:0004726 | non-membrane spanning protein tyrosine phosphatase activity(GO:0004726) |
| 0.0 | 0.2 | GO:0045503 | dynein light chain binding(GO:0045503) |
| 0.0 | 0.1 | GO:0003847 | 1-alkyl-2-acetylglycerophosphocholine esterase activity(GO:0003847) |
| 0.0 | 0.1 | GO:0004758 | serine C-palmitoyltransferase activity(GO:0004758) C-palmitoyltransferase activity(GO:0016454) |
| 0.0 | 0.1 | GO:0070548 | L-glutamine aminotransferase activity(GO:0070548) |
| 0.0 | 0.1 | GO:0005006 | epidermal growth factor-activated receptor activity(GO:0005006) |
| 0.0 | 0.1 | GO:0035673 | oligopeptide transmembrane transporter activity(GO:0035673) |
| 0.0 | 0.1 | GO:0004813 | alanine-tRNA ligase activity(GO:0004813) |
| 0.0 | 0.1 | GO:0003886 | DNA (cytosine-5-)-methyltransferase activity(GO:0003886) |
| 0.0 | 0.1 | GO:0004691 | cAMP-dependent protein kinase activity(GO:0004691) |
| 0.0 | 0.1 | GO:0032795 | heterotrimeric G-protein binding(GO:0032795) |
| 0.0 | 0.1 | GO:0050656 | 3'-phosphoadenosine 5'-phosphosulfate binding(GO:0050656) |
| 0.0 | 0.3 | GO:0004089 | carbonate dehydratase activity(GO:0004089) |
| 0.0 | 0.1 | GO:0004768 | stearoyl-CoA 9-desaturase activity(GO:0004768) |
| 0.0 | 0.1 | GO:0001537 | N-acetylgalactosamine 4-O-sulfotransferase activity(GO:0001537) |
| 0.0 | 0.1 | GO:0004985 | opioid receptor activity(GO:0004985) |
| 0.0 | 0.1 | GO:0005157 | macrophage colony-stimulating factor receptor binding(GO:0005157) |
| 0.0 | 0.2 | GO:0004445 | inositol-polyphosphate 5-phosphatase activity(GO:0004445) |
| 0.0 | 0.1 | GO:0008489 | UDP-galactose:glucosylceramide beta-1,4-galactosyltransferase activity(GO:0008489) |
| 0.0 | 0.1 | GO:0004165 | dodecenoyl-CoA delta-isomerase activity(GO:0004165) |
| 0.0 | 0.1 | GO:0042500 | aspartic endopeptidase activity, intramembrane cleaving(GO:0042500) |
| 0.0 | 0.1 | GO:0015616 | DNA translocase activity(GO:0015616) |
| 0.0 | 0.1 | GO:0102390 | mycophenolic acid acyl-glucuronide esterase activity(GO:0102390) |
| 0.0 | 0.2 | GO:0030619 | U1 snRNA binding(GO:0030619) |
| 0.0 | 0.1 | GO:0004140 | dephospho-CoA kinase activity(GO:0004140) |
| 0.0 | 0.3 | GO:0005313 | L-glutamate transmembrane transporter activity(GO:0005313) |
| 0.0 | 0.1 | GO:0015368 | calcium, potassium:sodium antiporter activity(GO:0008273) calcium:cation antiporter activity(GO:0015368) |
| 0.0 | 0.1 | GO:0003844 | 1,4-alpha-glucan branching enzyme activity(GO:0003844) |
| 0.0 | 0.2 | GO:0051766 | inositol trisphosphate kinase activity(GO:0051766) |
| 0.0 | 0.2 | GO:0004017 | adenylate kinase activity(GO:0004017) |
| 0.0 | 0.1 | GO:0097363 | protein O-GlcNAc transferase activity(GO:0097363) |
| 0.0 | 0.1 | GO:0030348 | syntaxin-3 binding(GO:0030348) |
| 0.0 | 0.1 | GO:0030158 | protein xylosyltransferase activity(GO:0030158) |
| 0.0 | 0.1 | GO:0008349 | MAP kinase kinase kinase kinase activity(GO:0008349) |
| 0.0 | 0.1 | GO:0001224 | RNA polymerase II transcription cofactor binding(GO:0001224) |
| 0.0 | 0.1 | GO:0004849 | uridine kinase activity(GO:0004849) |
| 0.0 | 0.2 | GO:0010314 | phosphatidylinositol-5-phosphate binding(GO:0010314) |
| 0.0 | 0.2 | GO:0008191 | metalloendopeptidase inhibitor activity(GO:0008191) |
| 0.0 | 0.1 | GO:0003726 | double-stranded RNA adenosine deaminase activity(GO:0003726) |
| 0.0 | 0.1 | GO:0051377 | mannose-ethanolamine phosphotransferase activity(GO:0051377) |
| 0.0 | 0.0 | GO:0004832 | valine-tRNA ligase activity(GO:0004832) |
| 0.0 | 0.0 | GO:0004918 | interleukin-8 receptor activity(GO:0004918) |
| 0.0 | 0.6 | GO:0030506 | ankyrin binding(GO:0030506) |
| 0.0 | 0.2 | GO:0004385 | guanylate kinase activity(GO:0004385) |
| 0.0 | 0.2 | GO:0005024 | transforming growth factor beta-activated receptor activity(GO:0005024) |
| 0.0 | 0.1 | GO:0004716 | receptor signaling protein tyrosine kinase activity(GO:0004716) |
| 0.0 | 0.1 | GO:0051434 | BH3 domain binding(GO:0051434) |
| 0.0 | 0.1 | GO:0004477 | methenyltetrahydrofolate cyclohydrolase activity(GO:0004477) methylenetetrahydrofolate dehydrogenase (NADP+) activity(GO:0004488) |
| 0.0 | 0.1 | GO:0034988 | Fc-gamma receptor I complex binding(GO:0034988) |
| 0.0 | 0.1 | GO:0048019 | receptor antagonist activity(GO:0048019) |
| 0.0 | 0.1 | GO:0047756 | chondroitin 4-sulfotransferase activity(GO:0047756) |
| 0.0 | 0.2 | GO:0030346 | protein phosphatase 2B binding(GO:0030346) |
| 0.0 | 0.1 | GO:0034186 | apolipoprotein A-I binding(GO:0034186) |
| 0.0 | 0.2 | GO:0004708 | MAP kinase kinase activity(GO:0004708) |
| 0.0 | 0.1 | GO:0033188 | sphingomyelin synthase activity(GO:0033188) ceramide cholinephosphotransferase activity(GO:0047493) |
| 0.0 | 0.1 | GO:0051959 | dynein light intermediate chain binding(GO:0051959) |
| 0.0 | 0.1 | GO:0004105 | choline-phosphate cytidylyltransferase activity(GO:0004105) |
| 0.0 | 0.1 | GO:0030955 | potassium ion binding(GO:0030955) |
| 0.0 | 0.2 | GO:0042301 | phosphate ion binding(GO:0042301) |
| 0.0 | 0.2 | GO:0030215 | semaphorin receptor binding(GO:0030215) |
| 0.0 | 0.1 | GO:0008140 | cAMP response element binding protein binding(GO:0008140) |
| 0.0 | 0.1 | GO:0031798 | type 1 metabotropic glutamate receptor binding(GO:0031798) |
| 0.0 | 0.1 | GO:0070008 | serine-type exopeptidase activity(GO:0070008) |
| 0.0 | 0.1 | GO:0071253 | connexin binding(GO:0071253) |
| 0.0 | 0.1 | GO:0032051 | clathrin light chain binding(GO:0032051) |
| 0.0 | 0.1 | GO:0035497 | cAMP response element binding(GO:0035497) |
| 0.0 | 0.0 | GO:0004924 | oncostatin-M receptor activity(GO:0004924) |
| 0.0 | 0.0 | GO:0050265 | RNA uridylyltransferase activity(GO:0050265) |
| 0.0 | 0.1 | GO:0070097 | delta-catenin binding(GO:0070097) |
| 0.0 | 0.1 | GO:0004000 | adenosine deaminase activity(GO:0004000) |
| 0.0 | 0.2 | GO:0008179 | adenylate cyclase binding(GO:0008179) |
| 0.0 | 0.1 | GO:0038062 | protein tyrosine kinase collagen receptor activity(GO:0038062) |
| 0.0 | 0.1 | GO:0001054 | RNA polymerase I activity(GO:0001054) |
Gene overrepresentation in curated gene sets: canonical pathways category:
| Log-likelihood per target | Total log-likelihood | Term | Description |
|---|---|---|---|
| 0.0 | 0.4 | PID INTEGRIN5 PATHWAY | Beta5 beta6 beta7 and beta8 integrin cell surface interactions |
| 0.0 | 0.2 | PID ALK2 PATHWAY | ALK2 signaling events |
| 0.0 | 0.6 | PID ERBB4 PATHWAY | ErbB4 signaling events |
| 0.0 | 0.7 | PID RET PATHWAY | Signaling events regulated by Ret tyrosine kinase |
| 0.0 | 0.1 | ST JAK STAT PATHWAY | Jak-STAT Pathway |
| 0.0 | 0.3 | PID EPHRINB REV PATHWAY | Ephrin B reverse signaling |
| 0.0 | 0.3 | PID PDGFRA PATHWAY | PDGFR-alpha signaling pathway |
| 0.0 | 0.2 | PID ANTHRAX PATHWAY | Cellular roles of Anthrax toxin |
| 0.0 | 0.1 | SIG REGULATION OF THE ACTIN CYTOSKELETON BY RHO GTPASES | Genes related to regulation of the actin cytoskeleton |
| 0.0 | 0.3 | PID GLYPICAN 1PATHWAY | Glypican 1 network |
| 0.0 | 0.3 | PID S1P META PATHWAY | Sphingosine 1-phosphate (S1P) pathway |
| 0.0 | 0.2 | PID P38 MKK3 6PATHWAY | p38 MAPK signaling pathway |
| 0.0 | 0.4 | PID HNF3A PATHWAY | FOXA1 transcription factor network |
| 0.0 | 0.6 | PID ATF2 PATHWAY | ATF-2 transcription factor network |
Gene overrepresentation in curated gene sets: REACTOME pathways category:
| Log-likelihood per target | Total log-likelihood | Term | Description |
|---|---|---|---|
| 0.0 | 0.4 | REACTOME SIGNALING BY ACTIVATED POINT MUTANTS OF FGFR1 | Genes involved in Signaling by activated point mutants of FGFR1 |
| 0.0 | 0.1 | REACTOME FGFR1 LIGAND BINDING AND ACTIVATION | Genes involved in FGFR1 ligand binding and activation |
| 0.0 | 0.3 | REACTOME GAP JUNCTION DEGRADATION | Genes involved in Gap junction degradation |
| 0.0 | 0.5 | REACTOME HS GAG DEGRADATION | Genes involved in HS-GAG degradation |
| 0.0 | 0.2 | REACTOME PROSTANOID LIGAND RECEPTORS | Genes involved in Prostanoid ligand receptors |
| 0.0 | 0.2 | REACTOME NOTCH HLH TRANSCRIPTION PATHWAY | Genes involved in Notch-HLH transcription pathway |
| 0.0 | 0.4 | REACTOME SIGNALING BY HIPPO | Genes involved in Signaling by Hippo |
| 0.0 | 0.6 | REACTOME INTERACTION BETWEEN L1 AND ANKYRINS | Genes involved in Interaction between L1 and Ankyrins |
| 0.0 | 0.1 | REACTOME THROMBOXANE SIGNALLING THROUGH TP RECEPTOR | Genes involved in Thromboxane signalling through TP receptor |
| 0.0 | 0.2 | REACTOME RAP1 SIGNALLING | Genes involved in Rap1 signalling |
| 0.0 | 0.1 | REACTOME PLATELET SENSITIZATION BY LDL | Genes involved in Platelet sensitization by LDL |
| 0.0 | 0.5 | REACTOME NCAM1 INTERACTIONS | Genes involved in NCAM1 interactions |
| 0.0 | 0.2 | REACTOME OTHER SEMAPHORIN INTERACTIONS | Genes involved in Other semaphorin interactions |
| 0.0 | 0.3 | REACTOME LIGAND GATED ION CHANNEL TRANSPORT | Genes involved in Ligand-gated ion channel transport |
| 0.0 | 0.1 | REACTOME TRAF3 DEPENDENT IRF ACTIVATION PATHWAY | Genes involved in TRAF3-dependent IRF activation pathway |
| 0.0 | 0.3 | REACTOME INWARDLY RECTIFYING K CHANNELS | Genes involved in Inwardly rectifying K+ channels |
| 0.0 | 0.4 | REACTOME COLLAGEN FORMATION | Genes involved in Collagen formation |
| 0.0 | 0.1 | REACTOME ROLE OF DCC IN REGULATING APOPTOSIS | Genes involved in Role of DCC in regulating apoptosis |
| 0.0 | 0.1 | REACTOME MRNA DECAY BY 3 TO 5 EXORIBONUCLEASE | Genes involved in mRNA Decay by 3' to 5' Exoribonuclease |
| 0.0 | 0.1 | REACTOME ACETYLCHOLINE NEUROTRANSMITTER RELEASE CYCLE | Genes involved in Acetylcholine Neurotransmitter Release Cycle |
| 0.0 | 0.2 | REACTOME REGULATION OF KIT SIGNALING | Genes involved in Regulation of KIT signaling |