Project
GSE49485: Hypoxia transcriptome sequencing of rat brain.
Navigation
Downloads
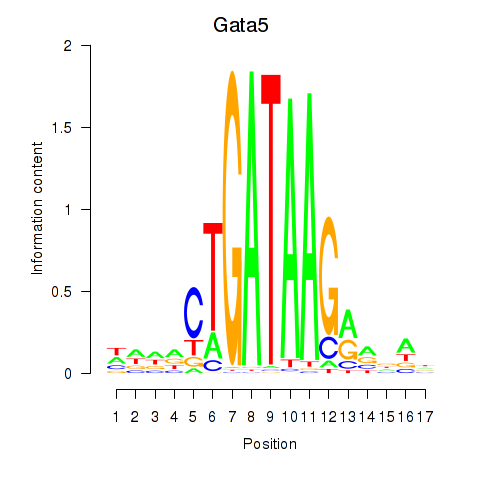
Results for Gata5
Z-value: 0.44
Motif logo
Transcription factors associated with Gata5
| Gene Symbol | Gene ID | Gene Info |
|---|---|---|
|
Gata5
|
ENSRNOG00000058983 | GATA binding protein 5 |
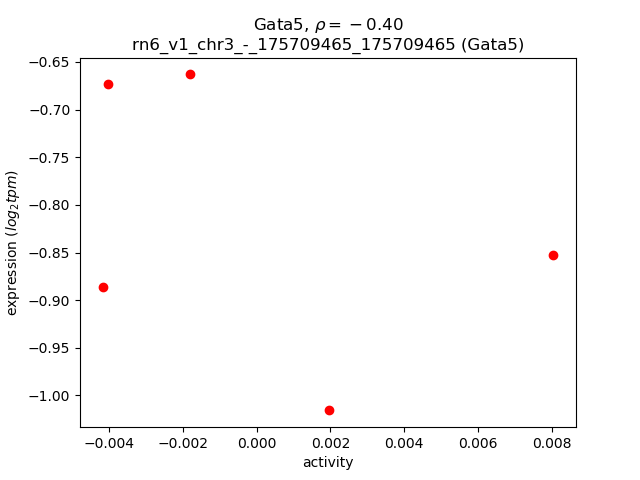
Activity-expression correlation:
| Gene | Promoter | Pearson corr. coef. | P-value | Plot |
|---|---|---|---|---|
| Gata5 | rn6_v1_chr3_-_175709465_175709465 | -0.40 | 5.0e-01 | Click! |
Activity profile of Gata5 motif
Sorted Z-values of Gata5 motif
| Promoter | Log-likelihood | Transcript | Gene | Gene Info |
|---|---|---|---|---|
| chr1_-_164205222 | 0.22 |
ENSRNOT00000035774
|
Mogat2
|
monoacylglycerol O-acyltransferase 2 |
| chr1_-_213650247 | 0.20 |
ENSRNOT00000019679
|
Cox8b
|
cytochrome c oxidase, subunit VIIIb |
| chr3_+_138174054 | 0.17 |
ENSRNOT00000007946
|
Banf2
|
barrier to autointegration factor 2 |
| chr1_-_155955173 | 0.14 |
ENSRNOT00000079345
|
AABR07004776.1
|
|
| chr2_-_147819335 | 0.13 |
ENSRNOT00000057909
|
Ankub1
|
ankyrin repeat and ubiquitin domain containing 1 |
| chr7_+_121841855 | 0.11 |
ENSRNOT00000024673
|
Grap2
|
GRB2-related adaptor protein 2 |
| chr10_-_38969501 | 0.10 |
ENSRNOT00000090691
ENSRNOT00000081309 ENSRNOT00000010029 |
Il4
|
interleukin 4 |
| chr13_-_82129989 | 0.10 |
ENSRNOT00000078963
|
AC124874.1
|
|
| chr10_+_89539556 | 0.10 |
ENSRNOT00000028174
|
Rdm1
|
RAD52 motif containing 1 |
| chr10_-_102227554 | 0.10 |
ENSRNOT00000078035
|
AC096468.1
|
|
| chr1_+_141488272 | 0.10 |
ENSRNOT00000034042
|
Wdr93
|
WD repeat domain 93 |
| chrM_+_2740 | 0.09 |
ENSRNOT00000047550
|
Mt-nd1
|
mitochondrially encoded NADH dehydrogenase 1 |
| chr2_+_66940057 | 0.09 |
ENSRNOT00000043050
|
Cdh9
|
cadherin 9 |
| chrX_+_106774980 | 0.08 |
ENSRNOT00000046091
|
Tceal7
|
transcription elongation factor A like 7 |
| chr9_+_81535483 | 0.07 |
ENSRNOT00000077285
|
Arpc2
|
actin related protein 2/3 complex, subunit 2 |
| chr14_-_18862407 | 0.07 |
ENSRNOT00000003823
|
Cxcl6
|
C-X-C motif chemokine ligand 6 |
| chr7_-_71269869 | 0.07 |
ENSRNOT00000037030
|
Uqcrb
|
ubiquinol-cytochrome c reductase binding protein |
| chr6_-_127337791 | 0.07 |
ENSRNOT00000032015
|
Ifi27l2b
|
interferon, alpha-inducible protein 27 like 2B |
| chr7_-_143538579 | 0.07 |
ENSRNOT00000081518
|
Krt79
|
keratin 79 |
| chr9_-_94495333 | 0.07 |
ENSRNOT00000021507
|
Kcnj13
|
potassium voltage-gated channel subfamily J member 13 |
| chr15_+_86153628 | 0.06 |
ENSRNOT00000012842
|
Uchl3
|
ubiquitin C-terminal hydrolase L3 |
| chr2_+_147496229 | 0.06 |
ENSRNOT00000022105
|
Tm4sf4
|
transmembrane 4 L six family member 4 |
| chr8_+_91464229 | 0.06 |
ENSRNOT00000013249
|
Bckdhb
|
branched chain keto acid dehydrogenase E1 subunit beta |
| chr2_-_167607919 | 0.06 |
ENSRNOT00000089083
|
AABR07011733.1
|
|
| chr16_+_55152748 | 0.06 |
ENSRNOT00000000121
|
Fgf20
|
fibroblast growth factor 20 |
| chr20_+_4593389 | 0.06 |
ENSRNOT00000001174
|
Slc44a4
|
solute carrier family 44, member 4 |
| chr4_-_176026133 | 0.06 |
ENSRNOT00000043374
ENSRNOT00000046598 |
Slco1a4
|
solute carrier organic anion transporter family, member 1a4 |
| chr4_-_38240848 | 0.06 |
ENSRNOT00000007567
|
Ndufa4
|
NADH:ubiquinone oxidoreductase subunit A4 |
| chr20_-_5806097 | 0.06 |
ENSRNOT00000000611
|
Clps
|
colipase |
| chr2_-_28799266 | 0.06 |
ENSRNOT00000089293
|
Tmem171
|
transmembrane protein 171 |
| chr4_-_162726628 | 0.06 |
ENSRNOT00000073877
|
LOC100911272
|
killer cell lectin-like receptor 5-like |
| chr2_+_40000313 | 0.06 |
ENSRNOT00000014270
|
Depdc1b
|
DEP domain containing 1B |
| chr10_+_70417108 | 0.06 |
ENSRNOT00000079325
|
Slfn4
|
schlafen 4 |
| chr7_-_145174771 | 0.05 |
ENSRNOT00000055270
|
Glycam1
|
glycosylation dependent cell adhesion molecule 1 |
| chr2_-_209973205 | 0.05 |
ENSRNOT00000024593
|
Cym
|
chymosin |
| chr15_-_45524582 | 0.05 |
ENSRNOT00000081912
|
Gucy1b2
|
guanylate cyclase 1 soluble subunit beta 2 |
| chr1_-_89509343 | 0.05 |
ENSRNOT00000028637
|
Fxyd3
|
FXYD domain-containing ion transport regulator 3 |
| chr5_-_164502469 | 0.05 |
ENSRNOT00000051887
|
RGD1565622
|
RGD1565622 |
| chr4_-_65780799 | 0.05 |
ENSRNOT00000079883
|
Atp6v0a4
|
ATPase H+ transporting V0 subunit a4 |
| chr17_-_71897972 | 0.05 |
ENSRNOT00000065942
|
Sfmbt2
|
Scm-like with four mbt domains 2 |
| chr10_-_15610826 | 0.05 |
ENSRNOT00000027851
|
Hbz
|
hemoglobin subunit zeta |
| chr8_-_36764422 | 0.05 |
ENSRNOT00000017330
|
Hyls1
|
HYLS1, centriolar and ciliogenesis associated |
| chr2_+_116970344 | 0.05 |
ENSRNOT00000039603
|
Egfem1
|
EGF-like and EMI domain containing 1 |
| chr12_+_16913312 | 0.05 |
ENSRNOT00000001718
|
Tmem184a
|
transmembrane protein 184A |
| chr1_-_154507039 | 0.05 |
ENSRNOT00000078883
|
Ccdc83
|
coiled-coil domain containing 83 |
| chr13_+_44424689 | 0.05 |
ENSRNOT00000005206
|
Acmsd
|
aminocarboxymuconate semialdehyde decarboxylase |
| chr2_-_123851854 | 0.05 |
ENSRNOT00000023327
|
Il2
|
interleukin 2 |
| chr4_-_61720956 | 0.05 |
ENSRNOT00000012879
|
Akr1b1
|
aldo-keto reductase family 1 member B |
| chr10_+_70411738 | 0.05 |
ENSRNOT00000078046
|
Slfn4
|
schlafen 4 |
| chr4_+_38240728 | 0.05 |
ENSRNOT00000047029
|
Phf14
|
PHD finger protein 14 |
| chr3_-_4341771 | 0.05 |
ENSRNOT00000034694
|
LOC684988
|
similar to ribosomal protein S13 |
| chr20_-_5076539 | 0.05 |
ENSRNOT00000076253
ENSRNOT00000037613 |
Ly6g6f
|
lymphocyte antigen 6 complex, locus G6F |
| chr11_+_66932614 | 0.05 |
ENSRNOT00000003189
|
Slc15a2
|
solute carrier family 15 member 2 |
| chr15_+_67555835 | 0.05 |
ENSRNOT00000045882
|
Pcdh17
|
protocadherin 17 |
| chr4_+_69386698 | 0.04 |
ENSRNOT00000091655
|
Trbv13-2
|
T cell receptor beta, variable 13-2 |
| chr4_+_92431710 | 0.04 |
ENSRNOT00000049438
|
LOC108350839
|
high mobility group protein B1-like |
| chr8_+_50525091 | 0.04 |
ENSRNOT00000074357
|
Apoa1
|
apolipoprotein A1 |
| chr10_+_38788992 | 0.04 |
ENSRNOT00000009727
|
Gdf9
|
growth differentiation factor 9 |
| chr18_-_29587760 | 0.04 |
ENSRNOT00000023811
|
Ndufa2
|
NADH:ubiquinone oxidoreductase subunit A2 |
| chr15_-_55277713 | 0.04 |
ENSRNOT00000023037
|
Itm2b
|
integral membrane protein 2B |
| chr1_+_66959610 | 0.04 |
ENSRNOT00000072122
ENSRNOT00000045994 |
Vom1r48
|
vomeronasal 1 receptor 48 |
| chrX_-_13601069 | 0.04 |
ENSRNOT00000004686
|
Otc
|
ornithine carbamoyltransferase |
| chr1_-_97785490 | 0.04 |
ENSRNOT00000019364
|
LOC499136
|
LRRGT00021 |
| chr1_+_190462327 | 0.04 |
ENSRNOT00000030732
|
LOC691519
|
similar to ankyrin repeat domain 26 |
| chr19_+_46733633 | 0.04 |
ENSRNOT00000016307
|
Clec3a
|
C-type lectin domain family 3, member A |
| chr13_-_61003744 | 0.04 |
ENSRNOT00000005163
|
Rgs13
|
regulator of G-protein signaling 13 |
| chr16_+_80729400 | 0.04 |
ENSRNOT00000036383
|
Tdrp
|
testis development related protein |
| chr4_+_173732248 | 0.04 |
ENSRNOT00000041499
|
Pik3c2g
|
phosphatidylinositol-4-phosphate 3-kinase, catalytic subunit type 2 gamma |
| chr13_-_73390393 | 0.04 |
ENSRNOT00000067253
ENSRNOT00000093438 |
Lhx4
|
LIM homeobox 4 |
| chr9_-_95108739 | 0.04 |
ENSRNOT00000070819
|
Usp40
|
ubiquitin specific peptidase 40 |
| chr1_+_48319522 | 0.04 |
ENSRNOT00000080281
|
AC114389.1
|
|
| chr7_-_136853957 | 0.04 |
ENSRNOT00000008985
|
Nell2
|
neural EGFL like 2 |
| chr5_-_125345726 | 0.04 |
ENSRNOT00000011244
|
LOC688684
|
similar to 60S ribosomal protein L32 |
| chr3_-_72447801 | 0.04 |
ENSRNOT00000088815
|
P2rx3
|
purinergic receptor P2X 3 |
| chr3_-_114828154 | 0.04 |
ENSRNOT00000000184
|
Slc30a4
|
solute carrier family 30 member 4 |
| chr2_-_142235066 | 0.04 |
ENSRNOT00000018385
|
Cog6
|
component of oligomeric golgi complex 6 |
| chr10_-_63491279 | 0.04 |
ENSRNOT00000082301
|
Tusc5
|
tumor suppressor candidate 5 |
| chrX_+_119390013 | 0.04 |
ENSRNOT00000074269
|
Agtr2
|
angiotensin II receptor, type 2 |
| chr14_+_113530470 | 0.04 |
ENSRNOT00000004919
|
Pnpt1
|
polyribonucleotide nucleotidyltransferase 1 |
| chr3_+_103192683 | 0.04 |
ENSRNOT00000037551
|
LOC100363452
|
ribosomal protein S8-like |
| chr1_-_79690434 | 0.04 |
ENSRNOT00000057986
ENSRNOT00000057988 |
LOC102557319
|
carcinoembryonic antigen-related cell adhesion molecule 3-like |
| chr6_+_58388333 | 0.04 |
ENSRNOT00000036337
|
LOC680646
|
similar to 40S ribosomal protein S2 |
| chr11_+_54619129 | 0.04 |
ENSRNOT00000059924
|
Trat1
|
T cell receptor associated transmembrane adaptor 1 |
| chr17_-_88095729 | 0.04 |
ENSRNOT00000025140
|
Enkur
|
enkurin, TRPC channel interacting protein |
| chr1_+_84584596 | 0.04 |
ENSRNOT00000032933
|
LOC100910046
|
zinc finger protein 60-like |
| chr6_-_127632265 | 0.03 |
ENSRNOT00000084157
|
Serpina1
|
serpin family A member 1 |
| chr10_-_48044344 | 0.03 |
ENSRNOT00000003697
|
Prpsap2
|
phosphoribosyl pyrophosphate synthetase-associated protein 2 |
| chr11_-_4332255 | 0.03 |
ENSRNOT00000087133
|
Cadm2
|
cell adhesion molecule 2 |
| chr3_-_8659102 | 0.03 |
ENSRNOT00000050908
|
Zdhhc12
|
zinc finger, DHHC-type containing 12 |
| chrX_+_43535737 | 0.03 |
ENSRNOT00000087073
|
LOC102557137
|
E3 ubiquitin-protein ligase RNF168-like |
| chr9_+_95221474 | 0.03 |
ENSRNOT00000066839
|
Ugt1a5
|
UDP glucuronosyltransferase family 1 member A5 |
| chr3_-_2453415 | 0.03 |
ENSRNOT00000079773
|
Slc34a3
|
solute carrier family 34 member 3 |
| chr3_-_2453933 | 0.03 |
ENSRNOT00000014060
|
Slc34a3
|
solute carrier family 34 member 3 |
| chr4_+_178617401 | 0.03 |
ENSRNOT00000042619
|
AABR07062466.1
|
|
| chr3_-_127500709 | 0.03 |
ENSRNOT00000006330
|
Hao1
|
hydroxyacid oxidase 1 |
| chr20_+_46168177 | 0.03 |
ENSRNOT00000057175
|
Zbtb24
|
zinc finger and BTB domain containing 24 |
| chr11_-_70585053 | 0.03 |
ENSRNOT00000086955
|
Zfp148
|
zinc finger protein 148 |
| chr8_-_54961265 | 0.03 |
ENSRNOT00000012434
|
Pts
|
6-pyruvoyl-tetrahydropterin synthase |
| chr1_-_226732736 | 0.03 |
ENSRNOT00000072343
|
LOC108348129
|
pepsin F-like |
| chr8_-_79715284 | 0.03 |
ENSRNOT00000088562
|
Pigb
|
phosphatidylinositol glycan anchor biosynthesis, class B |
| chr13_-_53870428 | 0.03 |
ENSRNOT00000000812
|
Nr5a2
|
nuclear receptor subfamily 5, group A, member 2 |
| chr7_-_143453544 | 0.03 |
ENSRNOT00000034450
ENSRNOT00000083956 |
Krt1
Krt5
|
keratin 1 keratin 5 |
| chr9_-_27761733 | 0.03 |
ENSRNOT00000040034
|
Kcnq5
|
potassium voltage-gated channel subfamily Q member 5 |
| chr1_-_183763664 | 0.03 |
ENSRNOT00000044231
|
LOC691427
|
similar to 6.8 kDa mitochondrial proteolipid |
| chr19_-_10450186 | 0.02 |
ENSRNOT00000088048
|
Adgrg1
|
adhesion G protein-coupled receptor G1 |
| chr9_+_20048121 | 0.02 |
ENSRNOT00000014791
|
Mep1a
|
meprin 1 subunit alpha |
| chr15_-_37410848 | 0.02 |
ENSRNOT00000081757
|
Gjb6
|
gap junction protein, beta 6 |
| chr16_+_51748970 | 0.02 |
ENSRNOT00000059182
|
Adam26a
|
a disintegrin and metallopeptidase domain 26A |
| chr5_+_126976456 | 0.02 |
ENSRNOT00000014275
|
Ndc1
|
NDC1 transmembrane nucleoporin |
| chr10_-_94384339 | 0.02 |
ENSRNOT00000055125
|
Strada
|
STE20-related kinase adaptor alpha |
| chr1_-_167884690 | 0.02 |
ENSRNOT00000091372
|
Olr61
|
olfactory receptor 61 |
| chr5_+_73496027 | 0.02 |
ENSRNOT00000022395
|
Actl7a
|
actin-like 7a |
| chr17_-_43537293 | 0.02 |
ENSRNOT00000091749
|
Slc17a3
|
solute carrier family 17 member 3 |
| chr15_-_28104206 | 0.02 |
ENSRNOT00000032536
|
Ang2
|
angiogenin, ribonuclease A family, member 2 |
| chr1_+_260289589 | 0.02 |
ENSRNOT00000051058
|
Dntt
|
DNA nucleotidylexotransferase |
| chr8_-_13906355 | 0.02 |
ENSRNOT00000029634
|
Cep295
|
centrosomal protein 295 |
| chr5_-_156689258 | 0.02 |
ENSRNOT00000065497
|
Pink1
|
PTEN induced putative kinase 1 |
| chr2_+_181331464 | 0.02 |
ENSRNOT00000017448
|
Map9
|
microtubule-associated protein 9 |
| chr4_-_85915099 | 0.02 |
ENSRNOT00000016182
|
Neurod6
|
neuronal differentiation 6 |
| chr15_+_52148379 | 0.02 |
ENSRNOT00000074912
|
Phyhip
|
phytanoyl-CoA 2-hydroxylase interacting protein |
| chr19_-_49623758 | 0.02 |
ENSRNOT00000071130
|
Pkd1l2
|
polycystic kidney disease 1-like 2 |
| chr1_+_282567674 | 0.02 |
ENSRNOT00000090543
|
Ces2i
|
carboxylesterase 2I |
| chr2_-_182038178 | 0.02 |
ENSRNOT00000040708
|
Fgb
|
fibrinogen beta chain |
| chr2_-_181900856 | 0.02 |
ENSRNOT00000082156
|
Lrat
|
lecithin-retinol acyltransferase (phosphatidylcholine-retinol-O-acyltransferase) |
| chr16_+_8302950 | 0.02 |
ENSRNOT00000066062
|
Ncoa4
|
nuclear receptor coactivator 4 |
| chr18_-_60835739 | 0.02 |
ENSRNOT00000039569
|
LOC291543
|
similar to glyceraldehyde-3-phosphate dehydrogenase |
| chr5_+_113592919 | 0.02 |
ENSRNOT00000011336
|
Ift74
|
intraflagellar transport 74 |
| chr14_-_16996962 | 0.02 |
ENSRNOT00000091936
|
AC103535.1
|
|
| chr2_-_243467703 | 0.02 |
ENSRNOT00000045169
|
RGD1309170
|
similar to hypothetical protein DKFZp434G072 |
| chr1_-_198662610 | 0.02 |
ENSRNOT00000055012
|
Sept1
|
septin 1 |
| chr18_-_11858744 | 0.02 |
ENSRNOT00000061417
ENSRNOT00000082891 |
Dsc2
|
desmocollin 2 |
| chrX_+_43625169 | 0.02 |
ENSRNOT00000086311
|
Sat1
|
spermidine/spermine N1-acetyl transferase 1 |
| chr4_-_155690869 | 0.02 |
ENSRNOT00000012216
|
C3ar1
|
complement C3a receptor 1 |
| chr5_+_154077944 | 0.02 |
ENSRNOT00000031512
|
Il22ra1
|
interleukin 22 receptor subunit alpha 1 |
| chr13_+_99221013 | 0.02 |
ENSRNOT00000083608
|
Tmem63a
|
transmembrane protein 63a |
| chr5_+_36566783 | 0.02 |
ENSRNOT00000077650
|
Fbxl4
|
F-box and leucine-rich repeat protein 4 |
| chr1_-_37818879 | 0.02 |
ENSRNOT00000043747
|
LOC680200
|
similar to zinc finger protein 455 |
| chr8_-_49301125 | 0.02 |
ENSRNOT00000091190
|
Cd3e
|
CD3e molecule |
| chr3_-_51612397 | 0.02 |
ENSRNOT00000081401
|
Scn3a
|
sodium voltage-gated channel alpha subunit 3 |
| chr1_+_20332371 | 0.02 |
ENSRNOT00000037259
|
Tmem200a
|
transmembrane protein 200A |
| chr13_-_56958549 | 0.02 |
ENSRNOT00000017293
ENSRNOT00000083912 |
RGD1564614
|
similar to complement factor H-related protein |
| chr1_-_80809769 | 0.02 |
ENSRNOT00000045073
|
Ceacam19
|
carcinoembryonic antigen-related cell adhesion molecule 19 |
| chr1_+_20331976 | 0.02 |
ENSRNOT00000070858
|
Tmem200a
|
transmembrane protein 200A |
| chr16_+_81593532 | 0.02 |
ENSRNOT00000026370
|
NEWGENE_1582994
|
DCN1, defective in cullin neddylation 1, domain containing 2 |
| chr16_-_81028656 | 0.02 |
ENSRNOT00000091296
|
Dcun1d2
|
defective in cullin neddylation 1 domain containing 2 |
| chr1_-_255557055 | 0.02 |
ENSRNOT00000033780
|
Fgfbp3
|
fibroblast growth factor binding protein 3 |
| chr15_+_24479761 | 0.02 |
ENSRNOT00000016449
|
Ktn1
|
kinectin 1 |
| chr7_-_30162056 | 0.02 |
ENSRNOT00000009910
|
Nr1h4
|
nuclear receptor subfamily 1, group H, member 4 |
| chr4_-_60358562 | 0.02 |
ENSRNOT00000018001
|
Chchd3
|
coiled-coil-helix-coiled-coil-helix domain containing 3 |
| chr4_-_70974006 | 0.02 |
ENSRNOT00000020975
|
Trpv5
|
transient receptor potential cation channel, subfamily V, member 5 |
| chr1_-_198831691 | 0.02 |
ENSRNOT00000074435
|
Zfp764
|
zinc finger protein 764 |
| chr10_-_102423084 | 0.02 |
ENSRNOT00000065145
|
Sdk2
|
sidekick cell adhesion molecule 2 |
| chr16_-_20592449 | 0.01 |
ENSRNOT00000026821
|
Isyna1
|
inositol-3-phosphate synthase 1 |
| chr11_-_88180542 | 0.01 |
ENSRNOT00000002539
|
Ypel1
|
yippee-like 1 |
| chrX_+_112270986 | 0.01 |
ENSRNOT00000091441
ENSRNOT00000082652 |
Vsig1
|
V-set and immunoglobulin domain containing 1 |
| chr12_+_703281 | 0.01 |
ENSRNOT00000001464
ENSRNOT00000064951 ENSRNOT00000050733 |
Pds5b
|
PDS5 cohesin associated factor B |
| chr14_-_3359300 | 0.01 |
ENSRNOT00000080875
|
Lpcat2b
|
lysophosphatidylcholine acyltransferase 2b |
| chr11_+_82862695 | 0.01 |
ENSRNOT00000071707
ENSRNOT00000073435 |
Clcn2
|
chloride voltage-gated channel 2 |
| chr4_-_23718047 | 0.01 |
ENSRNOT00000011359
|
RGD1564345
|
similar to RIKEN cDNA 4921511H03 |
| chr16_+_50022998 | 0.01 |
ENSRNOT00000087986
|
Tlr3
|
toll-like receptor 3 |
| chr6_+_92229686 | 0.01 |
ENSRNOT00000046085
|
Atl1
|
atlastin GTPase 1 |
| chr2_+_203768729 | 0.01 |
ENSRNOT00000018895
|
Igsf3
|
immunoglobulin superfamily, member 3 |
| chr15_-_42517553 | 0.01 |
ENSRNOT00000081500
ENSRNOT00000021320 |
Esco2
|
establishment of sister chromatid cohesion N-acetyltransferase 2 |
| chr1_+_203524426 | 0.01 |
ENSRNOT00000028020
|
Bub3
|
BUB3 mitotic checkpoint protein |
| chr5_-_126666830 | 0.01 |
ENSRNOT00000012102
ENSRNOT00000091165 |
Mrpl37
|
mitochondrial ribosomal protein L37 |
| chr14_-_84937725 | 0.01 |
ENSRNOT00000083839
|
Uqcr10
|
ubiquinol-cytochrome c reductase, complex III subunit X |
| chr4_-_138830117 | 0.01 |
ENSRNOT00000008403
|
Il5ra
|
interleukin 5 receptor subunit alpha |
| chr5_+_98387291 | 0.01 |
ENSRNOT00000046503
|
Tyrp1
|
tyrosinase-related protein 1 |
| chr4_-_176606382 | 0.01 |
ENSRNOT00000065576
|
Recql
|
RecQ like helicase |
| chr5_+_144701949 | 0.01 |
ENSRNOT00000015618
|
Psmb2
|
proteasome subunit beta 2 |
| chr18_-_24823837 | 0.01 |
ENSRNOT00000021405
ENSRNOT00000090390 |
Myo7b
|
myosin VIIb |
| chr17_+_52755621 | 0.01 |
ENSRNOT00000089943
|
Psme1-ps1
|
proteasome (prosome, macropain) activator subunit 1 (PA28 alpha), pseudogene 1 |
| chr18_+_17091310 | 0.01 |
ENSRNOT00000093285
|
Fhod3
|
formin homology 2 domain containing 3 |
| chr1_-_82088275 | 0.01 |
ENSRNOT00000072616
|
Dedd2
|
death effector domain containing 2 |
| chr2_-_57196568 | 0.01 |
ENSRNOT00000060146
|
Wdr70
|
WD repeat domain 70 |
| chr8_+_2635851 | 0.01 |
ENSRNOT00000061973
|
Casp4
|
caspase 4 |
| chr4_-_100213858 | 0.01 |
ENSRNOT00000015562
|
Usp39
|
ubiquitin specific peptidase 39 |
| chr1_+_128606770 | 0.01 |
ENSRNOT00000073355
|
Ttc23
|
tetratricopeptide repeat domain 23 |
| chr18_+_64114933 | 0.01 |
ENSRNOT00000022364
|
Mc5r
|
melanocortin 5 receptor |
| chr20_-_4132604 | 0.01 |
ENSRNOT00000077630
ENSRNOT00000048332 |
RT1-Da
|
RT1 class II, locus Da |
| chr19_+_25815207 | 0.01 |
ENSRNOT00000003980
|
Lyl1
|
LYL1, basic helix-loop-helix family member |
| chr19_+_41631715 | 0.01 |
ENSRNOT00000022749
|
Chst4
|
carbohydrate sulfotransferase 4 |
| chr5_+_164796185 | 0.01 |
ENSRNOT00000010779
|
Nppb
|
natriuretic peptide B |
| chr10_+_57260680 | 0.01 |
ENSRNOT00000035445
|
Gp1ba
|
glycoprotein Ib platelet alpha subunit |
| chr17_+_70262363 | 0.01 |
ENSRNOT00000048933
|
Fam208b
|
family with sequence similarity 208, member B |
| chr2_+_240495371 | 0.01 |
ENSRNOT00000031425
|
Slc9b2
|
solute carrier family 9 member B2 |
| chr8_-_85645718 | 0.01 |
ENSRNOT00000032185
|
Gsta2
|
glutathione S-transferase alpha 2 |
| chr3_+_59153280 | 0.01 |
ENSRNOT00000002066
|
Cdca7
|
cell division cycle associated 7 |
| chrX_-_78496847 | 0.01 |
ENSRNOT00000003265
|
Itm2a
|
integral membrane protein 2A |
| chrX_-_1346181 | 0.01 |
ENSRNOT00000042736
|
LOC102555453
|
60S ribosomal protein L12-like |
| chr5_+_103251986 | 0.01 |
ENSRNOT00000008757
|
Cntln
|
centlein |
| chr5_+_138685624 | 0.01 |
ENSRNOT00000011867
|
Guca2a
|
guanylate cyclase activator 2A |
| chr9_-_49950093 | 0.01 |
ENSRNOT00000023014
|
Fhl2
|
four and a half LIM domains 2 |
| chr6_+_64252020 | 0.01 |
ENSRNOT00000047296
ENSRNOT00000082105 |
Pnpla8
|
patatin-like phospholipase domain containing 8 |
| chr4_+_157594436 | 0.01 |
ENSRNOT00000029053
|
Lpar5
|
lysophosphatidic acid receptor 5 |
| chr4_+_147929863 | 0.01 |
ENSRNOT00000015427
|
LOC680385
|
similar to Sjogren syndrome antigen B |
| chr5_+_169632527 | 0.01 |
ENSRNOT00000031564
|
LOC500594
|
LRRGT00162 |
| chr7_+_66717434 | 0.01 |
ENSRNOT00000077878
|
Mon2
|
MON2 homolog, regulator of endosome-to-Golgi trafficking |
| chr1_-_99135977 | 0.01 |
ENSRNOT00000056515
|
Vom2r38
|
vomeronasal 2 receptor, 38 |
| chr4_-_163261958 | 0.01 |
ENSRNOT00000086390
|
Olr1
|
oxidized low density lipoprotein (lectin-like) receptor 1 |
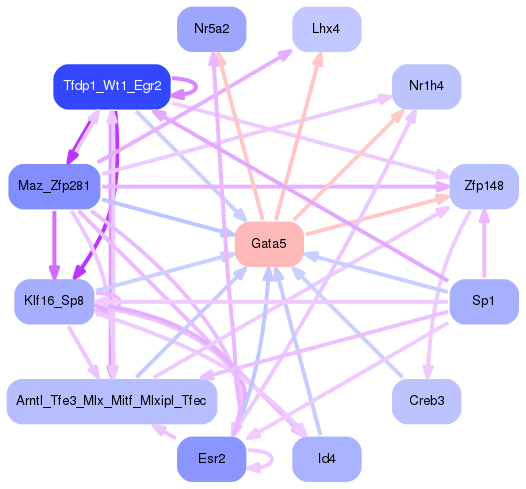
Network of associatons between targets according to the STRING database.

First level regulatory network of Gata5
Gene Ontology Analysis
Gene overrepresentation in biological process category:
| Log-likelihood per target | Total log-likelihood | Term | Description |
|---|---|---|---|
| 0.1 | 0.2 | GO:0006651 | diacylglycerol biosynthetic process(GO:0006651) |
| 0.0 | 0.1 | GO:2000424 | T-helper 1 cell lineage commitment(GO:0002296) negative regulation of complement-dependent cytotoxicity(GO:1903660) regulation of eosinophil chemotaxis(GO:2000422) positive regulation of eosinophil chemotaxis(GO:2000424) |
| 0.0 | 0.1 | GO:0070949 | regulation of neutrophil mediated cytotoxicity(GO:0070948) regulation of neutrophil mediated killing of symbiont cell(GO:0070949) |
| 0.0 | 0.1 | GO:2000814 | positive regulation of barbed-end actin filament capping(GO:2000814) |
| 0.0 | 0.2 | GO:0006123 | mitochondrial electron transport, cytochrome c to oxygen(GO:0006123) |
| 0.0 | 0.0 | GO:0006059 | hexitol metabolic process(GO:0006059) |
| 0.0 | 0.0 | GO:0010903 | negative regulation of very-low-density lipoprotein particle remodeling(GO:0010903) |
| 0.0 | 0.0 | GO:0021526 | medial motor column neuron differentiation(GO:0021526) |
| 0.0 | 0.1 | GO:0046013 | regulation of T cell homeostatic proliferation(GO:0046013) |
| 0.0 | 0.0 | GO:0007199 | G-protein coupled receptor signaling pathway coupled to cGMP nucleotide second messenger(GO:0007199) negative regulation of icosanoid secretion(GO:0032304) regulation of metanephros size(GO:0035566) |
| 0.0 | 0.0 | GO:0000962 | mitochondrial mRNA catabolic process(GO:0000958) positive regulation of mitochondrial RNA catabolic process(GO:0000962) rRNA import into mitochondrion(GO:0035928) |
| 0.0 | 0.1 | GO:0008292 | acetylcholine biosynthetic process(GO:0008292) acetate ester biosynthetic process(GO:1900620) |
| 0.0 | 0.0 | GO:0018992 | germ-line sex determination(GO:0018992) |
| 0.0 | 0.0 | GO:0033986 | response to methanol(GO:0033986) |
| 0.0 | 0.0 | GO:0042938 | antibiotic transport(GO:0042891) dipeptide transport(GO:0042938) |
| 0.0 | 0.0 | GO:2000870 | regulation of progesterone secretion(GO:2000870) |
| 0.0 | 0.0 | GO:0042985 | negative regulation of amyloid precursor protein biosynthetic process(GO:0042985) |
Gene overrepresentation in cellular component category:
| Log-likelihood per target | Total log-likelihood | Term | Description |
|---|---|---|---|
| 0.0 | 0.3 | GO:0005751 | mitochondrial respiratory chain complex IV(GO:0005751) |
| 0.0 | 0.0 | GO:0045025 | mitochondrial degradosome(GO:0045025) |
| 0.0 | 0.1 | GO:0005947 | mitochondrial alpha-ketoglutarate dehydrogenase complex(GO:0005947) |
| 0.0 | 0.1 | GO:0036195 | muscle cell projection(GO:0036194) muscle cell projection membrane(GO:0036195) |
| 0.0 | 0.1 | GO:0000220 | vacuolar proton-transporting V-type ATPase, V0 domain(GO:0000220) |
Gene overrepresentation in molecular function category:
| Log-likelihood per target | Total log-likelihood | Term | Description |
|---|---|---|---|
| 0.0 | 0.2 | GO:0003846 | 2-acylglycerol O-acyltransferase activity(GO:0003846) |
| 0.0 | 0.1 | GO:0005136 | interleukin-4 receptor binding(GO:0005136) |
| 0.0 | 0.0 | GO:0042895 | antibiotic transporter activity(GO:0042895) |
| 0.0 | 0.0 | GO:0070653 | high-density lipoprotein particle receptor binding(GO:0070653) |
| 0.0 | 0.1 | GO:0015321 | sodium-dependent phosphate transmembrane transporter activity(GO:0015321) |
| 0.0 | 0.1 | GO:0035650 | AP-1 adaptor complex binding(GO:0035650) |