Project
GSE49485: Hypoxia transcriptome sequencing of rat brain.
Navigation
Downloads
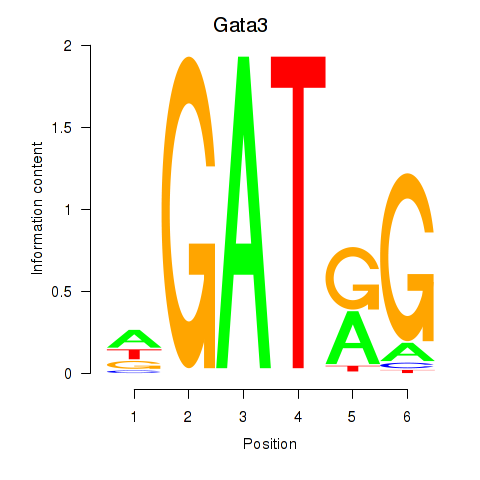
Results for Gata3
Z-value: 0.71
Motif logo
Transcription factors associated with Gata3
| Gene Symbol | Gene ID | Gene Info |
|---|---|---|
|
Gata3
|
ENSRNOG00000019336 | GATA binding protein 3 |
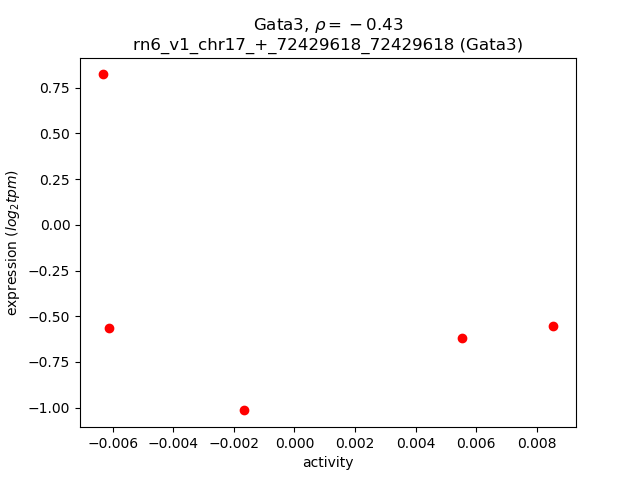
Activity-expression correlation:
| Gene | Promoter | Pearson corr. coef. | P-value | Plot |
|---|---|---|---|---|
| Gata3 | rn6_v1_chr17_+_72429618_72429618 | -0.43 | 4.6e-01 | Click! |
Activity profile of Gata3 motif
Sorted Z-values of Gata3 motif
| Promoter | Log-likelihood | Transcript | Gene | Gene Info |
|---|---|---|---|---|
| chr1_-_170186462 | 0.31 |
ENSRNOT00000035798
|
Olr202
|
olfactory receptor 202 |
| chr7_-_143353925 | 0.27 |
ENSRNOT00000068533
|
Krt71
|
keratin 71 |
| chr5_+_154800226 | 0.24 |
ENSRNOT00000016046
|
Htr1d
|
5-hydroxytryptamine receptor 1D |
| chr7_+_112057030 | 0.24 |
ENSRNOT00000035216
|
AABR07058366.1
|
|
| chr17_+_23661429 | 0.22 |
ENSRNOT00000046523
|
Phactr1
|
phosphatase and actin regulator 1 |
| chr10_-_75187507 | 0.20 |
ENSRNOT00000040681
|
Olr1521
|
olfactory receptor 1521 |
| chr15_+_41937880 | 0.19 |
ENSRNOT00000032514
|
Kcnrg
|
potassium channel regulator |
| chr7_-_2961873 | 0.19 |
ENSRNOT00000067441
|
Rps15-ps2
|
ribosomal protein S15, pseudogene 2 |
| chr2_+_251534535 | 0.17 |
ENSRNOT00000080311
|
AABR07013701.1
|
|
| chr2_-_210943620 | 0.17 |
ENSRNOT00000026750
|
Gpr61
|
G protein-coupled receptor 61 |
| chr6_+_55085313 | 0.17 |
ENSRNOT00000005458
|
AABR07063901.1
|
|
| chrX_-_106607352 | 0.17 |
ENSRNOT00000082858
|
AABR07040624.1
|
|
| chr12_-_19254527 | 0.16 |
ENSRNOT00000089349
|
AABR07035541.3
|
|
| chr3_+_64190973 | 0.16 |
ENSRNOT00000011342
|
AABR07052587.1
|
|
| chr1_+_72889270 | 0.16 |
ENSRNOT00000058843
ENSRNOT00000034957 |
Tnnt1
|
troponin T1, slow skeletal type |
| chr1_+_170205591 | 0.16 |
ENSRNOT00000071063
|
LOC686660
|
similar to olfactory receptor 692 |
| chr18_-_6587080 | 0.15 |
ENSRNOT00000040815
|
LOC103694404
|
60S ribosomal protein L39 |
| chr3_+_134440195 | 0.15 |
ENSRNOT00000072928
|
AABR07054000.1
|
|
| chr2_+_153803349 | 0.15 |
ENSRNOT00000088565
|
Mme
|
membrane metallo-endopeptidase |
| chr13_-_103080920 | 0.15 |
ENSRNOT00000034990
|
AABR07022022.1
|
|
| chr15_-_45927804 | 0.15 |
ENSRNOT00000086271
|
Ints6
|
integrator complex subunit 6 |
| chr1_-_101664436 | 0.14 |
ENSRNOT00000028522
|
Sec1
|
secretory blood group 1 |
| chr3_-_52998650 | 0.14 |
ENSRNOT00000009988
|
RGD1560831
|
similar to 40S ribosomal protein S3 |
| chr1_-_167884690 | 0.14 |
ENSRNOT00000091372
|
Olr61
|
olfactory receptor 61 |
| chr9_-_73948583 | 0.14 |
ENSRNOT00000018097
|
Myl1
|
myosin, light chain 1 |
| chr5_+_58661049 | 0.14 |
ENSRNOT00000078274
|
Unc13b
|
unc-13 homolog B |
| chr2_-_117666683 | 0.13 |
ENSRNOT00000015479
|
AABR07009931.1
|
|
| chr16_+_39827749 | 0.13 |
ENSRNOT00000074885
|
Wdr17
|
WD repeat domain 17 |
| chr10_+_68588789 | 0.12 |
ENSRNOT00000049614
|
AABR07030122.1
|
|
| chr15_-_70399924 | 0.12 |
ENSRNOT00000087940
|
Diaph3
|
diaphanous-related formin 3 |
| chr9_-_92963697 | 0.12 |
ENSRNOT00000023546
|
Gpr55
|
G protein-coupled receptor 55 |
| chr1_-_198008893 | 0.12 |
ENSRNOT00000025950
|
Il27
|
interleukin 27 |
| chr2_-_157058194 | 0.12 |
ENSRNOT00000076409
|
Rn50_2_1765.1
|
|
| chr2_-_208225888 | 0.12 |
ENSRNOT00000054860
|
AABR07012775.1
|
|
| chr2_-_220838905 | 0.12 |
ENSRNOT00000078914
|
AABR07013065.1
|
|
| chr2_-_123851854 | 0.12 |
ENSRNOT00000023327
|
Il2
|
interleukin 2 |
| chr3_-_107760550 | 0.12 |
ENSRNOT00000077091
ENSRNOT00000051638 |
Meis2
|
Meis homeobox 2 |
| chr2_+_189714754 | 0.11 |
ENSRNOT00000086285
|
Gatad2b
|
GATA zinc finger domain containing 2B |
| chr5_-_57896475 | 0.11 |
ENSRNOT00000017903
|
RGD1561916
|
similar to testes development-related NYD-SP22 isoform 1 |
| chr3_-_161299024 | 0.11 |
ENSRNOT00000021216
|
Neurl2
|
neuralized E3 ubiquitin protein ligase 2 |
| chr19_+_38162515 | 0.11 |
ENSRNOT00000027117
|
Slc7a6
|
solute carrier family 7 member 6 |
| chr4_-_132111079 | 0.11 |
ENSRNOT00000013719
|
Eif4e3
|
eukaryotic translation initiation factor 4E family member 3 |
| chr5_+_173148884 | 0.11 |
ENSRNOT00000041753
|
LOC100364191
|
hCG1994130-like |
| chr6_-_91581262 | 0.11 |
ENSRNOT00000034507
|
AABR07064716.1
|
|
| chr12_-_51965779 | 0.11 |
ENSRNOT00000056733
|
LOC100362927
|
replication protein A3-like |
| chr7_-_119896925 | 0.11 |
ENSRNOT00000010609
|
Elfn2
|
extracellular leucine-rich repeat and fibronectin type III domain containing 2 |
| chr9_-_49448168 | 0.11 |
ENSRNOT00000059478
|
AABR07067499.1
|
|
| chr7_-_50638798 | 0.11 |
ENSRNOT00000048880
|
Syt1
|
synaptotagmin 1 |
| chr17_-_21677477 | 0.11 |
ENSRNOT00000035448
|
Gcnt2
|
glucosaminyl (N-acetyl) transferase 2, I-branching enzyme |
| chr1_+_164706276 | 0.11 |
ENSRNOT00000024311
|
Olr36
|
olfactory receptor 36 |
| chr6_-_135251073 | 0.11 |
ENSRNOT00000088986
|
Mok
|
MOK protein kinase |
| chr1_+_80777014 | 0.11 |
ENSRNOT00000079758
|
Gm19345
|
predicted gene, 19345 |
| chr2_-_102919567 | 0.11 |
ENSRNOT00000072162
|
LOC100361143
|
ribosomal protein L30-like |
| chr7_-_107223047 | 0.11 |
ENSRNOT00000007250
ENSRNOT00000084875 |
Lrrc6
|
leucine rich repeat containing 6 |
| chr2_-_195712461 | 0.11 |
ENSRNOT00000056449
|
Riiad1
|
regulatory subunit of type II PKA R-subunit (RIIa) domain containing 1 |
| chr2_-_140618405 | 0.10 |
ENSRNOT00000017736
|
Setd7
|
SET domain containing (lysine methyltransferase) 7 |
| chr16_+_70644474 | 0.10 |
ENSRNOT00000045955
|
LOC100359503
|
ribosomal protein S28-like |
| chr3_+_260653 | 0.10 |
ENSRNOT00000006710
|
AABR07051190.1
|
|
| chr6_+_76349362 | 0.10 |
ENSRNOT00000043224
|
Aldoart2
|
aldolase 1 A retrogene 2 |
| chr2_-_149333597 | 0.10 |
ENSRNOT00000066948
|
P2ry14
|
purinergic receptor P2Y14 |
| chr8_-_70436028 | 0.10 |
ENSRNOT00000077152
|
Slc24a1
|
solute carrier family 24 member 1 |
| chr4_+_172709724 | 0.10 |
ENSRNOT00000010707
|
Igbp1b
|
immunoglobulin (CD79A) binding protein 1b |
| chr5_-_147635789 | 0.10 |
ENSRNOT00000037106
|
Zbtb8b
|
zinc finger and BTB domain containing 8b |
| chr4_-_119591817 | 0.10 |
ENSRNOT00000048768
|
AC097129.1
|
|
| chr4_+_120672152 | 0.10 |
ENSRNOT00000077231
|
Mgll
|
monoglyceride lipase |
| chr16_-_2226121 | 0.10 |
ENSRNOT00000091513
|
Slmap
|
sarcolemma associated protein |
| chr6_+_73358112 | 0.10 |
ENSRNOT00000041373
|
Arhgap5
|
Rho GTPase activating protein 5 |
| chr1_+_66898946 | 0.10 |
ENSRNOT00000074063
|
Zfp551
|
zinc finger protein 551 |
| chr3_-_175479034 | 0.10 |
ENSRNOT00000086761
|
Hrh3
|
histamine receptor H3 |
| chr5_-_83648044 | 0.10 |
ENSRNOT00000046725
|
RGD1561195
|
similar to ribosomal protein L31 |
| chr8_+_82288705 | 0.10 |
ENSRNOT00000012409
|
Bcl2l10
|
BCL2 like 10 |
| chr1_+_192233910 | 0.10 |
ENSRNOT00000016418
ENSRNOT00000016442 |
Prkcb
|
protein kinase C, beta |
| chrX_-_31759161 | 0.10 |
ENSRNOT00000041515
|
Asb9
|
ankyrin repeat and SOCS box-containing 9 |
| chr4_+_102147211 | 0.10 |
ENSRNOT00000083239
|
AABR07060980.1
|
|
| chr12_-_48316722 | 0.10 |
ENSRNOT00000086231
|
Usp30
|
ubiquitin specific peptidase 30 |
| chr8_+_119137728 | 0.10 |
ENSRNOT00000078170
|
Prss50
|
protease, serine, 50 |
| chr3_-_51643140 | 0.09 |
ENSRNOT00000006646
|
Scn3a
|
sodium voltage-gated channel alpha subunit 3 |
| chr19_-_38321528 | 0.09 |
ENSRNOT00000031977
|
Smpd3
|
sphingomyelin phosphodiesterase 3 |
| chr15_-_33656089 | 0.09 |
ENSRNOT00000024186
|
Myh7
|
myosin heavy chain 7 |
| chr6_-_28663233 | 0.09 |
ENSRNOT00000070979
|
Cenpo
|
centromere protein O |
| chr2_+_95077577 | 0.09 |
ENSRNOT00000046368
|
Mrps28
|
mitochondrial ribosomal protein S28 |
| chr16_-_49820235 | 0.09 |
ENSRNOT00000029628
|
Sorbs2
|
sorbin and SH3 domain containing 2 |
| chr5_-_147412705 | 0.09 |
ENSRNOT00000010688
|
RGD1561149
|
similar to mKIAA1522 protein |
| chr4_+_70828894 | 0.09 |
ENSRNOT00000064892
|
Trbc2
|
T cell receptor beta, constant 2 |
| chr3_+_108544931 | 0.09 |
ENSRNOT00000006809
|
Tmco5a
|
transmembrane and coiled-coil domains 5A |
| chr16_-_69280109 | 0.09 |
ENSRNOT00000058595
|
AABR07026240.1
|
|
| chr11_+_84094520 | 0.09 |
ENSRNOT00000046642
|
Rps15al2
|
ribosomal protein S15A-like 2 |
| chr6_+_112203679 | 0.09 |
ENSRNOT00000031205
|
Nrxn3
|
neurexin 3 |
| chr9_-_15628881 | 0.09 |
ENSRNOT00000077318
ENSRNOT00000020950 |
Guca1b
|
guanylate cyclase activator 1B |
| chr10_-_110585376 | 0.09 |
ENSRNOT00000054917
|
Rab40b
|
Rab40b, member RAS oncogene family |
| chr10_-_87541851 | 0.09 |
ENSRNOT00000089610
|
RGD1561684
|
similar to keratin associated protein 2-4 |
| chr15_+_67555835 | 0.09 |
ENSRNOT00000045882
|
Pcdh17
|
protocadherin 17 |
| chr1_-_88989552 | 0.08 |
ENSRNOT00000034001
|
Arhgap33
|
Rho GTPase activating protein 33 |
| chr9_+_94178221 | 0.08 |
ENSRNOT00000033487
|
Alppl2
|
alkaline phosphatase, placental-like 2 |
| chr16_+_22361998 | 0.08 |
ENSRNOT00000016193
|
Slc18a1
|
solute carrier family 18 member A1 |
| chr2_-_79078258 | 0.08 |
ENSRNOT00000031170
|
Fbxl7
|
F-box and leucine-rich repeat protein 7 |
| chr1_+_162320730 | 0.08 |
ENSRNOT00000035743
|
Kctd21
|
potassium channel tetramerization domain containing 21 |
| chr15_+_102164751 | 0.08 |
ENSRNOT00000076400
|
Gpc6
|
glypican 6 |
| chr20_+_2057878 | 0.08 |
ENSRNOT00000051480
|
RT1-M6-1
|
RT1 class I, locus M6, gene 1 |
| chr19_+_55246926 | 0.08 |
ENSRNOT00000017358
|
Il17c
|
interleukin 17C |
| chr10_-_78690857 | 0.08 |
ENSRNOT00000089255
|
LOC303448
|
similar to glyceraldehyde-3-phosphate dehydrogenase |
| chr13_-_82005741 | 0.08 |
ENSRNOT00000076404
|
Mettl11b
|
methyltransferase like 11B |
| chr9_+_49837868 | 0.08 |
ENSRNOT00000021999
|
Gpr45
|
G protein-coupled receptor 45 |
| chr3_+_114918648 | 0.08 |
ENSRNOT00000089204
|
Sqrdl
|
sulfide quinone reductase-like (yeast) |
| chr17_-_21739408 | 0.08 |
ENSRNOT00000060335
|
Gcnt2
|
glucosaminyl (N-acetyl) transferase 2, I-branching enzyme |
| chrM_+_11736 | 0.08 |
ENSRNOT00000048767
|
Mt-nd5
|
mitochondrially encoded NADH dehydrogenase 5 |
| chr6_+_48708368 | 0.08 |
ENSRNOT00000005905
|
Myt1l
|
myelin transcription factor 1-like |
| chr20_+_44060731 | 0.08 |
ENSRNOT00000000737
|
Lama4
|
laminin subunit alpha 4 |
| chr2_-_256154584 | 0.08 |
ENSRNOT00000072487
|
AABR07013776.1
|
|
| chr7_-_73216251 | 0.08 |
ENSRNOT00000057587
|
LOC100362027
|
ribosomal protein L30-like |
| chr8_+_116730641 | 0.08 |
ENSRNOT00000052289
|
Traip
|
TRAF-interacting protein |
| chr16_+_69003868 | 0.08 |
ENSRNOT00000016907
|
Adrb3
|
adrenoceptor beta 3 |
| chr9_-_9675110 | 0.08 |
ENSRNOT00000073294
|
Vav1
|
vav guanine nucleotide exchange factor 1 |
| chr13_+_103396314 | 0.08 |
ENSRNOT00000049499
|
Slc30a10
|
solute carrier family 30, member 10 |
| chr10_+_90550147 | 0.08 |
ENSRNOT00000032944
|
Fzd2
|
frizzled class receptor 2 |
| chr1_-_101360971 | 0.07 |
ENSRNOT00000028164
|
Lin7b
|
lin-7 homolog B, crumbs cell polarity complex component |
| chr2_+_195719543 | 0.07 |
ENSRNOT00000028324
|
Celf3
|
CUGBP, Elav-like family member 3 |
| chr19_-_25062934 | 0.07 |
ENSRNOT00000060117
|
Gm10644
|
predicted gene 10644 |
| chr1_-_151106802 | 0.07 |
ENSRNOT00000021971
|
Tyr
|
tyrosinase |
| chr11_+_83884048 | 0.07 |
ENSRNOT00000002376
|
LOC108348101
|
chloride channel protein 2 |
| chr8_+_39960542 | 0.07 |
ENSRNOT00000013370
|
Msantd2
|
Myb/SANT-like DNA-binding domain containing 2 |
| chrX_+_77885586 | 0.07 |
ENSRNOT00000034329
|
RGD1560821
|
similar to small nuclear ribonucleoparticle-associated protein |
| chr9_-_70787913 | 0.07 |
ENSRNOT00000072007
ENSRNOT00000017901 |
Klf7
Klf7
|
Kruppel like factor 7 Kruppel like factor 7 |
| chr13_+_107580629 | 0.07 |
ENSRNOT00000003557
|
LOC100361993
|
transmembrane protein 14C |
| chr6_-_71349249 | 0.07 |
ENSRNOT00000068077
|
Prkd1
|
protein kinase D1 |
| chr3_-_158328881 | 0.07 |
ENSRNOT00000044466
|
Ptprt
|
protein tyrosine phosphatase, receptor type, T |
| chr13_+_99663150 | 0.07 |
ENSRNOT00000036705
|
Cnih3
|
cornichon family AMPA receptor auxiliary protein 3 |
| chr10_-_88163712 | 0.07 |
ENSRNOT00000005382
ENSRNOT00000084493 |
Krt17
|
keratin 17 |
| chr10_-_102289837 | 0.07 |
ENSRNOT00000044922
|
AABR07030729.1
|
|
| chr13_-_1946508 | 0.07 |
ENSRNOT00000043890
|
Dsel
|
dermatan sulfate epimerase-like |
| chr13_-_82006005 | 0.07 |
ENSRNOT00000039581
|
Mettl11b
|
methyltransferase like 11B |
| chr20_+_3178250 | 0.07 |
ENSRNOT00000082116
|
RT1-S3
|
RT1 class Ib, locus S3 |
| chr11_+_82862695 | 0.07 |
ENSRNOT00000071707
ENSRNOT00000073435 |
Clcn2
|
chloride voltage-gated channel 2 |
| chr10_-_90410569 | 0.07 |
ENSRNOT00000036112
|
Itga2b
|
integrin subunit alpha 2b |
| chr1_-_219388009 | 0.07 |
ENSRNOT00000001550
|
Cabp4
|
calcium binding protein 4 |
| chr6_-_76079283 | 0.07 |
ENSRNOT00000082198
|
Ppp2r3c
|
protein phosphatase 2, regulatory subunit B'', gamma |
| chr7_-_145338152 | 0.07 |
ENSRNOT00000055268
|
Spt1
|
salivary protein 1 |
| chr3_-_16537433 | 0.07 |
ENSRNOT00000048523
|
AABR07051533.2
|
|
| chr13_-_89661150 | 0.07 |
ENSRNOT00000058390
|
Usp21
|
ubiquitin specific peptidase 21 |
| chr20_-_46305157 | 0.07 |
ENSRNOT00000000340
|
Ccdc162
|
coiled-coil domain containing 162 |
| chr2_+_113984646 | 0.07 |
ENSRNOT00000016799
|
Tnik
|
TRAF2 and NCK interacting kinase |
| chr1_+_219250265 | 0.07 |
ENSRNOT00000024353
|
Doc2g
|
double C2-like domains, gamma |
| chr7_+_124680294 | 0.07 |
ENSRNOT00000014720
|
Mpped1
|
metallophosphoesterase domain containing 1 |
| chr18_-_28438654 | 0.07 |
ENSRNOT00000036301
|
Mzb1
|
marginal zone B and B1 cell-specific protein |
| chr18_+_83777665 | 0.07 |
ENSRNOT00000018682
|
Cbln2
|
cerebellin 2 precursor |
| chr13_+_89597138 | 0.07 |
ENSRNOT00000004662
|
Apoa2
|
apolipoprotein A2 |
| chr10_-_63491279 | 0.07 |
ENSRNOT00000082301
|
Tusc5
|
tumor suppressor candidate 5 |
| chr9_+_94425252 | 0.07 |
ENSRNOT00000064965
ENSRNOT00000076099 |
Gigyf2
|
GRB10 interacting GYF protein 2 |
| chr3_+_92403582 | 0.07 |
ENSRNOT00000064282
|
Pamr1
|
peptidase domain containing associated with muscle regeneration 1 |
| chr7_-_84023316 | 0.07 |
ENSRNOT00000005556
|
Kcnv1
|
potassium voltage-gated channel modifier subfamily V member 1 |
| chr2_+_263895241 | 0.06 |
ENSRNOT00000014126
ENSRNOT00000014034 |
Ptger3
|
prostaglandin E receptor 3 |
| chr5_+_27326762 | 0.06 |
ENSRNOT00000066191
|
Runx1t1
|
RUNX1 translocation partner 1 |
| chr5_+_140712583 | 0.06 |
ENSRNOT00000019587
|
Trit1
|
tRNA isopentenyltransferase 1 |
| chr1_+_65851060 | 0.06 |
ENSRNOT00000036880
|
Zscan18
|
zinc finger and SCAN domain containing 18 |
| chr10_+_34383396 | 0.06 |
ENSRNOT00000047186
|
Olr1386
|
olfactory receptor 1386 |
| chr9_+_94279155 | 0.06 |
ENSRNOT00000065805
|
Prss56
|
protease, serine, 56 |
| chr1_-_188097530 | 0.06 |
ENSRNOT00000078825
|
Syt17
|
synaptotagmin 17 |
| chr1_-_165997751 | 0.06 |
ENSRNOT00000050227
|
P2ry6
|
pyrimidinergic receptor P2Y6 |
| chr12_+_24148567 | 0.06 |
ENSRNOT00000077378
ENSRNOT00000045157 |
Ccl24
|
C-C motif chemokine ligand 24 |
| chrX_+_10430847 | 0.06 |
ENSRNOT00000047936
|
Rpl21
|
ribosomal protein L21 |
| chr18_-_68983619 | 0.06 |
ENSRNOT00000014670
|
LOC361346
|
similar to chromosome 18 open reading frame 54 |
| chr13_-_92988137 | 0.06 |
ENSRNOT00000004803
|
Grem2
|
gremlin 2, DAN family BMP antagonist |
| chr5_-_58097577 | 0.06 |
ENSRNOT00000082496
|
Rpp25l
|
ribonuclease P/MRP 25 subunit-like |
| chr17_+_19249952 | 0.06 |
ENSRNOT00000023140
|
Atxn1
|
ataxin 1 |
| chr2_-_147819335 | 0.06 |
ENSRNOT00000057909
|
Ankub1
|
ankyrin repeat and ubiquitin domain containing 1 |
| chr2_+_251200686 | 0.06 |
ENSRNOT00000019210
|
Col24a1
|
collagen type XXIV alpha 1 chain |
| chr4_+_29978739 | 0.06 |
ENSRNOT00000011756
|
Ppp1r9a
|
protein phosphatase 1, regulatory subunit 9A |
| chr8_-_118378460 | 0.06 |
ENSRNOT00000047247
|
RGD1563705
|
similar to ribosomal protein S23 |
| chr3_-_60611924 | 0.06 |
ENSRNOT00000068745
|
Chn1
|
chimerin 1 |
| chr17_+_45467015 | 0.06 |
ENSRNOT00000081408
|
Gpx5
|
glutathione peroxidase 5 |
| chr12_-_6078411 | 0.06 |
ENSRNOT00000001197
|
Rxfp2
|
relaxin/insulin-like family peptide receptor 2 |
| chr7_+_59462456 | 0.06 |
ENSRNOT00000083834
|
AC136025.1
|
|
| chr10_+_34578356 | 0.06 |
ENSRNOT00000047454
|
Olr1389
|
olfactory receptor 1389 |
| chr20_+_27592379 | 0.06 |
ENSRNOT00000047000
|
Trappc3l
|
trafficking protein particle complex 3-like |
| chr11_-_43099412 | 0.06 |
ENSRNOT00000002281
|
Gabrr3
|
gamma-aminobutyric acid type A receptor rho3 subunit |
| chr8_-_69466618 | 0.06 |
ENSRNOT00000042925
|
Ids
|
iduronate 2-sulfatase |
| chr10_+_38788992 | 0.06 |
ENSRNOT00000009727
|
Gdf9
|
growth differentiation factor 9 |
| chr14_-_84355528 | 0.06 |
ENSRNOT00000006542
|
Sec14l2
|
SEC14-like lipid binding 2 |
| chr9_-_13877130 | 0.06 |
ENSRNOT00000015705
|
Lrfn2
|
leucine rich repeat and fibronectin type III domain containing 2 |
| chr17_+_49417067 | 0.06 |
ENSRNOT00000090024
|
Pou6f2
|
POU domain, class 6, transcription factor 2 |
| chr15_+_48674380 | 0.06 |
ENSRNOT00000018762
|
Fbxo16
|
F-box protein 16 |
| chr11_+_70967223 | 0.06 |
ENSRNOT00000087633
|
Iqcg
|
IQ motif containing G |
| chr1_-_197858016 | 0.06 |
ENSRNOT00000074778
|
Atp2a1
|
ATPase sarcoplasmic/endoplasmic reticulum Ca2+ transporting 1 |
| chr13_-_42263024 | 0.06 |
ENSRNOT00000004741
|
Lypd1
|
Ly6/Plaur domain containing 1 |
| chr7_-_35550247 | 0.06 |
ENSRNOT00000049211
|
Rpl31l3
|
ribosomal protein L31-like 3 |
| chr3_+_132052612 | 0.06 |
ENSRNOT00000030148
|
AABR07053879.1
|
|
| chr16_-_32868680 | 0.06 |
ENSRNOT00000015974
ENSRNOT00000082392 |
Aadat
|
aminoadipate aminotransferase |
| chr10_-_38969501 | 0.06 |
ENSRNOT00000090691
ENSRNOT00000081309 ENSRNOT00000010029 |
Il4
|
interleukin 4 |
| chr19_+_60017746 | 0.06 |
ENSRNOT00000042623
|
Pard3
|
par-3 family cell polarity regulator |
| chr6_-_115513354 | 0.06 |
ENSRNOT00000005881
|
Ston2
|
stonin 2 |
| chr16_+_26739389 | 0.06 |
ENSRNOT00000047223
|
Klhl2
|
kelch-like family member 2 |
| chr11_-_67618704 | 0.06 |
ENSRNOT00000042208
|
Ccdc58
|
coiled-coil domain containing 58 |
| chr1_-_52894832 | 0.06 |
ENSRNOT00000016471
|
T
|
T brachyury transcription factor |
| chr18_-_31430973 | 0.06 |
ENSRNOT00000026065
|
Pcdh12
|
protocadherin 12 |
| chr18_+_59830363 | 0.06 |
ENSRNOT00000082650
ENSRNOT00000078378 |
Onecut2
|
one cut domain, family member 2 |
| chr2_+_188844073 | 0.06 |
ENSRNOT00000028117
|
Kcnn3
|
potassium calcium-activated channel subfamily N member 3 |
| chr8_-_43480777 | 0.06 |
ENSRNOT00000060074
|
LOC688473
|
similar to 40S ribosomal protein S2 |
| chr5_-_77173502 | 0.06 |
ENSRNOT00000023588
|
Slc46a2
|
solute carrier family 46, member 2 |
| chr7_+_71004417 | 0.06 |
ENSRNOT00000005575
|
Myo1a
|
myosin IA |
| chr13_-_86671515 | 0.06 |
ENSRNOT00000082869
|
AABR07021704.1
|
|
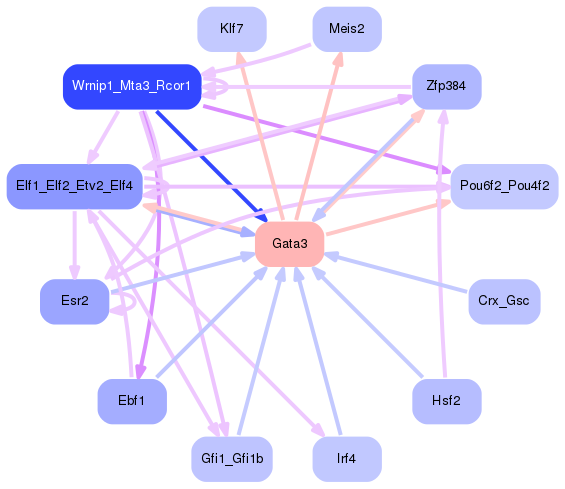
Network of associatons between targets according to the STRING database.

First level regulatory network of Gata3
Gene Ontology Analysis
Gene overrepresentation in biological process category:
| Log-likelihood per target | Total log-likelihood | Term | Description |
|---|---|---|---|
| 0.1 | 0.3 | GO:0031444 | slow-twitch skeletal muscle fiber contraction(GO:0031444) |
| 0.1 | 0.2 | GO:0006480 | N-terminal protein amino acid methylation(GO:0006480) |
| 0.0 | 0.3 | GO:0014827 | intestine smooth muscle contraction(GO:0014827) |
| 0.0 | 0.1 | GO:0071492 | cellular response to UV-A(GO:0071492) |
| 0.0 | 0.1 | GO:0032639 | antigen processing and presentation of endogenous peptide antigen via MHC class Ib via ER pathway(GO:0002488) antigen processing and presentation of endogenous peptide antigen via MHC class Ib via ER pathway, TAP-dependent(GO:0002489) TRAIL production(GO:0032639) regulation of TRAIL production(GO:0032679) positive regulation of TRAIL production(GO:0032759) |
| 0.0 | 0.1 | GO:0046340 | diacylglycerol catabolic process(GO:0046340) |
| 0.0 | 0.1 | GO:0035408 | histone H3-T6 phosphorylation(GO:0035408) |
| 0.0 | 0.2 | GO:0036438 | maintenance of lens transparency(GO:0036438) |
| 0.0 | 0.1 | GO:0046013 | regulation of T cell homeostatic proliferation(GO:0046013) |
| 0.0 | 0.2 | GO:0010808 | positive regulation of synaptic vesicle priming(GO:0010808) |
| 0.0 | 0.1 | GO:0071579 | regulation of zinc ion transport(GO:0071579) |
| 0.0 | 0.1 | GO:0002025 | vasodilation by norepinephrine-epinephrine involved in regulation of systemic arterial blood pressure(GO:0002025) |
| 0.0 | 0.1 | GO:0007199 | G-protein coupled receptor signaling pathway coupled to cGMP nucleotide second messenger(GO:0007199) |
| 0.0 | 0.1 | GO:2000124 | regulation of endocannabinoid signaling pathway(GO:2000124) |
| 0.0 | 0.1 | GO:0044313 | protein K6-linked deubiquitination(GO:0044313) |
| 0.0 | 0.1 | GO:0038171 | cannabinoid signaling pathway(GO:0038171) |
| 0.0 | 0.1 | GO:2000418 | positive regulation of eosinophil migration(GO:2000418) |
| 0.0 | 0.2 | GO:0060287 | epithelial cilium movement involved in determination of left/right asymmetry(GO:0060287) |
| 0.0 | 0.1 | GO:1905150 | regulation of voltage-gated sodium channel activity(GO:1905150) |
| 0.0 | 0.1 | GO:1904170 | regulation of bleb assembly(GO:1904170) |
| 0.0 | 0.1 | GO:0014724 | regulation of twitch skeletal muscle contraction(GO:0014724) regulation of fast-twitch skeletal muscle fiber contraction(GO:0031446) positive regulation of fast-twitch skeletal muscle fiber contraction(GO:0031448) positive regulation of endoplasmic reticulum calcium ion concentration(GO:0032470) |
| 0.0 | 0.1 | GO:0008594 | photoreceptor cell morphogenesis(GO:0008594) |
| 0.0 | 0.1 | GO:0033512 | L-lysine catabolic process to acetyl-CoA via saccharopine(GO:0033512) |
| 0.0 | 0.1 | GO:0089700 | protein kinase D signaling(GO:0089700) |
| 0.0 | 0.1 | GO:0070934 | CRD-mediated mRNA stabilization(GO:0070934) |
| 0.0 | 0.1 | GO:0097498 | endothelial tube lumen extension(GO:0097498) |
| 0.0 | 0.1 | GO:0051612 | negative regulation of neurotransmitter uptake(GO:0051581) regulation of serotonin uptake(GO:0051611) negative regulation of serotonin uptake(GO:0051612) |
| 0.0 | 0.1 | GO:0002378 | immunoglobulin biosynthetic process(GO:0002378) negative regulation of glucose import in response to insulin stimulus(GO:2001274) |
| 0.0 | 0.1 | GO:0002554 | serotonin secretion by platelet(GO:0002554) |
| 0.0 | 0.1 | GO:0014053 | negative regulation of gamma-aminobutyric acid secretion(GO:0014053) |
| 0.0 | 0.1 | GO:0018992 | germ-line sex determination(GO:0018992) |
| 0.0 | 0.2 | GO:1902260 | negative regulation of delayed rectifier potassium channel activity(GO:1902260) negative regulation of voltage-gated potassium channel activity(GO:1903817) |
| 0.0 | 0.0 | GO:0010986 | regulation of high-density lipoprotein particle clearance(GO:0010982) positive regulation of lipoprotein particle clearance(GO:0010986) |
| 0.0 | 0.1 | GO:0090154 | positive regulation of sphingolipid biosynthetic process(GO:0090154) positive regulation of ceramide biosynthetic process(GO:2000304) |
| 0.0 | 0.0 | GO:0018242 | protein O-linked glycosylation via serine(GO:0018242) |
| 0.0 | 0.1 | GO:2000870 | regulation of progesterone secretion(GO:2000870) |
| 0.0 | 0.0 | GO:0014846 | esophagus smooth muscle contraction(GO:0014846) |
| 0.0 | 0.1 | GO:0030205 | dermatan sulfate metabolic process(GO:0030205) |
| 0.0 | 0.1 | GO:0003257 | positive regulation of transcription from RNA polymerase II promoter involved in myocardial precursor cell differentiation(GO:0003257) notochord formation(GO:0014028) |
| 0.0 | 0.0 | GO:0036166 | phenotypic switching(GO:0036166) |
| 0.0 | 0.1 | GO:0060689 | cell differentiation involved in salivary gland development(GO:0060689) |
| 0.0 | 0.0 | GO:2000587 | negative regulation of platelet-derived growth factor receptor-beta signaling pathway(GO:2000587) |
| 0.0 | 0.2 | GO:0035589 | G-protein coupled purinergic nucleotide receptor signaling pathway(GO:0035589) |
| 0.0 | 0.0 | GO:1900368 | regulation of RNA interference(GO:1900368) |
| 0.0 | 0.0 | GO:0071288 | cellular response to mercury ion(GO:0071288) |
| 0.0 | 0.1 | GO:0007256 | activation of JNKK activity(GO:0007256) |
| 0.0 | 0.0 | GO:0038110 | interleukin-2-mediated signaling pathway(GO:0038110) |
| 0.0 | 0.0 | GO:0034971 | histone H3-R17 methylation(GO:0034971) |
| 0.0 | 0.1 | GO:0070560 | protein secretion by platelet(GO:0070560) |
| 0.0 | 0.1 | GO:0002759 | regulation of antimicrobial humoral response(GO:0002759) |
| 0.0 | 0.1 | GO:1903361 | protein localization to basolateral plasma membrane(GO:1903361) |
| 0.0 | 0.0 | GO:0052047 | interaction with other organism via secreted substance involved in symbiotic interaction(GO:0052047) |
| 0.0 | 0.0 | GO:0048023 | positive regulation of melanin biosynthetic process(GO:0048023) positive regulation of secondary metabolite biosynthetic process(GO:1900378) |
| 0.0 | 0.0 | GO:0050893 | sensory processing(GO:0050893) |
| 0.0 | 0.0 | GO:1900222 | negative regulation of beta-amyloid clearance(GO:1900222) |
| 0.0 | 0.1 | GO:0035581 | sequestering of extracellular ligand from receptor(GO:0035581) |
| 0.0 | 0.1 | GO:0045625 | regulation of T-helper 1 cell differentiation(GO:0045625) |
| 0.0 | 0.0 | GO:0046379 | extracellular polysaccharide biosynthetic process(GO:0045226) extracellular polysaccharide metabolic process(GO:0046379) |
| 0.0 | 0.0 | GO:0071283 | response to high light intensity(GO:0009644) cellular response to iron(III) ion(GO:0071283) |
| 0.0 | 0.1 | GO:0016259 | selenocysteine metabolic process(GO:0016259) |
| 0.0 | 0.0 | GO:0030242 | pexophagy(GO:0030242) |
| 0.0 | 0.0 | GO:0002188 | translation reinitiation(GO:0002188) |
| 0.0 | 0.0 | GO:1902683 | regulation of receptor localization to synapse(GO:1902683) |
| 0.0 | 0.1 | GO:0018026 | peptidyl-lysine monomethylation(GO:0018026) |
| 0.0 | 0.0 | GO:0003330 | regulation of extracellular matrix constituent secretion(GO:0003330) positive regulation of extracellular matrix constituent secretion(GO:0003331) |
| 0.0 | 0.1 | GO:0036065 | fucosylation(GO:0036065) |
| 0.0 | 0.1 | GO:0098814 | spontaneous neurotransmitter secretion(GO:0061669) spontaneous synaptic transmission(GO:0098814) |
Gene overrepresentation in cellular component category:
| Log-likelihood per target | Total log-likelihood | Term | Description |
|---|---|---|---|
| 0.0 | 0.1 | GO:0032398 | MHC class Ib protein complex(GO:0032398) |
| 0.0 | 0.1 | GO:1990769 | proximal neuron projection(GO:1990769) |
| 0.0 | 0.1 | GO:0042584 | chromaffin granule membrane(GO:0042584) |
| 0.0 | 0.1 | GO:0070937 | CRD-mediated mRNA stability complex(GO:0070937) |
| 0.0 | 0.1 | GO:0031095 | platelet dense tubular network membrane(GO:0031095) |
| 0.0 | 0.2 | GO:0032009 | early phagosome(GO:0032009) |
| 0.0 | 0.1 | GO:0000137 | Golgi cis cisterna(GO:0000137) |
| 0.0 | 0.1 | GO:0002177 | manchette(GO:0002177) |
| 0.0 | 0.1 | GO:0005861 | troponin complex(GO:0005861) |
| 0.0 | 0.1 | GO:0044326 | dendritic spine neck(GO:0044326) |
| 0.0 | 0.0 | GO:0005592 | collagen type XI trimer(GO:0005592) |
| 0.0 | 0.5 | GO:0045095 | keratin filament(GO:0045095) |
| 0.0 | 0.0 | GO:0072487 | MSL complex(GO:0072487) |
Gene overrepresentation in molecular function category:
| Log-likelihood per target | Total log-likelihood | Term | Description |
|---|---|---|---|
| 0.1 | 0.2 | GO:0071885 | N-terminal protein N-methyltransferase activity(GO:0071885) |
| 0.0 | 0.1 | GO:0008107 | galactoside 2-alpha-L-fucosyltransferase activity(GO:0008107) alpha-(1,2)-fucosyltransferase activity(GO:0031127) |
| 0.0 | 0.2 | GO:0008109 | N-acetyllactosaminide beta-1,6-N-acetylglucosaminyltransferase activity(GO:0008109) |
| 0.0 | 0.1 | GO:0035403 | histone kinase activity (H3-T6 specific)(GO:0035403) |
| 0.0 | 0.1 | GO:0004949 | cannabinoid receptor activity(GO:0004949) |
| 0.0 | 0.1 | GO:0015222 | serotonin transmembrane transporter activity(GO:0015222) |
| 0.0 | 0.1 | GO:0004939 | beta-adrenergic receptor activity(GO:0004939) |
| 0.0 | 0.1 | GO:0004969 | histamine receptor activity(GO:0004969) |
| 0.0 | 0.1 | GO:0047757 | chondroitin-glucuronate 5-epimerase activity(GO:0047757) |
| 0.0 | 0.2 | GO:0031014 | troponin T binding(GO:0031014) |
| 0.0 | 0.1 | GO:0070653 | high-density lipoprotein particle receptor binding(GO:0070653) |
| 0.0 | 0.1 | GO:0030348 | syntaxin-3 binding(GO:0030348) |
| 0.0 | 0.1 | GO:0015065 | uridine nucleotide receptor activity(GO:0015065) G-protein coupled pyrimidinergic nucleotide receptor activity(GO:0071553) |
| 0.0 | 0.1 | GO:0001565 | phorbol ester receptor activity(GO:0001565) |
| 0.0 | 0.1 | GO:0089720 | caspase binding(GO:0089720) |
| 0.0 | 0.1 | GO:0016716 | oxidoreductase activity, acting on paired donors, with incorporation or reduction of molecular oxygen, another compound as one donor, and incorporation of one atom of oxygen(GO:0016716) |
| 0.0 | 0.1 | GO:0019767 | IgE receptor activity(GO:0019767) |
| 0.0 | 0.1 | GO:0070051 | fibrinogen binding(GO:0070051) |
| 0.0 | 0.1 | GO:0030881 | beta-2-microglobulin binding(GO:0030881) |
| 0.0 | 0.0 | GO:0030158 | protein xylosyltransferase activity(GO:0030158) |
| 0.0 | 0.1 | GO:0019784 | NEDD8-specific protease activity(GO:0019784) |
| 0.0 | 0.1 | GO:0004035 | alkaline phosphatase activity(GO:0004035) |
| 0.0 | 0.3 | GO:0004993 | G-protein coupled serotonin receptor activity(GO:0004993) serotonin receptor activity(GO:0099589) |
| 0.0 | 0.1 | GO:0008273 | calcium, potassium:sodium antiporter activity(GO:0008273) |
| 0.0 | 0.1 | GO:0010853 | cyclase activator activity(GO:0010853) guanylate cyclase activator activity(GO:0030250) |
| 0.0 | 0.0 | GO:0015292 | uniporter activity(GO:0015292) |
| 0.0 | 0.1 | GO:0016212 | kynurenine-oxoglutarate transaminase activity(GO:0016212) kynurenine aminotransferase activity(GO:0036137) |
| 0.0 | 0.1 | GO:0005136 | interleukin-4 receptor binding(GO:0005136) |
| 0.0 | 0.1 | GO:0030160 | GKAP/Homer scaffold activity(GO:0030160) |
| 0.0 | 0.0 | GO:0004852 | uroporphyrinogen-III synthase activity(GO:0004852) |
| 0.0 | 0.1 | GO:0004767 | sphingomyelin phosphodiesterase activity(GO:0004767) |
| 0.0 | 0.0 | GO:0004911 | interleukin-2 receptor activity(GO:0004911) |
| 0.0 | 0.1 | GO:0043208 | glycosphingolipid binding(GO:0043208) |
| 0.0 | 0.1 | GO:0004619 | bisphosphoglycerate mutase activity(GO:0004082) phosphoglycerate mutase activity(GO:0004619) 2,3-bisphosphoglycerate-dependent phosphoglycerate mutase activity(GO:0046538) |
| 0.0 | 0.0 | GO:0001642 | group III metabotropic glutamate receptor activity(GO:0001642) |
| 0.0 | 0.0 | GO:0003945 | N-acetyllactosamine synthase activity(GO:0003945) |
| 0.0 | 0.1 | GO:0042289 | MHC class II protein binding(GO:0042289) |
| 0.0 | 0.1 | GO:0034046 | poly(G) binding(GO:0034046) |
| 0.0 | 0.1 | GO:0001608 | G-protein coupled nucleotide receptor activity(GO:0001608) G-protein coupled purinergic nucleotide receptor activity(GO:0045028) |
| 0.0 | 0.0 | GO:0008449 | N-acetylglucosamine-6-sulfatase activity(GO:0008449) |
| 0.0 | 0.1 | GO:0004931 | extracellular ATP-gated cation channel activity(GO:0004931) ATP-gated ion channel activity(GO:0035381) |
| 0.0 | 0.0 | GO:0001011 | transcription factor activity, sequence-specific DNA binding, RNA polymerase recruiting(GO:0001011) transcription factor activity, TFIIB-class binding(GO:0001087) |
| 0.0 | 0.0 | GO:0003726 | double-stranded RNA adenosine deaminase activity(GO:0003726) |
| 0.0 | 0.2 | GO:0005247 | voltage-gated chloride channel activity(GO:0005247) |
| 0.0 | 0.3 | GO:0008157 | protein phosphatase 1 binding(GO:0008157) |
Gene overrepresentation in curated gene sets: REACTOME pathways category:
| Log-likelihood per target | Total log-likelihood | Term | Description |
|---|---|---|---|
| 0.0 | 0.2 | REACTOME SEROTONIN RECEPTORS | Genes involved in Serotonin receptors |
| 0.0 | 0.2 | REACTOME P2Y RECEPTORS | Genes involved in P2Y receptors |
| 0.0 | 0.2 | REACTOME GLUTAMATE NEUROTRANSMITTER RELEASE CYCLE | Genes involved in Glutamate Neurotransmitter Release Cycle |
| 0.0 | 0.1 | REACTOME CS DS DEGRADATION | Genes involved in CS/DS degradation |